methane and water phase equilibria in the presence of
TRANSCRIPT

Methane and Water Phase Equilibria in the Presenceof Single and Mixed Electrolyte Solutions
Using the Cubic-Plus-Association Equation of StateH. Haghighi, A. Chapoy and B. Tohidi
Centre for Gas Hydrate Research, Institute of Petroleum Engineering, Heriot-Watt University, Edinburgh EH14 4AS, Scotland - UKe-mail: [email protected] - [email protected] - [email protected]
Résumé — Application de l’équation d’état Cubic-Plus-Association pour la prédiction deséquilibres entre phases pour les systèmes contenant du méthane et de l’eau en présenced’électrolyte(s) — Les hydrates de méthane ont été largement présentés comme une potentielle nouvellesource d’énergie. Les hydrates à l’état naturel peuvent se former dans diverses roches ou sédiments si lesconditions appropriées de pression et température en présence d’eau et de méthane sont réunies.Toutefois, la salinité des eaux de formation peut connaître d’importantes variations, et ces changementsmodifient la zone de stabilité des hydrates. En outre, l’eau de gisement produite avec les fluides deréservoir peut contenir diverses quantités de sels, pouvant prévenir la formation d’hydrates. Parconséquent, il est essentiel d’obtenir une meilleure compréhension de l’effet des sels sur la stabilité deshydrates. Dans cette communication, de nouvelles données expérimentales de dissociation d’hydrates deméthane en présence de solutions aqueuses contenant différentes concentrations de NaCl, KCl et deMgCl2 ont été réalisées. Les nouvelles données ont été mesurées en utilisant une méthode à volumeconstant. La précision et la fiabilité des mesures expérimentales ont été démontrées en comparant lesmesures avec les données de la littérature. Une approche thermodynamique dans lequel l’équation d’étatCPA est combinée avec une modification du terme électrostatique proposé par Debye-Hückel a étéemployée pour modéliser les équilibres entre phases. Les conditions de formation d’hydrates sontmodélisées par la théorie développée par van der Waals et Platteeuw. Pour modéliser en milieux poreuxles équilibres entre phases d’hydrate, l’effet de la pression capillaire a été pris en compte. Les prédictionsdu modèle développé ont été validées par rapport à des données expérimentales indépendantes et lesdonnées obtenues dans ce travail. Un bon accord entre les prédictions et les données expérimentales a étéobservé, confirmant la fiabilité du modèle développé.
Abstract — Methane and Water Phase Equilibria in the Presence of Single and Mixed ElectrolyteSolutions Using the Cubic-Plus-Association Equation of State — Methane gas hydrates have beenwidely touted as a potential new source of energy. Methane hydrate has been found to form in variousrocks or sediments given suitable pressures, temperatures, and supplies of water and methane. However,natural subsurface environments exhibit significant variations in formation water chemistry, and thesechanges create local shifts in the phase boundary. Furthermore, formation water produced withreservoir fluids contains various quantities of salts, which inhibit hydrate formation. Therefore, it isessential to gain a better understanding of the effect of aqueous electrolyte solutions on gas hydratestability conditions. In this communication, we report new experimental dissociation data for methanesimple hydrates in presence of aqueous solutions containing different concentrations of NaCl, KCl and
Oil & Gas Science and Technology – Rev. IFP, Vol. 64 (2009), No. 2, pp. 141-154Copyright © 2008, Institut français du pétroleDOI: 10.2516/ogst:2008043

Oil & Gas Science and Technology – Rev. IFP, Vol. 64 (2009), No. 2
INTRODUCTION
Clathrate hydrates pertain to the class of clathrates formedthrough combination of water and suitably sized “guest”molecules under low temperature and elevated pressure con-ditions. Within the clathrate lattice, water molecules form anetwork of hydrogen-bonded cage-like structures thatenclose the “guest” molecules – the latter comprising of sin-gle or mixed low-molecular diameter gases (e.g. methane)and organic compounds (Sloan, 1998). The stability of theclathrate hydrates, which have an ice-like appearance, is sosubstantial that they can exist at temperatures appreciablyhigher than triple point of H2O (T0 = 273.16 K).
It is well recognized that very large quantities of methanehydrates occur naturally in sediments and therefore globalinterest in gas hydrates has grown steadily. However, theknowledge of the occurrence of in-situ gas hydrate is veryincomplete, and is obtained from both indirect and direct evi-dence, methane hydrate deposits worldwide in permafrostregions and subsea sediments off continental margins is esti-mated to be two orders of magnitude greater than recoverableconventional gas resources (Sloan, 1998). Important issuesdriving research include the potential for methane hydrates asa strategic energy resource, increasing awareness of the rela-tionship between hydrates and seafloor slope stability, thepotential hazard hydrates pose to deepwater drilling installa-tions, pipelines and subsea cables, and long-term considera-tions with respect to hydrate stability, methane (a potentgreenhouse gas) release, and global climate change.
As one step towards a better understanding of theoccurrence of gas hydrate in nature, the effects of salts andcapillary pressure in porous media on phase equilibria as wellas the boundary of hydrate formation must be known.Accurate knowledge of the thermodynamic stability ofhydrates as a function of concentrations of salt is also crucialto the success of any flow assurance strategy. Thus, there hasbeen a strong interest in developing either predictive thermo-dynamic models or correlations capable of predicting hydratephase boundaries in systems containing single and mixedelectrolytes.
In this work, the locus of the incipient hydrate-liquidwater-vapor (H–LW–V) curve for ternary systems of methane
and water with salts such as sodium chloride, magnesiumchloride and potassium chloride in a wide range of concen-trations and pressures are reported. These data in addition tothe most reliable data from literature have been used to vali-date the predictive capabilities of a thermodynamic model.
A thermodynamic model based on the equality of fugacitiesof each component throughout all phases is employed tomodel the phase equilibria. For systems containing a compo-nent, which can form hydrogen bond (e.g., water), the Cubic-Plus-Association Equation of State (CPA-EoS) has beenemployed. The Binary Interaction Parameters (BIPs) betweenmethane and water have been tuned using reliable gas solu-bility data and quadratic temperature dependent BIPs havebeen established. The CPA-EoS has been extended to predictfluid phase equilibria in the presence of single or mixed elec-trolyte solutions over a wide range of operational conditions.The hydrate-forming conditions are modeled by the solidsolution theory of van der Waals and Platteeuw. Langmuirconstants have been calculated using the Kihara potentialmodel. The performance of the model has been tested bycomparing the predictions with the data generated in this lab-oratory as well as the most reliable data from the open litera-ture for hydrate stability zone (in bulk and porous media).
1 REVIEW OF EXPERIMENTAL DATA
1.1 Methane Solubility in Water and ElectrolyteSolutions
The solubility of methane in pure water and aqueouselectrolyte solutions has been measured over a wide pressureand temperature range by many researchers. The measure-ments of CH4 solubility in water and water content in gasphase are extensive. The sources of the experimental data forbinary mixture of methane and water are given in Table 1.
Experimental methane solubility data in aqueous electrolytesolutions are not as extensive as water and solubility data inaqueous solutions with salts other than NaCl are rather lim-ited. Table 2 shows the references for the reported measure-ments of CH4 solubility in saline water in the open literature.
142
MgCl2. The new data were generated by a reliable fixed-volume, isochoric, step-heating technique. Theaccuracy and reliability of the experimental measurements are demonstrated by comparingmeasurements with the literature data. A thermodynamic approach in which the Cubic-Plus-AssociationEquation of State is combined with a modified Debye Hückel electrostatic term is employed to model thephase equilibria. The hydrate-forming conditions are modeled by the solid solution theory of van derWaals and Platteeuw. To model hydrate phase equilibria in porous media, the effect of capillary pressurehas been taken into account. Predictions of the developed model are validated against independentexperimental data and the data generated in this work. A good agreement between predictions andexperimental data is observed, supporting the reliability of the developed model.

H Haghighi et al. / Methane and Water Phase Equilibria in the Presence of Single and MixedElectrolyte Solutions Using the Cubic-Plus-Association Equation of State
143
References T (K) P (MPa)
Frolich et al. (1931) 298.15 3-12
Michels et al. (1936) 298.15-423.15 4.06-46.91
Culberson et al. (1950) 298.15 3.62-66.74
Culberson and Mc Ketta (1951) 298.15-444.26 2.23-68.91
Morrison and Billet (1952) 285.05-348.35 0.1 (atm)
Davis and McKetta (1960) 310.93-394.26 0.35-3.84
Duffy et al. (1961) 298.15-303.15 0.32-5.17
McAuliffe (1963) 298.15 0.1 (atm)
Pierotti (1965) 298.15 0.1 (atm)
Hilderbrabd (1968) 298.15 0.1 (atm)
O’Sullivan and Smith (1970) 324.65-398.15 10.13-61.61
Sultanov et al. (1971) 423.15-633.15 4.90-107.87
Amirijafari and Campbell (1972) 310.93-344.26 4.13-34.46
Maharajh and Walkley (1973) 298.15 0.1 (atm)
Tokunaga and Kawai (1975) 293.15 0.1 (atm)
Sanchez and De Meer (1978) 423.15-573.15 10-250
TABLE 1
Solubility data for methane in pure water binary systems
References T (K) P (MPa)
Price (1979) 427.15-627.15 3.54-197.20
Stoessel and Byrne (1982) 298.15 2.41-5.17
Crovetto et al. (1982) 297.5-518. 3 1.9-6.4
Cramer (1984) 277.15-573.15 3-13.2
Yarym-Agaev et al. (1985) 313.15-338.15 2.5-12.5
Yokoyama et al. (1988) 298.15-323.15 3-8
Abdulgatov et al. (1993) 523.15-653.15 2-64
Wang et al. (1995) 283.15-298.15 1.15-5.18
Reichl (1996) 283.1 6-343.16 0.18-0.26
Lekvam and Bishnoi (1997) 274.19-285.68 0.57-9.08
Song et al. (1997) 273.15-288.15 3.45
Yang et al. (2001) 298.1-298.2 2.33-12.68
Servio and Englezos (2002) 278.65-284.35 3.5-6.5
Kim et al. (2003) 298.15 2.3-16.6
Wang et al. (2003) 283.2-303.2 2-40.03
Chapoy et al. (2004) 275.11-313.11 0.97-18.0
TABLE 2
Methane solubility in various aqueous electrolyte solutions
References Solutions T (K) P (MPa)
Michels et al. (1936) 5.52-27.8 mass% NaCl 298.15-423.15 4.18-45.61
24.41-2.54 mass% CaCl2 298.15 5.62-21.0
Eucken and Hertzberg (1950) 0-14 mass% NaCl 273.15-293.15 0.1 (atm)
Duffy et al. (1961) 2.84-26.3 mass% NaCl 303.15 21.48-95.75
0-45 mass% CaCl2 298.15-303.15 0.32-7.48
NaCl + CaCl2 303.15 0.32-5.19
Mishnina et al. (1962) 0-26.7 mass% NaCl 277.15-363.15 0.1 (atm)
O’Sullivan and Smith (1970) 5.57-20.5 mass% NaCl 324.65-398.15 10.13-61.61
Ben-Naim and Yaacobi (1974) 0-11 mass% NaCl 283.15-303.15 0.1 (atm)
Yano et al. (1974) 0-8.31 mass% NaCl 298.15 0.1 (atm)
Blanco and Smith (1978) 10 mass% CaCl2 298.2-398.2 10.1-60.8
Namiot et al. (1979) 0-8.3 mass% NaCl 323-623 29.5
Blount and Price (1982) 0-25.6 mass% NaCl 372.15-513.15 7.5-157
Stoessell and Byrne (1982) 0-19 mass% NaCl 298.15 2.41-5.17
0-30.75 mass% KCl 298.15 2.41-5.17
0-17 mass% MgCl2 298.15 2.41-5.17
0-18.17 mass% CaCl2 298.15 2.41-5.17
Cramer (1984) 4.52-21.55 mass% NaCl 273.7-574.3 1.9-12.4
Krader and Franck (1987) 0-10.5 mass% NaCl 638-799 40-263
Kiepe et al. (2003) 7-23 mass% KCl 313.51-373.19 0.42-9.79

Oil & Gas Science and Technology – Rev. IFP, Vol. 64 (2009), No. 2
1.2 Phase Equilibria for Methane Hydrates in the Presence of Electrolyte Solutions
Most of the experimental works have been focused onhydrate dissociation pressures or temperatures in pure watersystem. Experimental studies on hydrate dissociation for sys-tems containing salts have been less investigated; only a fewauthors have presented experimental results for hydrate inhi-bition. The presence of a salt moves the conditions requiredfor gas hydrate formation to lower temperatures and (or)higher pressures. Tables 3 and 4 list some of the availableexperimental data sets for methane hydrate dissociation con-dition in the presence of NaCl, CaCl2, MgCl2 and differentmixtures of NaCl and KCl, respectively.
2 NEW EXPERIMENTAL DATA FOR METHANEHYDRATES IN PRESENCE OF ELECTROLYTESOLUTIONS
2.1 Materials
Aqueous solutions of different salts used in this work wereprepared gravimetrically in this laboratory. All the salts usedwere of analytical reagent grade and with reported purities of
> 99% for anhydrous NaCl (Aldrich) and KCl (Aldrich).Hexahydrate MgCl2 (Aldrich) with reported purities of> 98% was also used without further purification. Solutionswere prepared using deionized water throughout the experi-mental work.
2.2 Apparatus and Experimental Procedures
Figure 1 shows the apparatus used to determine the phaseequilibrium conditions. The phase equilibrium is achieved ina cylindrical cell made of stainless steel. The cell volume isabout 500 mL and it can be operated up to 40 MPa between243 K and 323 K. The equilibrium cell is held in a metallicjacket heated or cooled by a constant temperature liquid bath.The temperature of the cell is controlled by circulatingcoolant from a cryostat within the jacket surrounding the cell.The cryostat is capable of maintaining the cell temperature towithin 0.1 K. To achieve good temperature stability, thejacket is insulated with polystyrene board and the pipes(which connect it to the cryostat) are covered with plasticfoam. A platinum resistance probe monitors the temperatureand is connected directly to a computer for direct acquisition.The pressure is measured by means of a strain gauge pressure
144
TABLE 3
Methane hydrate dissociation data in presence of aqueous NaCl, MgCl2 and CaCl2 electrolyte solutions
Salt References WS (mass%) T (K) P (MPa)
NaCl Kobayashi et al. (1951) 10 and 20 265.9-284.3 2.59-13.66
De Roo et al. (1983) 11.7, 17.1, 21.5 and 24.1 261.85-278.05 2.39-11
Maekawa et al. (1995) 3.5, 10 and 20 268.6-288.9 3-18.2
Maekawa and Imai (1999) 10 and 20 262.5-283 3.01-12.26
Jager and Sloan (2001) 6.2, 10.8, 17.1 and 22 270.66-299.06 6.6-71.56
Kharrat and Dalmazzone (2003) 11.9 and 17.1 269.2-277.7 4.23-8.57
MgCl2 Kang et al. (1998) 3, 6, 10 and 15 270.75-286.4 2.82-12.95
Atik et al. (2006) 1, 5, 10 and 15 270.4-292.2 3.46-22.65
CaCl2 Kharrat and Dalmazzone (2003) 5, 10, 15, 20, 23 and 26 259.9-284.4 4.92-10.29
Atik et al. (2006) 17 265.4-282.2 3.03-22.93
TABLE 4
Methane hydrate dissociation data in the presence of mixed NaCl and KCl electrolyte solutions
Reference Solution Solution ID T (K) P (MPa)
Dholabhai et al. (1991) 3 mass% NaCl and 3 mass% KCl Na3K3 271.35-279.2 2.704-5.857
3 mass% NaCl and 5 mass% KCl Na3K5 270.32-281.46 2.829-9.379
5 mass% NaCl and 10 mass% KCl Na5K10 267.49-279 2.569-9.046
5 mass% NaCl and 15 mass% KCl Na5K15 266.29-276.19 2.914-8.689
10 mass% NaCl and 12 mass% KCl Na10K12 264.58-274.23 2.989-8.819
15 mass% NaCl and 8 mass% KCl Na15K8 264.38-272.12 3.614-8.839

transducer mounted directly on the cell and connected to thesame data acquisition unit. This system allows real time read-ings and storage of temperatures and pressures throughoutthe different isothermal runs. To achieve a fast thermody-namic equilibrium and to provide a good mixing of the flu-ids, a stirrer with a magnetic motor was used to agitate thetest fluids.
Prior to the tests the equilibrium cell was cleaned andevacuated. The aqueous solution of different salts was loadedinto the cell and then methane gas was injected into the cellto achieve the desired starting pressure. Once the cell hadbeen charged with the desired components the mixer wasswitched on and the temperature lowered to form hydrates,their presence being confirmed by pressure drop. The hydrateformation caused a rapid decline in the cell pressure as gasmolecules were consumed during the process. The tempera-ture was then increased stepwise, slowly enough to allowequilibrium to be achieved at each temperature step. At tem-peratures below the point of complete dissociation, gas isreleased from decomposing hydrates, giving a marked rise inthe cell pressure with each temperature step (Fig. 2).However, once the cell temperature has passed the finalhydrate dissociation point, and all clathrates have disap-peared from the system, a further rise in the temperature willresult only in a relatively small pressure rise due to thermalexpansion. This process results in two traces with very dif-ferent slopes on a pressure versus temperature (P/T) plot;one before and one after the dissociation point. The pointwhere these two traces intersect (i.e., an abrupt change in theslope of the P/T plot) is taken as the dissociation point (seeFig. 2). Dissociation point measurements measured usingthis reliable isochoric step-heating method has been previ-
ously demonstrated as being considerably more reliable andrepeatable than conventional continuous heating and/orvisual techniques (Tohidi et al., 2000). The procedure wasrepeated at different pressures in order to determine thehydrate phase boundaries over a wide temperature range. Inthis work, methane hydrate dissociation points were mea-sured in the presence of aqueous solutions containing differ-ent concentrations of NaCl, KCl and MgCl2 (Tab. 5).
3 THERMODYNAMIC MODELING
For a system at equilibrium, from a thermodynamic view-point,the criterion for phase equilibrium is the equality of chemicalpotentials of each component in all coexisting phases. For anisothermal system this will reduce to the equality of fugacityof each component in different phases. The fugacity of eachcomponent in the salt-free water phase has been calculatedby the well-proven Cubic-Plus-Association Equation of State(CPA-EoS) (Kontogeorgis et al., 2006). The CPA-EoS com-bines the well-known Soave-Redlich-Kwong (SRK) EoS fordescribing the physical interactions with the Wertheim’sfirst-order perturbation theory, which can be applied to dif-ferent types of hydrogen-bonding compounds. Water para-meters (water is the only associating component here) in theCPA-EoS have been determined from pure liquid water prop-erties by Kontogeorgis et al. (1999). When salt is present,the fugacity of non-electrolyte components in the aqueous
H Haghighi et al. / Methane and Water Phase Equilibria in the Presence of Single and MixedElectrolyte Solutions Using the Cubic-Plus-Association Equation of State
145
Pressure
Transducer
Coolant jacket
Inlet / outlet
PRT
Stirrer blade
Magnetic motor
PC interface
Figure 1
Schematic illustration of the experimental set-up.
Hydrate dissociation + Thermal expansion
Thermal expansion
Dissociation point
No hydrate
Hydrate dissociation and gas release
P
TFigure 2
Dissociation point determination from equilibrium step-heating data. The equilibrium dissociation point isdetermined as being the intersection between the hydratedissociation (pressure increase as a result of gas release dueto temperature increase and hydrate dissociation, as well asthermal expansion) and the linear thermal expansion (nohydrate) curves.

Oil & Gas Science and Technology – Rev. IFP, Vol. 64 (2009), No. 2
phase are calculated by combining the EoS with theDebye Hückel electrostatic contribution term (Aasberg-Petersen et al., 1991). The hydrate-forming conditions aremodeled by the solid solution theory of van der Waals andPlatteeuw (1959). Langmuir constants have been calculatedby using Kihara potential parameters tuned to methanehydrate dissociation data (Kihara, 1953).
3.1 Modeling of Solubility of Methane in Water
Species forming hydrogen bonds often exhibit unusualthermodynamic behavior due to strong attractive interactionsbetween molecules of the same species (self-association) orbetween molecules of different species (cross-association).These interactions may strongly affect the thermodynamicproperties of the fluids. Thus, the chemical equilibriabetween clusters should be taken into account in order todevelop a reliable thermodynamic model. The Cubic-Plus-Association (CPA) model, an Equation of State that com-bines the cubic SRK Equation of State and an association(chemical) term, is used in this work for fugacity calculationsin phase equilibria calculations. The CPA EoS can beexpressed for mixtures in terms of pressure P (Kontogeorgiset al., 1999):
(1)
where the physical term is that of the SRK EoS and the asso-ciation term is taken from the SAFT EoS (Huang and
PRT
V b
a T
V V b
RT
V
g
m m m m
=−
−+
−
+ +∂
∂
⎛
⎝⎜
( )
( )
ln( )
1
2
1 ρρ
⎞⎞
⎠⎟ −( )∑ ∑x Xi
i
A
A
i
i
1
Radosz, 1990). XAi is the mole fraction of molecule i notbonded to the site A and xi is the mole fraction of the compo-nent i. XAi can be rigorously defined as:
(2)
where ρ is the molar density of the fluid, xj is the mole frac-tion of substance j, XAi is related to the association strengthbetween site A and site B on the molecule, and ΔAiBj, theassociation strength, is the key quantity in the CPA EoS.Both XAi and ΔAiBj depend on the structure of the moleculeand the number and type of sites. The association strengthbetween site A on molecule i and site B on molecule j isgiven by:
(3)
where g(d)simp. is the simplified expression of the radialdistribution function as suggested by Kontogeorgis et al.(1999), b is the co-volume parameter from the cubic partof the model, β and ε are the association volume andenergy parameters of CPA, respectively. The latter twocould be obtained from spectroscopy data but are in mostcases estimated along with the parameters of the physicalterm. The simplified expression of the radial distributionfunction is:
(4)
where η is the reduced fluid density given as:
(5)
The energy parameter of the CPA-EoS, a(T), is definedusing a Soave-type temperature dependency:
(6)
The co-volume parameter b is assumed to be temperatureindependent, in agreement with most published equations ofstate.
When the CPA-EoS is used for mixtures, the SRK partrequires the conventional van der Waals one-fluid mixingrules for a(T) and b. The mixing and combining rules fora(T) and b are the classical van der Waals equations:
(7)
a T x x a
b x x b
i j ij
ji
i j ij
ji
( ) =
=
∑∑
∑∑
a T a C Tr( ) = + −( )( )0 1
2
1 1
η ρ= =1
4 4b
b
Vm
g d simp( ).
. =−
1
1 1 9η
ΔA B simpAB
A Bi j i jg dRT
b=⎛
⎝⎜
⎞
⎠⎟ −
⎡
⎣⎢
⎤
⎦⎥( ) exp. εβ1
X x XAj
B A B
Bj
i j i j
j
= +⎛
⎝⎜⎜
⎞
⎠⎟⎟∑∑
−
1
1
ρ Δ
146
TABLE 5
Methane hydrate dissociation points in the presence of aqueous singleelectrolyte solutions (present work)
Solution T (K) P (MPa)
15 mass% NaCl 269.45 3.93
282.20 17.81
285.05 26.50
20 mass% NaCl 268.55 5.02
274.95 10.31
277.25 15.38
15 mass% KCl 276.45 6.24
281.10 10.89
284.95 17.28
10 mass% MgCl2 274.28 4.32
280.90 10.27
284.05 15.00
287.38 24.78

where the classical combination rules are used:
(8)
For binary systems containing a self-associating (water)and a non-associating compound (methane), the binary inter-action parameters kij are the only adjustable parameters andthus no combining rules are required for the associatingenergy and volume.
The selection of the association scheme and the maximumnumber of association sites can be found for a compound bylooking at the location of its constituting hydrogen atoms andlone pairs on acceptor atom (oxygen for water molecules).Huang and Radosz (1990) have classified eight differentassociation schemes, which can be applied to different mole-cules depending on the number and type of associating sites.The four-site (4C) association scheme is used for highlyhydrogen-bonded substances, such as water, which have twoproton donors and two proton acceptors per molecule. TheCPA EoS pure compound parameters, used for the fugacitycalculations in this paper are listed in Table 6.
a k a a
bb b
ij ij i j
iji j
= −( )
=+
1
2
3.2 Modeling of Electrolyte Solutions
When salt is present, the fugacities of non-electrolytecomponents in the aqueous phase are calculated by combin-ing an EoS with the Debye Hückel electrostatic term to takeinto account the effect of electrolyte (Aasberg-Petersen et al.,1991):
(9)
where n is the number of non-electrolyte components, φi isthe fugacity coefficient of non-electrolyte component i inthe aqueous solution, φi
EoS is the fugacity coefficient ofnon-electrolyte component i using an EoS, neglecting theelectrostatic effect, and γi
EL is the contribution of the elec-trostatic term. The Equation of State (short-range interac-tions) is employed to calculate the effect of non-ionic(molecular) species in the aqueous phase and a Debye-Hückel electrostatic term (long-range interactions) is usedto model the effect of salts on the fugacity coefficients ofmolecular species in the solution. Using the Debye Hückel
ln ln ln , , ...,φ φ γi iEoS
iEL i n= + = 1 2
activity model, the second term in Equation (9) can be cal-culated from (Aasberg-Petersen et al., 1991):
(10)
where Mm is the salt-free mixture molecular weight determinedas a molar average, and his is the binary interaction parameterbetween the dissolved salt and a non-electrolyte component. Adetailed description of the modeling of ice phase, electrolytesolution and tuned binary interaction parameter, his, as a func-tion of salt concentration and temperature for the CPA EoS canbe found elsewhere (Haghighi et al., 2008).
The change in gas solubility due to the presence of saltshas been taken into account using the method introduced byTohidi-Kalorazi (1995) in which the gas-salt interaction para-meters are expressed as functions of temperature and saltconcentration.
3.3 Modeling of Hydrate Phase
The statistical thermodynamic model of van der Waals andPlatteeuw (1959) provides a bridge between the microscopicproperties of the clathrate hydrate structure and macroscopicthermodynamic properties, i.e., the phase behavior. Thehydrate phase is modeled by using the solid solution theoryof van der Waals and Platteeuw (1959), as implemented byParrish and Prausnitz (1972). The Kihara model for sphericalmolecules is applied to calculate the potential functions forcompounds forming the hydrate phase (Kihara, 1953). Thefugacity of water in the hydrate phase is given by the follow-ing equation (Anderson and Prausnitz, 1986):
(11)
where superscripts H and β refer to hydrate and empty hydratelattice, respectively and μ stands for chemical potential. fw
β isthe fugacity of water in the empty hydrate lattice. Δμw
β-H is thechemical potential difference of water between the emptyhydrate lattice, μw
β, and the hydrate phase, μwH, which is
obtained by the van der Waals and Platteeuw expression:
(12)
where v–m is the number of cavities of type m per water mole-cule in the unit cell, fj is the fugacity of the gas component j.Cmj is the Langmuir constant, which accounts for the gas-water interaction in the cavity. The Langmuir constants aretemperature dependent functions that describe the potentialinteraction between the encaged guest molecule and the watermolecules surrounding it. Numerical values for the Langmuir
Δμ μ μβ βw
Hw w
Hm mj j
jm
RT v C f− = − = +⎛
⎝⎜⎜
⎞
⎠⎟⎟∑∑ ln 1
f fRTw
Hw
wH
= −⎛
⎝⎜
⎞
⎠⎟
−β
βμexp
Δ
ln /γiDH m isAM h
Bf BI= ( )2
31 2
H Haghighi et al. / Methane and Water Phase Equilibria in the Presence of Single and MixedElectrolyte Solutions Using the Cubic-Plus-Association Equation of State
147
TABLE 6
The CPA EoS pure compound parameters for methane and water
B a0 c1ε β
References(L/mol) (bar L2 mol-2) (bar L mol-1) (x103)
methane 0.0284 2.278 0.444 Voutsas
et al., 2000
water 0.0145 1.2277 0.6736 166.55 69.2 Kontogeorgis
et al., 1999

Oil & Gas Science and Technology – Rev. IFP, Vol. 64 (2009), No. 2
constant can be calculated by choosing a model for the guest-host interaction (van der Waals and Platteeuw, 1959):
(13)
where k is Boltzmann’s constant. The function w(r) is thespherically symmetric cell potential in the cavity, with r mea-sured from the centre, and depends on the intermolecularpotential function chosen for describing the encaged gas-water interaction. In the present work, the Kihara potentialfunction (Kihara, 1953) is used as described in McKoy andSinanoglu (1963).
(14)
where Γ(r) is the potential energy of interaction between twomolecules when the distance between their centers is equal tor. ε is the characteristic energy, α is the radius of the spheri-cal molecular core and σ* = σ – 2α where σ is the collisiondiameter, i.e., the distance where Γ = 0. The methane Kiharapotential parameters, α, σ and ε are taken from Tohidi-Kalorazi (1995) (Tab. 7).
TABLE 7
Kihara Potential Parameters for methanewater interactions from Tohidi-Kalorazi, 1995.
(α = collision diameter, ε = depth of energy well,
k = Boltzmann’s constant)
α(Å) σ*a(Å) (ε / k) (K)
Methane 0.2950 3.2512 153.685
a σ* = σ − 2α
Based on the chosen potential energy function, the spheri-cally symmetric cell potential in the cavities (Equation (13))needs to be derived. The fugacity of water in the emptyhydrate lattice, fw
β in Equation (11), is given by:
(15)
where fwI/L is the fugacity of either pure ice or liquid water
whichever is the stable phase and Δμwβ–I/L is the difference in
the chemical potential between the empty hydrate lattice andpure liquid water. Δμw
β–I/L is given by the following equation:
(16)
where superscript “0” stands for the triple point of water andh refers to molar enthalpy. μw
β and μwI/L are the chemical
Δ
Δ
μ μ μ
μ
β βw
I Lw w
I L
w
RT
T P
RT
T P
RT
RT
−
=( )
−( )
= −
/ /, ,
0
0
ΔΔ Δh
RTdT
v
RTdPw
I L
T
Tw
I L
P
Pβ β− −
+∫ ∫/ /
2
0 0
f fRTw w
I L wI L
ββμ
=⎛
⎝⎜
⎞
⎠⎟
−/
/
expΔ
Γ rr r
( ) =−
⎛
⎝⎜
⎞
⎠⎟ −
−
⎛
⎝⎜
⎞
⎠⎟
⎡
⎣⎢⎢
⎤
⎦⎥⎥
42 2
12 6
εσ
ασ
α* *
rr > 2α
r ≤ 2αΓ r( ) = ∞
C TkT
w r
k Tr drmj ( ) = −
( )⎛
⎝⎜
⎞
⎠⎟
∞
∫4 2
0
πexp
'
potential of the empty hydrate lattice and of pure water in theice (I) or the liquid (L) state, respectively. Δμw
0 is the refer-ence chemical potential difference between water in theempty hydrate lattice and pure water at the triple point tem-perature of water (T0). Δhw
β–I/L and Δvwβ–I/L are the molar
enthalpy and molar volume differences between an emptyhydrate lattice and ice or liquid water. Δhw
β–I/L is given by thefollowing equation (Anderson and Prausnitz, 1986; Holder etal., 1980):
(17)
where C’ and subscript P refer to molar heat capacity andpressure, respectively. Δhw
0 is the enthalpy difference betweenthe empty hydrate lattice and pure water, at the triple point.The heat capacity difference between the empty hydrate lat-tice and the pure liquid water phase, ΔC’Pw is also temperaturedependent and the equation recommended by Holder et al.(1980) is used:
(18)
where ΔC’Pw is in J.mol-1K-1. Furthermore, the heat capacitydifference between hydrate structures and ice is set to zero.The reference properties used are summarized in Table 8.
TABLE 8
Thermodynamic reference properties for structure I hydrates in the ice/liquid water region
Reference Value in ice Value in liquidReferences
property region water region
Δμ°w (J mol-1) 1297 1297 Dharmawardhana
et al., 1980
Δμ°w (J mol-1) 1389 –4620.5 Dharmawardhana
et al., 1980
Δvw (cm3 mol-1) 3.0 4.601 Parrish and
Prausnitz, 1972
3.4 Modeling the Capillary Effect on HydrateStability Condition
To model the hydrate dissociation conditions in porousmedia, the approach introduced by Llamedo et al. (2004) hasbeen used to take into account the effect of capillary pressure.To account for capillary pressure effects on phase fugacities,a correction similar to the Poynting correction for saturatedliquids has been applied, with the assumption that the molarvolumes of the hydrate and/or aqueous phases are unaffectedby capillary pressures (Smith and Van Ness, 1987):
(19)f fv P
RTicappillary
ibulk i e= exp( )
T T> 0ΔC T TPw’ . .= − + −( )37 32 0 179 0
Δ Δ Δh h C dTwI L
w Pw
T
Tβ− = + ∫/ ’0
0
148

where vi is the molar volume, R is the gas constant and T is thetemperature in K and Pe is the capillary pressure, given by:
(20)
where γhl the specific surface energy of hydrate-liquid inter-face, F shaping factor for the interface and θ the contactangle between the solid and the pore wall.
The model assumes cylindrical pores, and the curvature of1/r (r is the nominal pore radius) has been considered formodeling the dissociation condition, in accordance withaccepted capillary theory. The model assumes water to be thewetting phase on silica surface as observed by Tohidi et al.(2001) and that the porous media is saturated with the liquidphase. Within the pore space, clathrates are subjected to a
PF
rehl=
γ θcos
higher pressure due to the capillary pressure effects, resultingin inhibition. For modeling purposes, the value for the liquid-hydrate interfacial tension, the only parameter required forthe modeling, was considered to be 0.032 J/m2 and the shapefactor equal to one as it is a function of curvature of hydrate-liquid interface. More details about the modeling of gashydrate growth and dissociation in narrow pores and capil-lary inhibition effect can be found elsewhere (Anderson etal., 2006; Llamedo et al., 2004).
4 RESULTS AND DISCUSSIONS
For binary systems containing a self-associating (water) anda non-associating compound (methane), the binary interac-tion parameters kij are the only adjustable parameters and
H Haghighi et al. / Methane and Water Phase Equilibria in the Presence of Single and MixedElectrolyte Solutions Using the Cubic-Plus-Association Equation of State
149
0876543210
0.002
0.0005
0.001
0.0015
P (MPa)
0403020100
CH
4 S
olub
ility
(M
ole
frac
t.)
CH
4 S
olub
ility
(M
ole
frac
t.)
0.001
0.002
0.003
0.004
P (MPa)
Wang et al. (1995)
Reichl (1996)
Wang et al. (2003)
Chapoy et al. (2004)
a) 283.15 K b) 298.15 K
Culberson et al. (1951)
Duffy et al. (1961)
Yokoyama et al. (1988)
Wang et al. (1995)
Yang et al.. (2001)
Kim et al. (2003)
Chapoy et al. (2004)
06050403020100
CH
4 S
olub
ility
(M
ole
frac
t.)
0.005
0.001
0.002
0.003
0.004
P (MPa)
0706050403020100
CH
4 S
olub
ility
(M
ole
frac
t.)
0.005
0.001
0.002
0.003
0.004
P (MPa)
c) 303.15 K d) 344.26 K
Culberson et al. (1951)
Amirjafari and Campbell (1972)
Duffy et al. (1961)
Wang et al. (2003)
Figure 3
Solubility of methane in water.

thus no combining rules are required for the associatingenergy and volume. Experimental water content data, at lowtemperatures, for hydrocarbons and non-hydrocarbon gasesare scarce and often rather dispersed. This is partly due to thefact that the water content of gases is very low at low temper-atures and high pressures and hence generally very difficultto measure, however, measuring gas solubility in water iseasier than measuring the water content of gases. Due to thisfact, the following objective function was employed for tun-ing the binary interaction parameter between methane andwater:
(21)
By minimizing the average absolute deviations in the sol-ubility of methane in water in the range of 273.15 K up to393.15 K (using the data from Chapoy et al., 2004;Culberson and Mc Ketta, 1951), a quadratic temperaturedependent kij has been established.
(22)k T Tij = − × + −−1 18 10 0 0102 1 96685 2. . .
OFx x
xicalc
i
ii
NP
=−⎛
⎝⎜
⎞
⎠⎟∑
. exp.
exp.
2
After gathering the available data from the literature andtuning the binary interaction parameters for methane andwater, experimental solubility data were used to evaluate thepredictions of the model. Figure 3 and Figure 4 present theresults of the CPA models for predicting the solubility ofmethane in water and the water content in the gas phase,respectively. The model predictions are in an excellent agree-ment with the experimental data, demonstrating the reliabilityof the developed model.
The next step was to evaluate the performance of themodel in predicting the hydrate stability zone in the pres-ence of electrolyte solutions. New experimental data fordifferent concentrations of single salts measured in thiswork, in addition to the data from the literature, have beenused for evaluating the model. As shown in Figure 5 toFigure 8, the model can accurately predict the inhibitioneffect of salts on the hydrate stability conditions; goodagreement with the data generated in this work is observedfor both single and mixed electrolyte solutions. However,the published experimental data by Kang et al. (1998) for15 mass% of MgCl2 are consistently displaced to lower
Oil & Gas Science and Technology – Rev. IFP, Vol. 64 (2009), No. 2150
00.10.010.0010.0001
40
35
30
25
20
15
10
5
Water content (Mole fraction)
P (
MP
a)
0293288283278273268
20 15 10
263
5
10
15
20
25
T (K)
P (
MP
a)
Figure 4
Water content of methane in equilibrium with liquid water.Experimental data at 273.11 K from Kosyakov et al., 1982(●) and Althaus, 1999 (●●). Experimental data at 283.1 Kfrom Kosyakov et al., 1982 (■■), Althaus, 1999 (■) andChapoy et al. (2003) (■). Experimental data at 298.1 K fromRigby and Prausnitz, 1968 (◆), Yokoyama et al., 1988 (◆◆)and Chapoy et al., 2003 (◆). Experimental data at 313.13 Kfrom Yarym-Agaev et al., 1985 (▲▲) and Chapoy et al., 2003(▲). Experimental data at 348.15 K from Rigby andPrausnitz, 1968 (*). Black lines are model predictions for thewater content of methane. Gray line shows the methanehydrate phase boundary.
Figure 5
Methane hydrate dissociation conditions in the presence ofNaCl. Experimental data in presence of 10 mass% of NaClfrom: Kabayashi et al., 1951 (●●), Maekawa et al., 1995 (◆)and Maekawa and Imai, 1999 (▲). Experimental data inpresence of 15 mass% of NaCl from: this work (● ).Experimental data in presence of 20 mass% of NaCl from:Maekawa et al., 1995 (◆), Maekawa and Imai, 1999 (▲) andthis work. Experimental data for methane hydrate (distilledwater) from: Blanc and Tournier-Lasserve, 1990 (■), Rossand Tocyzylkin, 1992 (■■), and Nixdorf and Oellrich, 1997(■). Black lines are the predicted methane hydrate phaseboundary in presence of NaCl. Dotted black line is thepredicted methane hydrate phase boundary (distilled water).
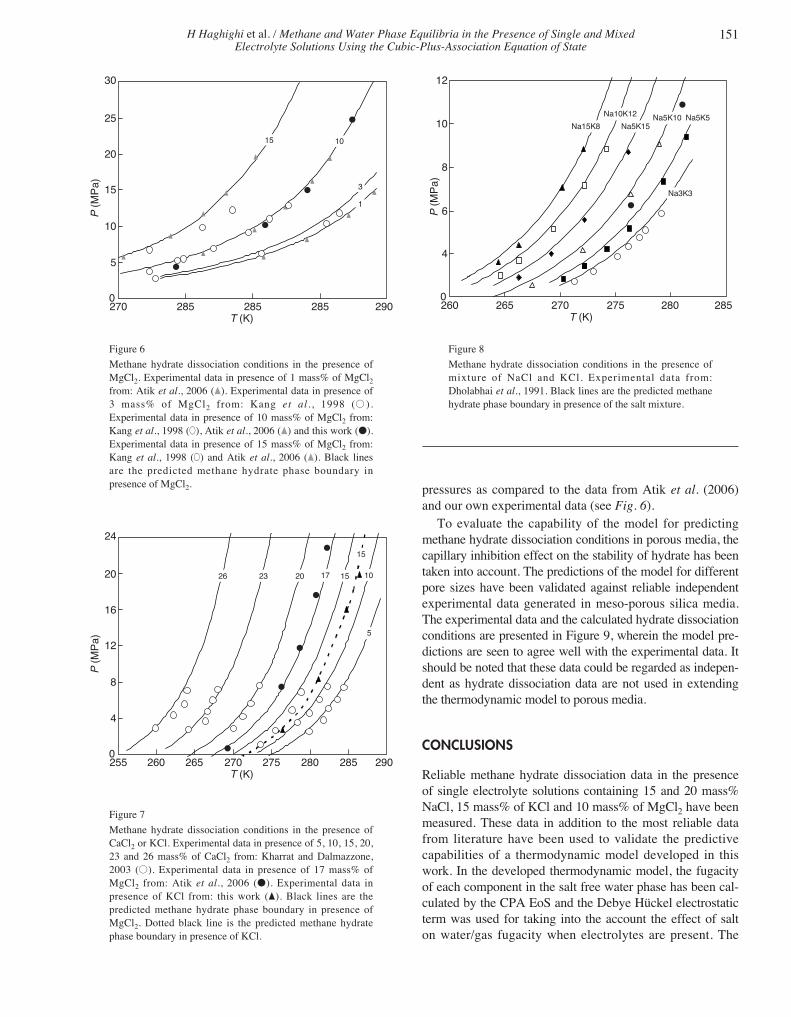
pressures as compared to the data from Atik et al. (2006)and our own experimental data (see Fig. 6).
To evaluate the capability of the model for predictingmethane hydrate dissociation conditions in porous media, thecapillary inhibition effect on the stability of hydrate has beentaken into account. The predictions of the model for differentpore sizes have been validated against reliable independentexperimental data generated in meso-porous silica media.The experimental data and the calculated hydrate dissociationconditions are presented in Figure 9, wherein the model pre-dictions are seen to agree well with the experimental data. Itshould be noted that these data could be regarded as indepen-dent as hydrate dissociation data are not used in extendingthe thermodynamic model to porous media.
CONCLUSIONS
Reliable methane hydrate dissociation data in the presenceof single electrolyte solutions containing 15 and 20 mass%NaCl, 15 mass% of KCl and 10 mass% of MgCl2 have beenmeasured. These data in addition to the most reliable datafrom literature have been used to validate the predictivecapabilities of a thermodynamic model developed in thiswork. In the developed thermodynamic model, the fugacityof each component in the salt free water phase has been cal-culated by the CPA EoS and the Debye Hückel electrostaticterm was used for taking into the account the effect of salton water/gas fugacity when electrolytes are present. The
H Haghighi et al. / Methane and Water Phase Equilibria in the Presence of Single and MixedElectrolyte Solutions Using the Cubic-Plus-Association Equation of State
151
15 10
3
1
0290285285285270
5
10
15
20
25
30
T (K)
P (
MP
a)
Figure 6
Methane hydrate dissociation conditions in the presence ofMgCl2. Experimental data in presence of 1 mass% of MgCl2from: Atik et al., 2006 (▲). Experimental data in presence of3 mass% of MgCl2 from: Kang et al., 1998 (●● ).Experimental data in presence of 10 mass% of MgCl2 from:Kang et al., 1998 (●●), Atik et al., 2006 (▲) and this work (●).Experimental data in presence of 15 mass% of MgCl2 from:Kang et al., 1998 (●●) and Atik et al., 2006 (▲). Black linesare the predicted methane hydrate phase boundary inpresence of MgCl2.
5
1015202326 17
15
0290285280275270265260255
4
8
12
16
20
24
T (K)
P (
MP
a)
Figure 7
Methane hydrate dissociation conditions in the presence ofCaCl2 or KCl. Experimental data in presence of 5, 10, 15, 20,23 and 26 mass% of CaCl2 from: Kharrat and Dalmazzone,2003 (●●). Experimental data in presence of 17 mass% ofMgCl2 from: Atik et al., 2006 (●). Experimental data inpresence of KCl from: this work (▲). Black lines are thepredicted methane hydrate phase boundary in presence ofMgCl2. Dotted black line is the predicted methane hydratephase boundary in presence of KCl.
Na3K3
Na5K5Na5K10Na5K15
Na10K12
Na15K8
0285280275270265260
4
6
8
10
12
T (K)
P (
MP
a)
Figure 8
Methane hydrate dissociation conditions in the presence ofmixture of NaCl and KCl. Experimental data from:Dholabhai et al., 1991. Black lines are the predicted methanehydrate phase boundary in presence of the salt mixture.

Oil & Gas Science and Technology – Rev. IFP, Vol. 64 (2009), No. 2
available experimental data for the solubility of methane inwater were employed to optimize the binary interaction para-meters between water and methane. Model predictions arevalidated against independent experimental data. Despite thewide range of temperature and salt concentrations the modelwas found to be very successful in predicting the phase behav-ior of water and methane in presence of electrolyte solutions.Good agreement between model predictions and independentexperimental data for gas solubility in water and hydrate sta-bility zone (in bulk and porous media) is observed, demon-strating the reliability and robustness of the developed model.
ACKNOWLEDGEMENTS
This work was funded by the UK Engineering and PhysicalSc iences Research Counci l (EPSRC Grant No.EP/D052556/1), whose support is gratefully acknowledged.
REFERENCES
Aasberg-Petersen K., Stenby E., Fredenslund A. (1991) Predictionof High-Pressure Gas Solubilities in Aqueous Mixtures ofElectrolytes, Ind. Eng. Chem. Res. 30, 2180-2185.
Abdulgatov I.M., Bazaev A.R., Ramazanova A.E. (1993)Volumetric Properties and Virial Coefficients of (Water + Methane),J. Chem. Thermodyn. 25, 249-259.
Althaus K. (1999) Relationship Between Water Content and WaterDew Point Keeping in Consideration the Gas Composition in theField of Natural Gas, Fortschr. Berichte VDI Reihe, 3, 350.
Amirijafari R., Campbell J. (1972) Solubility of GaseousHydrocarbon Mixtures in Water, Soc. Pet. Eng. J. 21-27.
Anderson F.E., Prausnitz J.M. (1986) Inhibition of Gas Hydrates byMethanol, AIChE J. 32, 8, 1321-1332.
Anderson R., Llamedo M., Tohidi B. (2004) ExperimentalInvestigation of Methane Hydrate Growth and DissociationHysteresis in Narrow Pores, European Geosciences Union 1stGeneral Assembly, France, April, pp. 25-30.
Anderson R., Tohidi B., Webber J.B.W. (2006) Gas HydrateGrowth and Dissociation in Narrow Pore Networks: CapillaryInhibition and Hysteresis Phenomena, Geological Society of LondonConference on Sediment-hosted Gas Hydrates: New Insights onNatural and Synthetic Systems, UK, January, pp. 25-26.
Atik Z., Windmeier C., Oellrich L.R. (2006) Experimental GasHydrate Dissociation Pressures for Pure Methane in AqueousSolutions of MgCl2 and CaCl2 and for a (Methane + Ethane) GasMixture in an Aqueous Solution of (NaCl + MgCl2), J. Chem. Eng.Data 51, 1862-1867.
Ben-Naim A., Yaacobi M. (1974) Effects of Solutes on the Strengthof Hydrophobic Interaction and Its Temperature Dependence, J.Phys. Chem. 7, 2, 170-175.
Blanc C., Tournier-Lasserve J. (1990) Controlling Hydrates inHigh-Pressure Flow Lines, World Oil 211, 5, 63-68.
Blanco L.H., Smith N.O. (1978) High-Pressure Solubility ofMethane in Aqueous Calcium-Chloride and AqueousTetraethylammonium Bromidepartial Molar Properties of DissolvedMethane and Nitrogen in Relation to Water-Structure, J. Phys.Chem. 8, 2, 186-191.
Blount C.W., Price L.C. (1982) Solubility of Methane in Waterunder Natural Conditions: A Laboratory Study. DOE Contract No.DE-A508- 78ET12145, Final Report.
Chapoy A., Coquelet C., Richon D. (2003) Solubility Measurementand Modeling of Water in the Gas Phase of the Methane/Waterbinary System at Temperatures from 283.15 to 318.15 K andPressures up to 35 MPa, Fluid Phase Equilibr. 214, 101-107.
Chapoy A., Mohammadi A.H., Richon D., Tohidi B. (2004) GasSolubility Measurement and Modeling for Methane – Water andMethane – Ethane – n-Butane - Water Systems Near HydrateForming Conditions, Fluid Phase Equilibr. 220, 113-121.
Cramer S.D. (1984) Solubility of Methane in Brines from 0-Degrees-C to 300-Degrees-C, Ind. Eng. Chem. Process Des. Dev. 2,3, 533-538.
Crovetto R., Fernandez-Prini R., Japas M.L. (1982) Solubilities ofInert Gases and Methane in H2O and in D2O in the TemperatureRange of 300 to 600 K, J. Chem. Phys. 76, 2, 1077-1086.
Culberson O.L., Horn A.B., Mc Ketta J.J. Jr (1950) Phase Equilibriain Hydrocarbon-Water Systems: The Solubility of Ethane in Waterat Pressures up to 1200 Pounds per Square Inch, AIME 189, 1-6.
Culberson O.L., Mc Ketta J.J. Jr (1951) Phase Equilibria inHydrocarbon-Water Systems III, The Solubility of Methane inWater at 10000 Psia, AIME 192, 223-226.
Davis J.E., Mc Ketta J.J. Jr (1960) Solubility of Methane in Water,Petrol. Refiner. 39, 205-206.
De Roo J.L., Peters C.I., Liechtenthaller R.N., Diepen G.A.M.(1983) Occurrence of Methane Hydrate in Saturated andUnsaturated Solution of Sodium Chloride and Water Independenceof Temperature and Pressure, AIChE J. 29, 651-657.
152
9.2 15.8 30.6
3290.15285.15280.15275.15270.15
8
13
12
T (K)
P (
MP
a)
Figure 9
Methane hydrates dissociation conditions in meso-poroussilica. Experimental data for methane hydrate in porousmedia from: Anderson et al., 2004, (●) 9.2 nm (●) 15.8 nmand (●●) 30.6 nm. Experimental data for methane hydrate(distilled water) from: Blanc and Tournier-Lasserve, 1990(■■ ), Ross and Tocyzylkin, 1992 (■), and Nixdorf andOellrich, 1997 (■). Black lines are the predicted methanehydrate phase boundary in porous media. Dotted black line isthe predicted methane hydrate phase boundary (distilledwater).

Dharmawardhana P.B., Parrish W.R., Sloan E.D. (1980)Experimental Thermodynamic Parameters for the Prediction ofNatural Gas Hydrate Dissociation Conditions, Ind. Eng. Chem.Fundam. 19, 410-414.
Dholabhai P.D., Englezos P., Kalogerakis N., Bishnoi P.R. (1991)Equilibrium Conditions for Methane Hydrate Formation in AqueousMixed Electrolyte Solutions, Can. J. Chem. Eng. 69, 800-805.
Duffy J.R., Smith N.O., Nagy B. (1961) Solubility of Natural Gasesin Aqueous Salt Solutions. 1. Liquidus Surfaces in the SystemCH4–H2O–NaCl–CaCl2 at Room Temperatures and at PressuresBelow 1000 Psia, Geochim. Cosmochim. Ac. 2, 1-2, 23-31.
Eucken A., Hertzberg G. (1950) Aussalzeffekt und Ionen-hydratation, Z. Phys. Chem. 195, 1-23.
Frolich K., Tauch E.J., Hogan J.J., Peer A.A. (1931) Solubility ofGases in Liquids at High Pressures, Ind. Eng. Chem. 23, 548-550.
Haghighi H., Chapoy A., Tohidi B. (2008) Freezing PointDepression of Electrolyte Solutions: Experimental Measurementsand Modeling Using the CPA Equation of State, Ind. Eng. Chem.Res. (in press).
Hilderbrabd M. (1968) Solutions of Inert Gases in Water, J. Am.Chem. Soc. 90, 3001-3004.
Holder G.D., Corbin G., Papadopoulos K.D. (1980)Thermodynamic and Molecular Properties of Gas Hydrate fromMixtures Containing Methane, Argon and Krypton, Ind. Eng.Chem. Fundam. 19, 282-286.
Huang S.H., Radosz M. (1990) Equation of State for Small, Large,Polydisperse and Associating Molecules, Ind. Eng. Chem. Res. 29,2284-2294.
Jager M.D., Sloan E.D. (2001) The Effect of Pressure on MethaneHydration in Pure Water and Sodium Chloride Solutions, FluidPhase Equilibr. 185, 1-2, 89-99.
Kang S.P., Chun M.K., Lee H. (1998) Phase Equilibria of Methaneand Carbon Dioxide Hydrates in the Aqueous MgCl2 Solutions,Fluid Phase Equilibr. 147, 229-238.
Kharrat M., Dalmazzone D. (2003) Experimental Determination ofStability Conditions of Methane Hydrate in Aqueous CalciumChloride Solutions Using High Pressure Differential ScanningCalorimetry, J. Chem. Thermodyn. 35, 1489-1505.
Kiepe J., Horstmann S., Fischer K., Gmehling J. (2003)Experimental Determination and Prediction of Gas Solubility Datafor Methane + Water Solutions Containing Different MonovalentElectrolytes, Ind. Eng. Chem. Res. 42, 5392-5398.
Kihara T. (1953) Virial Coefficient and Models of Molecules inGases, Rev. Mod. Phys. 25, 4, 831-843.
Kim Y.S., Ryu S.K., Yang S.O., Lee C.S. (2003) Liquid Water-Hydrate Equilibrium Measurements and Unified Predictions ofHydrate-Containing Phase Equilibria for Methane, Ethane, Propane,and Their Mixtures, Ind. Eng. Chem. Res. 42, 2409-2414.
Kobayashi R., Withrow H.J., Williams G.B., Katz D.L. (1951) GasHydrate Formation with Brine and Ethanol Solutions, Proceeding ofthe 30th Annual Convention, Natural Gasoline Association ofAmerica, USA, pp. 27-31.
Kontogeorgis G.M., Michelsen M.L., Folas G.K., Derawi S., vonSolms N., Stenby E.H. (2006) Ten Years with the CPA (Cubic-Plus-Association) Equation of State. Part 1. Pure Compounds andSelf-Associating Systems, Ind. Eng. Chem. Res. 45, 4855-4868.
Kontogeorgis G.M., Voutsas E.C., Yakoumis I.V., Tassios D.P.(1996) An Equation of State for Associating Fluids, Ind. Eng.Chem. Res. 35, 4310-4318.
Kontogeorgis G.M., Yakoumis I.V., Meijer H., Hendriks E.M.,Moorwood T. (1999) Multicomponent Phase EquilibriumCalculations for Water–Methanol–Alkane Mixtures, Fluid PhaseEquilibr. 158, 201-209.
Kosyakov N.E., Ivchenko B.I., Krishtopa P.P. (1982) Vopr. Khim.Tekhnol. 68, 33-36.
Krader T., Franck E.U. (1987) The Ternary SystemsH2O–CH4–NaCl and H2O–CH4–CaCl2 to 800 K and 250 Bar, Ber.Bunsengers Phys. Chem. 91, 627-634.
Lekvam K., Bishnoi P.R. (1997) Dissolution of Methane in Water atLow Temperatures and Intermediate Pressures, Fluid PhaseEquilibr. 131, 297-309.
Llamedo M., Anderson R., Tohidi B. (2004) ThermodynamicPrediction of Clathrate Hydrate Dissociation Conditions inMesoporous Media, Am. Mineral. 89, 1264-1270.
Maekawa T., Itoh S., Sakata S., Igari S.I., Imai N. (1995) Pressureand Temperature Conditions for Methane Hydrate Dissociation inSodium Chloride Solutions, Geochem. J. 29, 325-329.
Maekeawa T., Imai N. (1999) Equilibrium Conditions of Methaneand Ethane Hydrates in Aqueous Electrolyte Solutions, The 3rdICGH, USA, July.
Maharajh D.M., Walkley J. (1973) Thermodynamic Solubility:Properties of Gas Mixtures. Part 1.-Two Component Gas Mixturesin Water at 25°C, J. Chem. Soc. Faraday T. 1, 842-848.
McAuliffe C. (1963) Solubility in Water of C1-C9 Hydrocarbons,Nature 200, 1092-1093.
Michels A., Gerver J., Bijl A. (1936) The Influence of Pressure onthe Solubility of Gases, Physica III 3819-3822.
Mishnina T.A., Avdeeva O.I., Bozhovskaya T.K. (1962) TheSolubility of Methane in NaCl Aqueous Solutions, Inf. Sb., Vses.Nauchn-Issled. Geol. Inst. 56, 137-145.
Morrison T.J., Billet F. (1952) The Salting-Out of Non-Electrolytes.Part II. The Effect of Variation in Non-Electrolyte, J. Chem. Soc.3819-3822.
Namiot A.Y., Skripka V.G., Ashmyan K.D. (1979) Influence ofWater Dissolved Salt Upon Methane Solubility Under theTemperatures 50 to 350-Degrees-C, Geokhimiya 1, 147-149.
Nixdorf J., Oellrich L.R. (1997) Experimental Determination ofHydrate Equilibrium Conditions for Pure Gases, Binary and TernaryMixtures and Natural Gases, Fluid Phase Equilibr. 139, 325-333.
O’Sullivan T.D., Smith N.O. (1970) Solubility and Partial MolarVolume of Nitrogen and Methane in Water and in Aqueous SodiumChloride from 50 to 125 degrees and 100 to 600 atm, J. Phys.Chem. 74, 7, 1460-1466.
Parrish W.R., Prausnitz J.M. (1972) Dissociation Pressures of GasHydrates Formed by Gas Mixtures, Ind. Eng. Chem. Process Des.Dev. 11, 1, 26-35.
Pierotti R.A. (1965) Aqueous Solutions of Nonpolar Gases, J. Phys.Chem. 69, 281-288.
Price L.C. (1979) Aqueous Solubility of Methane at ElevatedPressures and Temperatures, Am. Assoc. Pet. Geo. Bull. 63, 1527-1533.
Reichl H. (1996) Ph.D. Thesis, Tech. Univ. Berlin.
Rigby M., Prausnitz J.M. (1968) Solubility of Water in CompressedNitrogen, Argon and Methane, J. Phys. Chem. 72, 330-334.
Ross M.J., Toczylkine L.S. (1992) Hydrate Dissociation Pressuresfor Methane or Ethane in the Presence of Aqueous Solutions ofTriethylene Glycol, J. Chem Eng. Data 37, 4, 488-491.
Sanchez M., De Meer F. (1978) Equilibrio Liquido-Vapor delSistema Metano-Agua Para Altas Presiones Y TemperaturasComprendidas Entre 150 Y 300°C, An. Quim. 74, 1325-1328.
Servio P., Englezos P. (2002) Measurement of Dissolved Methanein Water in Equilibrium with Its Hydrate, J. Chem. Eng. Data 47,87-90.
Sloan E.D. (1998) Clathrate Hydrates of Natural Gases, MarcelDekker Inc., New York.
H Haghighi et al. / Methane and Water Phase Equilibria in the Presence of Single and MixedElectrolyte Solutions Using the Cubic-Plus-Association Equation of State
153

Oil & Gas Science and Technology – Rev. IFP, Vol. 64 (2009), No. 2
Smith J.M., Van Ness H.C. (1987) Introduction to ChemicalEngineering Thermodynamics, McGraw-Hill, New York.
Song K.Y., Fneyrou G., Martin R., Lievois J., Kobayashi R. (1997)Solubility Measurements of Methane and Ethane in Water and NearHydrate Conditions, Fluid Phase Equilibr. 128, 249-260.
Stoessell R.K., Byrne P.A. (1982) Salting-Out of Methane inSingle-Salt Solutions at 25°C and Below 800 Psia, Geochim.Cosmochim. Ac. 46, 8, 1327-1332.
Sultanov R.G., Skripka V.G., Namiot A.Y. (1971) RastvormostMetana V Vode Pri Novysjennykh Temperaturakh I Davlenijakh,Gaz. Prom. 16, 6-7.
Tohidi B., Anderson R., Clennell B., Burgass R.W., Biderkab A.B.(2001) Visual Observation of Gas Hydrate Formation andDissociation in Glass Micromodels, Geology 29, 867-870.
Tohidi B., Burgass R.W., Danesh A., Todd A.C., Østergaard K.K.(2000) Improving the Accuracy of Gas Hydrate Dissociation PointMeasurements, Ann. N.Y. Acad. Sci. 912, 924-931.
Tohidi B., Danesh A., Todd A.C (1996) Gas Solubility and HydrateFormation, Presented at the First MASTER Workshop, Belgium,September, pp. 18-20.
Tohidi-Kalorazi B. (1995) Gas Hydrate Equilibria in the Presenceof Electrolyte Solutions, Ph.D. Thesis, Heriot-Watt University.
Tokunaga J., Kawai M. (1975) Solubilities of Methane in MethanolWater and Ethanol Water Solutions, J. Chem. Eng. Jpn 8, 326.
Van der Waals J.H., Platteeuw J.C. (1959) Clathrate Solutions, Adv.Chem. Phys. 2, 1-57.
Voutsas E.C., Boulougouris G.C., Economou I.G., Tassios D.P.(2000) Water/Hydrocarbon Phase Equilibria Using theThermodynamic Perturbation Theory, Ind. Eng. Chem. Res. 39,797-804.
Wang L.K., Chen G.J., Han G.H., Guo X.Q., Guo T.M. (2003)Experimental Study on the Solubility of Natural Gas Components inWater with or without Hydrate Inhibitor, Fluid Phase Equilibr. 207,143-154.
Wang Y., Han B., Yan H., Liu R. (1995) Solubility of CH4 in theMixed Solvent t-Butyl Alcohol and Water, Thermochim. Acta 253,327-334.
Yang S.O., Cho S.H., Lee H., Lee C.S. (2001) Measurement andPrediction of Phase Equilibria for Methane + Water in HydrateForming Conditions, Fluid Phase Equilibr. 185, 53-63.
Yano T., Suetaka T., Umehara T., Horiuchi A. (1974) Solubilities ofMethane, Ethylene, and Propane in Aqueous Electrolyte Solutions,Kagaku Kogaku 38, 320-323.
Yarym-Agaev N.L., Sinyavskaya R.P., Koliushko I.I., Levinton LY.(1985) Zh. Prikl. Khim. 58, 165-168.
Yokoyama C., Wakana S., Kaminishi G.I., Takahashi S. (1988)Vapor-Liquid Equilibria in the Methane-Diethylene Glycol-WaterSystem at 298.15 and 323.15 K, J. Chem. Eng. Data 33, 274 -276.
Final manuscript received in August 2008Published online in November 2008
154
Copyright © 2008 Institut français du pétrolePermission to make digital or hard copies of part or all of this work for personal or classroom use is granted without fee provided that copies are not madeor distributed for profit or commercial advantage and that copies bear this notice and the full citation on the first page. Copyrights for components of thiswork owned by others than IFP must be honored. Abstracting with credit is permitted. To copy otherwise, to republish, to post on servers, or to redistributeto lists, requires prior specific permission and/or a fee: Request permission from Documentation, Institut français du pétrole, fax. +33 1 47 52 70 78, or [email protected].