meteomex: open infrastructure for networked environmental
TRANSCRIPT
doi.org/10.26434/chemrxiv.12568088.v1
MeteoMex: Open infrastructure for networked environmental monitoringand agriculture 4.0Robert Winkler
Submitted date: 25/06/2020 • Posted date: 16/07/2020Licence: CC BY-NC-ND 4.0Citation information: Winkler, Robert (2020): MeteoMex: Open infrastructure for networked environmentalmonitoring and agriculture 4.0. ChemRxiv. Preprint. https://doi.org/10.26434/chemrxiv.12568088.v1
Air, water, and soil are essential for terrestrial life, but pollution, overexploitation, and climate changejeopardize the availability of these primary resources. Thus, assuring human health and food productionrequires efficient strategies and technologies for environmental protection. Knowing key parameters such assoil moisture, air, and water quality is essential for smart farming and urban development. The MeteoMexproject aims to build simple hardware kits and their integration into current Internet-of-Things (IoT) platforms.This paper shows the use of low-end Wemos D1 mini boards to connect environmental sensors to theopen-source platform ThingsBoard. Two printed circuit boards (PCB) were designed for mountingcomponents. Analog, digital and I2C sensors are supported. The Wemos ESP8266 microchip provides WiFicapability and can be programmed with the Arduino IDE. Application examples for the MeteoMex aeria andterra kits demonstrate their functionality for air quality, soil, and climate monitoring.Further, a prototype formonitoring wastewater treatment is shown, which exemplifies the capabilities of the Wemos board for signalprocessing. The data are stored in a PostgreSQL database, which enables data mining. The MeteoMex IoTsystem is highly scalable and of low cost, which makes it suitable for deployment in agriculture 4.0, industries,and public areas. Circuit drawings, PCB layouts, and code examples are free to download fromhttps://github.com/robert-winkler/MeteoMex.
File list (1)
download fileview on ChemRxivmeteomex-natbib-min.pdf (787.19 KiB)
MeteoMex: Open infrastructure for1
networked environmental monitoring and2
agriculture 4.03
Robert Winkler14
1CINVESTAV Unidad Irapuato, Department of Biochemistry and Biotechnology, Km. 9.65
Libramiento Norte Carr. Irapuato-Len, 36824 Irapuato Gto., Mexico, Kuturabi S.A. de6
C.V., 36613 Irapuato Gto., Mexico7
Corresponding author:8
Robert Winkler19
Email address: [email protected]
ABSTRACT11
Air, water, and soil are essential for terrestrial life, but pollution, overexploitation, and climate changejeopardize the availability of these primary resources. Thus, assuring human health and food productionrequires efficient strategies and technologies for environmental protection. Knowing key parameters such assoil moisture, air, and water quality is essential for smart farming and urban development. The MeteoMexproject aims to build simple hardware kits and their integration into current Internet-of-Things (IoT) plat-forms. This paper shows the use of low-end Wemos D1 mini boards to connect environmental sensorsto the open-source platform ThingsBoard. Two printed circuit boards (PCB) were designed for mountingcomponents. Analog, digital and I2C sensors are supported. The Wemos ESP8266 microchip providesWiFi capability and can be programmed with the Arduino IDE. Application examples for the MeteoMexaeria and terra kits demonstrate their functionality for air quality, soil, and climate monitoring. Further, aprototype for monitoring wastewater treatment is shown, which exemplifies the capabilities of the Wemosboard for signal processing. The data are stored in a PostgreSQL database, which enables data mining.The MeteoMex IoT system is highly scalable and of low cost, which makes it suitable for deployment inagriculture 4.0, industries, and public areas. Circuit drawings, PCB layouts, and code examples are free todownload from https://github.com/robert-winkler/MeteoMex.
12
13
14
15
16
17
18
19
20
21
22
23
24
25
26
Keywords: Climate change, pollution, air quality, volatile organic compounds, wastewater, smart cities,agriculture 4.0, internet-of-things, Arduino, open hardware
27
28
1 INTRODUCTION29
The overuse of natural resources by humans and climate change have severe effects on the en-30
vironment. As a consequence, the global food security is threatened, and pollution-related31
diseases such as allergies and asthma increase (Vermeulen et al., 2012; Wheeler and Braun,32
2013; D’Amato et al., 2015; Lake Iain R. et al., 2017; Cohen et al., 2017; D’Odorico et al., 2018;33
Dell’Angelo et al., 2018; Patella et al., 2018).34
In arid and semi-arid regions, irrigation is essential for agriculture. However, excess water-35
ing negatively affects food yield and quality (El-Ansary, 2017; King et al., 2020) and leads to36
unnecessary consumption of water and energy. Besides, salt accumulation in the soil reduces37
future yields (Shrivastava and Kumar, 2015; Hutchinson, 2019). The use of treated wastewater38
is possible for saving drinking water, but wastewater treatment requires energy for pumping39
and aeration and needs to be optimized (Vergine et al., 2017; Miller-Robbie et al., 2017). Using40
greenhouses increases the productivity and quality in agriculture because lighting, ventilation,41
temperature, and watering can be adjusted to the cultivars and external conditions (Jat et al.,42
2020).43
A very efficient strategy to increase food availability is the protection of harvested products44
against insect infestation and spoilage. In tropical areas, losses ofmore than half of storedmaize45
grains due to insect pests are possible. Adapted plant genotypes, agrochemicals can minimize46
those, and improved storage strategies (López-Castillo et al., 2018). Hermetically closed metal47
containers efficiently reduce insect-related postharvest losses (Garćia-Lara et al., 2007; Tefera48
et al., 2011). Besides, adequate storage conditions, i.e., light, temperature, and humidity, pro-49
long the shelf-life of human and animal food (Bradford et al., 2018). Some perishable food50
products require cooling during the complete production and distribution chain (Mercier et al.,51
2017). Cooling facilities - such as air conditioning, refrigerated trucks, fridges, and freezers -52
are primary drivers of industrial and domestic energy consumption, though (She et al., 2018).53
Air temperature, relative humidity, and barometric pressure are main physical parameters54
for assessingweather and climate, and have direct effects on human health, ecology and agricul-55
ture (Fagerlund et al., 2019; Villalobos et al., 2016; Yu et al., 2018;Adejuwon andAgundiminegha,56
2019). Novel machine/deep learning algorithms for developing predictive weather and climate57
models rely onmassive global datasets (Dueben and Bauer, 2018; Scher, 2018; Racah et al., 2017).58
On the other hand, local meteorological information is essential for evaluating microclimates59
and for optimizing farming (Shock et al., 2016; Luwesi et al., 2017). Air temperature and humid-60
ity also influence the emission of volatile organic compounds (VOC) from factories and building61
materials and the perceived indoor air quality (Haghighat and De Bellis, 1998; Wolkoff, 1998;62
Fang et al., 1999; Milota and Lavery, 2003; Fechter et al., 2006; Wolkoff and Kjærgaard, 2007; Liu63
et al., 2014).64
2/25

Smart farming uses soil data such as structure, composition, moisture, salinity, cation ex-65
change capacity (CEC), and pH to optimize production (Corwin et al., 2003; Grisso et al., 2005;66
Ould Ahmed et al., 2010). Gathering highly localized data is crucial for the precise control of67
ideal plant growth conditions. Therefore, a well-equipped greenhouse could contain hundreds68
of sensors that are connected to a central control unit (Chaudhary et al., 2011).69
Industrial farming already uses Internet-of-Things (IoT) systems for increasing productivity70
and efficiency. The EuropeanUnion supports the development of IoT technology for the agricul-71
tural and food sector with the project Internet of Food and Farm 2020 (https://www.iof2020.eu).72
However, for small stakeholders in developing countries, such commercial agriculture 4.0 tech-73
nology is usually out-of-reach, despite its tremendous potential in environmental protection74
and food production, especially in vulnerable regions (Antony et al., 2020; Luthra et al., 2018).75
Further, most industry-grade IoT systems are built on proprietary hardware and software and76
require specialists for their operation and adaptations.77
Initiatives such as the Public Lab (https://publiclab.org) and Lab On The Cheap (https:78
//www.labonthecheap.com) (Gibney, 2016), in contrast, promote the community-driven devel-79
opment of open technology. Such low-cost and do-it-yourself (DIY) devices are not only suit-80
able for crowd-sourcing data in so-called citizen science (Dickinson et al., 2012), but also state-81
of-the-art research in the instrumental analysis (Martínez-Jarquín et al., 2016; Rosas-Román82
et al., 2020). Environmental sensing projects often use simple microcontroller boards such as83
Arduino (https://www.arduino.cc) and Wemos (https://www.wemos.cc) variants. The Cave84
Pearl Data Logger demonstrates that such devices can operate under harsh conditions (underwa-85
ter) for more than one year on 3 × A.A. battery power (Beddows and Mallon, 2018). The So-86
lar Powered WiFi Weather Station v 2.0 (https://www.instructables.com/id/Solar-Powered-87
WiFi-Weather-Station-V20/) uses a Wemos board and connects wirelessly to Blynk (https:88
//blynk.io), ThingSpeak (https://thingspeak.com), or an IoT MQTT (https://mqtt.org)89
broker. Many of such excellent community projects on environmental monitoring have been90
reported. However, reproducing DIY devices requires technical skills, and integrating the sen-91
sors into a professional IoT framework is too challenging for end-users.92
TheMeteoMex project (http://www.meteomex.com) provides an open IoT infrastructure for93
environmental monitoring, which is scalable, flexible, and suitable for non-experts.94
3/25
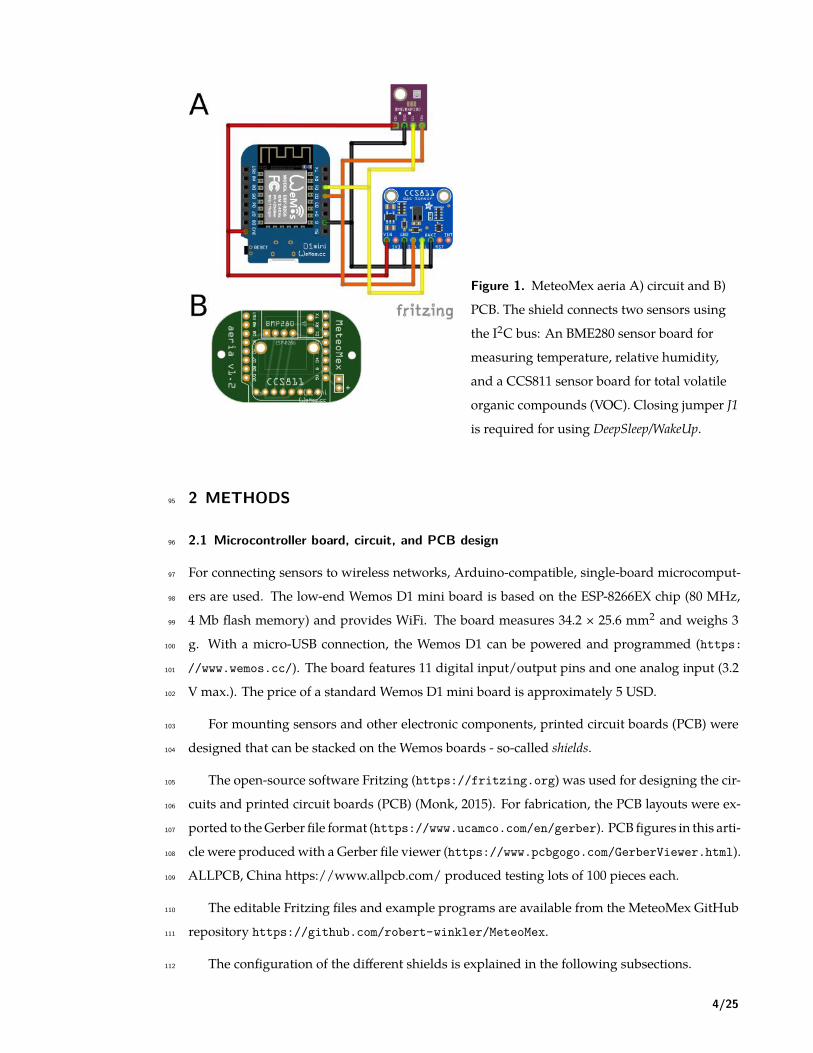
Figure 1. MeteoMex aeria A) circuit and B)
PCB. The shield connects two sensors using
the I2C bus: An BME280 sensor board for
measuring temperature, relative humidity,
and a CCS811 sensor board for total volatile
organic compounds (VOC). Closing jumper J1
is required for using DeepSleep/WakeUp.
2 METHODS95
2.1 Microcontroller board, circuit, and PCB design96
For connecting sensors to wireless networks, Arduino-compatible, single-board microcomput-97
ers are used. The low-end Wemos D1 mini board is based on the ESP-8266EX chip (80 MHz,98
4 Mb flash memory) and provides WiFi. The board measures 34.2 × 25.6 mm2 and weighs 399
g. With a micro-USB connection, the Wemos D1 can be powered and programmed (https:100
//www.wemos.cc/). The board features 11 digital input/output pins and one analog input (3.2101
V max.). The price of a standard Wemos D1 mini board is approximately 5 USD.102
For mounting sensors and other electronic components, printed circuit boards (PCB) were103
designed that can be stacked on the Wemos boards - so-called shields.104
The open-source software Fritzing (https://fritzing.org) was used for designing the cir-105
cuits and printed circuit boards (PCB) (Monk, 2015). For fabrication, the PCB layouts were ex-106
ported to theGerber file format (https://www.ucamco.com/en/gerber). PCBfigures in this arti-107
cle were producedwith a Gerber file viewer (https://www.pcbgogo.com/GerberViewer.html).108
ALLPCB, China https://www.allpcb.com/ produced testing lots of 100 pieces each.109
The editable Fritzing files and example programs are available from the MeteoMex GitHub110
repository https://github.com/robert-winkler/MeteoMex.111
The configuration of the different shields is explained in the following subsections.112
4/25

Figure 2. MeteoMex terra A) circuit and B)
PCB. The connection of one analog soil
moisture and one digital DS18B20
temperature sensor is possible. A 10 kΩpull-up resistor is necessary for temperature
measurement. The jumper J1 is used for
programming DeepSleep/WakeUp.
2.1.1 MeteoMex aeria113
TheMeteoMex aeria (Fig. 1) shield uses a Bosch BME280 chip (https://www.bosch-sensortec.114
com/products/environmental-sensors/humidity-sensors-bme280/) tomonitor the ambient115
air parameters temperature, relative humidity, and barometric pressure.116
Anadditional CCS811 sensor (https://www.sciosense.com/products/environmental-sensors/117
ccs811-gas-sensor-solution/), permits the detection of total volatile organic compounds118
(VOC). Both chips use the I2C bus for sensor data transfer. If the board is powered by batteries,119
programming aDeepSleepmode is recommendable for reducing the energy consumption in idle120
mode. For waking up the Wemos D1 mini, the jumper J1 must be closed.121
2.1.2 MeteoMex terra122
TheMeteoMex terra (Fig. 2) shield is designed to connect an analog sensor, such as a conductive123
or capacitive soil moisture sensor, and a digital DS18B20 temperature sensor. For operating the124
DS18B20 sensor, a pull-up resistor of 10 kΩ (R1) is required.125
The power supply of the analog anddigital sensor is connected to the pinsD1 andD3, respec-126
tively. However, some analog sensors require a connection to the 5V pin for reliable operation.127
This board as well provides a J1 option.128
2.1.3 MeteoMex WasteWater prototype129
The MeteoMex WasteWater (Fig. 3) configuration is a slight variation of the terra circuit. An130
analog Arduino turbidity sensor is used for measuring total suspended solids (TSS). For deter-131
mining tank filling levels, a Jsn-sr04t waterproof ultrasonic sensor is connected. Both sensors132
operate on 5 V. For this custom design, no PCB was printed, but the circuit was built on a Perf-133
board.134
All boards were designed for the use of through-hole electronic components for facilitating135
5/25
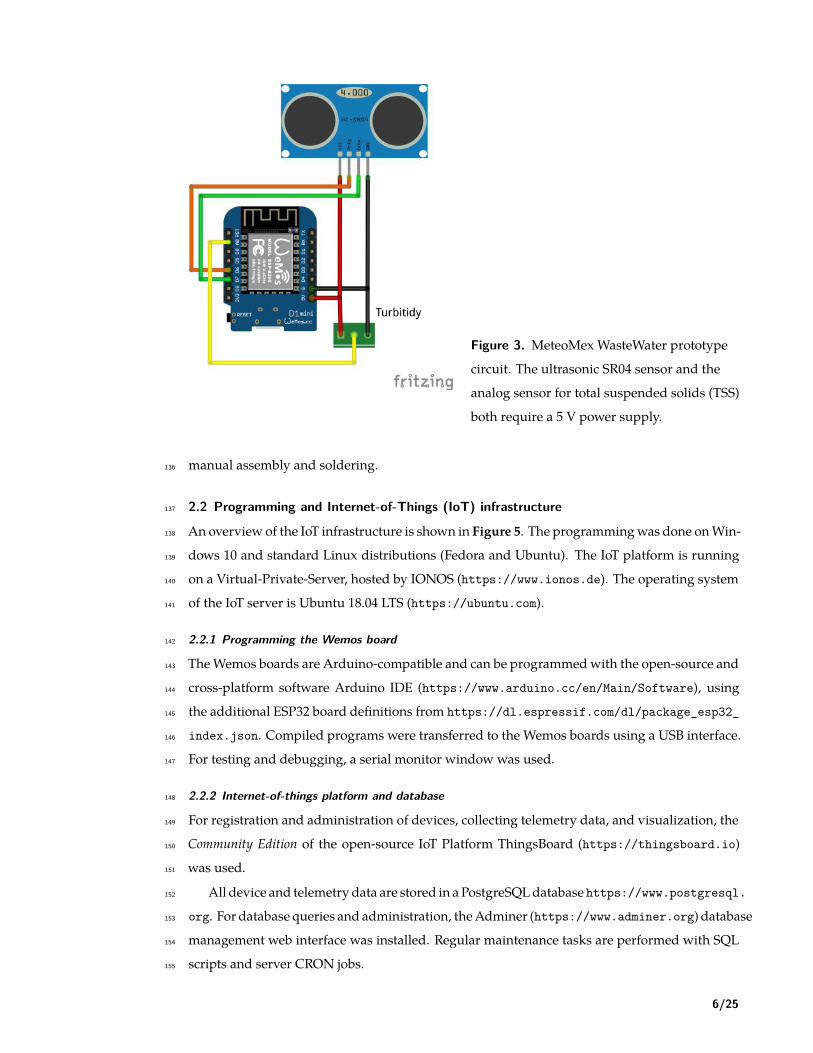
Figure 3. MeteoMex WasteWater prototype
circuit. The ultrasonic SR04 sensor and the
analog sensor for total suspended solids (TSS)
both require a 5 V power supply.
manual assembly and soldering.136
2.2 Programming and Internet-of-Things (IoT) infrastructure137
An overview of the IoT infrastructure is shown in Figure 5. The programmingwas done onWin-138
dows 10 and standard Linux distributions (Fedora and Ubuntu). The IoT platform is running139
on a Virtual-Private-Server, hosted by IONOS (https://www.ionos.de). The operating system140
of the IoT server is Ubuntu 18.04 LTS (https://ubuntu.com).141
2.2.1 Programming the Wemos board142
TheWemos boards are Arduino-compatible and can be programmedwith the open-source and143
cross-platform software Arduino IDE (https://www.arduino.cc/en/Main/Software), using144
the additional ESP32 board definitions from https://dl.espressif.com/dl/package_esp32_145
index.json. Compiled programs were transferred to the Wemos boards using a USB interface.146
For testing and debugging, a serial monitor window was used.147
2.2.2 Internet-of-things platform and database148
For registration and administration of devices, collecting telemetry data, and visualization, the149
Community Edition of the open-source IoT Platform ThingsBoard (https://thingsboard.io)150
was used.151
All device and telemetry data are stored in a PostgreSQLdatabase https://www.postgresql.152
org. For database queries and administration, theAdminer (https://www.adminer.org) database153
management web interface was installed. Regular maintenance tasks are performed with SQL154
scripts and server CRON jobs.155
6/25

2.3 Housing and power supply156
MeteoMex kits provide no housing by default, which saves costs and reduces unnecessary plas-157
tics waste. The circuits operate at low voltages (5 V), why the devices are safe for humans and158
animals. For indoor air monitoring, the devices can be simply connected to a USB power supply159
(Fig. 4 A). For outdoor conditions, the protection against dust, insects, and water might be nec-160
essary (Fig. 4 B-E). However, re-used plastic beakers, e.g., from dairy products, usually fulfill161
this purpose.162
Alternatively, to USB port power, the devices can be operated with 3 × A.A. rechargeable163
batteries or with solar panels and a power bank. Programming a DeepSleep/WakeUp routine, a164
MeteoMex aeria device with BME280 sensor works about three months with 3 × A.A. recharge-165
able batteries. However, additional electronic components and accumulators have a negative166
impact on the system’s environmental footprint.167
The building of the device and housing shown in Figure 4 E is described in an Instructable168
(https://www.instructables.com/member/RobertWinkler/instructables/).169
2.4 Availability of MeteoMex kits and code170
Additional documentation for building and programming the devices and kits are available171
from theMeteoMex project page http://www.meteomex.com. PCB Fritzing layouts and code ex-172
amples are deposited at theGitHub repository (https://github.com/robert-winkler/MeteoMex)173
with open license terms.174
7/25

Figure 4. Different housing and power supply options: A) No housing and direct powering
with USB charger, B) 3 × AA rechargeable batteries in commercial enclosure, C) Solar panel
and lithium battery with wet room installation box, D) and E) Re-use of plastic beakers.
8/25
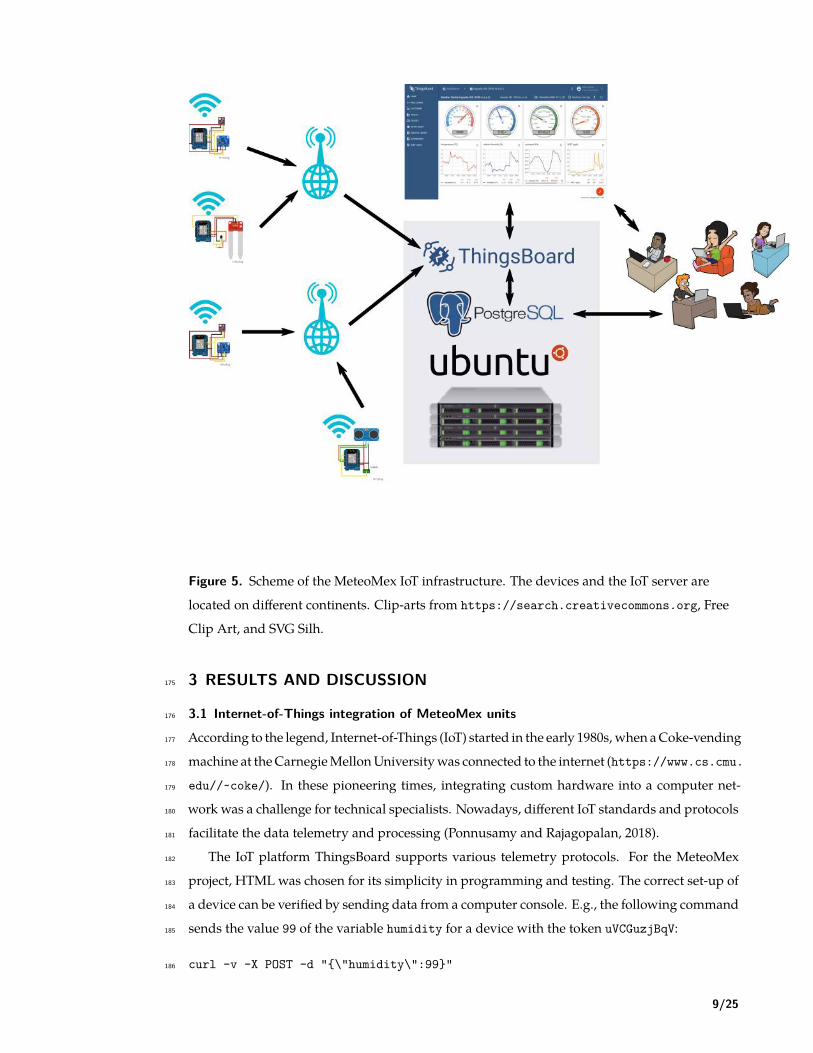
Figure 5. Scheme of the MeteoMex IoT infrastructure. The devices and the IoT server are
located on different continents. Clip-arts from https://search.creativecommons.org, Free
Clip Art, and SVG Silh.
3 RESULTS AND DISCUSSION175
3.1 Internet-of-Things integration of MeteoMex units176
According to the legend, Internet-of-Things (IoT) started in the early 1980s, when aCoke-vending177
machine at theCarnegieMellonUniversitywas connected to the internet (https://www.cs.cmu.178
edu//~coke/). In these pioneering times, integrating custom hardware into a computer net-179
work was a challenge for technical specialists. Nowadays, different IoT standards and protocols180
facilitate the data telemetry and processing (Ponnusamy and Rajagopalan, 2018).181
The IoT platform ThingsBoard supports various telemetry protocols. For the MeteoMex182
project, HTML was chosen for its simplicity in programming and testing. The correct set-up of183
a device can be verified by sending data from a computer console. E.g., the following command184
sends the value 99 of the variable humidity for a device with the token uVCGuzjBqV:185
curl -v -X POST -d "{\"humidity\":99}"186
9/25

http://www.meteomex.com:8080/api/v1/uVCGuzjBqV/telemetry187
--header "Content-Type:application/json"188
Wemos boards also could be connected to other IoT platforms. The integration into Blynk189
(https://blynk.io) and Thinger.io (https://thinger.io) was successful. But apart from190
technical questions, the licensing scheme of IoT platforms is relevant. ThingsBoard (https://191
thingsboard.io) is licensedunder theApache 2.0 license (https://www.apache.org/licenses/192
LICENSE-2.0). I.e., besides being open-source, ThingsBoard offers a free Community Edition193
and allows its employment in commercial applications. ThingsBoard is cross-platform compat-194
ible and can be installed on Windows, Mac, and Linux (https://thingsboard.io/docs/user-195
guide/install/installation-options/). The system used in this study was installed on196
Ubuntu 18.04 LTS (https://ubuntu.com). The computational capacity of the Virtual-Private-197
Server, hosted by IONOS (https://www.ionos.de), can be adjusted to the IoT server load. How-198
ever, the installation of a ThingsBoard Community Edition IoT server is possible at no software199
cost.200
The open-source PostgreSQL (https://www.postgresql.org) database server for storing201
the IoT data has high performance and robustness. Database maintenance and data manip-202
ulation are possible with system tools and external programs. Exported data can be further203
analyzed, e.g., with statistics and data mining software, such as R/Rattle (https://rattle.204
togaware.com) (Williams, 2011).205
Transferring data with radio frequency (R.F.) and Bluetooth was tried as well. However,206
the direct connection of the devices to WiFi networks turned out the technically easiest solu-207
tion. WiFi networks are ubiquitously available, of fair security, and no additional adaptors are208
necessary to send collected data to the internet.209
The ThingsBoard dashboards are visualized on a standard web browser, making it compat-210
ible with standard personal computers and mobile devices. The web platform also permits the211
setting-up of data processing pipelines, the IoT Rule Engine, and the definition of alarm levels212
and actions.213
At the time of writing this manuscript, the IoT server was running for more than 180 days214
without interruption, demonstrating technical robustness. Although the IoT server was located215
in Germany, and the sensor units in Mexico, no telemetry data transfer problems were notice-216
able. Local power cuts or internet failures only affect devices in a particular zone. Since the217
wireless network settings are saved to the ESP8266 flash memory, the Wemos boards reconnect218
when rebooting.219
Thus, the overall infrastructure takes into account the main aspects of an IoT system for agri-220
culture (Elijah et al., 2018), such as cost, simple and robust technology, localization, scalability,221
and interoperability. Open licenses of hardware and software, and the use of common stan-222
dards (WiFi network, HTML telemetry, SQL database) assure a long-term, cost-efficient, and223
10/25
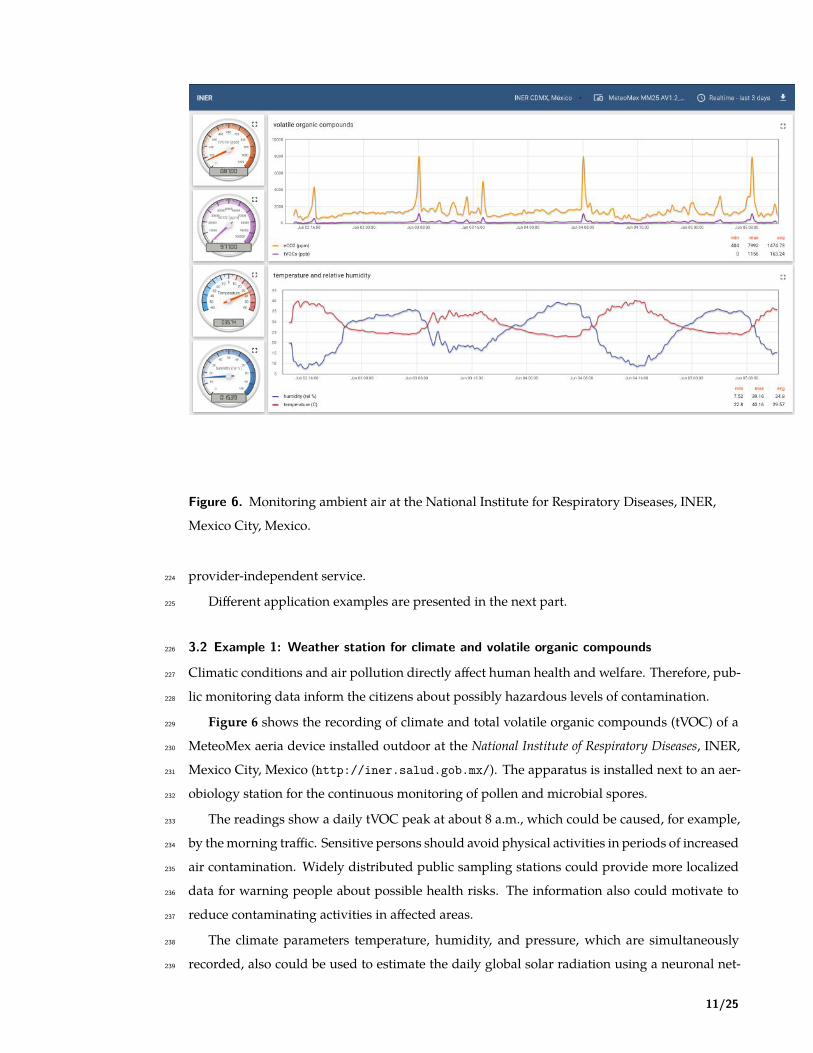
Figure 6. Monitoring ambient air at the National Institute for Respiratory Diseases, INER,
Mexico City, Mexico.
provider-independent service.224
Different application examples are presented in the next part.225
3.2 Example 1: Weather station for climate and volatile organic compounds226
Climatic conditions and air pollution directly affect human health and welfare. Therefore, pub-227
lic monitoring data inform the citizens about possibly hazardous levels of contamination.228
Figure 6 shows the recording of climate and total volatile organic compounds (tVOC) of a229
MeteoMex aeria device installed outdoor at the National Institute of Respiratory Diseases, INER,230
Mexico City, Mexico (http://iner.salud.gob.mx/). The apparatus is installed next to an aer-231
obiology station for the continuous monitoring of pollen and microbial spores.232
The readings show a daily tVOC peak at about 8 a.m., which could be caused, for example,233
by themorning traffic. Sensitive persons should avoid physical activities in periods of increased234
air contamination. Widely distributed public sampling stations could provide more localized235
data for warning people about possible health risks. The information also could motivate to236
reduce contaminating activities in affected areas.237
The climate parameters temperature, humidity, and pressure, which are simultaneously238
recorded, also could be used to estimate the daily global solar radiation using a neuronal net-239
11/25

Figure 7. Monitoring the air and soil parameters in a domestic greenhouse.
work model (Jimenez et al., 2016).240
3.3 Example 2: Greenhouse monitoring (air and soil)241
For the optimal growth of plants, adequate air and soil conditions are essential. The conduc-242
tivity and the dielectric properties of soil depend on its composition, structure, moisture, and243
salinity (SREENIVAS et al., 1995;Malicki andWalczak, 1999;Wang and Schmugge, 1980). Those244
can be easily measured, and it was shown that soil electrical conductivity measurements corre-245
late with Local yield (Grisso et al., 2005).246
The MeteoMex terra device uses either conductive or capacitive probes to estimate the soil247
moisture. The capacitive probes are protected against corrosion and, therefore, preferable. Since248
the analogous measurement only provides an integer value between 0 and 1024, the signal249
needs to be calibrated. Figure 7 shows on the left side, the air data, and on the right side, the250
soil data, which are measured hourly in a domestic greenhouse with automated irrigation. The251
capacitive soil moisture sensor was calibrated to 0-100% with purified water. The actual sensor252
readings range between 110-124%, which reflects the dielectric properties of soil.253
The average soil temperature of about 22 °C is ~8 K lower than the air temperature, demon-254
strating the heat capacity and temperature buffer properties of the soil. Besides, the temperature255
variations during the day are ~15 K for air and ~7 K in the soil.256
12/25
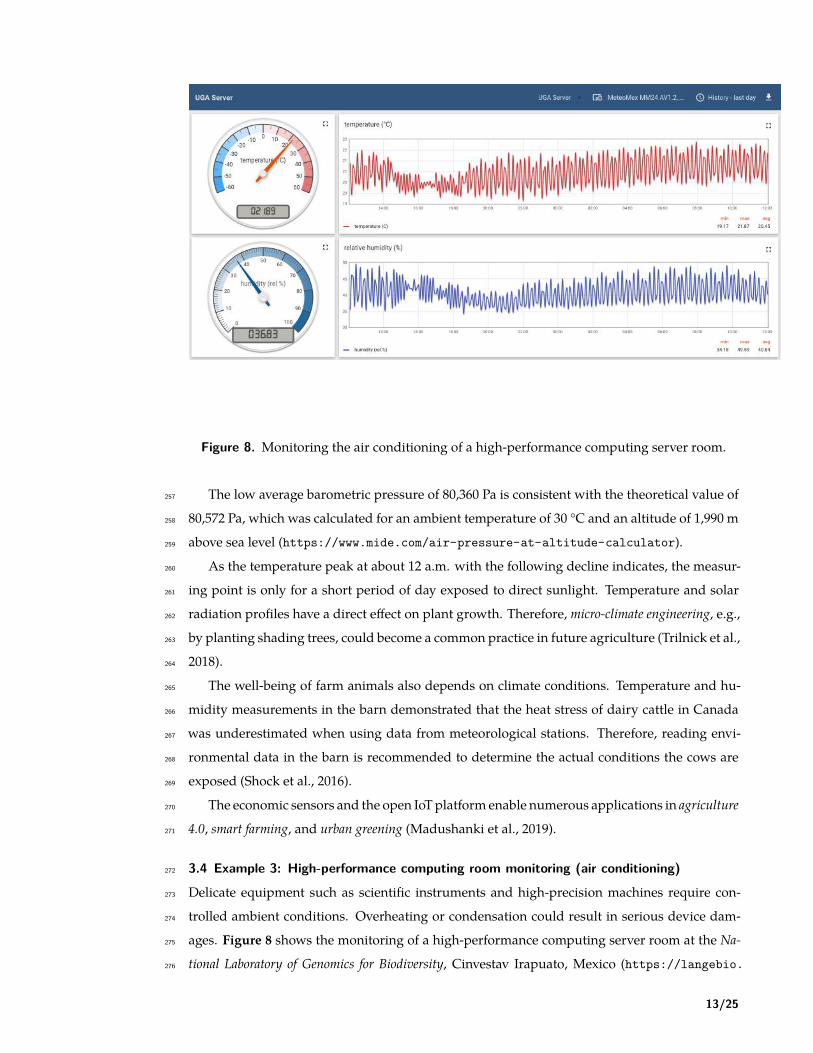
Figure 8. Monitoring the air conditioning of a high-performance computing server room.
The low average barometric pressure of 80,360 Pa is consistent with the theoretical value of257
80,572 Pa, which was calculated for an ambient temperature of 30 °C and an altitude of 1,990 m258
above sea level (https://www.mide.com/air-pressure-at-altitude-calculator).259
As the temperature peak at about 12 a.m. with the following decline indicates, the measur-260
ing point is only for a short period of day exposed to direct sunlight. Temperature and solar261
radiation profiles have a direct effect on plant growth. Therefore, micro-climate engineering, e.g.,262
by planting shading trees, could become a common practice in future agriculture (Trilnick et al.,263
2018).264
The well-being of farm animals also depends on climate conditions. Temperature and hu-265
midity measurements in the barn demonstrated that the heat stress of dairy cattle in Canada266
was underestimated when using data from meteorological stations. Therefore, reading envi-267
ronmental data in the barn is recommended to determine the actual conditions the cows are268
exposed (Shock et al., 2016).269
The economic sensors and the open IoT platform enable numerous applications in agriculture270
4.0, smart farming, and urban greening (Madushanki et al., 2019).271
3.4 Example 3: High-performance computing room monitoring (air conditioning)272
Delicate equipment such as scientific instruments and high-precision machines require con-273
trolled ambient conditions. Overheating or condensation could result in serious device dam-274
ages. Figure 8 shows the monitoring of a high-performance computing server room at the Na-275
tional Laboratory of Genomics for Biodiversity, Cinvestav Irapuato, Mexico (https://langebio.276
13/25

Figure 9. Monitoring tank filling level and turbidity in a domestic wastewater plant.
cinvestav.mx). The charts demonstrate a tight temperature control with an average tempera-277
ture of 20.45 °C and less than 1.5 K variation.278
The constant monitoring of ambient conditions also helps to detect potentials for energy279
savings, such as changing the settings of an air conditioning system at night, or during periods280
of inactivity.281
3.5 Example 4: Domestic Wastewater plant282
Using treated wastewater for irrigation saves sweet water reserves in dry areas. Figure 9 shows283
the block chart of a domestic wastewater treatment plant. The activated sludge process for reduc-284
ing organic soluble solids by microbes requires aeration. This aeration step and the pumping285
for filtration and irrigation require electric energy. The food-energy-water nexus describes the286
strong interconnection between these resources (D’Odorico et al., 2018).287
The presented facility uses photovoltaic energy. For saving electricity, the aeration is not288
operated continuously, but only during the daytime, and in half-hour intervals. The quality289
of the treated water needs to monitored to avoid either over-purification (wasting energy) or290
insufficient purification (clogging filters). In addition, the irrigation scheme has to be adjusted291
to the generation of treated water. Unused treated water passes through an overflow-pipe to292
the public sewer and is lost for irrigation.293
The MeteoMex WasteWater prototype (Fig. 3 and 10) has two sensors: An analog Arduino294
turbidity sensor for measuring total suspended solids (TSS), and an ultrasonic distance sensor295
for estimating the tank filling. TheWemos board and the sensors are located inside the wastew-296
ater treatment plant, which is built from ferroconcrete. Thus, a direct WiFi connection to the297
wireless network is not possible. Thus, a Wemos D1 mini Pro board with an external antenna298
14/25

Figure 10. Installation of the MeteoMex WasteWater prototype in the domestic wastewater
plant. A) Connection of the sensors to the custom-built Wemos shield, B) the turbidity sensor
is stuck into a piece of styrofoam for floating, C) protection of the Wemos board against
rainwater by a plastic beaker, and external antenna, D) control board for wastewater treatment
and irrigation; the power supply with blue light provides the energy for the Wemos board, E)
outside view of the wastewater plant.
15/25
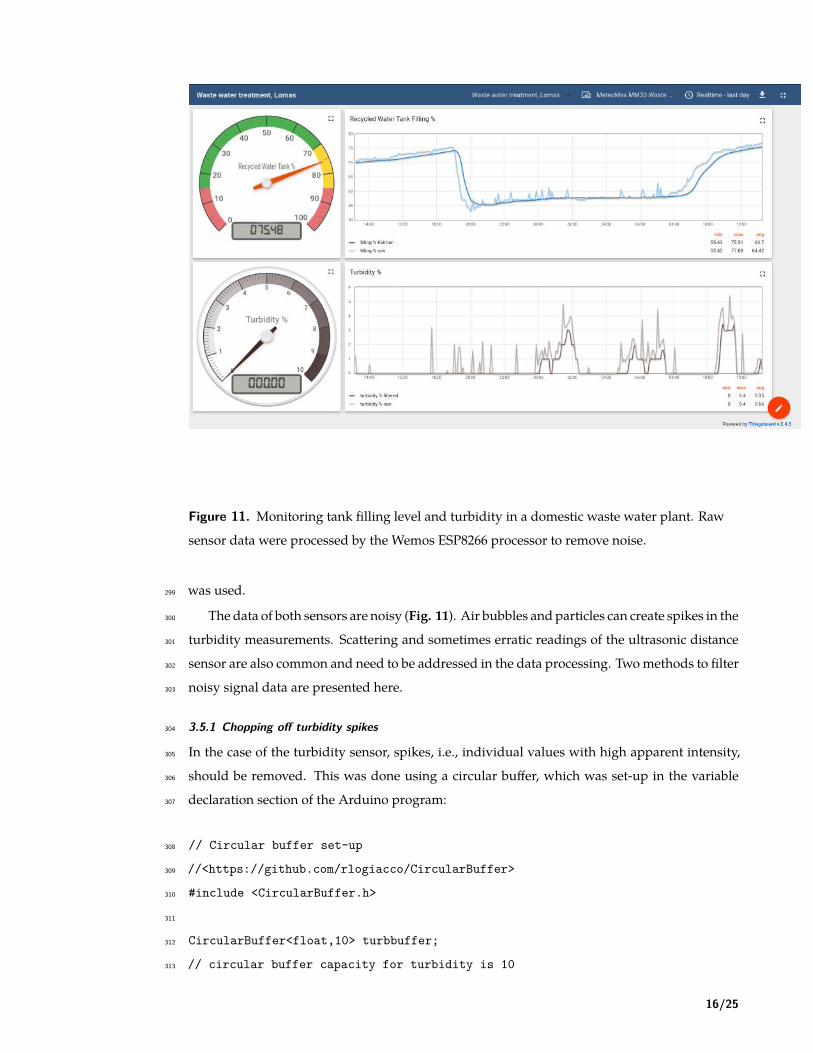
Figure 11. Monitoring tank filling level and turbidity in a domestic waste water plant. Raw
sensor data were processed by the Wemos ESP8266 processor to remove noise.
was used.299
The data of both sensors are noisy (Fig. 11). Air bubbles and particles can create spikes in the300
turbidity measurements. Scattering and sometimes erratic readings of the ultrasonic distance301
sensor are also common and need to be addressed in the data processing. Twomethods to filter302
noisy signal data are presented here.303
3.5.1 Chopping off turbidity spikes304
In the case of the turbidity sensor, spikes, i.e., individual values with high apparent intensity,305
should be removed. This was done using a circular buffer, which was set-up in the variable306
declaration section of the Arduino program:307
// Circular buffer set-up308
//<https://github.com/rlogiacco/CircularBuffer>309
#include <CircularBuffer.h>310
311
CircularBuffer<float,10> turbbuffer;312
// circular buffer capacity for turbidity is 10313
16/25

In the program loop, the minimum value of the last ten readings is determined:314
//Turbidity315
int turbSensor = analogRead(17);316
float turbpercent = map(turbSensor,1024,0,0,100);317
318
turbbuffer.push(turbpercent);319
320
float turbpercentmin = 100;321
using index_t = decltype(turbbuffer)::index_t;322
for (index_t i = 0; i < turbbuffer.size(); i++) {323
if (turbbuffer[i] < turbpercentmin) {324
turbpercentmin = turbbuffer[i];}325
}326
The reported turbidity is slightly underestimating the real value, and the measurement is327
more sluggish than using the raw readings. However, the spikes are removed efficiently, and328
the filtered data are more robust, which is importing, for example, for setting an automated329
alarm level.330
3.5.2 Kalman filter for tank level readings331
Correcting the readings of the ultrasonic sensor is more complex since random deviations can332
be in both directions. Thus a Kalman-Filter was used forminimizing estimation errors (Kalman,333
1960; Simon, 2001).334
The respective Arduino library is included in the variable declaration section:335
// Kalman Filter library336
//<https://github.com/denyssene/SimpleKalmanFilter>337
#include <SimpleKalmanFilter.h>338
SimpleKalmanFilter ultrasonicKalmanFilter(1, 1, 0.01);339
The filling level is calculated from the reading of the ultrasonic sensor SR04 and the tank340
dimensions (for details see the program in the GitHub repository).341
float fillpercent = 100 * (1-((distance-47.5)/120));342
343
// apply Kalman filter344
float fill_estimate = ultrasonicKalmanFilter.updateEstimate(fillpercent);345
Although the maths behind the Kalman filter is not trivial, it could be easily implemented,346
and the performance of the ESP8266 is sufficient for real-time signal processing.347
17/25
4 SUSTAINABILITY AND SOCIO-ECONOMIC IMPACT348
As for any technology, the possible negative aspects of its adoption need to be discussed. IoT349
devices consume energy for themselves and for the data transfer and processing infrastructure.350
Further, their production consumes resources, and at the end of their life-time, they generate351
electronic waste (https://whatis5g.info/). Additional environmental issues arise when the352
devices are powered with batteries.353
On the other side, the IoT technology can significantly contribute to saving natural resources354
(see examples above). The energy consumption of the presented domestic wastewater treat-355
ment plant (Example 4, section 3.5) is several kWh/day, compared to only someWh/day of the356
MeteoMex device. The energy demand of the IoT equipment corresponds to about 0.1% and357
enables the continuous monitoring and optimization of the plant. Even little improvements in358
the wastewater treatment and irrigation process that reduce the energy consumption by a few359
percent justify the environmental and economic cost of the IoT integration.360
In other cases, the IoT devices could be mobile and only connected for project-specific tasks,361
e.g., for determining the day-night temperature profile of a production facility.362
Sustainabilitywas a central design goal of the complete platform. The used boards are highly363
integrated and provide the necessary computation and networking functions with a minimum364
of material (3 g for a complete Wemos D1 mini board) and energy. WiFi technology and 5 V365
USB power supplies are globally available, and no special adaptors are necessary.366
Importantly, the low cost of the hardware components and the permissive licenses for all367
parts of the infrastructure - circuit and PCB board design, database, and IoT platform - make368
the adoption of an IoT system in marginal production sites feasible. Further, weather enthusi-369
asts and environmental activists could form networks for regional and global data collection.370
The program code can be re-used by the community, e.g., to integrate more sensors and for371
education.372
5 CONCLUSIONS373
The MeteoMex project aims towards a community-driven Internet-of-Things (IoT) framework.374
Despite the use of basic hardware components and free software, the infrastructure reaches375
professional-grade performance and robustness.376
Monitoring the environmental parameters helps to protect natural resources (water and en-377
ergy), to timely detect health-hazards, and to increase the production of high-quality food. New,378
data-driven strategies for food production, such as micro-climate engineering, smart farming, and379
precision agriculture - here summarized as agriculture 4.0 require highly localized data. Collect-380
ing the readings of multiple simple sensors could provide more useful information than high-381
resolution data from sparse measurement stations. The presented IoT infrastructure is highly382
18/25
scalable and can process telemetry data from few to thousands of sensor units.383
An essential characteristic of this IoT system is the availability of electronic circuit designs384
and PCB layouts, program codes, and software under open-source licenses. Further, existing385
infrastructure such as WiFi networks is used to improve the economic and environmental sus-386
tainability. The IoT users are not locked in within a proprietary technology, but free to choose387
frommultiple vendors, if they need replacement parts or technical service. The comprehensive388
documentation and the availability of PCB shields for frequently needed set-ups facilitate the389
do-it-yourself (DIY) assembly of IoT units. Additional sensors can be easily integrated due to390
the flexible and modular design of hardware and software.391
6 ACKNOWLEDGMENTS392
I thank the engineers of ThingsBoard for technical advice, and Dr. Cei Abreu (National Labora-393
tory of Genomics for Biodiversity, UGA/Langebio, Cinvestav Irapuato, Mexico) and Dr. Josaphat394
Montero-Vargas (National Institute for Respiratory Diseases, INER, Mexico City, Mexico) for pro-395
viding sensor data. Equipment and material for the study were provided by Kuturabi S.A. de396
C.V. The funding had no influence on study design, data collection, and interpretation, or the397
decision to write this article.398
7 CONFLICTS OF INTEREST399
RW is a shareholder of the company Kuturabi S.A. de C.V.400
REFERENCES401
Adejuwon, J. O. and Agundiminegha, Y. G. (2019). Impact of climate variability on cassava402
yield in the humid forest agro-ecological zone of Nigeria. Journal of Applied Sciences and Envi-403
ronmental Management, 23(5):903–908. Number: 5.404
Antony, A. P., Leith, K., Jolley, C., Lu, J., and Sweeney, D. J. (2020). A Review of Practice and405
Implementation of the Internet of Things (IoT) for Smallholder Agriculture. Sustainability,406
12(9):3750. Number: 9 Publisher: Multidisciplinary Digital Publishing Institute.407
Beddows, P. A. and Mallon, E. K. (2018). Cave Pearl Data Logger: A Flexible Arduino-Based408
Logging Platform for Long-Term Monitoring in Harsh Environments. Sensors, 18(2):530.409
Bradford, K. J., Dahal, P., Van Asbrouck, J., Kunusoth, K., Bello, P., Thompson, J., and Wu, F.410
(2018). The dry chain: Reducing postharvest losses and improving food safety in humid411
climates. Trends in Food Science & Technology, 71:84–93.412
Chaudhary, D. D., Nayse, S. P., and Waghmare, L. M. (2011). Application of Wireless Sensor413
Networks for Greenhouse Parameter Control in Precision Agriculture. International Journal of414
Wireless & Mobile Networks (IJWMN), 3(1).415
19/25
Cohen, A. J., Brauer, M., Burnett, R., Anderson, H. R., Frostad, J., Estep, K., Balakrishnan, K.,416
Brunekreef, B., Dandona, L., Dandona, R., Feigin, V., Freedman, G., Hubbell, B., Jobling, A.,417
Kan, H., Knibbs, L., Liu, Y., Martin, R., Morawska, L., Pope, C. A., Shin, H., Straif, K., Shad-418
dick, G., Thomas, M., van Dingenen, R., van Donkelaar, A., Vos, T., Murray, C. J. L., and419
Forouzanfar, M. H. (2017). Estimates and 25-year trends of the global burden of disease at-420
tributable to ambient air pollution: an analysis of data from the Global Burden of Diseases421
Study 2015. The Lancet, 389(10082):1907–1918.422
Corwin, D. L., Lesch, S. M., Shouse, P. J., Soppe, R., and Ayars, J. E. (2003). Iden-423
tifying Soil Properties that Influence Cotton Yield Using Soil Sampling Directed by424
Apparent Soil Electrical Conductivity. Agronomy Journal, 95(2):352–364. _eprint:425
https://acsess.onlinelibrary.wiley.com/doi/pdf/10.2134/agronj2003.3520.426
Dell’Angelo, J., Rulli, M. C., and D’Odorico, P. (2018). The Global Water Grabbing Syndrome.427
Ecological Economics, 143:276–285.428
Dickinson, J. L., Shirk, J., Bonter, D., Bonney, R., Crain, R. L., Martin, J., Phillips, T., and429
Purcell, K. (2012). The current state of citizen science as a tool for ecological research430
and public engagement. Frontiers in Ecology and the Environment, 10(6):291–297. _eprint:431
https://esajournals.onlinelibrary.wiley.com/doi/pdf/10.1890/110236.432
D’Odorico, P., Davis, K. F., Rosa, L., Carr, J. A., Chiarelli, D., Dell’Angelo, J., Gephart,433
J., MacDonald, G. K., Seekell, D. A., Suweis, S., and Rulli, M. C. (2018). The434
Global Food-Energy-Water Nexus. Reviews of Geophysics, 56(3):456–531. _eprint:435
https://agupubs.onlinelibrary.wiley.com/doi/pdf/10.1029/2017RG000591.436
Dueben, P. D. and Bauer, P. (2018). Challenges and design choices for global weather and cli-437
mate models based on machine learning. Geoscientific Model Development, 11(10):3999–4009.438
Publisher: Copernicus GmbH.439
D’Amato, G., Holgate, S. T., Pawankar, R., Ledford, D. K., Cecchi, L., Al-Ahmad, M., Al-Enezi,440
F., Al-Muhsen, S., Ansotegui, I., Baena-Cagnani, C. E., Baker, D. J., Bayram, H., Bergmann,441
K. C., Boulet, L.-P., Buters, J. T. M., D’Amato, M., Dorsano, S., Douwes, J., Finlay, S. E., Garrasi,442
D., Gómez, M., Haahtela, T., Halwani, R., Hassani, Y., Mahboub, B., Marks, G., Michelozzi,443
P., Montagni, M., Nunes, C., Oh, J. J.-W., Popov, T. A., Portnoy, J., Ridolo, E., Rosário, N., Rot-444
tem,M., Sánchez-Borges, M., Sibanda, E., Sienra-Monge, J. J., Vitale, C., andAnnesi-Maesano,445
I. (2015). Meteorological conditions, climate change, new emerging factors, and asthma and446
related allergic disorders. A statement of the World Allergy Organization. World Allergy Or-447
ganization Journal, 8(1):1–52.448
El-Ansary, D. O. (2017). Effects of Pre-Harvest Deficit and Excess Irrigation Water on Vine449
20/25

Water Relations, Productivity and Quality of Crimson Seedless Table Grapes. Journal of Plant450
Production, 8(1):83–92. Publisher: Mansoura University, Faculty of Agriculture.451
Elijah, O., Rahman, T. A., Orikumhi, I., Leow, C. Y., and Hindia, M. N. (2018). An Overview452
of Internet of Things (IoT) and Data Analytics in Agriculture: Benefits and Challenges. IEEE453
Internet of Things Journal, 5(5):3758–3773. Conference Name: IEEE Internet of Things Journal.454
Fagerlund, A. J., Iversen, M., Ekeland, A., Moen, C. M., and Aslaksen, P. M. (2019). Blame it on455
the weather? The association between pain in fibromyalgia, relative humidity, temperature456
and barometric pressure. PLoS ONE, 14(5).457
Fang, L., Clausen, G., and Fanger, P. O. (1999). Impact of Temperature and Humidity on458
Chemical and Sensory Emissions from Building Materials. Indoor Air, 9(3):193–201. _eprint:459
https://onlinelibrary.wiley.com/doi/pdf/10.1111/j.1600-0668.1999.t01-1-00006.x.460
Fechter, J.-O., Englund, F., and Lundin, A. (2006). Association between temperature, relative461
humidity and concentration of volatile organic compounds fromwooden furniture in amodel462
room. Wood Material Science & Engineering, 1(2):69–75. Publisher: Taylor & Francis _eprint:463
https://doi.org/10.1080/17480270600900551.464
Garćia-Lara, S., Saucedo Camarillo, N., and Bergvinson, D. J. (2007). El silo metalico: Manual465
tecnico de fabricacion y manejo. CIMMYT. bibtex: Garcia-Lara2007d.466
Gibney, E. (2016). ‘Open-hardware’ pioneers push for low-cost lab kit. Nature News,467
531(7593):147. Section: News.468
Grisso, R. D. R. D., Alley, M.M., Holshouser, D. L., and Thomason, W. E. (2005). Precision Farm-469
ing Tools. Soil Electrical Conductivity. Accepted: 2015-02-12T21:24:44Z Publisher: Virginia470
Cooperative Extension.471
Haghighat, F. andDe Bellis, L. (1998). Material emission rates: Literature review, and the impact472
of indoor air temperature and relative humidity. Building and Environment, 33(5):261–277.473
Hutchinson, C. (2019). Arid Lands: Today And Tomorrow. Routledge.474
Jat, R., Singh, V. P., and Kumar, V. (2020). Greenhouse cultivation of fruit crops with special475
reference to India: An overview. Journal of Applied and Natural Science, 12(2):252–260. Number:476
2.477
Jimenez, V. A., Barrionuevo, A., Will, A., and Rodríguez, S. (2016). Neural Network for Esti-478
mating Daily Global Solar Radiation Using Temperature, Humidity and Pressure as Unique479
Climatic Input Variables. Smart Grid and Renewable Energy, 07(03):94. Number: 03 Publisher:480
Scientific Research Publishing.481
21/25

Kalman, R. E. (1960). A New Approach to Linear Filtering and Prediction Problems. Journal of482
Basic Engineering, 82(1):35–45. Publisher: American Society of Mechanical Engineers Digital483
Collection.484
King, B. A., Stark, J. C., and Neibling, H. (2020). Potato Irrigation Management. In Stark, J. C.,485
Thornton, M., and Nolte, P., editors, Potato Production Systems, pages 417–446. Springer Inter-486
national Publishing, Cham.487
Lake Iain R., Jones Natalia R., Agnew Maureen, Goodess Clare M., Giorgi Filippo, Hamaoui-488
Laguel Lynda, Semenov Mikhail A., Solomon Fabien, Storkey Jonathan, Vautard Robert, and489
Epstein Michelle M. (2017). Climate Change and Future Pollen Allergy in Europe. Environ-490
mental Health Perspectives, 125(3):385–391. Publisher: Environmental Health Perspectives.491
Liu, C.-C., Chen,W.-H., Yuan, C.-S., and Lin, C. (2014). Multivariate analysis of effects of diurnal492
temperature and seasonal humidity variations by tropical savanna climate on the emissions of493
anthropogenic volatile organic compounds. Science of The Total Environment, 470-471:311–323.494
Luthra, S., Mangla, S. K., Garg, D., and Kumar, A. (2018). Internet of Things (IoT) in Agricul-495
ture Supply ChainManagement: ADeveloping Country Perspective. In Dwivedi, Y. K., Rana,496
N. P., Slade, E. L., Shareef, M. A., Clement, M., Simintiras, A. C., and Lal, B., editors, Emerging497
Markets from a Multidisciplinary Perspective: Challenges, Opportunities and Research Agenda, Ad-498
vances in Theory and Practice of Emerging Markets, pages 209–220. Springer International499
Publishing, Cham.500
Luwesi, C. N., Obando, J. A., and Shisanya, C. A. (2017). The Impact of a Warming Mi-501
cro‐Climate on Muooni Farmers of Kenya. Agriculture, 7(3):20. Number: 3 Publisher: Multi-502
disciplinary Digital Publishing Institute.503
López-Castillo, L. M., Silva-Fernández, S. E., Winkler, R., Bergvinson, D. J., Arnason, J. T., and504
García-Lara, S. (2018). Postharvest insect resistance inmaize. Journal of Stored Products Research,505
77:66–76.506
Madushanki, A. a. R., Halgamuge, M. N., Wirasagoda, W., and Syed, A. (2019). Adoption of507
the Internet of Things (IoT) in Agriculture and Smart Farming towards Urban Greening: A508
Review. Publisher: SCIENCE & INFORMATION SAI ORGANIZATION LTD.509
Malicki, M. A. and Walczak, R. T. (1999). Evaluating soil salinity status from bulk electri-510
cal conductivity and permittivity. European Journal of Soil Science, 50(3):505–514. _eprint:511
https://onlinelibrary.wiley.com/doi/pdf/10.1046/j.1365-2389.1999.00245.x.512
Martínez-Jarquín, S., Moreno-Pedraza, A., Guillén-Alonso, H., andWinkler, R. (2016). Template513
for 3D Printing a Low-Temperature Plasma Probe. Analytical Chemistry, 88(14):6976–6980.514
22/25

Mercier, S., Villeneuve, S., Mondor, M., and Uysal, I. (2017). Time–Temperature515
Management Along the Food Cold Chain: A Review of Recent Developments.516
Comprehensive Reviews in Food Science and Food Safety, 16(4):647–667. _eprint:517
https://onlinelibrary.wiley.com/doi/pdf/10.1111/1541-4337.12269.518
Miller-Robbie, L., Ramaswami, A., andAmerasinghe, P. (2017). Wastewater treatment and reuse519
in urban agriculture: exploring the food, energy, water, and health nexus inHyderabad, India.520
Environmental Research Letters, 12(7):075005. Publisher: IOP Publishing.521
Milota, M. R. and Lavery, M. R. (2003). Temperature and Humidity Effects on Emissions of522
Volatile Organic Compounds from Ponderosa Pine Lumber. Drying Technology, 21(1):165–174.523
Publisher: Taylor & Francis _eprint: https://doi.org/10.1081/DRT-120017289.524
Monk, S. (2015). Fritzing for Inventors: Take Your Electronics Project from Prototype to Product.525
McGraw-Hill Education TAB, New York; Blacklick, 1 edition.526
Ould Ahmed, B. A., Inoue, M., and Moritani, S. (2010). Effect of saline water irrigation and527
manure application on the available water content, soil salinity, and growth of wheat. Agri-528
cultural Water Management, 97(1):165–170.529
Patella, V., Florio, G., Magliacane, D., Giuliano, A., Crivellaro, M. A., Di Bartolomeo, D., Gen-530
ovese, A., Palmieri, M., Postiglione, A., Ridolo, E., Scaletti, C., Ventura, M. T., Zollo, A., and531
Air Pollution and Climate Change Task Force of the Italian Society of Allergology, A. a. C.532
I. S. (2018). Urban air pollution and climate change: “The Decalogue: Allergy Safe Tree” for533
allergic and respiratory diseases care. Clinical and Molecular Allergy, 16(1):20.534
Ponnusamy, K. and Rajagopalan, N. (2018). Internet of Things: A Survey on IoT Protocol Stan-535
dards. In Saeed, K., Chaki, N., Pati, B., Bakshi, S., and Mohapatra, D. P., editors, Progress in536
Advanced Computing and Intelligent Engineering, Advances in Intelligent Systems and Comput-537
ing, pages 651–663, Singapore. Springer.538
Racah, E., Beckham, C., Maharaj, T., Ebrahimi Kahou, S., Prabhat, M., and Pal, C. (2017). Ex-539
tremeWeather: A large-scale climate dataset for semi-supervised detection, localization, and540
understanding of extreme weather events. In Guyon, I., Luxburg, U. V., Bengio, S., Wallach,541
H., Fergus, R., Vishwanathan, S., and Garnett, R., editors, Advances in Neural Information Pro-542
cessing Systems 30, pages 3402–3413. Curran Associates, Inc.543
Rosas-Román, I., Ovando-Vázquez, C., Moreno-Pedraza, A., Guillén-Alonso, H., and Winkler,544
R. (2020). Open LabBot and RmsiGUI: Community development kit for sampling automation545
and ambient imaging. Microchemical Journal, 152:104343.546
Scher, S. (2018). Toward Data-Driven Weather and Climate Forecast-547
ing: Approximating a Simple General Circulation Model With Deep548
23/25
Learning. Geophysical Research Letters, 45(22):12,616–12,622. _eprint:549
https://agupubs.onlinelibrary.wiley.com/doi/pdf/10.1029/2018GL080704.550
She, X., Cong, L., Nie, B., Leng, G., Peng, H., Chen, Y., Zhang, X., Wen, T., Yang, H., and Luo,551
Y. (2018). Energy-efficient and -economic technologies for air conditioning with vapor com-552
pression refrigeration: A comprehensive review. Applied Energy, 232:157–186.553
Shock, D. A., LeBlanc, S. J., Leslie, K. E., Hand, K., Godkin, M. A., Coe, J. B., and Kelton, D. F.554
(2016). Studying the relationship between on-farm environmental conditions and local mete-555
orological station data during the summer. Journal of Dairy Science, 99(3):2169–2179.556
Shrivastava, P. and Kumar, R. (2015). Soil salinity: A serious environmental issue and plant557
growth promoting bacteria as one of the tools for its alleviation. Saudi Journal of Biological558
Sciences, 22(2):123–131.559
Simon, D. (2001). Kalman filtering. Embedded systems programming, 14(6):72–79.560
SREENIVAS, K., VENKATARATNAM, L., and RAO, P. V. N. (1995). Dielectric properties of561
salt-affected soils. International Journal of Remote Sensing, 16(4):641–649. Publisher: Taylor &562
Francis _eprint: https://doi.org/10.1080/01431169508954431.563
Tefera, T., Kanampiu, F., De Groote, H., Hellin, J., Mugo, S., Kimenju, S., Beyene, Y., Boddu-564
palli, P. M., Shiferaw, B., and Banziger, M. (2011). The metal silo: An effective grain storage565
technology for reducing post-harvest insect and pathogen losses in maize while improving566
smallholder farmers’ food security in developing countries. Crop Protection, 30(3):240–245.567
Trilnick, I., Gordon, B., and Zilberman, D. (2018). Micro-Climate Engineering for Climate568
Change Adaptation in Agriculture.569
Vergine, P., Salerno, C., Libutti, A., Beneduce, L., Gatta, G., Berardi, G., and Pollice, A. (2017).570
Closing the water cycle in the agro-industrial sector by reusing treated wastewater for irriga-571
tion. Journal of Cleaner Production, 164:587–596.572
Vermeulen, S. J., Campbell, B. M., and Ingram, J. S. (2012). Climate Change and573
Food Systems. Annual Review of Environment and Resources, 37(1):195–222. _eprint:574
https://doi.org/10.1146/annurev-environ-020411-130608.575
Villalobos, F. J., Mateos, L., Testi, L., and Fereres, E. (2016). Air Temperature and Humidity. In576
Villalobos, F. J. and Fereres, E., editors, Principles of Agronomy for Sustainable Agriculture, pages577
55–67. Springer International Publishing, Cham.578
Wang, J. R. and Schmugge, T. J. (1980). An Empirical Model for the Complex Dielectric Per-579
mittivity of Soils as a Function of Water Content. IEEE Transactions on Geoscience and Remote580
24/25

Sensing, GE-18(4):288–295. Conference Name: IEEE Transactions on Geoscience and Remote581
Sensing.582
Wheeler, T. and Braun, J. v. (2013). Climate Change Impacts on Global Food Security. Science,583
341(6145):508–513. Publisher: American Association for the Advancement of Science Section:584
Review.585
Williams, G. (2011). Data Mining with Rattle and R: The Art of Excavating Data for Knowledge586
Discovery (Use R!). Springer Science + Business Media, New York, NY, USA, 1st edition.587
Wolkoff, P. (1998). Impact of air velocity, temperature, humidity, and air on long-term voc588
emissions from building products. Atmospheric Environment, 32(14):2659–2668.589
Wolkoff, P. andKjærgaard, S. K. (2007). The dichotomy of relative humidity on indoor air quality.590
Environment International, 33(6):850–857.591
Yu, D., Qiao, J., and Shi, P. (2018). Spatiotemporal patterns, relationships, and drivers of China’s592
agricultural ecosystem services from 1980 to 2010: a multiscale analysis. Landscape Ecology,593
33(4):575–595.594
25/25

download fileview on ChemRxivmeteomex-natbib-min.pdf (787.19 KiB)