metatranscriptomic analysis of ectomycorrhizal roots
TRANSCRIPT

Metatranscriptomic analysis of ectomycorrhizal rootsreveals genes associated with Piloderma–Pinussymbiosis: improved methodologies for assessinggene expression in situ
H.-L. Liao,1* Y. Chen,2 T. D. Bruns,3 K. G. Peay,4
J. W. Taylor,3 S. Branco,3 J. M. Talbot4 andR. Vilgalys1
Departments of 1Biology and2Medicine, Duke University, PO box 90338, BiologicalSciences Building, Durham, NC 27708, USA.3Department of Plant and Microbial Biology, Universityof California, Berkeley, CA, USA.4Department of Biology, Stanford University, Stanford,CA, USA.
Summary
Ectomycorrhizal (EM) fungi form symbiotic asso-ciations with plant roots that regulate nutrientexchange between forest plants and soil. Environ-mental metagenomics approaches that employnext-generation sequencing show great promise forstudying EM symbioses; however, metatrans-criptomic studies have been constrained by theinherent difficulties associated with isolation andsequencing of RNA from mycorrhizae. Here we applyan optimized method for combined DNA/RNA ex-traction using field-collected EM fungal–pine rootclusters, together with protocols for taxonomic iden-tification of expressed ribosomal RNA, and inferenceof EM function based on plant and fungalmetatranscriptomics. We used transcribed portionsof ribosomal RNA genes to identify several transcrip-tionally dominant fungal taxa associated with loblollypine including Amphinema, Russula and Pilodermaspp. One taxon, Piloderma croceum, has a publicallyavailable genome that allowed us to identify patternsof gene content and transcript abundance. Over1500 abundantly expressed Piloderma genes weredetected from mycorrhizal roots, including genes forprotein metabolism, cell signalling, electron trans-port, terpene synthesis and other extracellular
activities. In contrast, Piloderma gene encoding anammonia transporter showed highest transcriptabundance in soil samples. Our methodology high-lights the potential of metatranscriptomics to identifygenes associated with symbiosis and ecosystemfunction using field-collected samples.
Introduction
The symbiotic activities of ectomycorrhizal (EM) fungi areessential for pine forest establishment and sustainability(Hasselquist et al., 2005; Wang and Qiu, 2006; Smith andRead, 2008). The composition of EM fungal communitiescan be affected by environmental factors (Cullings andMakhija, 2001; Cullings et al., 2003; Wolfe et al., 2008).The EM symbiosis is characterized by a hyphal mantlethat forms over root tips (Bonfante and Genre, 2010)where both epidermal and cortical root cells are colonizedby intercellular hyphae (the Hartig net). EM fungi, throughcell–cell interaction of their hyphal network with root cells,enjoy direct access to their plant host’s carbon and com-pensate the plant host by stimulating plant growth (Sunget al., 1995), mineral nutrient uptake (Van den Driessche,1991), water absorption (Smith and Read, 2008) anddisease resistance (Zhao et al., 2008).
Genomic studies of EM fungi are providing novelinsights into mechanisms of symbiosis. In Laccaria bicolor(the first EM fungus to have its genome sequenced),approximately 20 000 protein-encoding genes were iden-tified including ammonia transporters, GTPase and small-secreted proteins involved in symbiosis establishment(Martin et al., 2008). Genome sequencing of the blacktruffle (Tuber melanosporum) has also revealed manygenes that play a role in EM–fungal–plant interactionincluding plant cell adhesion, plant defence evasion, andplant cell wall modifications (Martin et al., 2010).
Molecular dissection of mycorrhizal symbiosis is com-plicated by many challenges, including the difficulty ofculturing most EM fungi and the requirements for inocu-lation and successful EM colonization of living plant roots.For most EM fungi, in vitro gene expression analyses arestill not practical or possible. Fortunately, metagenomic
Received 8 May, 2014; accepted 27 August, 2014. *For corre-spondence. E-mail [email protected]; Tel. 9196607362; Fax919-660-7293.
bs_bs_banner
Environmental Microbiology (2014) doi:10.1111/1462-2920.12619
© 2014 Society for Applied Microbiology and John Wiley & Sons Ltd
methods that follow gene expression in field-collectedsamples show much promise for understanding themechanisms by which different EM fungal lineagesrespond to their natural environment. Next-generationDNA sequencing studies using high-throughput ampliconsequencing especially show great promise for functionalstudies of EM fungal communities (Gottel et al., 2011;Gugerli et al., 2013; Shakya et al., 2013; Talbot et al.,2014). For example, a recent study of the North Americanpine soil ‘mycobiome’ showed strong geographic pattern-ing of EM fungal communities but high degrees of func-tional convergence across these communities (Talbotet al., 2014). However, only few methods have beenapplied to study EM function and they are based on rela-tively coarse measures of community enzyme productionor gross hyphal morphology (Courty et al., 2005; Moelleret al., 2014). Consequently, application of finer resolutionmetagenomic approaches shows great potential toadvance the study of EM functional ecology. Whiletranscriptomic tools are well developed for some modelsystems in vitro (Laccaria, Tuber) (Martin et al., 2008;2010; Plett et al., 2011), metatranscriptomics hasnot been widely applied to study the function ofectomycorrhizae in the natural environment. This is due tothe difficulty of obtaining high-quality RNA from a smallamount of field tissues and the challenge of assemblingand analysing metatranscriptomic data. To study the func-tional distribution of EM fungal hyphal network in both rootand soil systems, we collected root clusters and soils fromtwo Pinus taeda native forests. Here we propose a meth-odology to study the metatranscriptome of EM fungi–pineroot symbiotic associations from small samples (pine rootclusters) using next-generation sequencing technologyand advanced assemblers that use data from the rapidlygrowing number of transcriptomic sequence databases.To test our methodology, we used the Pinus–Pilodermasystem because of the large amount of publicly availabletranscriptomic data from these two species (Grigorievet al., 2012; NCBI). Our methodology identifies a core setof Piloderma genes expressed under a variety ofdevelopmental/environmental conditions.
Results
Sampling and RNA extraction for field-collected samples
To study EM fungal–Pinus interactions in situ, we sampledat least 12 replicates of EM root clusters and soils fromtwo P. taeda native forests 10 mile apart (Fig. S1). Theorganic soil horizons were collected using soil cores. Ineach plot, two soil cores were collected from two points50 m apart from each other (i.e. four soil cores werecollected in total). Intact root clusters containing fresh roottips were collected using forceps under a dissectionmicroscope. Soil samples were also collected from the
same soil core from which roots were collected. At leastthree individual root and soil samples were collected froma single core as subreplicates.
Application of metagenomic approaches presents chal-lenges due to the difficulty of obtaining high-quality RNAfrom a small amount of field tissues, especially from plantroots (Chang et al., 1993; Martin et al., 2004), and thechallenge of assembly of whole-metatranscriptomic data.Because initial attempts to isolate RNA from singlemycorrhizal root tip yielded insufficient RNA for HiSeq,we chose to focus on EM root clusters, which are largerand more suitable for obtaining high-quality RNA,next-generation sequencing and comparative metatran-scriptomics at the single-species level. Because high-quality mRNA is critical for transcriptomics, choosing theright extraction method is critical for field-collected rootcores with small amounts of usable tissue. Of themethods we compared (Table S1), including kit-basedand conventional methods, the best results were obtainedusing a cetyltrimethyl ammonium bromide (CTAB)/chloroform extraction with LiCl precipitation of RNA. TheCTAB/LiCl method described by Chang and colleagues(1993) was able to recover good quality RNA from rootsamples of P. taeda; however, the quantity of recoveredRNA was relatively low (∼ 6 ηg RNA mg−1 root cluster).Several CTAB methods modified from Chang andcolleagues (1993) or Liao and colleagues (2004) wereapplied to extract RNA from larger amount of pine tissues(1–4 g) (Joosen et al., 2006; Lorenz et al., 2009; 2010;Canales et al., 2011). In this study, we modified the RNAextraction method from Chang and colleagues (1993)combined with genome grinding/beading strategy tohomogenize small amounts of root tissue. The improvedmethods enabled us to obtain good quantity of DNA andRNA from the same extraction in a single root cluster(∼ 100 ηg RNA mg−1 tissues). RNA isolation from singleroot clusters yielded of 0.5 μg high-quality RNA, sufficientfor the production of quality reads by Illumina RNAseq.Except RNA PowerSoil kit (MoBio, Carlsbad, CA, USA),all of the RNA extraction methods we examined were notadopted for soil samples collected in the field (Table S1).
Integrative assembly of cDNA sequences
We performed Illumina HiSeq sequencing to analyse thetranscriptomic activity for individual root clusters and soilsamples respectively. We recovered an average of 40million reads that passed quality control from a single EMroot cluster (Table S2). The computational workflowsorted out the reads representing fungal ribosomal RNA(rRNA) using fungal rRNA databases (Fig. 1). De novoassembly using the Velvet package (Zerbino and Birney,2008) was applied to assemble and identify the variableregion (divergent domain 2, D2) of rRNA large subunit
2 H.-L. Liao et al.
© 2014 Society for Applied Microbiology and John Wiley & Sons Ltd, Environmental Microbiology

regions (LSUs) of fungal species. The assembled contigscontaining D2 regions were used as a database for fungalrRNA reads aligning to calculate the abundance of par-ticular fungi. Short rRNA reads representing the LSU D2region (around 180 bp) were extracted, paired and nor-malized using RPKM (reads per kilobase per million). Thefungal taxonomic identity (at the genus level) was deter-mined using BLAST (Bayesian classifier and NCBI) anddominant fungal lineages identified. The unmapped readswere subsequently mapped to bacterial 16S rRNA andP. taeda transcript database (NCBI). Of the transcription-ally active EM fungi, Piloderma spp. were most oftendetected from root samples we collected (the details weredescribed in the following sections). Thus, the Pilodermacroceum database (Pilcr1 F 1598; Grigoriev et al., 2012)was used to extract reads representing Piloderma genesfrom Piloderma dominated root clusters and soil samples.De novo assembly using Trinity package was applied torecover the fungal genes for the samples that are domi-nated by the fungal species without publicly availabledatabases.
The distribution of reads in individual root clusters
Figure 2 shows the percentage of reads within a typicalEM root cluster associated with different metatranscripts.Our approach was able to recover reads from functionalgenes, with 35% from fungi and 42% from P. taeda. In
addition, smaller amounts of ribosomal DNA reads gen-erated during cDNA synthesis were obtained which couldbe attributed to fungi (0.9%), P. taeda (0.8%) and bacteria(0.1%), as well as 0.007% reads that mapped to thefungal internal transcribed spacer (ITS) region. Similarratios were observed between the biological replicates in
Fig. 1. Computational flowchart used to analyse Illumina HiSeq RNA reads of EM root clusters.
Fig. 2. Percent of read associated with fungal, bacterial and pinetranscripts in EM root clusters detected by Illumina HiSeq.Numbers in parentheses indicate the number of reads (in millions)recovered from total reads for each group. (n = 16, total number ofreads after quality trimming = 35 million).
Metatranscriptomic analysis of ectomycorrhizae 3
© 2014 Society for Applied Microbiology and John Wiley & Sons Ltd, Environmental Microbiology

all root samples (Table S2), which also contained anaverage of 9% unknown sequences, and 14% unqualifiedand unassembled reads.
Identification of fungal taxa within individual root clusters
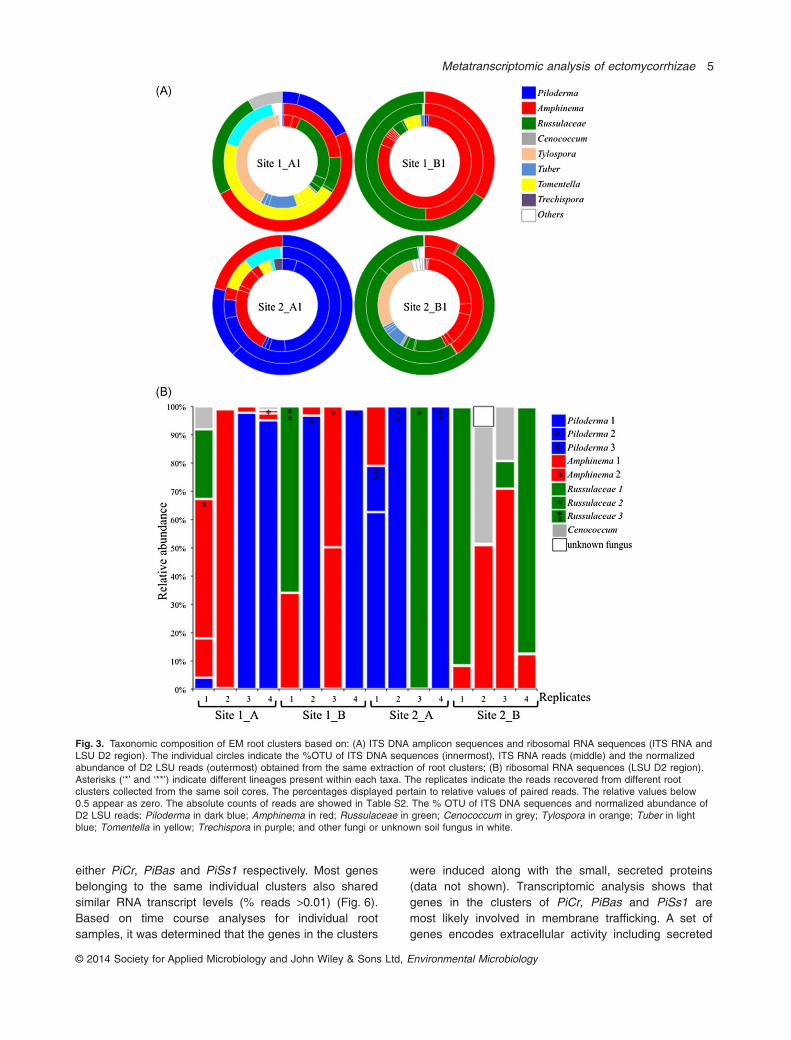
To identify active fungi in EM root clusters, we recoveredtotal DNA and RNA from the same extraction, and thencompared fungi detected from stable DNA with thosedetected from more labile RNA, using the logic that therRNA of active fungi would be overrepresented (Baldrianet al., 2012; Liu et al., 2012). Using total DNA with 454amplicon sequencing of the ribosomal ITS region, wedetected from 27 to 52 fungal operational taxonomic units(OTUs) per root cluster (Fig. 3A; Table S3A). In contrast,fungal transcripts coding for rRNA (LSU D2 region)from individual root clusters were dominated by onlyone to several fungal OTUs belonging to Piloderma,Amphinema, Russullaceae and Cenoccocum, Thele-phoraceae and Mycena sp. (Fig. 3; Table S3). Withexception of Mycena, all are known to be EM taxa. Ofthese, the most transcriptionally active EM fungi werePiloderma spp. that were detected in 7 of 16 root samples,comprising up to 93% of total LSU D2 reads from a singleroot cluster. Phylogenetic analysis revealed the presenceof three distinct Piloderma species with 93–98% similarityin their D2 region (Figs S2 and S3). Comparison withsequences from the UNITE database identified theseOTUs as Piloderma byssinum, P. croceum and a thirdunidentified Piloderma species (Fig. S3). In addition,two lineages of Amphinema and three lineages ofRussulaceae were also detected with 85–98% sequenceidentity within the D2 region of each OTU respectively.
Mapping Piloderma-specific functional reads in soiland root clusters
To investigate Piloderma transcriptional activity in soil androot samples, we used genomic and transcriptomic datafor P. croceum (Pilcr1 F 1598 v 1.0; Grigoriev et al., 2012)to identify functional genes. Aligning all RNA-Seq readsagainst the P. croceum F 1598 transcript dataset (v1.0),we obtained an average of 100 000 and 1 000 000 readsin individual soil and root samples respectively. The mosthighly expressed transcripts could be readily assigned toGene Ontology (GO) categories (Fig. 4). Most of the iden-tified transcripts are related to gene functions in proteintranslation, protein degradation, protein folding, cell sig-nalling, mitochondrial activity, terpene synthesis or tounknown proteins.
Functional category analysis reveals that Pilodermagenes for nutrient transportation were predominantlyexpressed in soil samples, while genes for terpenebiosynthesis were significantly expressed in root samples
(Fig. 4). Sets of highly expressed genes (with percentageof reads >0.02%) were identified using BLASTX (Fig. 5;Table S4). Of 141 highly expressed functional-relatedgene groups, 124 gene groups were commonlyexpressed in both root and soil samples and are assumedto be directly associated with response of Pilodermahyphae to its environment (Fig. 5A). Only 17 unique genegroups were determined by comparison with false discov-ery rate < 0.1 (Fig. 5B). Eight Piloderma gene groupswere found to be upregulated in soil compared with theEM root and nine gene groups displayed significantlyhigher expression within the EM root compared with soil.Figure 5B shows that similar patterns of differential geneexpression in root versus soil Piloderma transcripts wereobserved across all sample locations.
Genomic and transcriptomic identification of Pilodermasmall secreted proteins
The small proteins secreted by plant pathogenic fungi orplant symbiotic fungi have been implicated in playing animportant role in host compatibility (Chisholm et al.,2006; Plett et al., 2011). Four highly expressed genesencoding small secreted proteins were detected fromPiloderma, and investigated further (Figs 5 and S4).These small secreted proteins included PiCr, PiBas,PiSs1 and PiEsp, which had sequences homologousto the cysteine-rich protein (gi392569350), fungalbiotrophy-associated secreted protein (gi471559611),small secreted protein (gi328860126) and EM-associated small secreted protein (gi170100116). Thesesmall-secreted proteins have distinct primary and tertiaryprotein structures (Figs S4 and S5) indicating their func-tional independence. Like many other effectors associ-ated with fungal virulence (Saunders et al., 2012), thesefour small secreted proteins share at least one of thefollowing properties: a signal polypeptide, small proteinsize and cysteine rich, implying their involvement inPiloderma–host symbiosis.
All the small secreted proteins encode a small poly-peptide of less than 215 amino acids and were predictedas non-cytoplasmic proteins with no transmembranedomains (data not shown). PiCr, PiBas and PiSs1contain a signal peptide at their N-terminals. A distinctsequence pattern was found in PiCr, which contains sixcysteine residues arranged in an inverted symmetricalrepeat. No specific domains and motifs were predictedfrom those small secreted proteins (data not shown).All four small secreted proteins show high sequenceidentifies (over 99%) with representative contigs inP. croceum genome.
Sequence analysis of the P. croceum genome contigsindicated that the several highly expressed genes encod-ing functionally associated proteins are clustered with
4 H.-L. Liao et al.
© 2014 Society for Applied Microbiology and John Wiley & Sons Ltd, Environmental Microbiology
either PiCr, PiBas and PiSs1 respectively. Most genesbelonging to the same individual clusters also sharedsimilar RNA transcript levels (% reads >0.01) (Fig. 6).Based on time course analyses for individual rootsamples, it was determined that the genes in the clusters
were induced along with the small, secreted proteins(data not shown). Transcriptomic analysis shows thatgenes in the clusters of PiCr, PiBas and PiSs1 aremost likely involved in membrane trafficking. A set ofgenes encodes extracellular activity including secreted
Fig. 3. Taxonomic composition of EM root clusters based on: (A) ITS DNA amplicon sequences and ribosomal RNA sequences (ITS RNA andLSU D2 region). The individual circles indicate the %OTU of ITS DNA sequences (innermost), ITS RNA reads (middle) and the normalizedabundance of D2 LSU reads (outermost) obtained from the same extraction of root clusters; (B) ribosomal RNA sequences (LSU D2 region).Asterisks (‘*’ and ‘**’) indicate different lineages present within each taxa. The replicates indicate the reads recovered from different rootclusters collected from the same soil cores. The percentages displayed pertain to relative values of paired reads. The relative values below0.5 appear as zero. The absolute counts of reads are showed in Table S2. The % OTU of ITS DNA sequences and normalized abundance ofD2 LSU reads: Piloderma in dark blue; Amphinema in red; Russulaceae in green; Cenococcum in grey; Tylospora in orange; Tuber in lightblue; Tomentella in yellow; Trechispora in purple; and other fungi or unknown soil fungus in white.
Metatranscriptomic analysis of ectomycorrhizae 5
© 2014 Society for Applied Microbiology and John Wiley & Sons Ltd, Environmental Microbiology

phospholipase C, laccase and phospholipase-dependenttransferases were also found located adjacent to thePiBas gene.
Identification of P. taeda functional genes in mycorrhizalroot clusters
In addition to fungal genes, metatranscriptomic analysisof root clusters recovered over 40% of the reads repre-senting functional plant genes from P. taeda that allowedus to study the function of both organisms from the samesample (Fig. 2). A total of 212 500 functional contigs fromP. taeda were identified from EM root clusters. Of those,2600 highly expressed contigs representing over 50 genegroups were shared among different sampled EM roots(Table S5).
Discussion
Simultaneous identification of active fungal and planttranscriptomes using next-generation sequencing
To study EM root function in situ, we applied improvedmethodologies for obtaining high-quality DNA/RNA (from
the same extraction), poly-A enrichment, cDNA construc-tion, data assembly and comparative metatranscriptomicsat the single-species level. A workflow for bioinformaticanalysis using advanced and popular software packagesallowed us to sort and assemble the RNA-seq data(Fig. 1). The cDNA construction methods using poly-Tprimers were appropriate for isolating eukaryotic mRNAsand cDNA libraries, such that mRNA accounted for morethan 80% of the total number of reads. This methodologystill yields up to 1% rRNA, sufficient to taxonomically EMfungal species and other microbes that are present. Ourmethod sorted and extracted the reads represent D2regions from environmental samples for fungal identifica-tion, while at the same time, quantifying their abundanceat the transcriptomic level (Fig. 1; Fig. S6). Based on LSUD2 RNA analysis, we found that most root clusters aredominated by a single fungal species (Fig. 3); in contrast,a much higher diversity of fungal taxa (>5) was observedfrom the same root samples using 454-sequencing of ITSamplicons (Fig. 3A), suggesting that only one or very fewspecies of EM fungi are actively functioning within a givenroot cluster at the same time. A higher diversity of domi-nant fungal taxa (>5) was observed from soil samples(data not shown); however, RNA-seq again revealed that
Fig. 4. Functional categories of Piloderma genes from root clusters and comparison with Piloderma genes from soil samples. Nested circlesfrom innermost to outermost represent transcript abundance (% reads) per sample (n = 3): (I) Site1_A_soil; (II) Site1_B_soil; (III) Site2_A_soil;(IV) Site1_A_root; (V) Site1_B_root; (VI) Site2_A__root. The genes with % reads > 0.01 from the total Piloderma reads were assigned to thecategories. The % reads for a gene group = number of reads mapped to a P. croceum gene group × 100/number of reads mapped toP. croceum database. Asterisks highlight on outermost circles indicate gene categories statistically different in root samples from soil samples.
6 H.-L. Liao et al.
© 2014 Society for Applied Microbiology and John Wiley & Sons Ltd, Environmental Microbiology

Fig. 5. Cross-comparative expression of (A) highly expressed and (B) unique Piloderma gene groups in soil and root samples. The genegroups highly expressed at least in an individual sample (% reads >0.02 from all Piloderma reads were selected for clustering and heat mapvisualization). The color key represents RPKM normalized log2 transformed counts of the genes. Wilcoxon signed-rank test (Bauer, 1972) wasused to filter the data. Each gene family was significantly overexpressed in one of the group as determined by comparisons with falsediscovery rate (FDR) <0.1 using Benjamini-Hochberg test.
Metatranscriptomic analysis of ectomycorrhizae 7
© 2014 Society for Applied Microbiology and John Wiley & Sons Ltd, Environmental Microbiology

these transcripts were also dominated by one or only afew fungal taxa.
Analysis of the EM metatranscriptome using poly-Aselection following by gene mapping and de-novo assem-bly identified functional ‘symbiosis’ genes from both EMfungus and its plant host P. taeda. Piloderma spp. areconsistently the dominant EM fungal taxon in root and soilsamples from over 50 pine forests across 10 states inNorth America (Talbot et al., 2014). By using the publicallyavailable Piloderma genome database, we focused onhow genomic machinery operates in dominant taxa(Piloderma) in the investigated natural environment. Therepresentative genes of interests and their functions arediscussed in the following sections.
Previous studies on the Piloderma–Quercus EM sym-bioses identified a set of premycorrhiza-related hostgenes (Quercus rober) (Krüger et al., 2004; Herrmannand Buscot, 2007). Because HiSeq provides much largernumbers of RNA reads (up 30 million reads per lane),
efficient mapping of transcript reads (Fig. 1) enablessimultaneous analysis of metagenome expression evenwhen multiple fungal and plant species are present.
Unique metabolic genes are highly expressed insymbiotic tissues
EM fungi develop communication networks using theirhyphae as functional units. At the cellular level, EMhyphae that form the Hartig net establish the physicalinteraction with hosts; in contrast, hyphae that extendoutward into the soil mostly contribute to resource uptakeor interaction with biotic factors in the environment (Nehls,2007). In addition to root clusters, we also collected soilsfrom the same soil cores where the root samples werecollected and generated the metatranscriptomic data tostudy microbial function in the soil samples. Regardless ofwhich collecting site we sampled, comparative functionalprofiles for several gene groups differed significantly
Fig. 6. The relative expressions of the cluster genes for secreted proteins: (A) PiCr1, (B) PiBas and (C) PiSs1. A pool of randomly selectedsamples from three sites (n = 3) were used for mapping. Genes are depicted as arrows: red, secreted proteins; blue, proteins for the secretorypathway; grey, other proteins. The area chart quantifies the transcript abundances of Piloderma genes in root (blue) and soil (orange), and theoverlap area shown in purple. The y-axis represents the log2 for % reads corresponding to the total reads mapped to Piloderma database.OST3, oligosaccharyl transferase subunit 3; K1 and K2, kinesin motor protein; PiCr, cysteine-rich protein; E1F1, E1F1 transcription elongationfactor; Vsp, Vsp55-domain trafficking-related protein vacuolar protein; Trs, TRS120 cis-Golgi transport protein; CBS, CBS domain containingprotein; TGF, transforming growth factor-receptor; PLPTfase1 and 2, PLP-dependent transferase; PiBas, fungal biotrophy-associatedsecreted protein; LCC, laccase; PLPC, phospholipase C; COP, coatomer protein; HP, hypothetical protein; TBC, GTPase-activating TBCdomain protein; AMDase, general amidase; ttRNAsase, tryptophanyl-tRNA synthetase; PiSs1, small-secreted protein; YOS1, ER-to-Golgitransport membrane protein; Mt50S, mitochondrial 50S ribosomal protein; RP1, Ribohporin I; PPR, pentatricopeptide repeat-containing protein;APase, acid protease; IADH, iron-containing alcohol dehydrogenase; 60rP, 60S ribosomal protein L35; PRF5ACRI,Phosphoribosylformimino-5-aminoimidazole carboxamide ribotide isomerase; STE20, protein kinase ste 20.
8 H.-L. Liao et al.
© 2014 Society for Applied Microbiology and John Wiley & Sons Ltd, Environmental Microbiology

between root and soil samples (Fig. 5), reflecting a highdegree of functional variability between Pilodermagrowing in different parts of the rhizosphere.
Nine transcripts were significantly upregulated in EMroot by comparison to mycelium growing in soil (Fig. 5B).These include two effectors (PiCr and PiEsp) mentioned inthe result sections, as well as seven unique genes thatinclude three gene groups for terpene synthesis (cyclase/TspCI, GGPTase, GGPS), and a gene for gibberellin 20oxidase (G20ox) in symbiotic root indicated Piloderma,as other pathogenic (MacMillan, 1997) and EM fungi(Strzelczyk and Pokojska-Burdziej, 1984), could producegibberellin precursors and activate gibberellin to promoteplant growth. Interestingly, fungal genes encoding cyclase,GGPS and G20ox are known to be functional clustersassociated with gibberellin biosynthesis (Kawaide, 2006).As in other Agaricomycetes (Abraham, 2001), Pilodermamay synthesize cytotoxic sesquiterpenoid metabolites toenhance antimicrobial activity. More studies are needed todetermine the role of terpene-associated genes in thePiloderma–pine symbiosis.
Three other highly expressed ectomycorrhiza-associated transcripts were detected including genesencoding proteins with potential roles in detoxification ofphytotoxin: cyanamide hydratase (Maier-Greiner et al.,1991); fungal reproduction: cell growth-associated pro-tein; and lipoprotein receptor: KIR-like CYIR protein.
Highly expressed genes for carbon/nitrogen/phosphate(C/N/P) cycling and other extracellular activity
As with other EM fungi, genes coding for C/N/P uptake,transportation and utilization must play important roles inPiloderma mutualistic function in the environment andcommunication with its pine host. Our study using com-parative metatranscriptomics illustrates different patternsof gene expression of Piloderma growing in different partsof the rhizosphere (EM roots versus soil). Nine of 18 genegroups we detected for C/N/P-associated proteins aretransporters, including one gene for ammonium (PiAMT),one for choline (ammonium salts), two for amino acids,two for monosaccharides, one for inorganic phosphate,one water channel and one general membranepermease, indicating the great activation of fluxes fornutrient exchange (Fig. 5A). One type of high-affinityammonium transporter (PiAMT; amino acid sequence inFig. S7) that shares high amino acid identity (61%) withAspergillus MepA (Monahan et al., 2006) (data notshown) was strikingly enriched in soil compared with rootsamples, suggesting that ammonium may be a preferen-tial source of nitrogen in soil. Similarly, a high level of geneexpression for glutamine synthase and glutamate-relatedtransporters in both free mycelium and EM roots impliesthat glutamine pathway is the main biogeochemical
pathway for ammonium assimilation and nitrogen utiliza-tion in Piloderma. Glutamine could be assimilated usingammonium, or directly imported from soil and serve as themajor molecule translocated to the roots.
Current studies showed that at least 44 of 132 glyco-side hydrolases (GHs) contribute to plant cell wall decon-struction (Gilbert, 2010; http://www.cazy.org/). Of 141highly expressed gene families (Fig. 5A), we detectedonly two GHs (GH12 and GH16); no other enzymesinvolved in degradation of cellulose, hemicellulose andpectin were identified by our metatranscriptome studies,suggesting adaptation of Piloderma to the EM symbioticlifestyle. As with other EM fungi, we infer that Pilodermamainly absorbs monosaccharides from the host andenvironment via its monosaccharide/sugar transporterfamilies.
Several other extracellular enzymes were highlyexpressed in both root and soil samples. These includefungal chitosanase (GH75), which is involved in modifica-tion of fungal cell wall structure, and may be required forfungal development or to make cell more accessible forcolonization. Ricin B-like lectin could activate fungalsignal transduction through binding and clustering specificcarbohydrates on fungal cell surfaces. Cupredoxin isinvolved in electron transfer. High expression of the genefor glycoamidase indicates active regulation of glycopro-tein maturation (Suzuki et al., 1994). Overall, thesecommon extracellular enzymes are most likely involved inbasic biological processes of fungal development andadaption to environment.
Fungal small secreted proteins present in EM pine roots
Secreted effector-like proteins are involved in a variety ofpathogenic and symbiotic fungal–host interactions (Martinet al., 2008; Lowe and Howlett, 2012). However, themechanisms for delivery and function of the effectors areless known. In general, effectors are often highly diver-gent in plant-pathogenic fungi and lack similarity in theirsequences to proteins in most databases. Our study iden-tified four highly expressed effector-like genes (PiCr,PiBas, PiSs1 and PiEsp) that share high sequence simi-larity with other effector-like proteins. This implies thatthose proteins are likely to be involved in communicationbetween Piloderma and pine roots. However, morestudies on functional analysis are needed to determinethe role of these small secreted proteins in Pilodermasymbiosis.
Four sets of Piloderma genes for secretory pathway arealso clustered in the genome with these four effector-likegenes involved in the EM symbiotic interface (Fig. 6). Thesix cysteines of PiCr protein are arranged in a symmetricalstructure, likely form three disulphide bridges. Thedisulphide bridges could contribute to protein stability
Metatranscriptomic analysis of ectomycorrhizae 9
© 2014 Society for Applied Microbiology and John Wiley & Sons Ltd, Environmental Microbiology

during secretion. There is no direct evidence to link sucha structure with their function on symbiosis, though manysmall secreted proteins of fungi that contain four to eightcysteine residues have found function inside the plantcells to induce plant defence system (Rep, 2005;Stergiopoulos and de Wit, 2009). Gene expression analy-sis by mapping the transcriptomic reads to genomesequence of the PiCr cluster revealed a set of five genesincluding genes for cysteine-rich protein (PiCr), two motorproteins (K1 and K2), ER-to-Golgi transport (Vsp) andcis-Golgi transport (Trs) are induced exclusively in sym-biotic tissues. One motor protein (K1) contains the multi-functional domains for kinesin heavy chain (KISc),transmembrane channel (MscS), protein kinase (HrpJ),RNA-binding (Pumilio), vesicle coat trafficking (Sec1) anda coatomer element (COP II) using conserved domainprediction server in NCBI (data not shown). Those resultsindicate the mediation of organelle-to-organelle secretorypathway is involved in PiCr secretion and fungal–hostrecognition. PiBas encodes a protein with high homologyto the fungal biotrophy-associated secreted protein (Bas),a small protein secreted into plant cells during com-patible mycorrhizal interactions (Mosquera et al., 2009).Genomic features related to the biotrophic lifestyle inPiBas clustered genes include plant cell wall and mem-brane manipulation [e.g. laccase, phospholipase C andpyridoxal phosphate (PLP)-dependent transferases].Expression analysis showed that most of the genesselected contained in the PiBas cluster were induced inroot tissues and soil samples, suggesting that PiBas clus-ters could be involved in manipulating host cell structuresand cell processes during EM symbiosis; the same genecluster could play a role during growth in soil.
PiSs1 and PiEsp are homologous to effector-type smallsecreted proteins with unknown function. PiSs1 clusterencode proteins for transcription, translation, proteintranslocation and ER-to-Golgi transport (YOS1), indicat-ing that a specific synthetic and delivery pathway isinvolved in function of PiSs1, whereas no functional-documented genes were detected adjacent to PiEsp (datanot shown).
In this study, we developed an effective approach forstudying EM fungal metatranscriptomes to identify spe-cific molecular mechanisms operating to regulate fungal–plant interactions and fungal fitness. We were able toidentify Piloderma spp. as the main functional EM fungalplayer in pine forest environments. Availability of publicallyavailable genome resources for P. croceum also made italso possible for us to identify key sets of genes whichwere expressed within ectomycorrhizae and soil. Unfortu-nately, genome data were not yet available at the presenttime for several other fungi identified by our study(Russula, Amphinema, Thelephora). Given the increasingavailability of fungal genome assemblies and annotations,
exploitation of metatranscriptomic analysis shows greatpromise for profiling lineage-specific transcriptomics insitu in other systems and contribute for a better under-standing of the functional roles fungi play in nature.
Experimental procedures
Sampling
Organic soil horizons were collected from two P. taeda plotslocated in the Duke Forest, Durhamco, NC, USA in April 2012using soil cores (10 cm diameter; 15 cm height) (Fig. S1). Atthe time of sampling, the average temperature in theseforests was 21°C. Root and soil samples were stored on iceand frozen in liquid nitrogen or dry ice within an hour aftercollection, and stored at –80°C prior to RNA extraction.
RNA preparation and cDNA construction
Total RNA was isolated from root samples using a CTAB/chloroform extraction and LiCl precipitation method modifiedaccording to Chang and colleagues (1993). Frozen rootswere ground using ten 2 mm zirconia beads (BSP,Bartlesville, OK, USA) in a GenoGrinder 2000 (OPS Diag-nostics, Lebanon, NJ, USA) at 1500 strokes min−1 for 30 s.Immediately after grinding, 1 ml DEPC/CTAB solution (2%CTAB and PVP; 100 mM Tris-HCl, pH 8.8; 25 mM EDTA, pH8.0; 2 M NaCl; 2% fresh beta-mercaptoethanol and 1%DEPC, v/v) was added to the ground roots. The sample wasthen homogenized by vortexing and incubated at 65°C for10 min. Equal volumes of a chloroform : isoamyl alcoholmixture (24:1) were added to the samples, mixed by vortexand centrifuged at 9000 g for 10 min. The supernatant wasrecovered and RNA in the supernatant precipitated with 2:1volume 8 M LiCl at 4°C for 16 h. After centrifugation at 9000 gfor 5 min, the supernatant was collected for DNA extractionand the pellet (RNA) was washed using 70% EtOH andeluted in DNase/RNase-free water. The supernatant col-lected in LiCl precipitation step was treated with 1 unit RNaseat 37°C for 30 min, then precipitated with equal volumes ofice cold isopropanol. After centrifugation at 9000 g for 10 min,the pellet (DNA) was washed using 70% EtOH and eluted inDNase/RNase-free water.
RNA from soil was extracted using the RNA PowerSoil kit(MoBio, Carlsbad, CA, USA) as indicated in the manufactur-er’s instructions. Total RNA quality was quantified using a2100 bioanalyser (Agilent, Santa Clara, CA, USA) and Qubit2.0 fluorometer (Invitrogen, Grand Island, NY, USA) followingthe supplier’s protocols. Only RNA with high integrity(RIN > 8.0) and showing well-defined peaks for 18S and 28SrRNAs on an electropherogram (RNA 6000 Nano LabChip,Agilent) was used for cDNA library construction. The 0.5 μgRNA was used for cDNA library construction using TruSeqRNA Sample Prep v2 (Illumina, San Diego, CA, USA) andpoly-T primers to enrich poly-A containing mRNA. The cDNAsamples were sequenced using HiSeq 2000 (Illumina) inInstitute for Genome Sciences and Policy at Duke University.Twelve samples were sequenced using a lane of Illumina runto generate 38 Gb of data. The raw reads were submittedto Sequence Read Archive (http://trace.ncbi.nlm.nih.gov/Traces/sra/) (Accession No. SRP041643).
10 H.-L. Liao et al.
© 2014 Society for Applied Microbiology and John Wiley & Sons Ltd, Environmental Microbiology

Packages and databases used forbioinformatics analysis
The bioinformatic packages used for assembling and anno-tating the datasets were: the Galaxy web-based package(https://main.g2.bx.psu.edu) to check the quality of reads,FastQC for sequence trimming and quality filtering (cut-offwith quality scores <28; Blankenberg et al, 2010), Bowtie forreference-based mapping (http://bowtie-bio.sourceforge.net/index.shtml), Velvet (Zerbino and Birney, 2008) and Trinity(Grabherr et al., 2011) for de novo assembly and a combina-tion of Blastx (Tao, 2010), GO (Ashburner et al., 2000), KyotoEncyclopedia of Genes and Genomes (KEGG) (Kanehisaet al., 2012) and NCBI eukaryotic orthologous groups (KOG)(Tatusov et al., 2003) for gene annotation. Amino acids pre-dicted from nucleotide sequences was performed usingExPASy (http://web.expasy.org/translate/). EMBL-EBI andSignal-3L were used for signal-peptide prediction (http://www.ebi.ac.uk/Tools/pfa/phobius/; http://www.csbio.sjtu.edu.cn/bioinf/Signal-3L/). NCBI (Marchler-Bauer et al., 2011) andMyhits were applied for production of conserved domains andmotifs (http://www.ncbi.nlm.nih.gov/Structure/cdd/wrpsb.cgi).In general, default parameters were applied for the bioin-formatics analysis.
Databases used for mapping including: Fungal rRNA(∼ 400 000 contigs; NCBI); Bacterial 16S (∼ 2 1000 000contigs; Ribosomal Database Project, http://rdp.cme.msu.edu); P. taeda (∼ 320 000 contigs; NCBI), P. croceum(∼ 340 000 contigs; Pilcr1 F 1598 v 1.0, Grigoriev et al., 2012).The annotated sequences of coding genes downloaded fromNCBI for over 30 fungal species (mostly EM fungi of trees orwood rot fungi) that were assumed to be best hits for thesequences of Pinus-associated EM fungi were pooled andused as references for fungal gene annotation using Blastx(Tao, 2010), including Serpula lacrymans (12 925 genes),Coniophora puteana (13 898 genes), Laccaria bicolor (18 315genes), Dichomitus squalens (12 511 genes), Gloeophyllumtrabeum (11 889 genes), Stereum hirsutum (14 455 genes)and others. The annotated sequences of coding genes down-loaded from NCBI for 15 plant species were pooled and usedas references for P. taeda gene annotation, including Populustrichocarpa (62 211 genes), Glycine max (62 511 genes), Vitisvinifera (56 152 genes), Zea mays (33 490 genes), Ricinuscommunis (32 094 genes) and others. The databases werequality filtered using FASTA manipulation of Galaxy web-based package.
Statistical analysis
In total, nine root and nine soil samples that contain RNA-Seqreads of Piloderma taxa were analysed for Figs 4 and 5. InFig. 4, we tested for statistical differences between factorsusing a Tukey test. Differences were considered significant atP < 0.05. The data of each sample were the mean for thebiological replicates. The functional categories (Fig. 4) andheat map (Fig. 5) were generated using R package(s) (RDevelopment Core Team, 2011).
Acknowledgements
We would like to thank Igor Grigoriev, Francis Martin andFrançois Buscot for access to genome data for Piloderma
croceum. Genome sequence data were produced by theUS Department of Energy Joint Genome Institute http://www.jgi.doe.gov/ in collaboration with the user community.We also thank members of the Vilgalys, Peay and Bruns labfor assistance with soil/root sampling and Mr. Chih-Ming Hsufor help with bioinformatics data. This work is supported byNSF grant DBI-10–46052 to RV, DBI-10–45658 to KGP andDBI 10–46115 to TDB (http://www.stanford.edu/∼kpeay/DOB_Home.html).
References
Abraham, W.R. (2001) Bioactive sesquiterpenes produced byfungi: are they useful for humans as well? Curr Med Chem8: 583–606.
Ashburner, M., Ball, C.A., Blake, J.A., Botstein, D., Butler, H.,Cherry, J.M., et al. (2000) Gene ontology: tool for the uni-fication of biology. The Gene Ontology Consortium. NatGenet 25: 25–29.
Baldrian, P., Kolarík, M., Stursová, M., Kopecký, J.,Valášková, V., Vetrovský, T., et al. (2012) Active and totalmicrobial communities in forest soil are largely differentand highly stratified during decomposition. ISME J 6: 248–258.
Bauer, D.F. (1972) Constructing confidence sets using rankstatistics. J Am Stat Assoc 67: 687–690.
Blankenberg, D., Gordon, A., Von Kuster, G., Coraor, N.,Taylor, J., Nekrutenko, A., and Galaxy Team (2010)Manipulation of FASTQ data with Galaxy. Bioinformatics26: 1783–1785.
Bonfante, P., and Genre, A. (2010) Mechanisms underlyingbeneficial plant-fungus interactions in mycorrhizal symbio-sis. Nat Commun 1: 48.
Canales, J., Avila, C., Pacheco-Villalobos, D., Díaz-Moreno,S., Molina-Rueda, J.J., Ariza, D., et al. (2011) Geneexpression profiling in the stem of young maritime pinetrees: detection of ammonium stress-responsive genes inthe apex. Trees Struct Funct 26: 609–619.
Chang, S., Puryear, J., and Cairney, J. (1993) A simple andefficient method for isolating RNA from pine trees. PlantMol Biol Rep 11: 113–116.
Chisholm, S.T., Coaker, G., Day, B., and Staskawicz, B.(2006) Host-microbe interactions: shaping the evolution ofthe plant immune response. Cell 124: 803–814.
Courty, P.E., Pritsch, K., Schloter, M., Hartmann, A., andGarbaye, J. (2005) Activity profiling of ectomycorrhizacommunities in two forest soils using multiple enzymatictests. New Phytol 167: 309–319.
Cullings, K., and Makhija, S. (2001) Ectomycorrhizal fungalassociates of Pinus contorta in soils associated with a hotspring in Norris Geyser Basin, Yellowstone National Park,Wyoming. Appl Environ Microbiol 67: 5538–5543.
Cullings, K.W., New, M.H., Makhija, S., and Parker, V.T.(2003) Effects of litter addition on ectomycorrhizal associ-ates of a lodgepole pine (Pinus contorta) stand inYellowstone National Park. Appl Environ Microbiol 69:3772–3776.
Gilbert, H.J. (2010) The biochemistry and structural biology ofplant cell wall deconstruction. Plant Physiol 153: 444–455.
Gottel, N.R., Castro, H.F., Kerley, M., Yang, Z., Pelletier, D.A.,Podar, M., et al. (2011) Distinct microbial communities
Metatranscriptomic analysis of ectomycorrhizae 11
© 2014 Society for Applied Microbiology and John Wiley & Sons Ltd, Environmental Microbiology
within the endosphere and rhizosphere of Populus deltoidsroots across contrasting soil types. Appl Environ Microbiol77: 5934–5944.
Grabherr, M.G., Haas, B.J., Yassour, M., Levin, J.Z.,Thompson, D.A., Amit, I., et al. (2011) Full-lengthtranscriptome assembly from RNA-seq data without a ref-erence genome. Nat Biotechnol 29: 644–652.
Grigoriev, I.V., Nordberg, H., Shabalov, I., Aerts, A., Cantor,M., Goodstein, D., et al. (2012) The genome portal of theDepartment of Energy Joint Genome Institute. NucleicAcids Res 40: D26–D32.
Gugerli, F., Brandl, R., Castagneyrol, B., Franc, A., Jactel, H.,Koelewijn, H.P., et al. (2013) Community genetics in thetime of next-generation molecular technologies. Mol Ecol22: 3198–3207.
Hasselquist, N., Germino, M.J., McGonigle, T., and Smith,W.K. (2005) Variability of Cenococcum colonization and itecophysiological significance to young conifers. NewPhytol 165: 867–873.
Herrmann, S., and Buscot, F. (2007) Cross talks at themorphogenetic, physiological and gene regulation levelsbetween the mycobiont Piloderma croceum and oakmicrocuttings (Quercus robur) during formation ofectomycorrhizas. Phytochemistry 68: 52–67.
Joosen, R.V., Lammers, M., Balk, P.A., Brønnum, P.,Konings, M.C., Perks, M., et al. (2006) Correlating geneexpression to physiological parameters and environmentalconditions during cold acclimation of Pinus sylvestris, iden-tification of molecular markers using cDNA microarrays.Tree Physiol 26: 1297–1313.
Kanehisa, M., Goto, S., Sato, Y., Furumichi, M., and Tanabe,M. (2012) KEGG for integration and interpretation of large-scale molecular datasets. Nucleic Acids Res 40: D109–D114.
Kawaide, H. (2006) Biochemical and molecular analysis ofgibberellin biosynthesis in fungi. Biosci BiotechnolBiochem 70: 583–590.
Krüger, A., PeSkan-Berghöfer, T., Frettinger, P., Herrmann,S., Buscot, F., and Oelmüller, R. (2004) Identification ofpremycorrhiza-related plant genes in the associationbetween Quercus robur and Piloderma croceum. NewPhytol 163: 149–157.
Liao, Z., Chen, M., Guo, L., Gong, Y., Tang, F., Sun, X., andTan, K. (2004) Rapid isolation of high-quality total RNAfrom taxus and ginkgo. Prep Biochem Biotechnol 34: 209–214.
Liu, K.-L., Porras-Alfaro, A., Kuske, C.R., Eichorst, S.A., andXie, G. (2012) Accurate, rapid taxonomic classification offungal large-subunit rRNA genes. Appl Environ Microbiol78: 1523–1533.
Lorenz, W.W., Yu, Y.-S., Simues, M., and Dean, J.F.D. (2009)Processing the loblolly pine PtGen2 cDNA microarray.J Vis Exp 25: 1182.
Lorenz, W.W., Yu, Y.-S., and Dean, J.F.D. (2010) Animproved method of RNA isolation from loblolly pine (P.taeda L.) and other conifer species. J Vis Exp 36: e1751.
Lowe, R.G., and Howlett, B.J. (2012) Indifferent, affectionate,or deceitful: lifestyles and secretomes of fungi. PLoSPathog 8: e1002515.
MacMillan, J. (1997) Biosynthesis of the gibberellin planthormones. Nat Prod Rep 14: 221–243.
Maier-Greiner, U.H., Klaus, C.B.A., Estermaier, L.M., andHartmann, G.R. (1991) Herbicide resistance in transgenicplants through degradation of the phytotoxin to urea.Angew Chem Int Ed (English) 30: 1314–1315.
Marchler-Bauer, A., Lu, S., Anderson, J.B., Chitsaz, F.,Derbyshire, M.K., DeWeese-Scott, C., et al. (2011) CDD: aConserved Domain Database for the functional annotationof proteins. Nucleic Acids Res 39: 225–229.
Martin, F., Duplessis, S., and Kohler, A. (2004) Exploring thetranscriptome of the ectomycorrhizal symbiosis. In Molecu-lar Genetics and Breeding of Forest Trees. Kumar, S.,and Fladung, M. (eds). New York, USA: Haworth’s FoodProducts Press., pp. 81–109.
Martin, F., Aerts, A., Ahren, D., Brun, A., Danchin, E.G.,Duchaussoy, F., et al. (2008) The genome of Laccariabicolor provides insights into mycorrhizal symbiosis.Nature 452: 88–92.
Martin, F., Kohler, A., Murat, C., Balestrini, R., Coutinho, P.M.,Jaillon, O., et al. (2010) Périgord black truffle genomeuncovers evolutionary origins and mechanisms of symbio-sis. Nature 464: 1033–1038.
Moeller, H.V., Peay, K.G., and Fukami, T. (2014)Ectomycorrhizal fungal traits reflect environmental condi-tions along a coastal California edaphic gradient. FEMSMicrobiol Ecol 87: 797–806.
Monahan, B.J., Askin, M.C., Hynes, M.J., and Davis,M.A. (2006) Differential expression of Aspergillus nidulansammonium permease genes is regulated by GATA tran-scription factor AreA. Eukaryot Cell 5: 226–237.
Mosquera, G., Giraldo, M.C., Khang, C.H., Coughlan, S., andValent, B. (2009) Interaction transcriptome analysis identi-fies Magnaporthe oryzae BAS1-4 as biotrophy-associatedsecreted proteins in rice blast disease. Plant Cell 21:1273–1290.
Nehls, U. (2007) Mastering ectomycorrhizal symbiosis:the impact of carbohydrates. J Exp Bot 59: 1097–1108.
Plett, J.M., Kemppainen, M., Kale, S.D., Kohler, A., Legué, V.,Brun, A., et al. (2011) A secreted effector protein ofLaccaria bicolor is required for symbiosis development.Curr Biol 21: 1197–1203.
R Development Core Team (2011) R: a language and envi-ronment for statistical computing. R Foundation for Statis-tical Computing, Vienna, Austria. ISBN 3-900051-07-0,[WWW document]. URL http://www.R-project.org/.
Rep, M. (2005) Small proteins of plant-pathogenic fungisecreted during host colonization. FEMS Microbiol Lett253: 19–27.
Saunders, D.G.O., Win, J., Cano, L.M., Szabo, L.J., Kamoun,S., and Raffaele, S. (2012) Using hierarchical clustering ofsecreted protein families to classify and rank candidateeffectors of rust fungi. PLoS ONE 7: e29847. doi:10.1371/journal.pone.0029847.
Shakya, M., Gottel, N., Castro, H., Yang, Z.K., Gunter, L.,Labbé, J., et al. (2013) A multifactor analysis of fungal andbacterial community structure in the root microbiome ofmature Populus deltoides trees. PLoS ONE 8: e76382.doi:10.1371/journal.pone.0076382.
Smith, S.E., and Read, D.J. (2008) Mycorrhizal Symbiosis,3rd edn. San Diego, CA, USA: Academic Press.
Stergiopoulos, L., and de Wit, P.J.G.M. (2009) Fungal effectorproteins. Annu Rev Phytopathol 47: 233–263.
12 H.-L. Liao et al.
© 2014 Society for Applied Microbiology and John Wiley & Sons Ltd, Environmental Microbiology

Strzelczyk, E., and Pokojska-Burdziej, A. (1984) Productionof auxins and gibberellin-like substances by mycorrhizalfungi, bacteria and actinomycetes isolated from soil andthe mycorrhizosphere of pine (Pinus sylvestris L). PlantSoil 81: 185–194.
Sung, S.-J.S., White, L.M., Marx, D.H., and Otrosina, W.J.(1995) Seasonal ectomycorrhizal fungal biomass develop-ment on loblolly pine (Pinus taeda L.) seedlings.Mycorrhiza 5: 439–477.
Suzuki, T., Kitajima, K., Inoue, S., and Inoue, Y. (1994) Occur-rence and biological roles of proximal glycanases in animalcells. Glycobiology 4: 777–789.
Talbot, J.M., Bruns, T.D., Taylor, J., Smith, D.P., Branco, S.,Glassman, S.I., et al. (2014) Endemism and functional con-vergence across the North American soil mycobiome.PNAS 111: 6341–6346.
Tao, T. (2010) Standalone BLAST Setup for Unix. In:BLAST® Help [Internet]. Bethesda (MD): National Centerfor Biotechnology Information (US); 2008-. URL http://www.ncbi.nlm.nih.gov/books/NBK52640/.
Tatusov, R.L., Fedorova, N.D., Jackson, J.D., Jacobs, A.R.,Kiryutin, B., Koonin, E.V., et al. (2003) The COGdatabase: an updated version includes eukaryotes. BMCBioinformatics 4: 1–14.
Van den Driessche, R. (1991) Mineral Nutrition of ConiferSeedlings. Boca Raton, FL, USA: CRC press.
Wang, B., and Qiu, Y.L. (2006) Phylogenetic distribution andevolution of mycorrhizas in land plants. Mycorrhiza 16:299–363.
Wolfe, B.E., Rodgers, V.L., Stinson, K.A., and Pringle, A.(2008) The invasive plant Alliaria petiolata (garlic mustard)inhibits ectomycorrhizal fungi in its introduced range. J Ecol96: 777–783.
Zerbino, D.R., and Birney, E. (2008) Velvet: algorithms for denovo short read assembly using de Bruijn graphs. GenomeRes 18: 821–829.
Zhao, B.G., Futai, K., Sutherland, J.R., and Takeuchi, Y. (eds)(2008) Pine Wilt Disease. Berlin, Germany: Springer.
Supporting information
Additional Supporting Information may be found in the onlineversion of this article at the publisher’s web-site:
Fig. S1. Location of the collection sites.Fig. S2. Partial large-subunit ribosomal RNA sequences (D2region, ∼ 180 bp) for the most dominant fungal taxa detectedfrom mycorrhizal root clusters (Fig. 3).Fig. S3. Phylogenetic placement of LSU RNA sequencesfor three Piloderma spp. based on ribosomal large-subunitD2 region. Sequences were aligned against taxonomicallyidentified reference sequences of Piloderma spp. fromGenBank with ClustalW; phylogenetic analyses performedusing parsimony criterion in PAUP 3.0. Bootstrap tree (‘fast
bootstrap’ with 300 replicates) shows placement of threePiloderma spp.Fig. S4. Nucleotide and peptide sequences of Pilodermaeffectors: (A) PiCr1, (B) PiBas, (C) PiSs1 and (D) PiEsp. Theputative signal sequences are shown in the peptidesequence (Bold and underlined). In (A), the symmetricalarrange of cysteine (C) residues is shown in boldface.Fig. S5. Ribbon diagrams showed the predicted-tertiarystructures for (A) PiCr, (B) PiBas, (C) PiSs1 and (D) PiEsp.The helix (pink) and sheet structures (yellow) were shown. Nand C terminal are labelled. The protein tertiary structureswere predicted using I-TASSER v 3.0 (Zhang 2008; Royet al., 2010; Roy et al., 2012). C-score is a confidence scorefor estimating the quality of predicted models by I-TASSER. Itis calculated based on the significance of threading templatealignments and the convergence parameters of the structureassembly simulations. C-score is in the range from –5 to 2,where a C-score of higher value signifies a model with a highconfidence.Fig. S6. Partial images of visualization for reads of rootsamples Bowtie-mapped to a 28S rRNA reference(gi300394395, Piloderma fallax) using Integrative GenomicsViewer 2.2× (Thorvaldsdóttir et al. 2013). Fewer and variablesequences were found in variable region (D1 and D2) com-pared with the conserved regions of 28S. The red box indi-cates the region (∼ 180 bp) where the reads were extractedfor fungal taxa identification in this study. Mapped bars in blueindicate the inferred insert size on the reference gene issmaller than expected given the actual insert size; red is theinferred insert size on the reference gene is larger thanexpected given the actual insert size.Fig. S7. Predicted amino acid sequence of PiAMT.Table S1. Comparison of RNA extraction methods for pineroots (EM) and needles.Table S2. Read and Percent of read associated with fungal,bacterial and pine transcripts in EM root clusters detected byIllumina HiSeq.Table S3. Taxonomic composition of EM root clusters basedon (A) ITS DNA amplicon sequences (B) transcribed ITSRNA sequences, and (C) ribosomal RNA (LSU D2 region).(A–C)The absolute counts (read counts) and relative value(% reads) are shown.Table S4. Highly expression of Piloderma gene groups insoil and root samples.The gene families with % reads >0.02 in at least a samplewere selected. Table S4A showed the number of reads ofindividual gene families obtained from root and soil samples.Table S4B showed the list Piloderma protein ID from PilCr1database for each gene group.Table S5. Relative expression of Pinus taeda genes ofmycorrhizal root clusters. Deseq 1.14.0 package (Anders andHuber, 2010) was applied to normalize the reads mapped toPinus taeda EST database (Deseq > 100 cutoff). SimonAnders and Wolfgang Huber (2010): Differential expressionanalysis for sequence count data. Genome Biology 11:R106.
Metatranscriptomic analysis of ectomycorrhizae 13
© 2014 Society for Applied Microbiology and John Wiley & Sons Ltd, Environmental Microbiology