metamorph nx - 京都大学 · © 2011 molecular devices, llc agenda • general overview of the...
TRANSCRIPT

An Introduction to version 2.0
MetaMorph NX

© 2011 Molecular Devices, LLC
Agenda
• General overview of the MetaMorph NX
• 4D Viewer
• How to use some features in MetaMorph NX

© 2011 Molecular Devices, LLC
MetaMorph NX

© 2011 Molecular Devices, LLC
MetaMorph NX
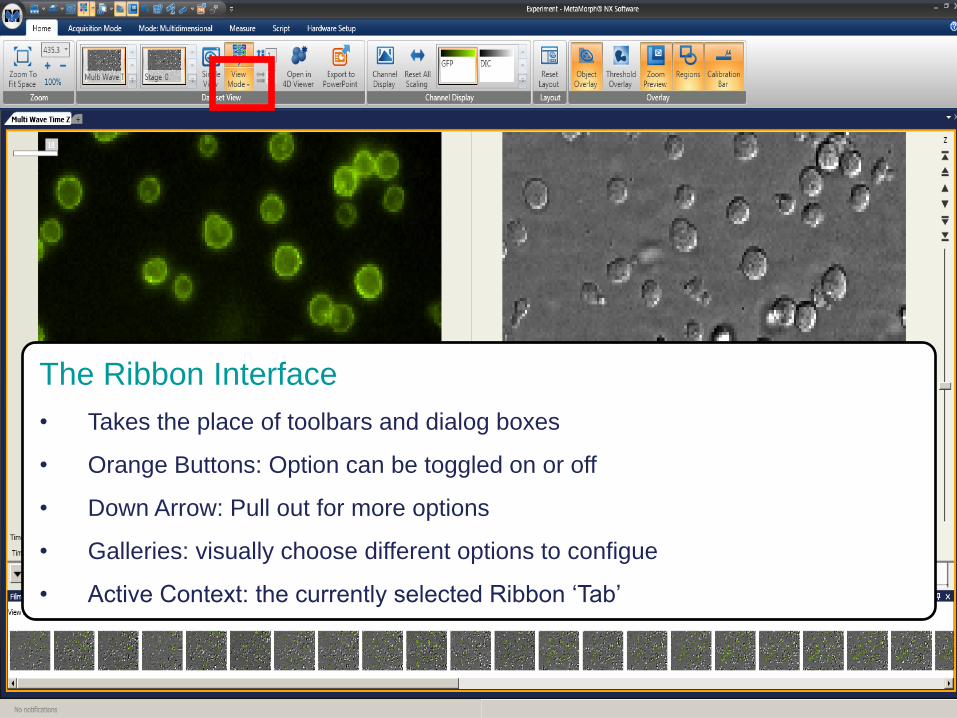
The Ribbon Interface
• Takes the place of toolbars and dialog boxes
• Orange Buttons: Option can be toggled on or off
• Down Arrow: Pull out for more options
• Galleries: visually choose different options to configue
• Active Context: the currently selected Ribbon ‘Tab’

© 2011 Molecular Devices, LLC
MetaMorph NX
The Ribbon Interface
• Takes the place of toolbars and dialog boxes
• Orange Buttons: Option can be toggled on or off
• Down Arrow: Pull out for more options
• Galleries: visually choose different options to configue
• Active Context: the currently selected Ribbon ‘Tab’

© 2011 Molecular Devices, LLC
MetaMorph NX
The Image Grid
• Takes the place of image windows
• Display single or multiple images all
at once
• Configure how the grid gets
displayed
• Choose the current Z or T being
viewed using sliders
• Displays which T, Z, Stage, being
displayed

© 2011 Molecular Devices, LLC
MetaMorph NX
The Image Grid
• Takes the place of image windows
• Display single or multiple images all
at once
• Configure how the grid gets
displayed
• Choose the current Z or T being
viewed using sliders
• Displays which T, Z, Stage, being
displayed

© 2011 Molecular Devices, LLC
MetaMorph NX
The Image Grid
• Takes the place of image windows
• Display single or multiple images all
at once
• Configure how the grid gets
displayed
• Choose the current Z or T being
viewed using sliders
• Displays which T, Z, Stage, being
displayed

© 2011 Molecular Devices, LLC
MetaMorph NX
The Image Grid
• Takes the place of image windows
• Display single or multiple images all
at once
• Configure how the grid gets
displayed
• Choose the current Z or T being
viewed using sliders
• Displays which T, Z, Stage, being
displayed

© 2011 Molecular Devices, LLC
MetaMorph NX
The Image Grid
• Takes the place of image windows
• Display single or multiple images all
at once
• Configure how the grid gets
displayed
• Choose the current Z or T being
viewed using sliders
• Displays which T, Z, Stage, being
displayed

© 2011 Molecular Devices, LLC
MetaMorph NX
The Filmstrip
• Gives visual access to different parts of the experiment
• Makes it easier to select data to view
• Can be configured to show any dimension
• Datasets in Experiment
• Stage Positions
• Time Points
• Z Planes…

© 2011 Molecular Devices, LLC
MetaMorph NX
The 4D Viewer
• Button on Home Toolbar
• Opens Time / Z Experiments into a 4D Dataset View
• Allows color overlays, transparency, isosurfaces
• Make movies or rotations
• Switch to Slice Mode to get view of arbitrary cutout of 3D slices
New Feature

© 2011 Molecular Devices, LLC
MetaMorph NX
The 4D Viewer
• Button on Home Toolbar
• Opens Time / Z Experiments into a 4D Dataset View
• Allows color overlays, transparency, isosurfaces
• Make movies or rotations
• Switch to Slice Mode to get view of arbitrary cutout of 3D slices

© 2011 Molecular Devices, LLC
MetaMorph NX
The 4D Viewer
• Button on Home Toolbar
• Opens Time / Z Experiments into a 4D Dataset View
• Allows color overlays, transparency, isosurfaces
• Make movies or rotations
• Switch to Slice Mode to get view of arbitrary cutout of 3D slices

© 2011 Molecular Devices, LLC
MetaMorph NX
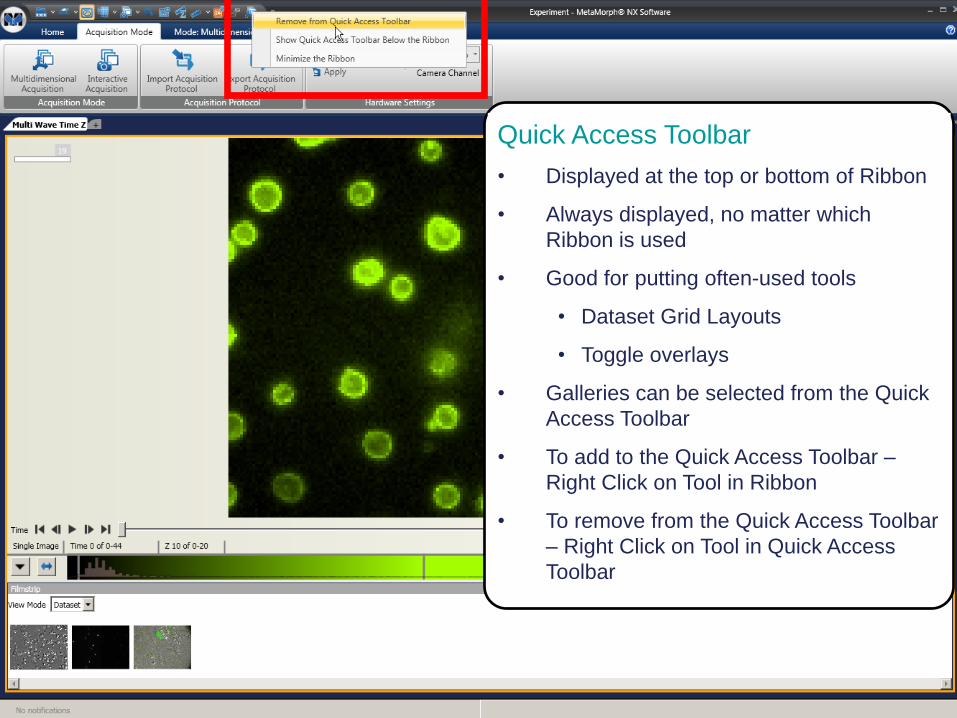
Quick Access Toolbar
• Displayed at the top or bottom of Ribbon
• Always displayed, no matter which
Ribbon is used
• Good for putting often-used tools
• Dataset Grid Layouts
• Toggle overlays
• Galleries can be selected from the Quick
Access Toolbar
• To add to the Quick Access Toolbar –
Right Click on Tool in Ribbon
• To remove from the Quick Access Toolbar
– Right Click on Tool in Quick Access
Toolbar

© 2011 Molecular Devices, LLC
MetaMorph NX
Quick Access Toolbar
• Displayed at the top or bottom of Ribbon
• Always displayed, no matter which
Ribbon is used
• Good for putting often-used tools
• Dataset Grid Layouts
• Toggle overlays
• Galleries can be selected from the Quick
Access Toolbar
• To add to the Quick Access Toolbar –
Right Click on Tool in Ribbon
• To remove from the Quick Access Toolbar
– Right Click on Tool in Quick Access
Toolbar
Using MetaMorph NX
Features of the software to make it easier to use
© 2011 Molecular Devices, LLC
MetaMorph NX
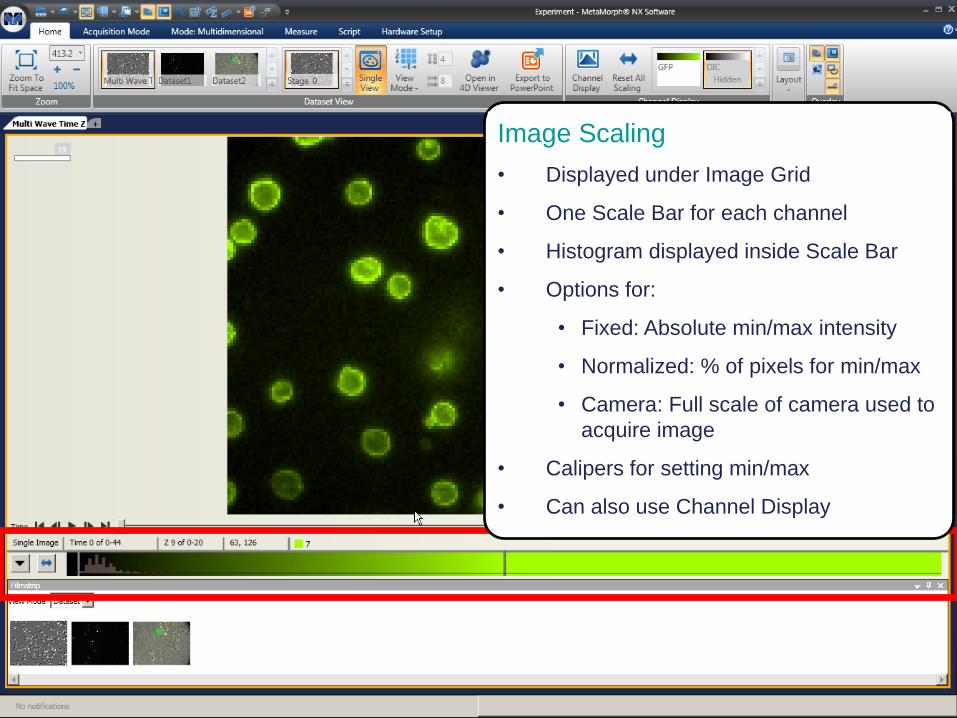
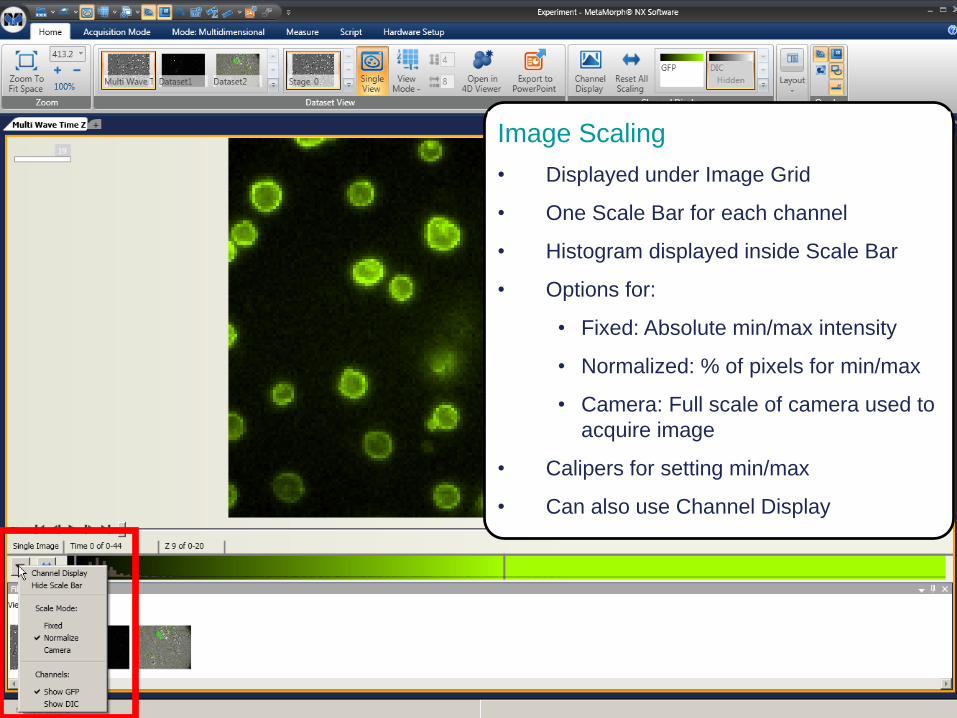
Image Scaling
• Displayed under Image Grid
• One Scale Bar for each channel
• Histogram displayed inside Scale Bar
• Options for:
• Fixed: Absolute min/max intensity
• Normalized: % of pixels for min/max
• Camera: Full scale of camera used to
acquire image
• Calipers for setting min/max
• Can also use Channel Display

© 2011 Molecular Devices, LLC
MetaMorph NX
Image Scaling
• Displayed under Image Grid
• One Scale Bar for each channel
• Histogram displayed inside Scale Bar
• Options for:
• Fixed: Absolute min/max intensity
• Normalized: % of pixels for min/max
• Camera: Full scale of camera used to
acquire image
• Calipers for setting min/max
• Can also use Channel Display
© 2011 Molecular Devices, LLC
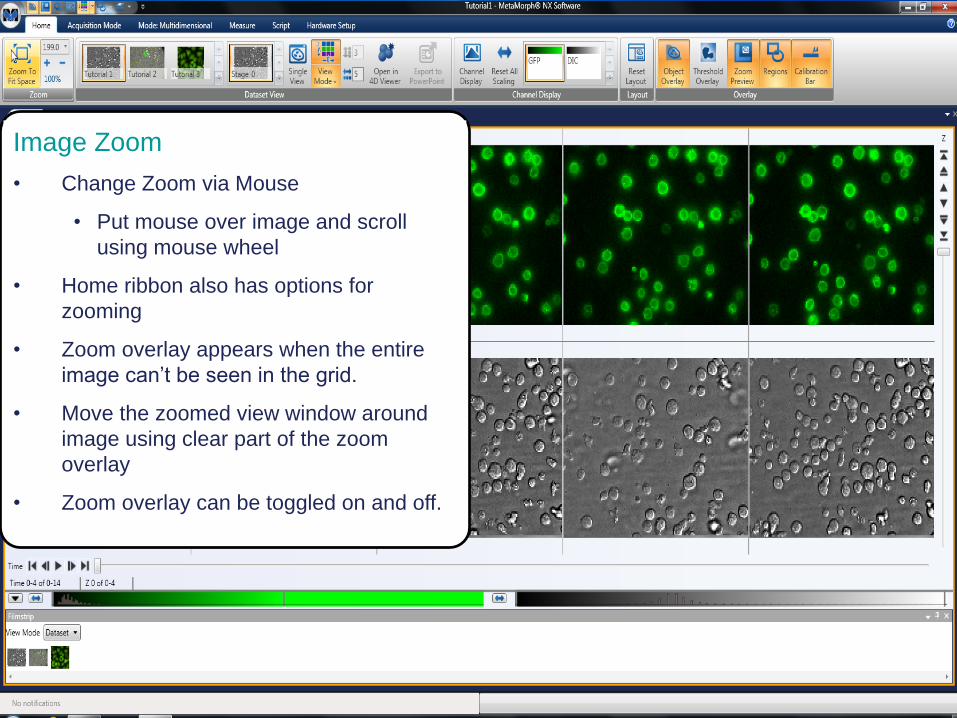
Image Zoom
• Change Zoom via Mouse
• Put mouse over image and scroll
using mouse wheel
• Home ribbon also has options for
zooming
• Zoom overlay appears when the entire
image can’t be seen in the grid.
• Move the zoomed view window around
image using clear part of the zoom
overlay
• Zoom overlay can be toggled on and off.
© 2011 Molecular Devices, LLC
Image Zoom
• Change Zoom via Mouse
• Put mouse over image and scroll
using mouse wheel
• Home ribbon also has options for
zooming
• Zoom overlay appears when the entire
image can’t be seen in the grid.
• Move the zoomed view window around
image using clear part of the zoom
overlay
• Zoom overlay can be toggled on and off.

© 2011 Molecular Devices, LLC
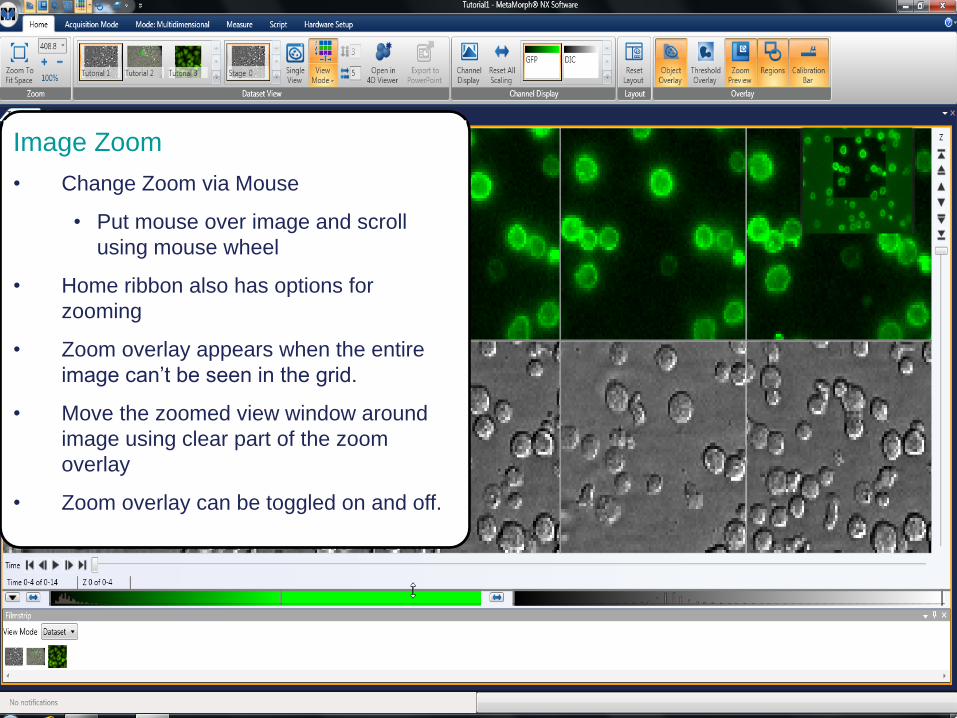
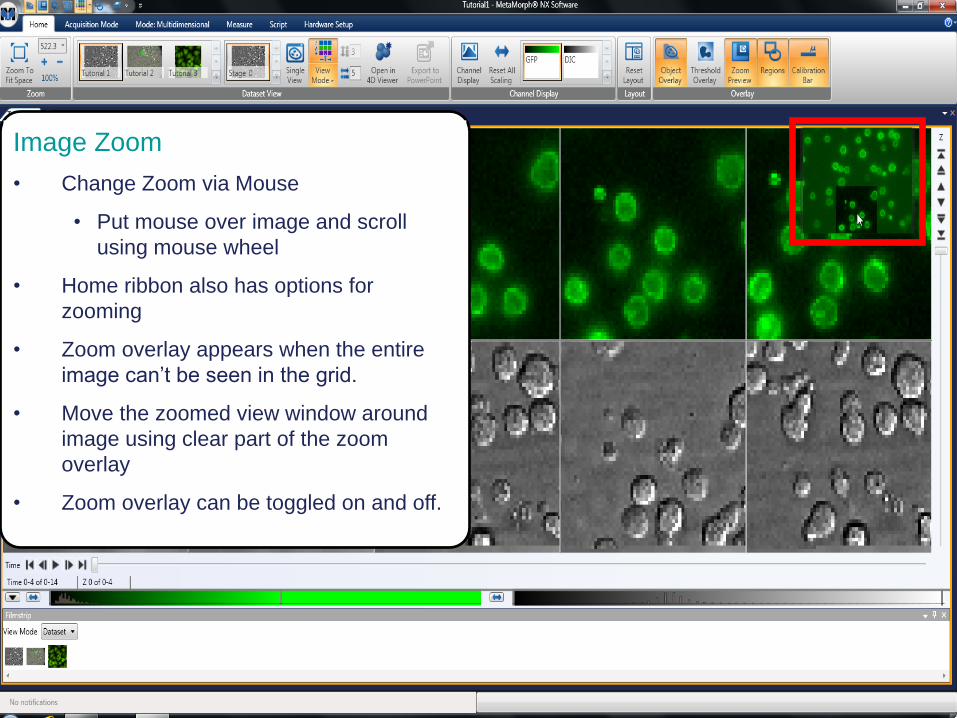
Image Zoom
• Change Zoom via Mouse
• Put mouse over image and scroll
using mouse wheel
• Home ribbon also has options for
zooming
• Zoom overlay appears when the entire
image can’t be seen in the grid.
• Move the zoomed view window around
image using clear part of the zoom
overlay
• Zoom overlay can be toggled on and off.
© 2011 Molecular Devices, LLC
Image Zoom
• Change Zoom via Mouse
• Put mouse over image and scroll
using mouse wheel
• Home ribbon also has options for
zooming
• Zoom overlay appears when the entire
image can’t be seen in the grid.
• Move the zoomed view window around
image using clear part of the zoom
overlay
• Zoom overlay can be toggled on and off.

Opening Images in MetaMorph NX
Opening, creating Experiments from external data

© 2011 Molecular Devices, LLC
MetaMorph NX
Experiments
• Images in MetaMorph NX are always
associated with an Experiment.
• Within each experiment is a group of
related images called a Dataset
• A Dataset is considered all the
images from a single acquisition.
• For example: If you run Multi
Dimensional Acquisition it produces
one Dataset. Run the same MDA
again and it produces a second
Dataset
• Datasets also include the related
measurements and object masks
made on those images
• An Experiment may hold multiple
datasets
The Home Ribbon has a
Dataset Gallery to select
different datasets in the
experiment.

© 2011 Molecular Devices, LLC
MetaMorph NX
Experiments
• Images in MetaMorph NX are always
associated with an Experiment.
• Within each experiment is a group of
related images called a Dataset
• A Dataset is considered all the
images from a single acquisition.
• For example: If you run Multi
Dimensional Acquisition it produces
one Dataset. Run the same MDA
again and it produces a second
Dataset
• Datasets also include the related
measurements and object masks
made on those images
• An Experiment may hold multiple
datasets
The Filmstrip can also be
used to select between
Datasets in the current
experiment.

© 2011 Molecular Devices, LLC
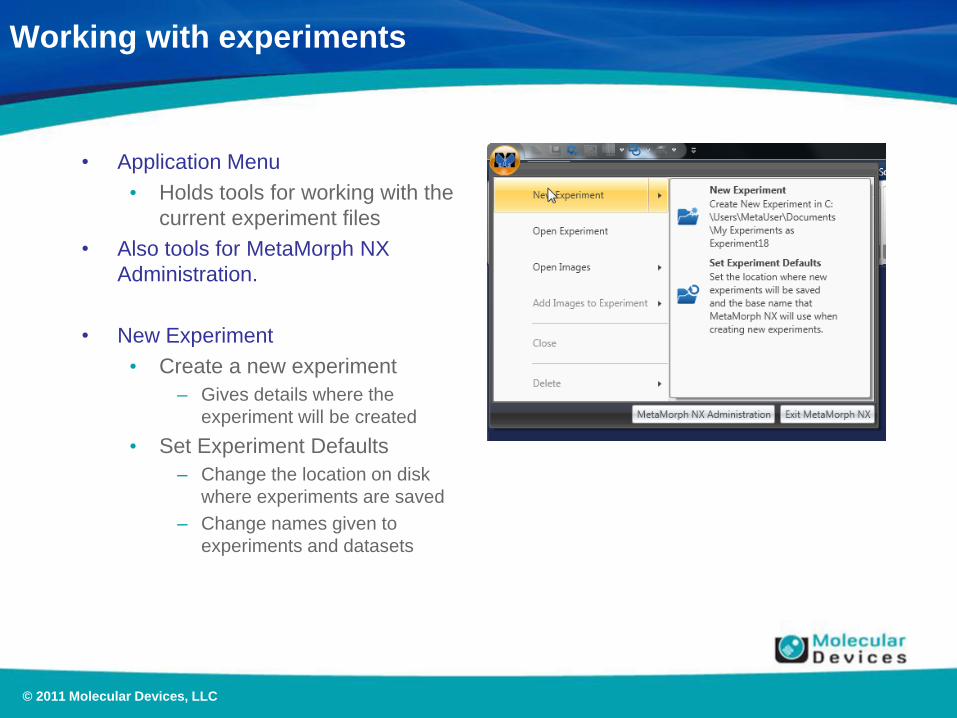
Working with experiments
• Application Menu
• Holds tools for working with the
current experiment files
• Also tools for MetaMorph NX
Administration.
• New Experiment
• Create a new experiment
– Gives details where the
experiment will be created
• Set Experiment Defaults
– Change the location on disk
where experiments are saved
– Change names given to
experiments and datasets
© 2011 Molecular Devices, LLC
Working with experiments
• Application Menu
• Holds tools for working with the
current experiment files
• Also tools for MetaMorph NX
Administration.
• New Experiment
• Create a new experiment
– Gives details where the
experiment will be created
• Set Experiment Defaults
– Change the location on disk
where experiments are saved
– Change names given to
experiments and datasets

© 2011 Molecular Devices, LLC
Working with experiments
• Application Menu
• Holds tools for working with the
current experiment files
• Also tools for MetaMorph NX
Administration.
• Open Experiment
• Loads a previously saved
experiment into MetaMorph NX
• Experiments are saved into a
folder with their name on it
• Always open the
‘Experiment.mexp’ file.

© 2011 Molecular Devices, LLC
Experiment File Structure
Experiment Name Experiment Path

© 2011 Molecular Devices, LLC
Experiment File Structure
Datasets
Experiment File

© 2011 Molecular Devices, LLC
Working with experiments
• Application Menu
• Holds tools for working with the
current experiment files
• Also tools for MetaMorph NX
Administration.
• Open Images
• Opens images acquired outside of
MetaMorph NX into a New
Experiment
• Open Image
– Select a single image, or import
a .ND file from MetaMorph
• Channel / Time / Z Series
– Import multiple images or stage is a
series of the given dimension
• Stage Series
– Opens multiple images – each
image is considered a new stage
location.

© 2011 Molecular Devices, LLC
One Stage Position Two Channels

© 2011 Molecular Devices, LLC
Working with experiments
• Application Menu
• Holds tools for working with the
current experiment files
• Also tools for MetaMorph NX
Administration.
• Open Images
• Opens images acquired outside of
MetaMorph NX into a New
Experiment
• Open Image
– Select a single image, or import
a .ND file from MetaMorph
• Channel / Time / Z Series
– Import multiple images or stage is a
series of the given dimension
• Stage Series
– Opens multiple images – each
image is considered a new stage
location.

© 2011 Molecular Devices, LLC
Two Stage Positions One Channel

© 2011 Molecular Devices, LLC
Working with experiments
• Application Menu
• Holds tools for working with the
current experiment files
• Also tools for MetaMorph NX
Administration.
• Open Images
• Opens images acquired outside of
MetaMorph NX into a New
Experiment
• Open Image
– Select a single image, or import
a .ND file from MetaMorph
• Channel / Time / Z Series
– Import multiple images or stage is a
series of the given dimension
• Stage Series
– Opens multiple images – each
image is considered a new stage
location.

© 2011 Molecular Devices, LLC
Two Stage Positions Two Channels
© 2011 Molecular Devices, LLC
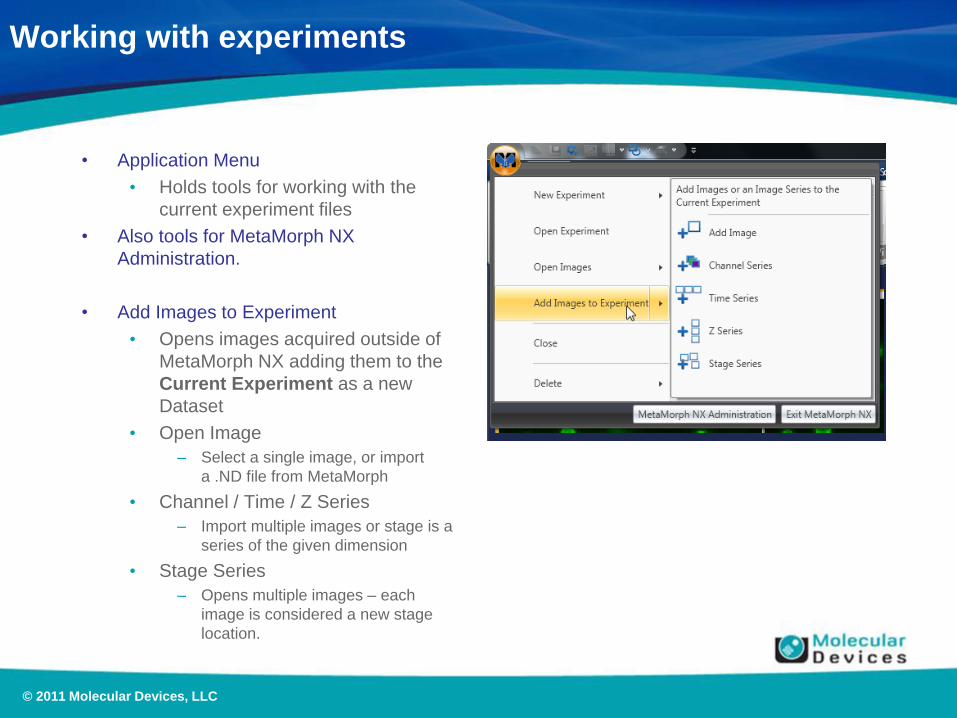
Working with experiments
• Application Menu
• Holds tools for working with the
current experiment files
• Also tools for MetaMorph NX
Administration.
• Add Images to Experiment
• Opens images acquired outside of
MetaMorph NX adding them to the
Current Experiment as a new
Dataset
• Open Image
– Select a single image, or import
a .ND file from MetaMorph
• Channel / Time / Z Series
– Import multiple images or stage is a
series of the given dimension
• Stage Series
– Opens multiple images – each
image is considered a new stage
location.

Measurements
Basic Measurement Tools in MM NX
© 2011 Molecular Devices, LLC
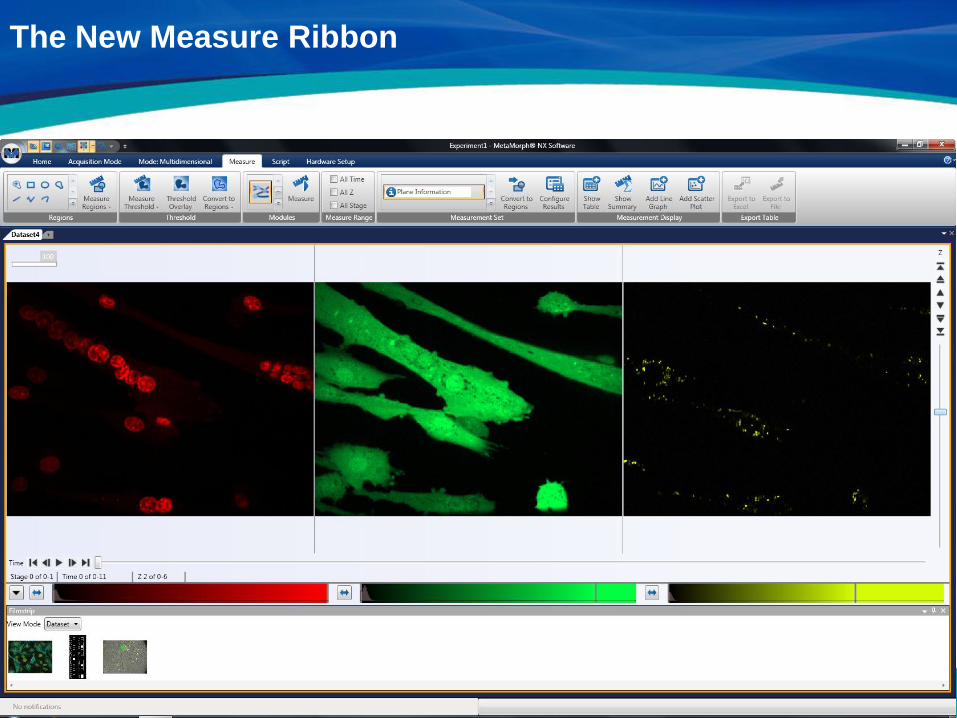
The New Measure Ribbon

© 2011 Molecular Devices, LLC
The New Measure Ribbon
• MetaMorph 2.0.1 has re-designed the measure ribbon
• Reorganized tools like Regions, Thresholding, and Modules
• Added space for the Application Modules
• Added tools for exporting data
• Added tools for turning thresholds and Module masks to Regions of
Interest.
© 2011 Molecular Devices, LLC
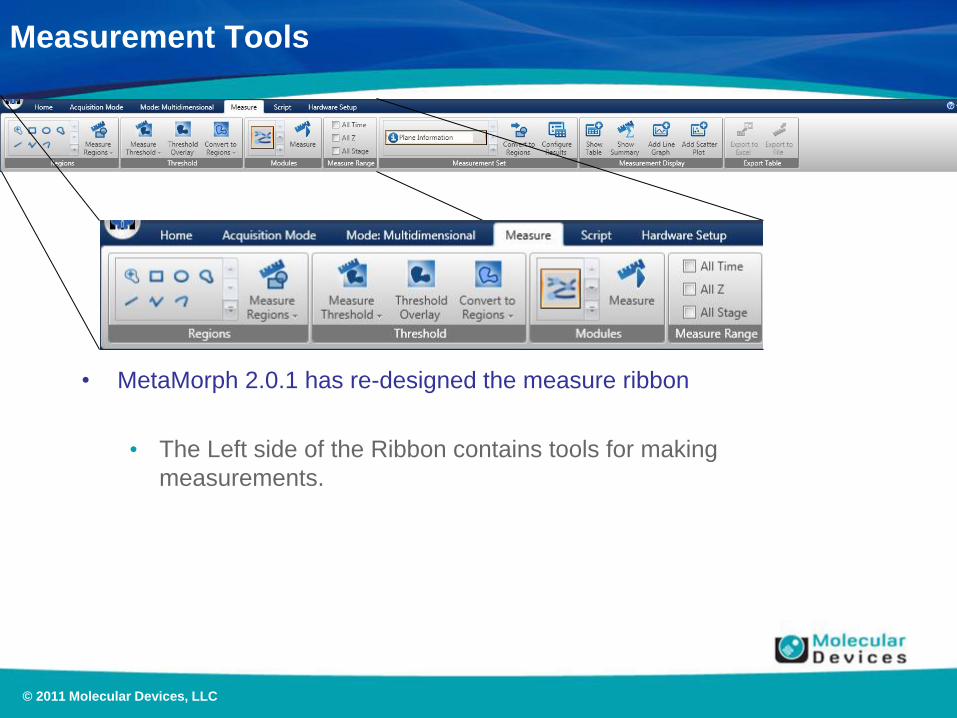
Measurement Tools
• MetaMorph 2.0.1 has re-designed the measure ribbon
• The Left side of the Ribbon contains tools for making
measurements.

© 2011 Molecular Devices, LLC
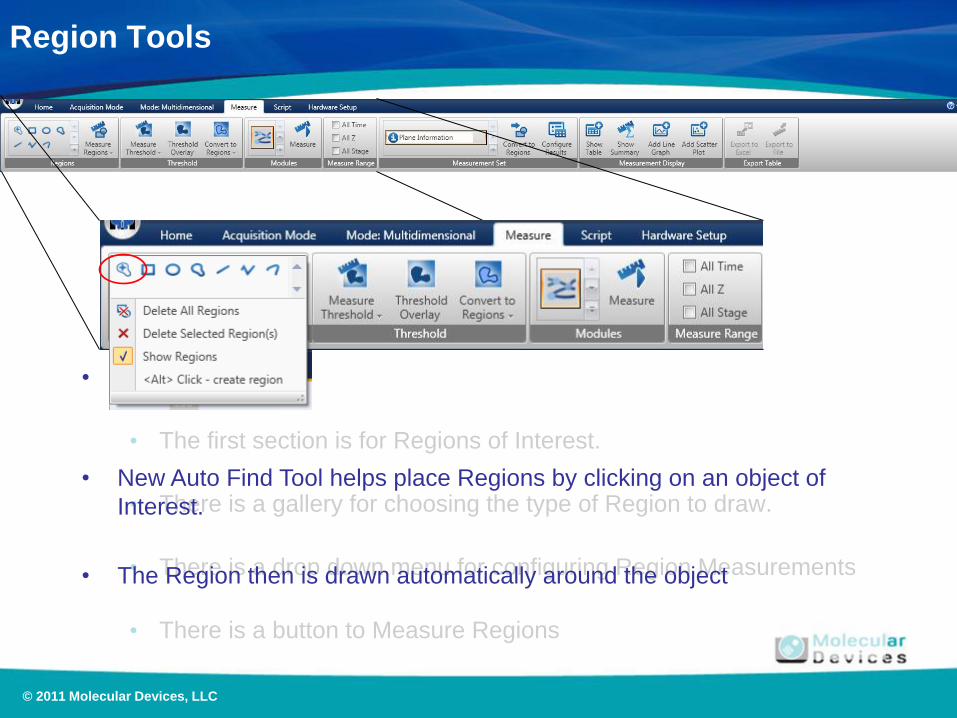
Region Tools
• Regions
• The first section is for Regions of Interest.
• There is a gallery for choosing the type of Region to draw.
• There is a drop down menu for configuring Region Measurements
• There is a button to Measure Regions

© 2011 Molecular Devices, LLC
Region Tools
• Regions
• The first section is for Regions of Interest.
• There is a gallery for choosing the type of Region to draw.
• There is a drop down menu for configuring Region Measurements
• There is a button to Measure Regions
© 2011 Molecular Devices, LLC
Region Tools
• Regions
• The first section is for Regions of Interest.
• There is a gallery for choosing the type of Region to draw.
• There is a drop down menu for configuring Region Measurements
• There is a button to Measure Regions
• New Auto Find Tool helps place Regions by clicking on an object of
Interest.
• The Region then is drawn automatically around the object

© 2011 Molecular Devices, LLC
Region Tools
• Use the Crosshairs to click on an object of Interest
• The Region then is drawn automatically around the object

© 2011 Molecular Devices, LLC
Region Tools
• Use the Crosshairs to click on an object of Interest
• The Region then is drawn automatically around the object

© 2011 Molecular Devices, LLC
Region Tools
• Regions
• The first section is for Regions of Interest.
• There is a gallery for choosing the type of Region to draw.
• There is a drop down menu for configuring Region Measurements
• There is a button to Measure Regions

© 2011 Molecular Devices, LLC
Region Tools
• Regions
• The first section is for Regions of Interest.
• There is a gallery for choosing the type of Region to draw.
• There is a drop down menu for configuring Region Measurements
• There is a button to Measure Regions

© 2011 Molecular Devices, LLC
Region Tools
• Regions
• The first section is for Regions of Interest.
• There is a gallery for choosing the type of Region to draw.
• There is a drop down menu for configuring Region Measurements
• There is a button to Measure Regions
• TIP
• Press the ALT key and click on the image to continue to place
Regions of the same type
© 2011 Molecular Devices, LLC
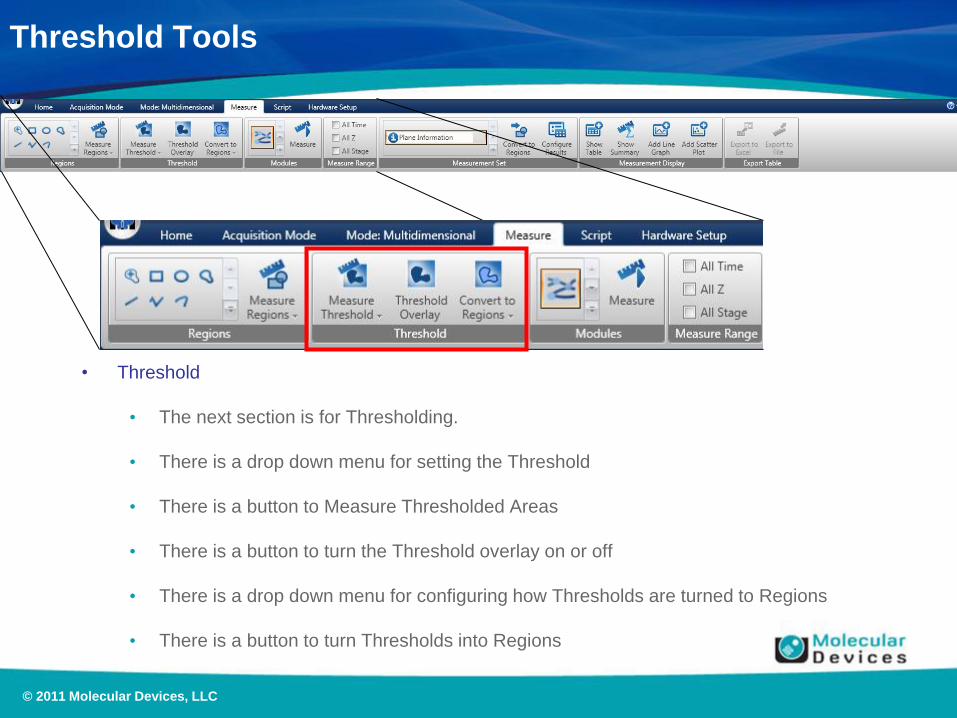
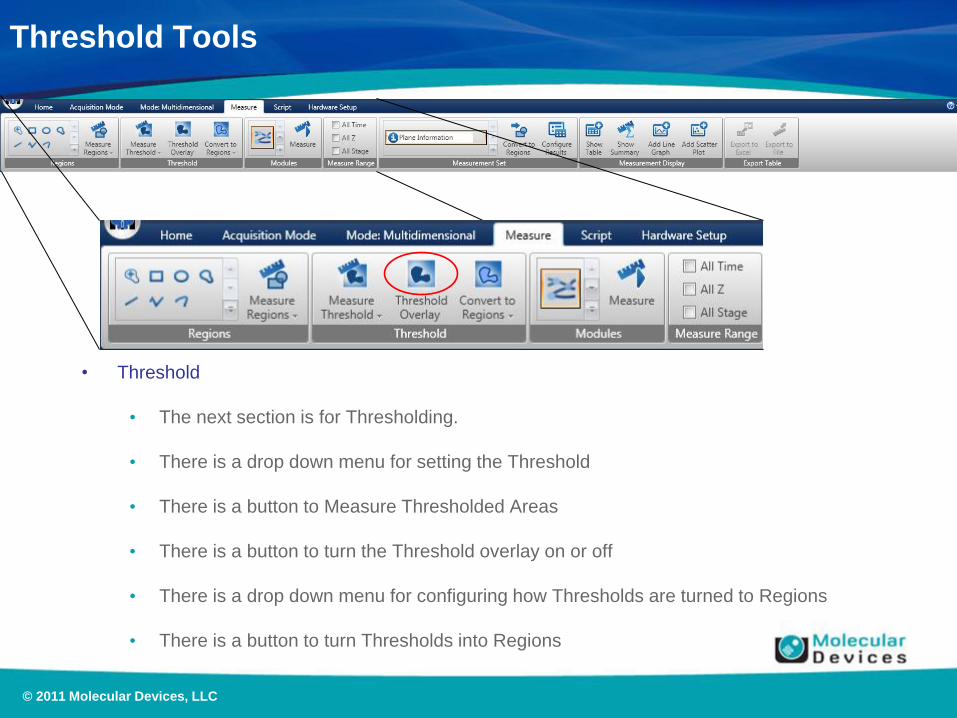
Threshold Tools
• Threshold
• The next section is for Thresholding.
• There is a drop down menu for setting the Threshold
• There is a button to Measure Thresholded Areas
• There is a button to turn the Threshold overlay on or off
• There is a drop down menu for configuring how Thresholds are turned to Regions
• There is a button to turn Thresholds into Regions

© 2011 Molecular Devices, LLC

© 2011 Molecular Devices, LLC
Low and High Range Calipers

© 2011 Molecular Devices, LLC
Threshold Mask Cleanup

© 2011 Molecular Devices, LLC
Threshold Tools
• Threshold
• The next section is for Thresholding.
• There is a drop down menu for setting the Threshold
• There is a button to Measure Thresholded areas
• There is a button to turn the Threshold overlay on or off
• There is a drop down menu for configuring how Thresholds are turned to Regions
• There is a button to turn Thresholds into Regions
© 2011 Molecular Devices, LLC
Threshold Tools
• Threshold
• The next section is for Thresholding.
• There is a drop down menu for setting the Threshold
• There is a button to Measure Thresholded Areas
• There is a button to turn the Threshold overlay on or off
• There is a drop down menu for configuring how Thresholds are turned to Regions
• There is a button to turn Thresholds into Regions

© 2011 Molecular Devices, LLC
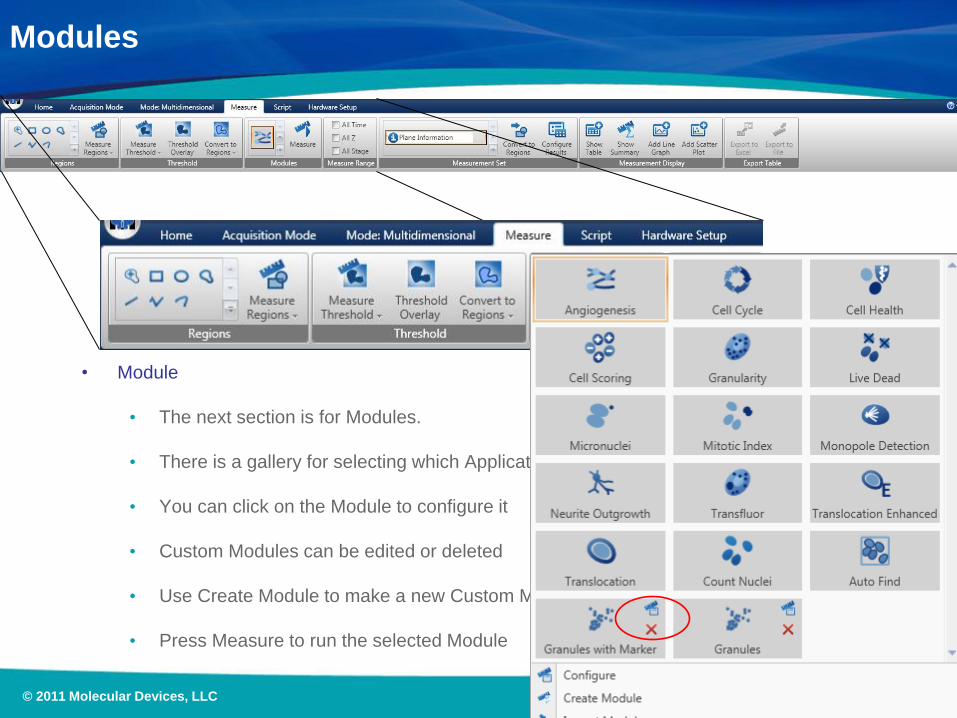
Modules
• Module
• The next section is for Modules.
• There is a gallery for selecting which Application or Custom Module to run
• You can click on the Module to configure it
• Custom Modules can be edited or deleted
• Use Create Module to make a new Custom Module
• Press Measure to run the selected Module

© 2011 Molecular Devices, LLC
Modules
• Many of the Application Modules also
have the Click To Find feature
• Modules are easier to setup – no
measuring intensities or sizes
needed
• Modules also have Fast Algorithm
options
• Perform similar to Standard
algorithm, but run 2x faster (or
more)
© 2011 Molecular Devices, LLC
Modules
• Module
• The next section is for Modules.
• There is a gallery for selecting which Application or Custom Module to run
• You can click on the Module to configure it
• Custom Modules can be edited or deleted
• Use Create Module to make a new Custom Module
• Press Measure to run the selected Module

© 2011 Molecular Devices, LLC
Modules
• Measured Images
• Measure Range defines what Images to measure using any of the
3 Measure buttons.
• If no options are turned on, only the Visible images are measured
• Turn on All Time, All Z, and All Stage to measure your entire
dataset.

© 2011 Molecular Devices, LLC
Measurement Tools
• Measurements
• The Right side of the Ribbon contains tools for after you make
measurements.
• Such as selecting or displaying data, and converting Masks to
Regions.

© 2011 Molecular Devices, LLC
Measurement Tools
• Measurement Set
• A Measurement Set contains all the result, the numbers and the masks, from any one measurement.
• There is a gallery to choose which Measurement Set to work with.
• There is a button to turn the masks associated with the active Measurement Set into Regions
• There is a button to configure what Objects to keep in for Display.

© 2011 Molecular Devices, LLC
Measurement Tools
• Measurement Set Configuration
• Choose which Measurement Columns
will be displayed.
• Filter un-desired Objects out.

© 2011 Molecular Devices, LLC
Measurement Tools
• Measurement Set Configuration
• Choose which Measurement Columns
will be displayed.
• Filter un-desired Objects out.
© 2011 Molecular Devices, LLC
Measurement Tools
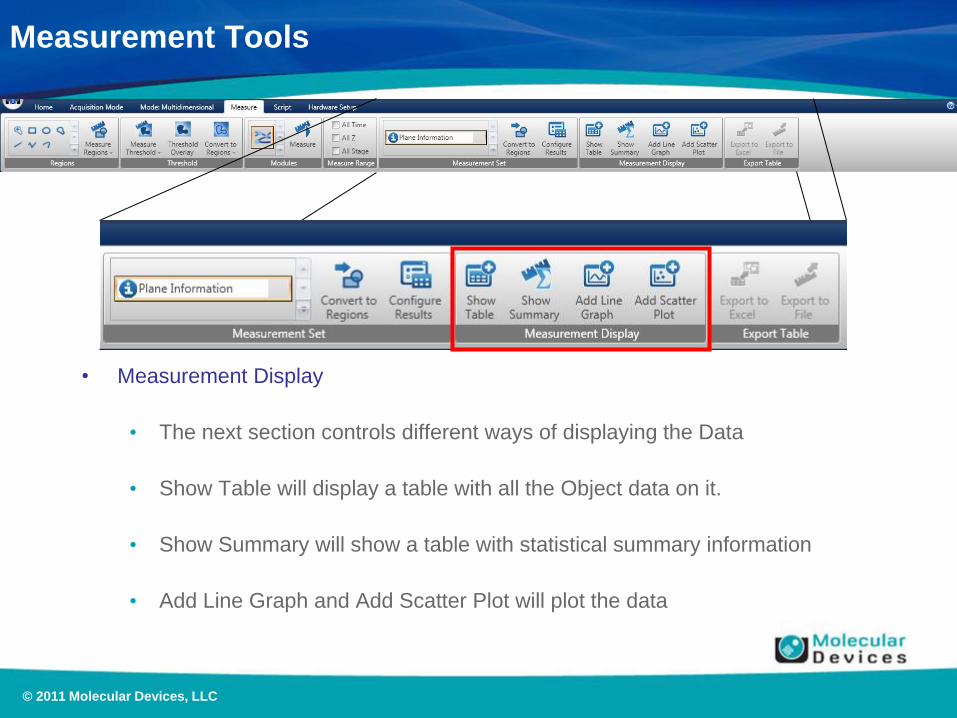
• Measurement Display
• The next section controls different ways of displaying the Data
• Show Table will display a table with all the Object data on it.
• Show Summary will show a table with statistical summary information
• Add Line Graph and Add Scatter Plot will plot the data

© 2011 Molecular Devices, LLC
Measurement Tools
• Measurement Display
• The next section controls different ways of displaying the Data
• Show Table will display a table with all the Object data on it.
• Show Summary will show a table with statistical summary information
• Add Line Graph and Add Scatter Plot will plot the data

© 2011 Molecular Devices, LLC
The Graph Ribbon
• When a Line Graph or Scatter Plot is shown,
the Graph Ribbon becomes available
• The Graph Ribbon allows you to resize
an move the displayed area of the graph
• The Graph can have different Layouts,
controlling what labels and text get
displayed
• Graphs can have different styles, controlling colors, line thicknesses and data
points
• Graph Settings can be used to further modify the style.

© 2011 Molecular Devices, LLC
The Graph Ribbon
• When a Line Graph or Scatter Plot is shown,
• the Graph Ribbon becomes available
• The Graph Ribbon allows you to resize
• an move the displayed area of the graph
• The Graph can have different Layouts,
• controlling what labels and text get
• displayed
• Graphs can have different styles, controlling colors, line thicknesses and data
points
• Graph Settings can be used to further modify the style.

© 2011 Molecular Devices, LLC
The Graph Ribbon
• When a Line Graph or Scatter Plot is shown, the Graph Ribbon
becomes available
• The Graph Ribbon allows you to resize an move the displayed area
of the graph
• The Graph can have different Layouts, controlling what labels and
text get displayed
• Graphs can have different styles, controlling colors, line
thicknesses and data points
• Graph Settings can be used to further modify the style.
© 2011 Molecular Devices, LLC
Measurement Tools
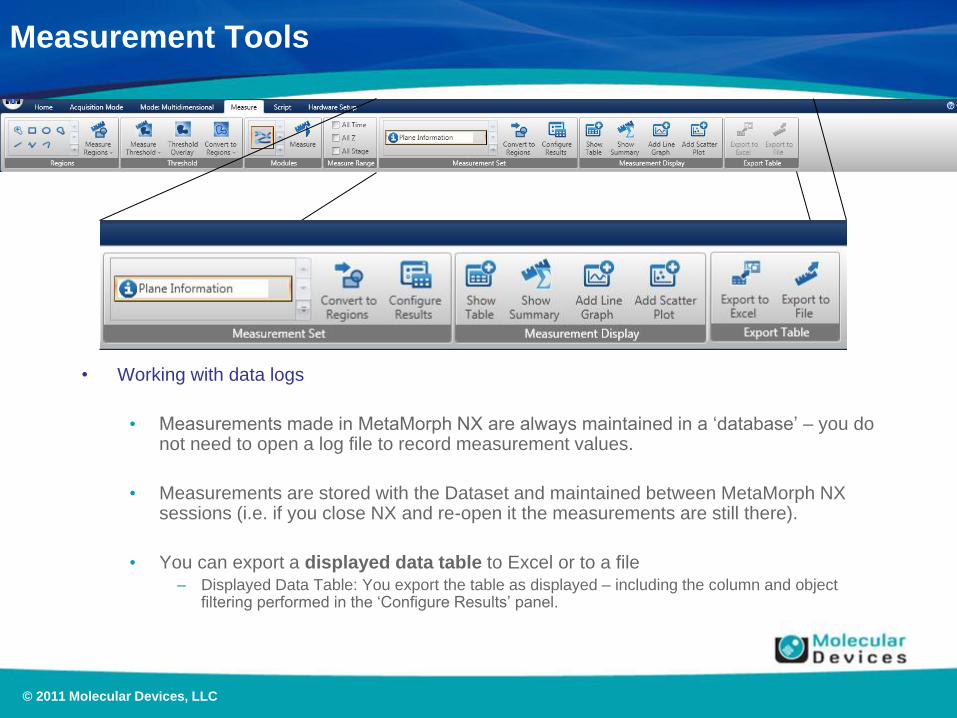
• Working with data logs
• Measurements made in MetaMorph NX are always maintained in a ‘database’ – you do not need to open a log file to record measurement values.
• Measurements are stored with the Dataset and maintained between MetaMorph NX sessions (i.e. if you close NX and re-open it the measurements are still there).
• You can export a displayed data table to Excel or to a file – Displayed Data Table: You export the table as displayed – including the column and object
filtering performed in the ‘Configure Results’ panel.

© 2011 Molecular Devices, LLC
Measurement Tools
• Working with data logs
• Measurements made in MetaMorph NX are always maintained in a ‘database’ – you do not need to open a log file to record measurement values.
• Measurements are stored with the Dataset and maintained between MetaMorph NX sessions (i.e. if you close NX and re-open it the measurements are still there).
• You can export a displayed data table to Excel or to a file – Displayed Data Table: You export the table as displayed – including the column and object
filtering performed in the ‘Configure Results’ panel.

© 2011 Molecular Devices, LLC
MetaMorph NX can directly export
to Excel 2003, 2007, or 2010 if it is
installed on the system.

© 2011 Molecular Devices, LLC
Or MetaMorph NX can write data to
an XLS file or CSV file if Excel is not
present on the computer.

© 2011 Molecular Devices, LLC
Using the Analysis Builder
Custom Modules

© 2011 Molecular Devices, LLC
Why Custom Modules? (aka the analysis builder)
• Application Modules are great
but…
• Many times customers need
to ‘add to’ what App
Modules provide
• So many things to measure
– not all application modules
• Not Journals!
• Easier to use than journals
• Most segmentation tools
available to journals are
present
• UI makes it easier to find
the tool, test options,
without getting lost in menus
or minutia
• Custom Modules are Modules
• Can be run exactly like
application modules
• Measurements are logged
the same as application
modules
© 2011 Molecular Devices, LLC
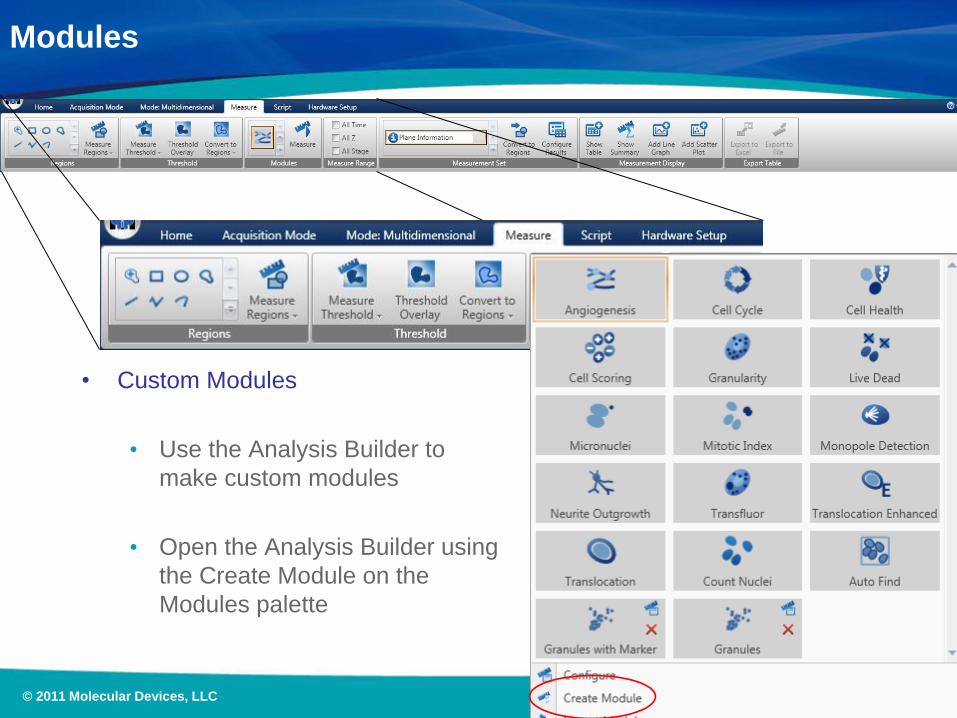
Modules
• Custom Modules
• Use the Analysis Builder to
make custom modules
• Open the Analysis Builder using
the Create Module on the
Modules palette

© 2011 Molecular Devices, LLC
The Analysis Builder

© 2011 Molecular Devices, LLC
A New Dataset View:
The Analysis Builder opens up in a New Dataset View.
The display, image grid, data tables, and filmstrip are
independent of the original dataset view used to create it.
© 2011 Molecular Devices, LLC
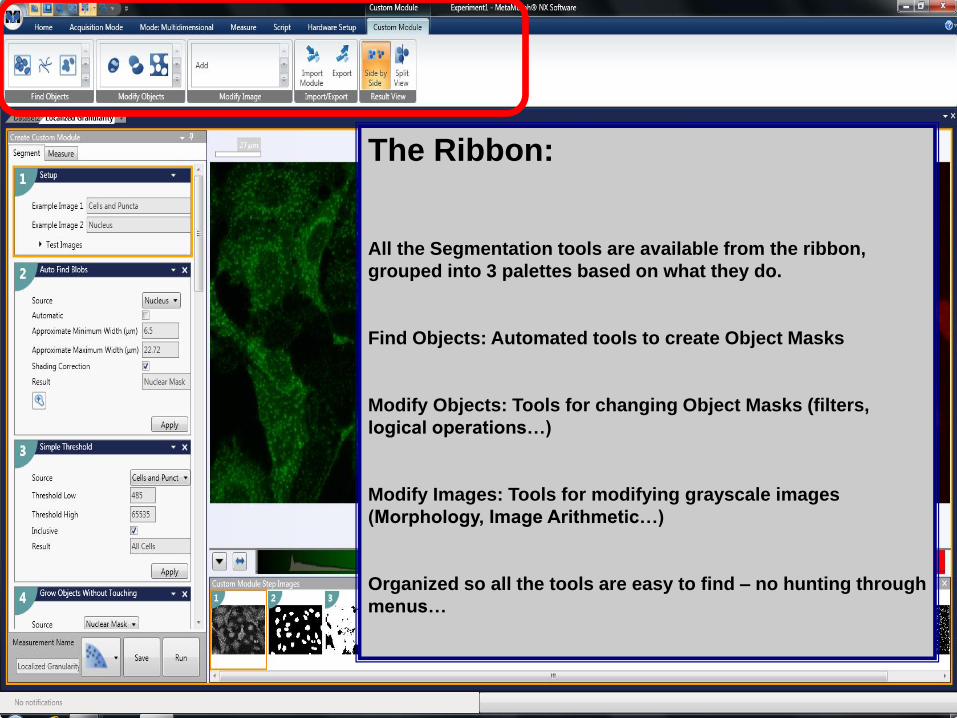
The Ribbon:
All the Segmentation tools are available from the ribbon,
grouped into 3 palettes based on what they do.
Find Objects: Automated tools to create Object Masks
Modify Objects: Tools for changing Object Masks (filters,
logical operations…)
Modify Images: Tools for modifying grayscale images
(Morphology, Image Arithmetic…)
Organized so all the tools are easy to find – no hunting through
menus…

© 2011 Molecular Devices, LLC
The Module:
Steps in the module are displayed as discrete cards. Each
card has all the parameters need to configure that step.
Easier to read than journals, the cards are friendlier and less
intimidating than the programming look of journals.

© 2011 Molecular Devices, LLC
The Filmstrip:
Each step in the module has its own thumbnail result in the
filmstrip.
Easier to identify what each step does, and if it is working.
Easier to navigate back to a step which may be causing a
problem – just click the offending thumbnail.

© 2011 Molecular Devices, LLC
Custom Modules
• The Custom Module Ribbon
• Modify Image: Tools for processing grayscale images
• Find Objects: Tools for creating masks and detecting objects from
grayscale images
• Modify Objects: Tools for changing or selecting masks.
© 2011 Molecular Devices, LLC
Modify Images
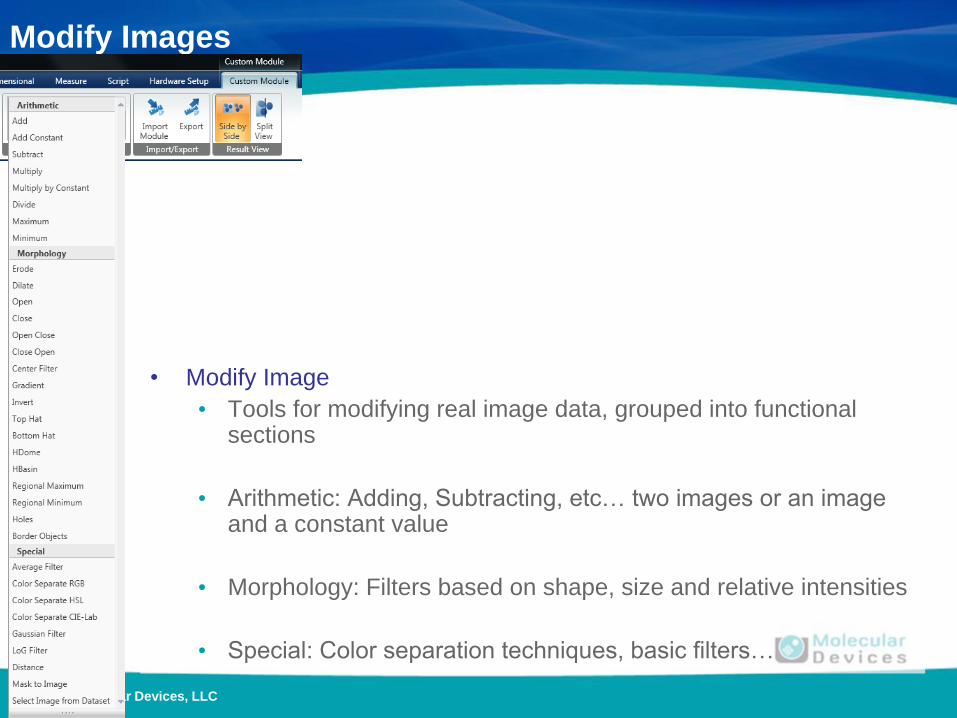
• Modify Image
• Tools for modifying real image data, grouped into functional sections
• Arithmetic: Adding, Subtracting, etc… two images or an image and a constant value
• Morphology: Filters based on shape, size and relative intensities
• Special: Color separation techniques, basic filters…

© 2011 Molecular Devices, LLC
Modify Images
• Modify Image
• Tools for modifying real image data, grouped into functional sections
• Arithmetic: Adding, Subtracting, etc… two images or an image and a constant value
• Morphology: Filters based on shape, size and relative intensities
• Special: Color separation techniques, basic filters…

© 2011 Molecular Devices, LLC
Modify Objects
• Modify Objects
• Tools for resizing, selecting, or reshaping objects on a mask
• Example object selecting tools: – Logical Operations
– Keep/Remove Marked Objects
– Filter Mask
• Example object resizing tools: – Grow Objects
– Grow Objects Without Touching
– Shrink Objects
• Example reshaping tools: – Invert Object
– Watershed
– Fill Holes
© 2011 Molecular Devices, LLC
Find Objects
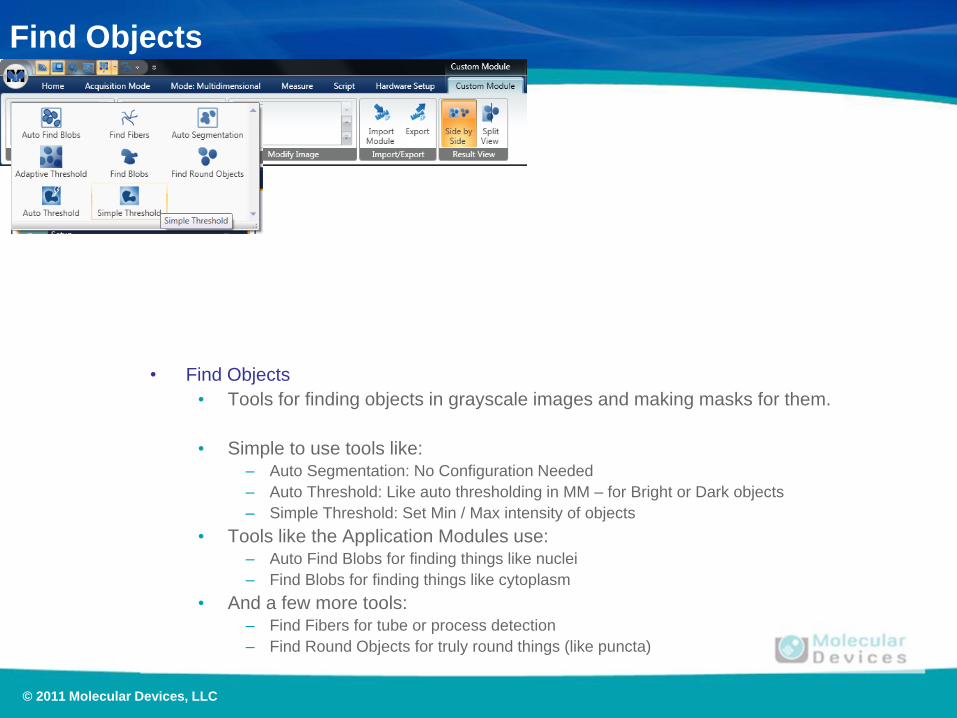
• Find Objects
• Tools for finding objects in grayscale images and making masks for them.
• Simple to use tools like: – Auto Segmentation: No Configuration Needed
– Auto Threshold: Like auto thresholding in MM – for Bright or Dark objects
– Simple Threshold: Set Min / Max intensity of objects
• Tools like the Application Modules use: – Auto Find Blobs for finding things like nuclei
– Find Blobs for finding things like cytoplasm
• And a few more tools: – Find Fibers for tube or process detection
– Find Round Objects for truly round things (like puncta)

© 2011 Molecular Devices, LLC
Find Objects
• Auto Segmentation
• Find all kinds of Objects with NO values to configure.
• Great for objects of all sizes and shapes
• Does not split touching objects
• May need to filter small objects out
© 2011 Molecular Devices, LLC
Find Objects
• Find Objects
• Tools for finding objects in grayscale images and making masks for them.
• Simple to use tools like: – Auto Segmentation: No Configuration Needed
– Auto Threshold: Like auto thresholding in MM – for Bright or Dark objects
– Simple Threshold: Set Min / Max intensity of objects
• Tools like the Application Modules use: – Auto Find Blobs for finding things like nuclei
– Find Blobs for finding things like cytoplasm
• And a few more tools: – Find Fibers for tube or process detection
– Find Round Objects for truly round things (like puncta)

© 2011 Molecular Devices, LLC
Find Objects
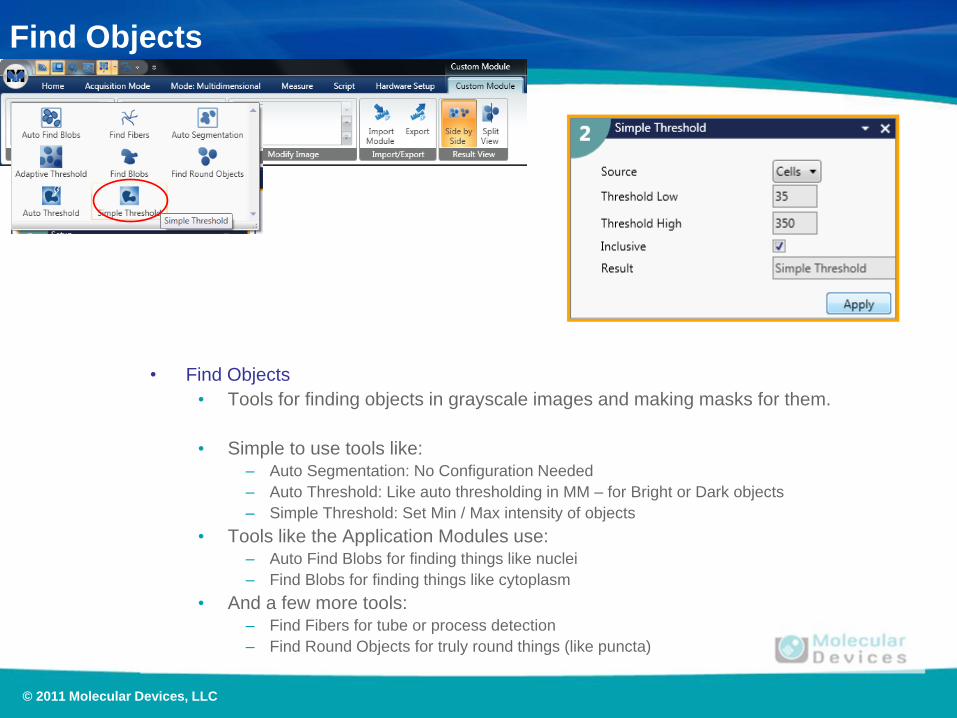
• Simple Threshold
• Identify objects based on their absolute intensity
• Set a Low and High Threshold Value
• Inclusive On = Target intensities are between the Low and High values
• Inclusive Off = Target intensities are those values NOT between the Low and High

© 2011 Molecular Devices, LLC
Find Objects
• Find Objects
• Tools for finding objects in grayscale images and making masks for them.
• Simple to use tools like: – Auto Segmentation: No Configuration Needed
– Auto Threshold: Like auto thresholding in MM – for Bright or Dark objects
– Simple Threshold: Set Min / Max intensity of objects
• Tools like the Application Modules use: – Auto Find Blobs for finding things like nuclei
– Find Blobs for finding things like cytoplasm
• And a few more tools: – Find Fibers for tube or process detection
– Find Round Objects for truly round things (like puncta)

© 2011 Molecular Devices, LLC
Find Objects
• Find Round Objects
• Great at finding round things
• Splits touching objects
• Best for small objects
• Not best option for nuclei – nuclei can be more cigar shaped …

© 2011 Molecular Devices, LLC
Find Objects
• Find Objects
• Tools for finding objects in grayscale images and making masks for them.
• Simple to use tools like: – Auto Segmentation: No Configuration Needed
– Auto Threshold: Like auto thresholding in MM – for Bright or Dark objects
– Simple Threshold: Set Min / Max intensity of objects
• Tools like the Application Modules use: – Auto Find Blobs for finding things like nuclei
– Find Blobs for finding things like cytoplasm
• And a few more tools: – Find Fibers for tube or process detection
– Find Round Objects for truly round things (like puncta)
© 2011 Molecular Devices, LLC
Find Objects
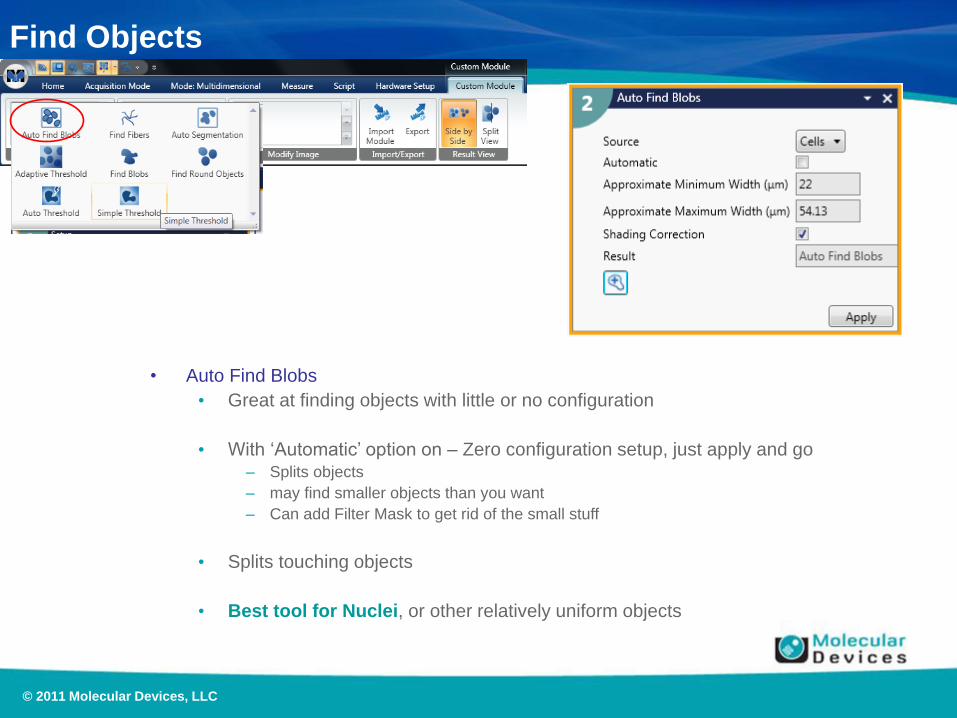
• Auto Find Blobs
• Great at finding objects with little or no configuration
• With ‘Automatic’ option on – Zero configuration setup, just apply and go – Splits objects
– may find smaller objects than you want
– Can add Filter Mask to get rid of the small stuff
• Splits touching objects
• Best tool for Nuclei, or other relatively uniform objects

© 2011 Molecular Devices, LLC
Find Objects
• Find Objects
• Tools for finding objects in grayscale images and making masks for them.
• Simple to use tools like: – Auto Segmentation: No Configuration Needed
– Auto Threshold: Like auto thresholding in MM – for Bright or Dark objects
– Simple Threshold: Set Min / Max intensity of objects
• Tools like the Application Modules use: – Auto Find Blobs for finding things like nuclei
– Find Blobs for finding things like cytoplasm
• And a few more tools: – Find Fibers for tube or process detection
– Find Round Objects for truly round things (like puncta)
© 2011 Molecular Devices, LLC
Find Objects
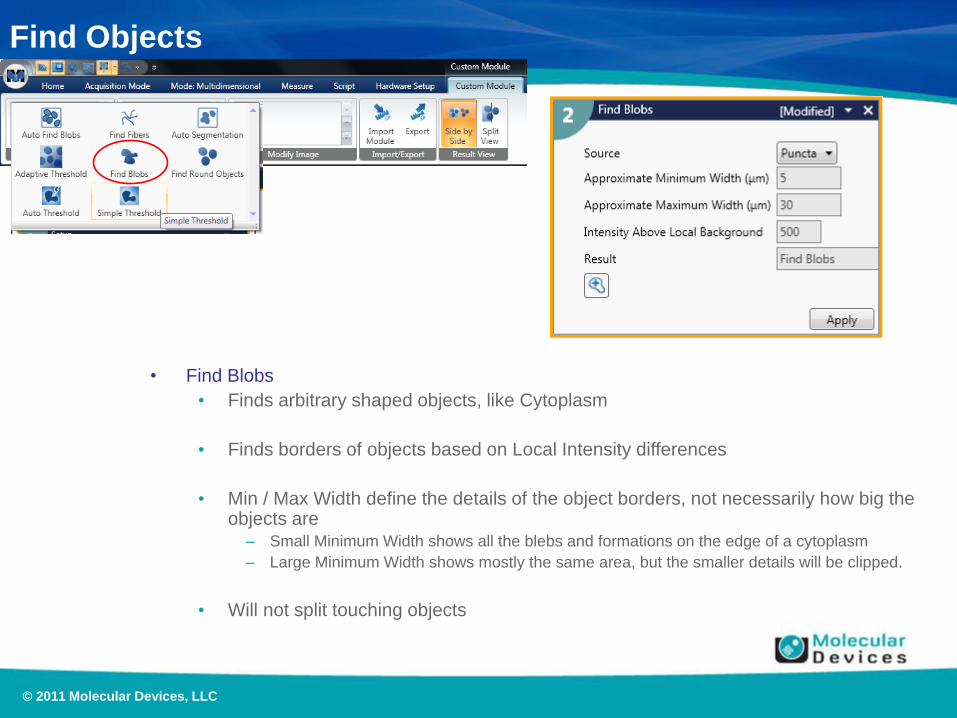
• Find Blobs
• Finds arbitrary shaped objects, like Cytoplasm
• Finds borders of objects based on Local Intensity differences
• Min / Max Width define the details of the object borders, not necessarily how big the objects are
– Small Minimum Width shows all the blebs and formations on the edge of a cytoplasm
– Large Minimum Width shows mostly the same area, but the smaller details will be clipped.
• Will not split touching objects
© 2011 Molecular Devices, LLC
Find Objects
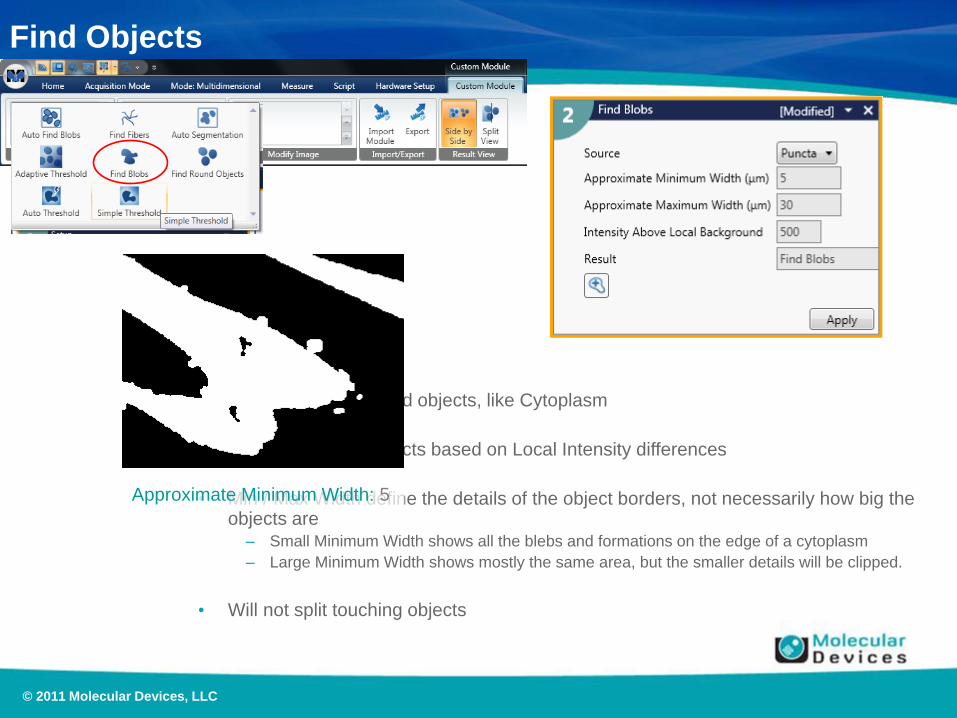
• Find Blobs
• Finds arbitrary shaped objects, like Cytoplasm
• Finds borders of objects based on Local Intensity differences
• Min / Max Width define the details of the object borders, not necessarily how big the objects are
– Small Minimum Width shows all the blebs and formations on the edge of a cytoplasm
– Large Minimum Width shows mostly the same area, but the smaller details will be clipped.
• Will not split touching objects
Approximate Minimum Width: 5

© 2011 Molecular Devices, LLC
Find Objects
• Find Blobs
• Finds arbitrary shaped objects, like Cytoplasm
• Finds borders of objects based on Local Intensity differences
• Min / Max Width define the details of the object borders, not necessarily how big the objects are
– Small Minimum Width shows all the blebs and formations on the edge of a cytoplasm
– Large Minimum Width shows mostly the same area, but the smaller details will be clipped.
• Will not split touching objects
Approximate Minimum Width: 20

© 2011 Molecular Devices, LLC
Find Objects
• Find Objects
• Tools for finding objects in grayscale images and making masks for them.
• Simple to use tools like: – Auto Segmentation: No Configuration Needed
– Auto Threshold: Like auto thresholding in MM – for Bright or Dark objects
– Simple Threshold: Set Min / Max intensity of objects
• Tools like the Application Modules use: – Auto Find Blobs for finding things like nuclei
– Find Blobs for finding things like cytoplasm
• And a few more tools: – Find Fibers for tube or process detection
– Find Round Objects for truly round things (like puncta)

© 2011 Molecular Devices, LLC
Find Objects
• Find Fibers
• Find long tubes or fibers, their branches, and objects too large to be fibers.
• Four masks produced – Fibers: Objects with Widths between the Min Fiber Width and Max Fiber Width
– Non-Fibrouse Objects: Objects with Widths > Max Fiber Width
– Segments: Skeleton of Fibers – good for measuring length of Fibers
– Branch Points: Single points where segments meet each other.
– Segments + Branch Points = total Fiber system
© 2011 Molecular Devices, LLC
Finding Granules In the Nucleus
An Example Custom Module

© 2011 Molecular Devices, LLC
Granules in Nucleus
• Goals:
• Count the number of Granules in a GFP stain that are localized to
the Nucleus
• Measurements to make:
• Nuclear Area and Intensity
• Granule Count
• Total Granule Area and Intensity
• Average Granule Area
• Inputs:
• DRAQ5 Nuclear Stain
• GFP Stain localize to granules (in and out of nucleus)

© 2011 Molecular Devices, LLC
Granules in Nucleus
• Example Images

© 2011 Molecular Devices, LLC
Granules In Nucleus
• Setup:
• Assign real names to be used for the input
images
• These names will be used throughout the
Custom Module when referring to the ‘Input’
images
• These names will be used when running the
Custom Module from the Measurement
Ribbon to assign the ‘Input’ images

© 2011 Molecular Devices, LLC
Granules In Nucleus
• Finding the Nuclei
• Auto Find Blobs using Click to Find
– Turn Automatic Off
• Click on a few Nuclei
• Hit Apply to find all nuclei

© 2011 Molecular Devices, LLC
Granules In Nucleus
• Finding the Nuclei
• Auto Find Blobs using Click to Find
– Turn Automatic Off
• Click on a few Nuclei
• Hit Apply to find all nuclei

© 2011 Molecular Devices, LLC
Granules In Nucleus
• Finding the Nuclei
• Auto Find Blobs using Click to Find
– Turn Automatic Off
• Click on a few Nuclei
• Hit Apply to find all nuclei

© 2011 Molecular Devices, LLC

© 2011 Molecular Devices, LLC
Granules In Nucleus
• Finding Granules
• Separate Granules from background using
Modify Images > Morphology > HDome
• HDome uses a Relative Intensity Threshold
• Don’t forget to provide meaningful names to
the Result Images
• After HDome, use Find Objects > Auto
Segmentation to create a Mask of All Puncta

© 2011 Molecular Devices, LLC

© 2011 Molecular Devices, LLC
Granules In Nucleus
• How Good Did Segmentation Do
• Use Side By Side view to see!
• Slide the Bar left and right to see which spots (on the Left) were turned into objects (on the Right)

© 2011 Molecular Devices, LLC
Granules In Nucleus
• How Good Did Segmentation Do
• Use Side By Side view to see!
• Slide the Bar left and right to see which spots (on the Left) were turned into objects (on the Right)

© 2011 Molecular Devices, LLC
Granules In Nucleus
• Making Measurements: Measure Tab
• Custom Modules are designed to measure
‘Features within Objects’
– For Example ‘Granules within Nuclei’
• The first step is to measure the outer-borders:
the Objects of Interest
– In this case, the Nuclei
• In the Object to Measure section:
– Mask of Objects = Nuclear Mask – Define the widest area to measure in
– Image to Measure = Nuclei – Grayscale image to get Intensities from
– You can measure more than One image using
the icon.
© 2011 Molecular Devices, LLC
Granules In Nucleus
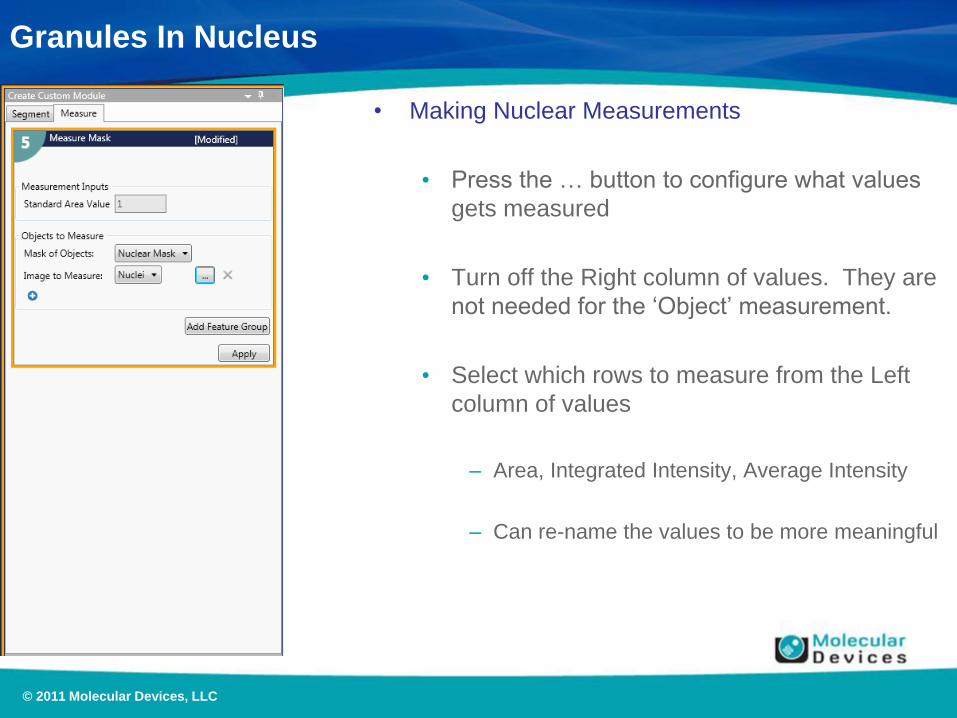
• Making Nuclear Measurements
• Press the … button to configure what values
gets measured
• Turn off the Right column of values. They are
not needed for the ‘Object’ measurement.
• Select which rows to measure from the Left
column of values
– Area, Integrated Intensity, Average Intensity
– Can re-name the values to be more meaningful

© 2011 Molecular Devices, LLC
Granules In Nucleus
• Making Granule Measurements
• The Granules are ‘Features’ found inside the
Nucleus.
• Click on the ‘Add Feature Group button to add
an new section for measuring the Granules.
• Mask of Features = All Granules
• Image to Measure = Puncta
• Press … to select which measurements to
make on Granules

© 2011 Molecular Devices, LLC
Granules In Nucleus
• Making Granule Measurements
• Press … to select which measurements to make on Granules
– The Left Column is the Average of all Features per Object
– The Right Column is the Sum of all Features per Object
– Area on Left Column = Average Granule Area
– Area on Right Column = Total Granule Area
– The last measurement on the Right Column is the Count of Features
– Measure: – Average / Total Granule Area
– Average / Total Granule Intensity
– Total Granule Count
© 2011 Molecular Devices, LLC

© 2011 Molecular Devices, LLC
Granules In Nucleus
• Saving the Custom Module
• At the bottom of the Module, provide a
Measurement Name
• Select from a list of icons to display for the
measurement
• Save the measurement to add it to the list of
Modules
• Then close the Custom Module dataset view
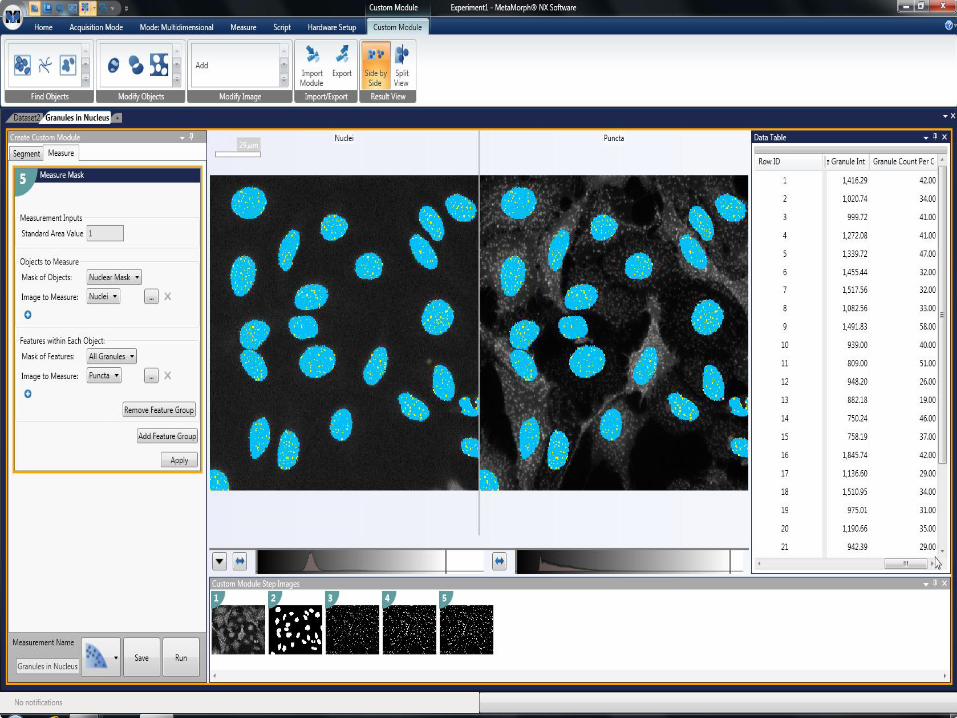
© 2011 Molecular Devices, LLC
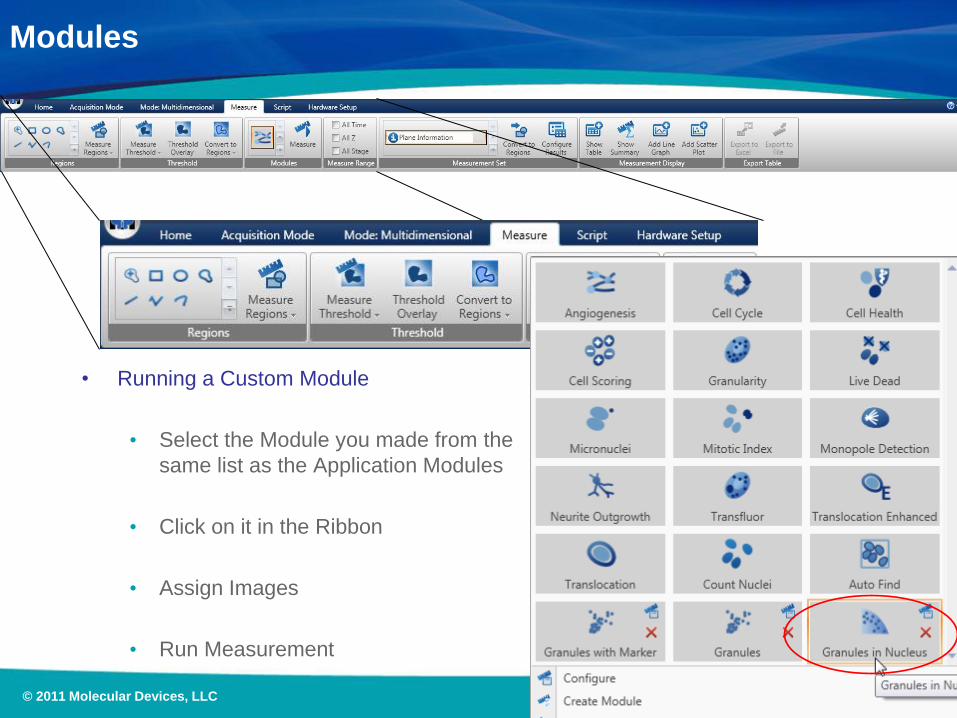
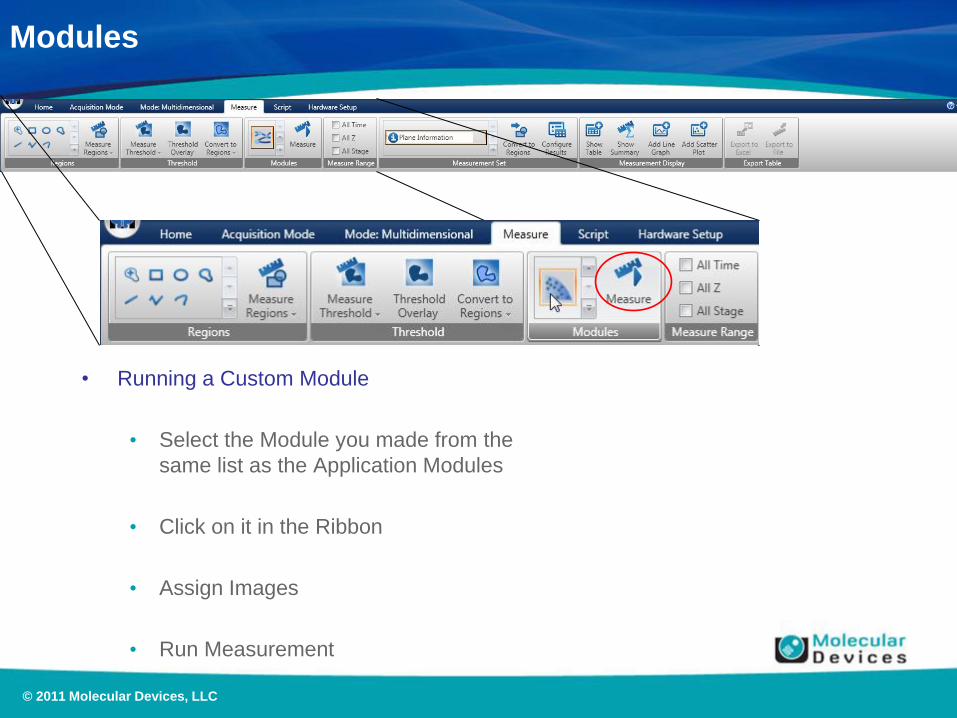
Modules
• Running a Custom Module
• Select the Module you made from the
same list as the Application Modules
• Click on it in the Ribbon
• Assign Images
• Run Measurement

© 2011 Molecular Devices, LLC
Modules
• Running a Custom Module
• Select the Module you made from the
same list as the Application Modules
• Click on it in the Ribbon
• Assign Images
• Run Measurement

© 2011 Molecular Devices, LLC
Modules
• Running a Custom Module
• Select the Module you made from the
same list as the Application Modules
• Click on it in the Ribbon
• Assign Images
• Run Measurement
© 2011 Molecular Devices, LLC
Modules
• Running a Custom Module
• Select the Module you made from the
same list as the Application Modules
• Click on it in the Ribbon
• Assign Images
• Run Measurement

© 2011 Molecular Devices, LLC

© 2011 Molecular Devices, LLC
Process images based on shapes and sizes
Morphology Filters
This part of the presentation will be handled in software