metama: an r package implementing meta-analysis approaches ... · meta-analysis approaches for...
TRANSCRIPT

Introduction Effect size combination p-value combination Application Simulations Conclusion
metaMA: an R package implementingmeta-analysis approaches for microarrays
G. Marot, J.-L. Foulley, C. Mayer and F. Jaffrezic
8 July 2009
G. Marot et al.
metaMA: an R package implementing meta-analysis approaches for microarrays

Introduction Effect size combination p-value combination Application Simulations Conclusion
Introduction
Context :
I Research of differentially expressed genes between twoconditions (e.g. normal/tumor)
I Several studies available with the same biological question buttheir direct comparison is impossible
I Small sample size in individual microarray studies, many genes
Meta-analysis : combining data or results from different studies
I Increase of sensitivity
I Better accuracy
G. Marot et al.
metaMA: an R package implementing meta-analysis approaches for microarrays

Introduction Effect size combination p-value combination Application Simulations Conclusion
metaMA
Two main approaches in metaMA :
I effect size combination, which extends the methodologyimplemented in the Bioconductor package GeneMeta(effect sizes : indices measuring the magnitude of an effect)
I p-value combination
Effect sizes and p-values to be combined are derived fromt-statistics or moderated t-statistics ⇒ several options for eachcombination.
G. Marot et al.
metaMA: an R package implementing meta-analysis approaches for microarrays

Introduction Effect size combination p-value combination Application Simulations Conclusion
Effect Size combinationg : genes : studyi and j : conditions
Let Ysigr ∼ N (µsig , σ2sg ) and Ysjgr ∼ N (µsjg , σ
2sg )
Standard Effect Size (ES) :
δsg = (µsig − µsjg )/σsg
Simple relationship between Student t statistic and standardizedmean difference d :
d = t/√
n
with n = ninj/(ni + nj)
G. Marot et al.
metaMA: an R package implementing meta-analysis approaches for microarrays

Introduction Effect size combination p-value combination Application Simulations Conclusion
Effect size combination
Hierarchical model (Choi et al., 2003)
dsg = θsg + esg , esg ∼ N (0,w2sg )
θsg = µg + vsg , vsg ∼ N (0, τ2g )
with dsg effect size for study s and gene g ,τ2g between-study variance
w2sg within-study variances (assumed to be known, actually
estimated before the procedure)
G. Marot et al.
metaMA: an R package implementing meta-analysis approaches for microarrays

Introduction Effect size combination p-value combination Application Simulations Conclusion
Effect size combination
I Method of moments to estimate τ2g the between-study
variance.
I Z-score to test for differential expression :
zg =µg (τ2
g )√Var(µg (τ2
g ))
I z is assumed to follow a normal distribution
I p-values are corrected for multiple testing by the BenjaminiHochberg procedure
G. Marot et al.
metaMA: an R package implementing meta-analysis approaches for microarrays

Introduction Effect size combination p-value combination Application Simulations Conclusion
Effect size combination
Bioconductor package GeneMeta : gene-by-gene approachmany parameters ⇒ lack of sensitivity
Extension in metaMA : definition of shrinkage effect sizes to takeadvantage of information from other genes⇒ increase of sensitivity not only in individual studies but also inmeta-analysis.
G. Marot et al.
metaMA: an R package implementing meta-analysis approaches for microarrays

Introduction Effect size combination p-value combination Application Simulations Conclusion
Effect Size combination
In addition to gene-by-gene effect sizes, two moderated effect sizecalculations are implemented :
I from limma (Smyth, 2004) moderated t-tests :
dLimma = tLimma/√
n
(direct extension from the relationship between the standardt-test and the standard effect size since the same variance isassumed for both conditions)
I from SMVar (Jaffrezic et al., 2007)Different variances in each condition k .
G. Marot et al.
metaMA: an R package implementing meta-analysis approaches for microarrays

Introduction Effect size combination p-value combination Application Simulations Conclusion
Effect Size combination
I SMVar (Jaffrezic et al., 2007)Different variances in each condition k .
ln(σ2gk) = µk + δgk , δgk ∼ N (0, φ2
k)
tSMVar follows a Welch statistic ⇒ Need of another definitionof effect size.
Details about effect size calculation from moderated t-tests as well as
their bias or estimated variance are given in :
(Marot et al., 2009) Moderated effect size and p-value combinations
for microarray meta-analyses. Submitted to Bioinformatics.
G. Marot et al.
metaMA: an R package implementing meta-analysis approaches for microarrays

Introduction Effect size combination p-value combination Application Simulations Conclusion
p-value combinationInverse normal method (Hedges and Olkin, 1985) to combinep-values :
Sg =Ns∑s=1
wsΦ−1(1− pg (s))
ws =
√n(s)∑Nsi=1 n(i)
(weights according to the number of replicates in each analysis)Under the null hypothesis,
Sg ∼ N (0, 1)
G. Marot et al.
metaMA: an R package implementing meta-analysis approaches for microarrays
Introduction Effect size combination p-value combination Application Simulations Conclusion
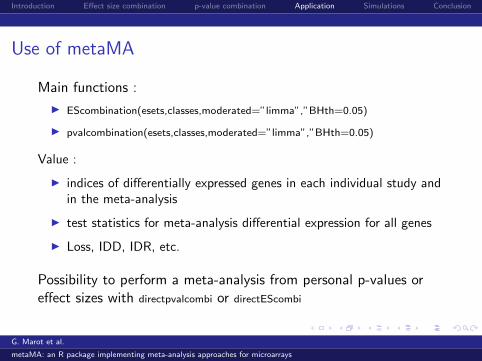
Use of metaMA
Main functions :
I EScombination(esets,classes,moderated=”limma”,”BHth=0.05)
I pvalcombination(esets,classes,moderated=”limma”,”BHth=0.05)
Value :
I indices of differentially expressed genes in each individual study andin the meta-analysis
I test statistics for meta-analysis differential expression for all genes
I Loss, IDD, IDR, etc.
Possibility to perform a meta-analysis from personal p-values oreffect sizes with directpvalcombi or directEScombi
G. Marot et al.
metaMA: an R package implementing meta-analysis approaches for microarrays

Introduction Effect size combination p-value combination Application Simulations Conclusion
Simulations
I Simulations of 3 or 5 experiments with various numbers ofreplicates
I Each gene is normally distributed with parameters calculatedfrom three real datasets (Singh et al., 2002) (La Tulippe etal., 2002) (Stuart et al., 2004)
I Within-study variances from the real datasets : different pergene, per condition and study.
I Between-study variance simulated as the observedbetween-study variance averaged over the two conditions
G. Marot et al.
metaMA: an R package implementing meta-analysis approaches for microarrays

Introduction Effect size combination p-value combination Application Simulations Conclusion
Simulations
Focus on limma based meta-analysis approaches.
Comparison of global limma analyses with p-value and effect sizecombinations
I JointL1 limma analysis gathering all the data ’naively’
I JointL2 limma analysis including a study effect in the linearmodel
G. Marot et al.
metaMA: an R package implementing meta-analysis approaches for microarrays
Introduction Effect size combination p-value combination Application Simulations Conclusion
Results
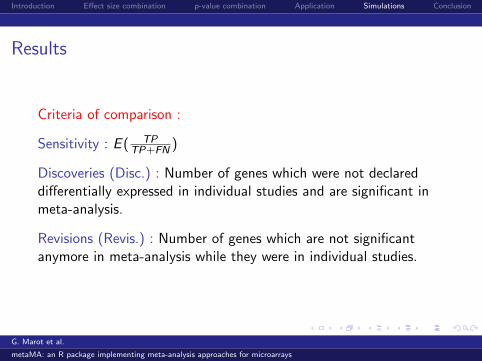
Criteria of comparison :
Sensitivity : E ( TPTP+FN )
Discoveries (Disc.) : Number of genes which were not declareddifferentially expressed in individual studies and are significant inmeta-analysis.
Revisions (Revis.) : Number of genes which are not significantanymore in meta-analysis while they were in individual studies.
G. Marot et al.
metaMA: an R package implementing meta-analysis approaches for microarrays
Introduction Effect size combination p-value combination Application Simulations Conclusion
Results
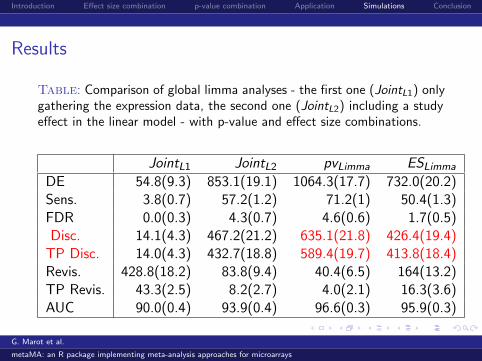
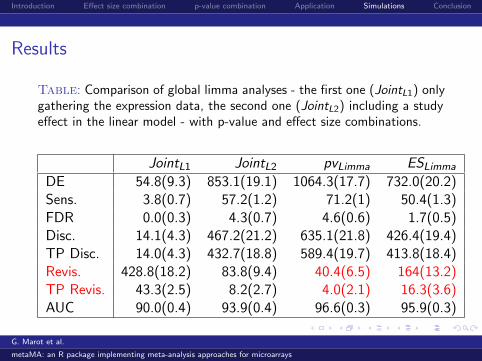
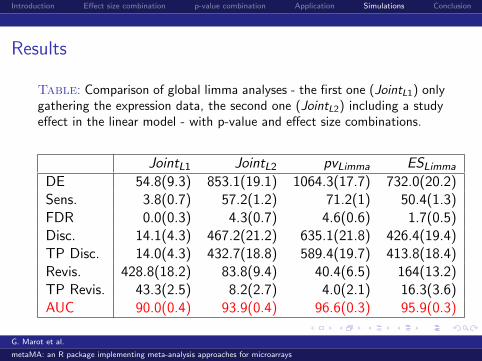
Table: Comparison of global limma analyses - the first one (JointL1) onlygathering the expression data, the second one (JointL2) including a studyeffect in the linear model - with p-value and effect size combinations.
JointL1 JointL2 pvLimma ESLimma
DE 54.8(9.3) 853.1(19.1) 1064.3(17.7) 732.0(20.2)Sens. 3.8(0.7) 57.2(1.2) 71.2(1) 50.4(1.3)FDR 0.0(0.3) 4.3(0.7) 4.6(0.6) 1.7(0.5)Disc. 14.1(4.3) 467.2(21.2) 635.1(21.8) 426.4(19.4)
TP Disc. 14.0(4.3) 432.7(18.8) 589.4(19.7) 413.8(18.4)Revis. 428.8(18.2) 83.8(9.4) 40.4(6.5) 164(13.2)TP Revis. 43.3(2.5) 8.2(2.7) 4.0(2.1) 16.3(3.6)AUC 90.0(0.4) 93.9(0.4) 96.6(0.3) 95.9(0.3)
G. Marot et al.
metaMA: an R package implementing meta-analysis approaches for microarrays
Introduction Effect size combination p-value combination Application Simulations Conclusion
Results
Table: Comparison of global limma analyses - the first one (JointL1) onlygathering the expression data, the second one (JointL2) including a studyeffect in the linear model - with p-value and effect size combinations.
JointL1 JointL2 pvLimma ESLimma
DE 54.8(9.3) 853.1(19.1) 1064.3(17.7) 732.0(20.2)Sens. 3.8(0.7) 57.2(1.2) 71.2(1) 50.4(1.3)FDR 0.0(0.3) 4.3(0.7) 4.6(0.6) 1.7(0.5)Disc. 14.1(4.3) 467.2(21.2) 635.1(21.8) 426.4(19.4)TP Disc. 14.0(4.3) 432.7(18.8) 589.4(19.7) 413.8(18.4)Revis. 428.8(18.2) 83.8(9.4) 40.4(6.5) 164(13.2)TP Revis. 43.3(2.5) 8.2(2.7) 4.0(2.1) 16.3(3.6)AUC 90.0(0.4) 93.9(0.4) 96.6(0.3) 95.9(0.3)
G. Marot et al.
metaMA: an R package implementing meta-analysis approaches for microarrays

Introduction Effect size combination p-value combination Application Simulations Conclusion
ROC curves
0.00 0.10 0.20 0.30
0.0
0.2
0.4
0.6
0.8
1.0
ROC curve
1−specificity
sens
itivi
ty
Joint L1Joint L2pv LimmaES Limma
0.00 0.10 0.20 0.300.
00.
20.
40.
60.
81.
0
ROC curve
1−specificity
sens
itivi
ty
Joint L1Joint L2pv LimmaES Limma
no inter-study variability inter-study variability5 studies with 10 replicates 5 studies with 10 replicates
G. Marot et al.
metaMA: an R package implementing meta-analysis approaches for microarrays

Introduction Effect size combination p-value combination Application Simulations Conclusion
ROC curves
0.00 0.10 0.20 0.30
0.0
0.2
0.4
0.6
0.8
1.0
ROC curve
1−specificity
sens
itivi
ty
Joint L1Joint L2pv LimmaES Limma
0.0 0.1 0.2 0.3
0.0
0.2
0.4
0.6
0.8
1.0
ROC curve
1−specificity
sens
itivi
ty
Joint L1Joint L2pv LimmaES Limma
inter-study variability inter-study variability
3 studies with 6 replicates 10/10 replicates (conditions 1/2) in study 1,
10/8 and 3/9 in studies 2 and 3
G. Marot et al.
metaMA: an R package implementing meta-analysis approaches for microarrays

Introduction Effect size combination p-value combination Application Simulations Conclusion
Conclusion
I Effect size combination can be improved by shrinkageapproaches, especially when the number of replicates inindividual studies is low.
I P-value combination is better in terms of sensitivity and AUCwhile effect size combination is more conservative.
(Marot et al., 2009) Moderated effect size and p-value combinations
for microarray meta-analyses. Submitted to Bioinformatics.
G. Marot et al.
metaMA: an R package implementing meta-analysis approaches for microarrays