metalla royalty & streaming ltd....gold”), in nova scotia, canada from a private party for...
TRANSCRIPT

METALLA ROYALTY & STREAMING LTD.
MANAGEMENT’S DISCUSSION & ANALYSIS
For the nine months ended February 28, 2019
METALLA ROYALTY & STREAMING LTD.
MANAGEMENT’S DISCUSSION AND ANALYSIS
(Expressed in Canadian dollars, unless otherwise indicated)
FOR THE NINE MONTHS ENDED FEBRUARY 28, 2019
Management’s Discussion and Analysis - Page 1
GENERAL
This management’s discussion and analysis (“MD&A”) for Metalla Royalty & Streaming Ltd. (the “Company” or “Metalla”) is
intended to help the reader understand the significant factors that have affected Metalla and its subsidiaries performance and
such factors that may affect its future performance. This MD&A, which has been prepared as of April 25, 2019, should be read
in conjunction with the Company’s condensed interim consolidated financial statements for the nine months ended February
28, 2019 and the related notes contained therewith. The Company reports its financial position, financial performance and
cash flows in accordance with International Financial Reporting Standards (“IFRS”). All dollar amounts included in the following
MD&A are in Canadian dollars (“C$”) except where noted. These documents and other information relevant to the Company’s
activities are available for viewing on SEDAR at www.sedar.com.
INDEX
Company Overview .............................................................................................................................................................................................. 2 Company Highlights ............................................................................................................................................................................................. 2 Overview of Royalties and Streams ................................................................................................................................................................... 3 Outlook ................................................................................................................................................................................................................... 7 Summary of Quarterly Results ............................................................................................................................................................................ 7 Results of Operations ........................................................................................................................................................................................... 8 Liquidity and Capital Resources ......................................................................................................................................................................... 8 Transactions with Related Parties ...................................................................................................................................................................... 9 Off-Balance Sheet Arrangements ...................................................................................................................................................................... 9 Proposed Transactions ........................................................................................................................................................................................ 9 Commitments ...................................................................................................................................................................................................... 10 Events after the Reporting Date ....................................................................................................................................................................... 11 Critical Accounting Estimates and Judgments .............................................................................................................................................. 12 New Accounting Standards .............................................................................................................................................................................. 13 Non-IFRS Financial Measures ........................................................................................................................................................................... 14 Risk Factors ........................................................................................................................................................................................................... 16 Share Position and Outstanding Warrants and Options ............................................................................................................................ 16 Qualified Persons ................................................................................................................................................................................................ 16 Cautionary Statement on Forward-Looking Statements ............................................................................................................................ 16
METALLA ROYALTY & STREAMING LTD.
MANAGEMENT’S DISCUSSION AND ANALYSIS
(Expressed in Canadian dollars, unless otherwise indicated)
FOR THE NINE MONTHS ENDED FEBRUARY 28, 2019
Management’s Discussion and Analysis - Page 2
COMPANY OVERVIEW
Metalla Royalty & Streaming Ltd. ("Metalla" or the "Company") was incorporated in Canada on May 11, 1983. The Company is
a precious metals royalty and streaming company that is focused on acquiring gold and silver metal purchase agreements,
net smelter return royalties (“NSRs”), gross value return royalties (“GVRs”), net profit interests (“NPIs), gross proceeds royalties
(“GPRs”), and non-operating interests in mining projects that provide the right to the holder of a percentage of the gross
revenue from metals produced from the project or a percentage of the gross revenue from metals produced from the project
after deducting specified costs, if any, respectively. For purposes of reporting, the Company calculates attributable silver
equivalent production by applying its interest (i.e. royalty or stream percentage) to the total production reported by the
counterparty and silver equivalency of non-silver products is based on average realized prices of all metals for the period. The
Company’s common shares are listed on the TSX Venture Exchange (“TSX-V”) under the symbol “MTA”. The head office and
principal address is 501 - 543 Granville Street, Vancouver, British Columbia, Canada.
COMPANY HIGHLIGHTS
During the three months ended February 28, 2019, the Company:
• shipped and provisionally invoiced 76,775 (2018 - 158,865) attributable silver ounces (“oz.”) at an average realized price
of US$15.23 (2018 - US$17.12) and average cash cost of US$6.23 (2018 - US$7.32) per oz. (see non-IFRS Financial
Measures);
• generated operating cash margin of US$9.00 (2018 - US$9.45) per attributable silver oz. from the Endeavor silver stream
and New Luika Gold Mine (“NLGM”) stream held by Silverback Ltd. (“Silverback”) (see non-IFRS Financial Measures);
• had 77,272 attributable silver oz. remaining and to be sold in subsequent periods, this was due to delivery delays caused
by the smelter, which led to increased concentrate inventory at the Endeavor Mine;
• recognized revenue from stream interest of $1,442,006 (2018 - $3,066,670), income from operations of $484,179 (2018 -
$286,446), net loss of $446,105 (2018 - $440,105), and adjusted EBITDA of $490,168 (2018 - $671,659) (see non-IFRS
Financial Measures);
• recorded cash flow from operating activities, before net change in non-cash working capital items, of $282,728 (2018 -
$619,402), offset by $5,462,568 spent on acquisitions of NSR royalty interests, resulting in positive working capital of
$730,568 (May 31, 2018 - $4,661,792);
• acquired a 1.5% NSR royalty on the Cap-Oeste Sur East (“COSE”) gold and silver property owned by Pan American Silver
Corp. (“Pan American”), in Santa Cruz, Argentina from Patagonia Gold PLC (“Patagonia Gold”) for US$1,500,000 in cash;
• acquired a 1% NSR royalty on the 15 Mile Stream (“FMS”) gold project owned by Atlantic Gold Corporation (“Atlantic
Gold”), in Nova Scotia, Canada from a private party for US$2,200,000 in cash and 2,619,000 common shares;
• completed a brokered private placement for $6,799,072 by issuing 8,716,758 units at $0.78 per unit;
• entered into arrangement to retire its convertible debenture held by Coeur Mining, Inc (“Coeur”), which was completed
subsequently; and
• declared and paid a monthly dividend of $0.0015 per share.

METALLA ROYALTY & STREAMING LTD.
MANAGEMENT’S DISCUSSION AND ANALYSIS
(Expressed in Canadian dollars, unless otherwise indicated)
FOR THE NINE MONTHS ENDED FEBRUARY 28, 2019
Management’s Discussion and Analysis - Page 3
OVERVIEW OF ROYALTIES AND STREAMS
Property Operator Location Stage Metal Terms
Endeavor Mine CBH Resources Australia Producing Zn, Pb, Ag 100% Ag Stream
NLGM Shanta Gold Tanzania Producing Au, Ag 15% Ag Stream
COSE Pan American Silver Argentina Development Ag, Au 1.5% NSR
Joaquin Pan American Silver Argentina Development Ag, Au 2.0% NSR
Santa Gertrudis
15 Mile Stream
Agnico Eagle Mines
Atlantic Gold Corp
Argentina
Canada
Development
Development
Ag, Au
Ag
2.0% NSR
1.0% NSR
Garrison Osisko Mining Canada Development Au 2.0% NSR
Hoyle Pond Ext. Goldcorp Canada Development on ext. Au 2.0% NSR(4)
Timmins West Ext. Tahoe Resources Canada Development on ext. Au 1.5% NSR(3)
Zaruma Core Gold Ecuador Development Au, Ag 1.5% NSR
Akasaba West Agnico Eagle Mines Canada Development Au, Cu 2.0% NSR(3)(4)
TVZ Zone Goldcorp Canada Development Au 2.0% NSR
DeSantis Mine Canadian Gold Miner Canada Exploration Au 1.5% NSR(3)
Bint Property Glencore Canada Exploration Au 2.0% NSR
Colbert/Anglo Goldcorp Canada Exploration Au 2.0% NSR(3)
Montclerg IEP Canada Exploration Au 1.0% NSR
Pelangio Poirier Pelangio Exp. Canada Exploration Au 1.0% NSR
DNA Detour Gold Canada Exploration Au 2.0% NSR
Beaudoin Explor Resources Canada Exploration Au, Ag 0.4% NSR(3)
Sirola Grenfell Golden Peak Res. Canada Exploration Au 0.25% NSR
Mirado Mine Orefinders Canada Exploration Au 1.0% NSR
Solomon’s Pillar Sage Gold Canada Exploration Au 1.0% NSR
Dufferin East Resource Capital Gold Canada Development Au 1.0% NSR
Puchuldiza Regulus Resources Chile Exploration Au 1.5% NSR
Los Platos Private Party Venezuela Exploration Au 1.5% NSR(3)
(1) Zn: zinc, Pb: lead, Ag: silver, and Au: gold (2) See the Company’s website for the complete list and further details (3) Subject to partial buy-back (4) Exemption on royalty
QUARTERLY UPDATES ON ROYALTIES AND STREAMS
Santa Gertrudis NSR
Agnico Eagle Mines Limited (“Agnico”) reported by press release dated April 25, 2019 that Santa Gertrudis drilling discovered
new high-grade structure at Trinidad and further extends known resource areas – Highlights include 14.7 g/t gold over 11.5
metres at 170 metres depth at Trinidad and 5.1 g/t gold over 4.5 metres at 33 metres depth at Greta.
In the first quarter of 2019, 45 drill holes (10,521 metres) were completed, mainly in the Trinidad, Greta, Viviana, Toro, and
Becerros zones, which form part of the initial full-year budget of 29,000 metres. This drilling focused on extending the mineral
resources and exploring new targets.
Recent assay results from the Trinidad Trend have discovered a down-plunge extension of the main Amelia deposit and also
an interpreted parallel high-grade structure that increases the potential of the zone. The discovery of additional structures is
a result of better understanding the controls of mineralization in the district. The results for the Greta, Viviana, Toro, and
Becerros trends represent mainly deposit extensions.
METALLA ROYALTY & STREAMING LTD.
MANAGEMENT’S DISCUSSION AND ANALYSIS
(Expressed in Canadian dollars, unless otherwise indicated)
FOR THE NINE MONTHS ENDED FEBRUARY 28, 2019
Management’s Discussion and Analysis - Page 4
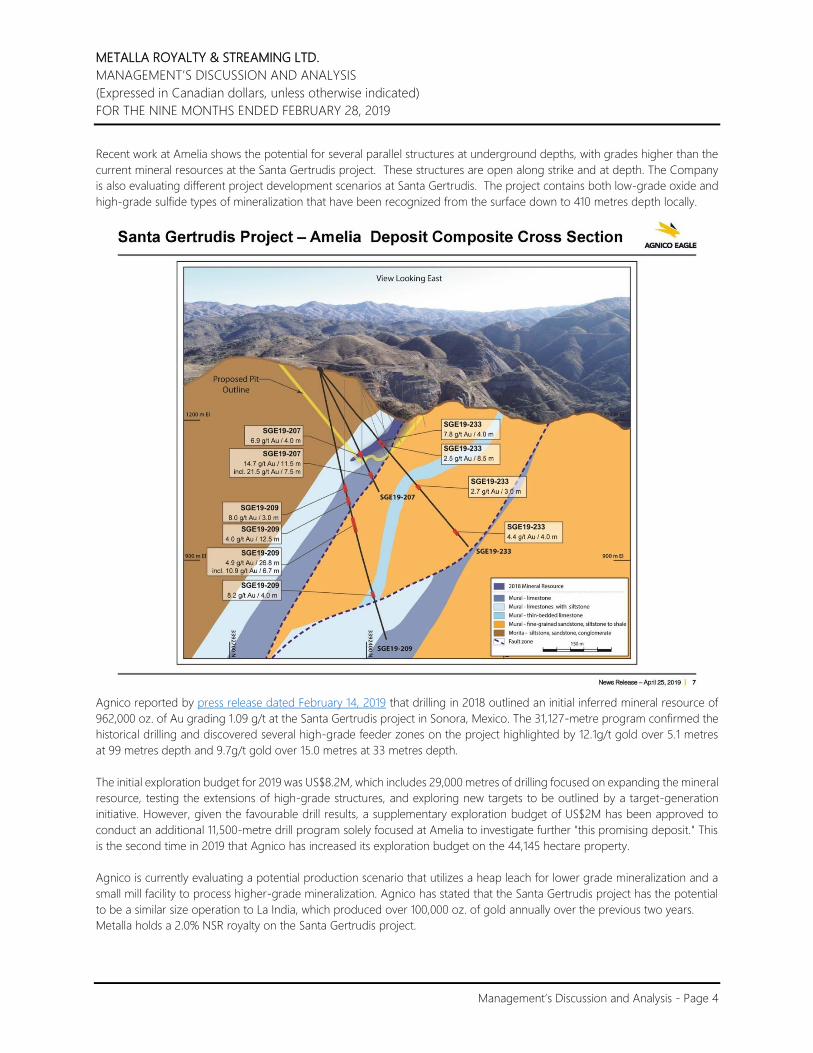
Recent work at Amelia shows the potential for several parallel structures at underground depths, with grades higher than the
current mineral resources at the Santa Gertrudis project. These structures are open along strike and at depth. The Company
is also evaluating different project development scenarios at Santa Gertrudis. The project contains both low-grade oxide and
high-grade sulfide types of mineralization that have been recognized from the surface down to 410 metres depth locally.
Agnico reported by press release dated February 14, 2019 that drilling in 2018 outlined an initial inferred mineral resource of
962,000 oz. of Au grading 1.09 g/t at the Santa Gertrudis project in Sonora, Mexico. The 31,127-metre program confirmed the
historical drilling and discovered several high-grade feeder zones on the project highlighted by 12.1g/t gold over 5.1 metres
at 99 metres depth and 9.7g/t gold over 15.0 metres at 33 metres depth.
The initial exploration budget for 2019 was US$8.2M, which includes 29,000 metres of drilling focused on expanding the mineral
resource, testing the extensions of high-grade structures, and exploring new targets to be outlined by a target-generation
initiative. However, given the favourable drill results, a supplementary exploration budget of US$2M has been approved to
conduct an additional 11,500-metre drill program solely focused at Amelia to investigate further "this promising deposit." This
is the second time in 2019 that Agnico has increased its exploration budget on the 44,145 hectare property.
Agnico is currently evaluating a potential production scenario that utilizes a heap leach for lower grade mineralization and a
small mill facility to process higher-grade mineralization. Agnico has stated that the Santa Gertrudis project has the potential
to be a similar size operation to La India, which produced over 100,000 oz. of gold annually over the previous two years.
Metalla holds a 2.0% NSR royalty on the Santa Gertrudis project.
METALLA ROYALTY & STREAMING LTD.
MANAGEMENT’S DISCUSSION AND ANALYSIS
(Expressed in Canadian dollars, unless otherwise indicated)
FOR THE NINE MONTHS ENDED FEBRUARY 28, 2019
Management’s Discussion and Analysis - Page 5
Endeavor Silver Stream
The Endeavor Mine located in New South Wales, Australia was once the region’s largest zinc, lead, and silver producer.
Commissioned in 1983 as the Elura Mine, the site has been operated by CBH since 2003 and was then renamed as the Endeavor
Mine. The orebody at the Endeavor Mine has the form of massive vertical pillars, which is similar to others found in the Cobar
Basin. Extraction of approximately 30 million tonnes has occurred to date.
Metalla has the right to buy 100% of the silver production up to 20.0 million ounces (7.1 million ounces have been delivered
to date) from the Endeavor Mine for an operating cost contribution of US$1.00 per ounce of payable silver, indexed annually
for inflation, and a further increment of 50% of the amount by which silver price exceeds US$7.00 per ounce.
CBH has allocated more resources and capital from development of new stopes on the existing mineralized zone to developing
the recently discovered Deep Zinc Lode at depth. CBH has advised the plan is to carry out further drilling to firm up the Deep
Zinc Load resource with initial results expected in July to September 2019. They will be considering the economic viability of
continuing to develop those deeper areas to eventually sequence into an expanded mine plan.
CBH has advised that they expect a revised mine plan for the existing orebody in the second half of calendar 2019. Currently
the existing mine plan allows for production through December 2020.
15 Mile Stream NSR
Atlantic Gold reported by press release dated March 13, 2109 updated mineral resource estimates following recent drilling
campaigns at its Touquoy, 15 Mile Stream, and Cochrane Hill deposits. Following the drilling of 35,710 metres since the last
resource estimate at the FMS deposit (see technical report titled “Moose River Consolidated Project, Nova Scotia, Canada, NI
43-101 Technical Report on Moose River Consolidated Phase 1 and 2 Expansion” with an effective date of January 24, 2018),
Atlantic Gold reported an increase of 47% or 216,000 oz. for a total of 677,000 oz. of contained gold (“Au”) between the three
deposits of Egerton-MacLean, Hudson, and Plenty. This resource update is expected to add an additional 2,160 oz. of gold to
Metalla’s account over the life of the mine.
Measured
& Indicated
Au
Grade
Contained
Au Inferred
Au
Grade
Contained
Au
Pit Constrained (Kt) (g/t) (Koz) (Kt) (g/t) (Koz)
Eggerton-MacLean 14,600 1.16 544 1,400 1.24 56
Hudson 1,800 0.78 45 400 1.01 13
Plenty 2,700 1.01 88 300 1.56 15
Total 19,100 1.10 677 2,100 1.24 84
Atlantic Gold intends to continue to explore FMS in 2019 and test the connections between the Egerton-MacLean Zone and
the newly-discovered 149 Deposit located two (2) kilometres to the north-east, which was omitted from the recent estimate.
Follow-up diamond drilling is underway to test the easterly extension of the 149 Gold Deposit. This was the first discovery of
the Corridor Regional Program, an initial program of 6,000 metres is planned.
Metalla holds a 1.0% NSR royalty that covers the entirety of the Egerton-MacLean, Hudson, the newly-discovered 149 Deposits,
and a majority of the Plenty deposit.
Joaquin and Cap-Oeste Sur Este NSRs
Pan American advanced the development of the COSE and Joaquin projects in Argentina. Production at both mines is expected
to start in the second half of 2019. At Joaquin, the initial fleet of development mining equipment was procured and the
development of the underground access decline continued. At COSE, development of the underground access decline also
continued, along with commencement of construction on the first underground electrical substation.
METALLA ROYALTY & STREAMING LTD.
MANAGEMENT’S DISCUSSION AND ANALYSIS
(Expressed in Canadian dollars, unless otherwise indicated)
FOR THE NINE MONTHS ENDED FEBRUARY 28, 2019
Management’s Discussion and Analysis - Page 6
Pan American has outlined capital expenditures at Joaquin and COSE in 2019 to complete development totaling US$20M.
Both projects remain on budget.
Metalla holds a 2.0% NSR royalty on Joaquin project and 1.5% NSR royalty on COSE project.
Garrison NSR
Osisko Mining Inc. (“Osisko”) reported by press release dated February 19, 2019 an updated mineral resources estimate for the
Garrison gold project and an additional press release dated February 20, 2019 its intent to spin out the Garrison gold project
into a new company. Under the terms of the binding letter agreement, Osisko will effect a business combination that will result
in a reverse takeover of Chantrell Ventures Corp. and change its name to “O3 Mining Corporation” (“O3 Mining”) subsequently.
The proposed transaction is anticipated to be completed by way of plan of arrangement which will include the transfer of
Osisko’s Garrison deposit, Marban deposit, exploration properties and a portfolio of select securities. O3 Mining will focus on
continuing its consolidation strategy and progressing its development assets.
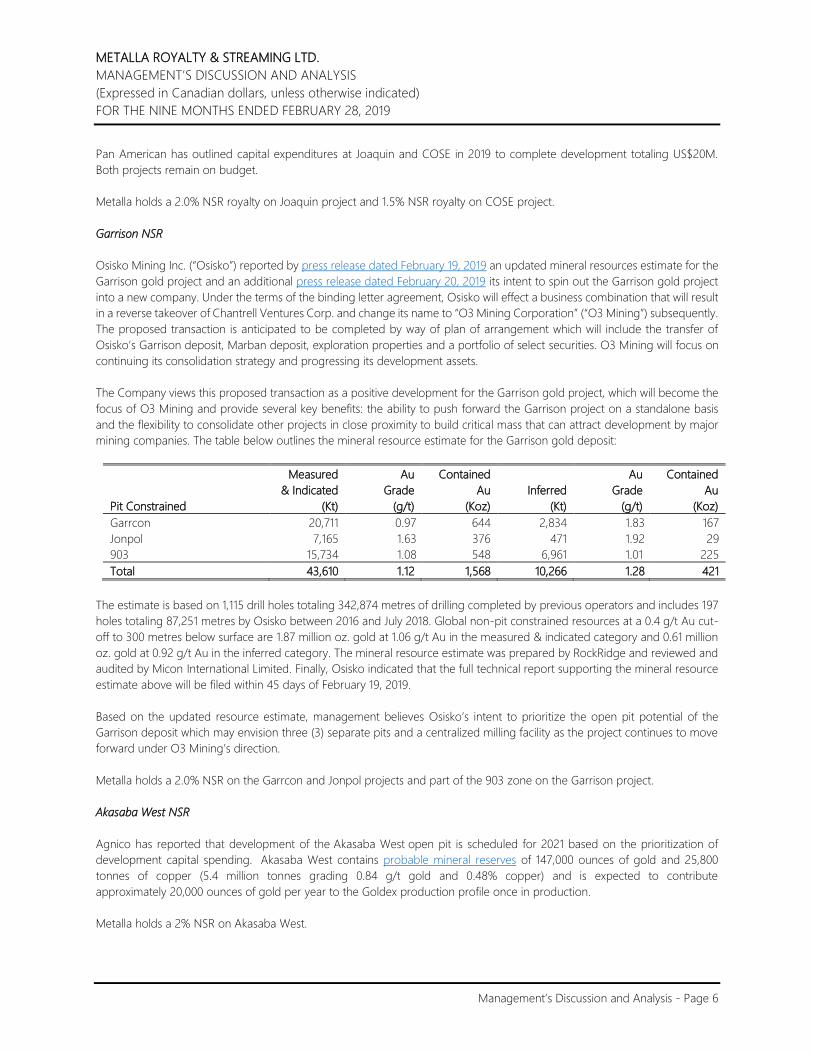
The Company views this proposed transaction as a positive development for the Garrison gold project, which will become the
focus of O3 Mining and provide several key benefits: the ability to push forward the Garrison project on a standalone basis
and the flexibility to consolidate other projects in close proximity to build critical mass that can attract development by major
mining companies. The table below outlines the mineral resource estimate for the Garrison gold deposit:
Measured
& Indicated
Au
Grade
Contained
Au Inferred
Au
Grade
Contained
Au
Pit Constrained (Kt) (g/t) (Koz) (Kt) (g/t) (Koz)
Garrcon 20,711 0.97 644 2,834 1.83 167
Jonpol 7,165 1.63 376 471 1.92 29
903 15,734 1.08 548 6,961 1.01 225
Total 43,610 1.12 1,568 10,266 1.28 421
The estimate is based on 1,115 drill holes totaling 342,874 metres of drilling completed by previous operators and includes 197
holes totaling 87,251 metres by Osisko between 2016 and July 2018. Global non-pit constrained resources at a 0.4 g/t Au cut-
off to 300 metres below surface are 1.87 million oz. gold at 1.06 g/t Au in the measured & indicated category and 0.61 million
oz. gold at 0.92 g/t Au in the inferred category. The mineral resource estimate was prepared by RockRidge and reviewed and
audited by Micon International Limited. Finally, Osisko indicated that the full technical report supporting the mineral resource
estimate above will be filed within 45 days of February 19, 2019.
Based on the updated resource estimate, management believes Osisko’s intent to prioritize the open pit potential of the
Garrison deposit which may envision three (3) separate pits and a centralized milling facility as the project continues to move
forward under O3 Mining’s direction.
Metalla holds a 2.0% NSR on the Garrcon and Jonpol projects and part of the 903 zone on the Garrison project.
Akasaba West NSR
Agnico has reported that development of the Akasaba West open pit is scheduled for 2021 based on the prioritization of
development capital spending. Akasaba West contains probable mineral reserves of 147,000 ounces of gold and 25,800
tonnes of copper (5.4 million tonnes grading 0.84 g/t gold and 0.48% copper) and is expected to contribute
approximately 20,000 ounces of gold per year to the Goldex production profile once in production.
Metalla holds a 2% NSR on Akasaba West.

METALLA ROYALTY & STREAMING LTD.
MANAGEMENT’S DISCUSSION AND ANALYSIS
(Expressed in Canadian dollars, unless otherwise indicated)
FOR THE NINE MONTHS ENDED FEBRUARY 28, 2019
Management’s Discussion and Analysis - Page 7
Production and provisional sales from royalties and streams
Q3 Q3 YTD YTD
2019 2018 2019(4) 2018(1)
Attributable silver oz. from prior period 57,814 16,909 90,476 13,654
Production during the period
Endeavor Silver Stream 91,844 110,310 353,643 299,488
NLGM(2) 4,389 4,797 13,169 13,794
Total attributable silver oz. produced 154,047 132,016 457,288 326,936
Total attributable silver oz. sold(1) (76,775) (96,543) (380,017) (291,463)
Remaining attributable silver oz.(3) 77,272 35,473 77,272 35,473 (1) Includes attributable silver oz. from the Endeavor silver stream that were produced, shipped and provisionally invoiced
during June and July 2017, where the Company is entitled to the associated trade receivable amounts (see non-IFRS Financial
Measures).
(2) Adjusted for the Company’s proportionate share of NLGM held by Silverback. (3) Represents attributable silver oz. that were produced and to be realized by the operator(s) in subsequent periods after the
reporting date. (4) Delivery delays caused by the smelter has increased the concentrate inventory at the Endeavor Mine.
OUTLOOK
As of the date hereof, the Company is providing the following forecasts for fiscal year ending May 31, 2019:
• total attributable silver production is expected to be from 400,000 to 500,000 oz.;
• revenue is expected to be $7,000,000 to $9,000,000(1); and
• approximately 95%+ of total revenue is expected to be derived from silver.
(1) Estimate based on expected average silver price of US$15.00 per oz. and foreign exchange rate of US$0.80/C$1.00.
SUMMARY OF QUARTERLY RESULTS
The following table provides selected financial information for the eight quarters up to February 28, 2019 and should be read
in conjunction with the Company’s consolidated financial statements for the year ended May 31, 2018.
Q3-2019 Q2-2019 Q1-2019 Q4-2018
Revenue from stream interest $ 1,442,006 $ 1,623,140 $ 3,900,301 $ 1,868,092
Share-based payments (362,547) (214,056) (279,457) (179,517)
Net income (loss) for the period (446,105) (496,948) (312,031) (797,120)
Dividends declared and paid 492,648 401,314 354,174 225,519
Earnings (loss) per share - basic and diluted (0.00) (0.01) (0.00) (0.01)
Weighted average shares outstanding - basic 111,928,822 92,698,885 79,311,399 75,236,522

METALLA ROYALTY & STREAMING LTD.
MANAGEMENT’S DISCUSSION AND ANALYSIS
(Expressed in Canadian dollars, unless otherwise indicated)
FOR THE NINE MONTHS ENDED FEBRUARY 28, 2019
Management’s Discussion and Analysis - Page 8
Q3-2018 Q2-2018 Q1-2018 Q4-2017
Revenue from stream interest $ 1,761,491 $ 3,066,670 $ 672,078 $ Nil
Share-based payments (28,800) Nil (624,429) (258,986)
Net income (loss) for the period (310,845) (440,105) (1,013,686) (1,857,376)
Dividends declared and paid 148,759 - - -
Earnings (loss) per share - basic and diluted (0.00) (0.01) (0.02) (0.04)
Weighted average shares outstanding - basic 74,407,325 73,168,849 62,499,990 52,186,699
RESULTS OF OPERATIONS
Three months ended February 28, 2019
The Company’s net loss totaled $446,105 (2018 - $310,845) for the three months ended February 28, 2019. Overall, net loss for
the current quarter was higher than for 2018 primarily due to income tax provisions and share-based payments, partially offset
by increased gross profit.
Nine months ended February 28, 2019
The Company’s net loss totaled $1,255,084 (2018 - $1,764,636) for the nine months ended February 28, 2019. Overall, net loss
for the current period was lower than for 2018 primarily due to a significant increase in gross profit from the Endeavor Silver
Stream interest, partially offset by increased general and administrative expenses.
LIQUIDITY AND CAPITAL RESOURCES
The Company considers items included in shareholders’ equity as capital. The Company’s objective when managing capital is
to safeguard the Company’s ability to continue as a going concern, so that it can continue to provide returns for shareholders
and benefits for other stakeholders.
The Company’s cash as at February 28, 2019 totaled $3,769,730 (May 31, 2018 - $4,817,357) and its working capital was
$730,568 (May 31, 2018 - $4,661,792). The Company manages the capital structure and makes adjustments in light of changes
in economic conditions and the risk characteristics of the underlying assets.
The Company believes it has sufficient working capital to undertake its current business plan. However, should the Company
undertake anything over and above these plans, management will need additional sources of working capital. In order to
maintain or adjust the capital structure, the Company may issue new shares through public and/or private placements, sell
assets, or return capital to shareholders.
Subsequent to February 28, 2019, the Company retired the remaining balance of its convertible debenture with Coeur and
acquired a new $12,000,000 convertible loan facility with Beedie Capital to fund acquisitions of new royalties and streams.
During the nine months ended February 28, 2019, cash decreased by $1,047,627. The decrease was due to net cash used in
investing activities of $12,761,413, partially offset by net cash provided by operating and financing activities of $2,334,850 and
$9,357,955, respectively. Exchange rate changes had a positive impact on cash of $20,981.
Operating activities
During the nine months ended February 28, 2019, net cash provided by operating activities amounted to $2,334,850, which
included decrease in trade receivables and other of $64,107 and increase in trade and other payable of $220,599 during the
normal course of business.

METALLA ROYALTY & STREAMING LTD.
MANAGEMENT’S DISCUSSION AND ANALYSIS
(Expressed in Canadian dollars, unless otherwise indicated)
FOR THE NINE MONTHS ENDED FEBRUARY 28, 2019
Management’s Discussion and Analysis - Page 9
Investing activities
Cash used in the Company’s investing activities during the nine months ended February 28, 2019 totaled $12,761,413, which
were primarily comprised of $13,455,219 paid for the acquisition of NSR royalties, partially offset by cash held by ValGold on
the acquisition date and recoveries received.
Financing activities
Cash provided by the Company’s financing activities during the nine months ended February 28, 2019 totaled $9,357,955,
which were primarily comprised of $6,376,043 from private placements, $3,620,103 from the exercise of share purchase
warrants and stock options, and $2,554,721 from loan arrangements, partially offset by $1,566,939 of principal loan repayments,
$1,248,136 of dividend paid and $377,837 of interest paid.
Requirement of additional financing
Management believes that the Company’s current operational requirements and capital projects can be funded from existing
cash and cash generated from operations. If future circumstances dictate an increased cash requirement and we elect not to
delay, limit, or eliminate some of our plans, we may raise additional funds through debt financing, the issuance of hybrid debt-
equity securities, or additional equity securities. The Company has relied entirely on equity financings and loans for all funds
raised to date for its acquisitions, capital expansions, and operations. Capital markets may not be receptive to offerings of new
equity from treasury or debt, whether by way of private placements or public offerings. The Company’s growth and success
may be dependent on external sources of financing which may not be available on acceptable terms.
TRANSACTIONS WITH RELATED PARTIES
The aggregate value of transactions and outstanding balances relating to key management personnel were as follows:
Salary Share-based
For the nine months ended February 28, 2019 or fees Payments Total
Management $ 421,536 $ 320,519 $ 742,055
Directors 120,183 404,694 524,877
$ 541,719 $ 725,213 $ 1,266,932
As at February 28, 2019, the Company had $Nil (May 31, 2018 - $70,833) due to directors and management related to
remuneration and expense reimbursements, which have been included in accounts payable and accrued liabilities.
OFF-BALANCE SHEET ARRANGEMENTS
As of the date of this MD&A, the Company does not have any off-balance sheet arrangements that have, or are reasonably
likely to have, a current or future effect on the results of operations or financial condition of the Company, including, and
without limitation, such considerations as liquidity and capital resources.
PROPOSED TRANSACTIONS
While the Company continues to pursue further transactions, there are no binding transactions of a material nature that have
not already been disclosed publicly.

METALLA ROYALTY & STREAMING LTD.
MANAGEMENT’S DISCUSSION AND ANALYSIS
(Expressed in Canadian dollars, unless otherwise indicated)
FOR THE NINE MONTHS ENDED FEBRUARY 28, 2019
Management’s Discussion and Analysis - Page 10
COMMITMENTS
The Company had certain payments in cash and common shares related to its royalty interests, see Note 13 of the condensed
interim consolidated financial statements for the nine months ended February 28, 2019.
FINANCIAL INSTRUMENTS
Fair value
Financial instruments recorded at fair value on the statement of financial position are classified using a fair value hierarchy that
reflects the significance of the inputs used in making the measurements. The fair value hierarchy has the following levels:
• Level 1 - Unadjusted quoted prices in active markets for identical assets or liabilities;
• Level 2 - Inputs other than quoted prices that are observable for assets or liabilities, either directly or indirectly; and
• Level 3 - Inputs for assets and liabilities that are not based on observable market data.
The fair value hierarchy requires the use of observable market inputs whenever such inputs exist. A financial instrument is
classified to the lowest level of the hierarchy for which a significant input has been considered in measuring fair value. As at
February 28, 2019, the Company’s financial instruments measured at fair value are as follows:
Level 1 Level 2 Level 3 Total
Financial assets
Receivables from provisional sales $ - $ 128,769 $ - $ 128,769
The carrying value of cash, receivables, and accounts payable and accrued liabilities approximated their fair value because of
the short-term nature of these instruments. Receivable from provisional sales includes provisional pricing, and final price and
assay adjustments and is valued using observable market commodity forward prices and thereby classified within Level 2 of
the fair value hierarchy. The fair value of the Company’s loans payable is approximated by its carrying value as its interest rates
are comparable to market interest rates.
The Company’s activities expose it to financial risks of varying degrees of significance which could affect its ability to achieve
its strategic objectives for growth and shareholder returns. The principal financial risks to which the Company is exposed are
credit risk and liquidity risk. The Board of Directors has overall responsibility for the establishment and oversight of the
Company’s risk management framework and reviews the Company’s policies on an ongoing basis.
Credit risk
Credit risk arises from cash deposits, as well as credit exposures to counterparties of outstanding receivables and committed
transactions. There is no significant concentration of credit risk other than cash deposits. The Company’s cash deposits are
primarily held with a Canadian chartered bank. Receivables include value added tax due from the Canadian government. The
carrying amount of financial assets recorded in the financial statements represents the Company’s maximum exposure to
credit risk. The Company believes it is not exposed to significant credit risk and overall, the Company’s credit risk has not
declined significantly from the prior year.
METALLA ROYALTY & STREAMING LTD.
MANAGEMENT’S DISCUSSION AND ANALYSIS
(Expressed in Canadian dollars, unless otherwise indicated)
FOR THE NINE MONTHS ENDED FEBRUARY 28, 2019
Management’s Discussion and Analysis - Page 11
Liquidity risk
Liquidity risk is the risk that the Company will not be able to meet its financial obligations as they fall due. The Company
manages liquidity risk by continuing to monitor forecasted and actual cash flows. The Company has in place a planning and
budgeting process to help determine the funds required to support the Company’s normal operating requirements on an
ongoing basis and its development plans. The Company strives to maintain sufficient liquidity to meet its short-term business
requirements, taking into account its anticipated cash flows from royalty interests, its holdings of cash, and its committed
liabilities. The maturities of the Company’s non‐current liability are disclosed in Note 7 in the condensed interim consolidated
financial statements. All current liabilities are settled within one year.
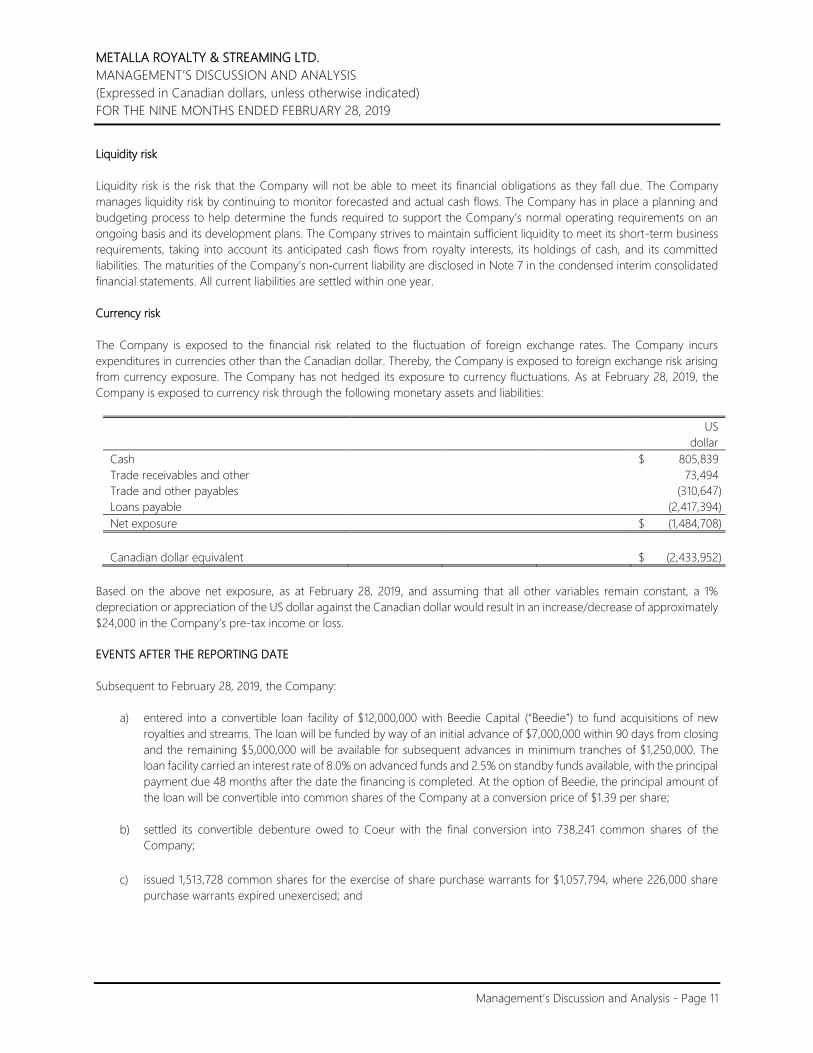
Currency risk
The Company is exposed to the financial risk related to the fluctuation of foreign exchange rates. The Company incurs
expenditures in currencies other than the Canadian dollar. Thereby, the Company is exposed to foreign exchange risk arising
from currency exposure. The Company has not hedged its exposure to currency fluctuations. As at February 28, 2019, the
Company is exposed to currency risk through the following monetary assets and liabilities:
US
dollar
Cash $ 805,839
Trade receivables and other 73,494
Trade and other payables (310,647)
Loans payable (2,417,394)
Net exposure $ (1,484,708)
Canadian dollar equivalent $ (2,433,952)
Based on the above net exposure, as at February 28, 2019, and assuming that all other variables remain constant, a 1%
depreciation or appreciation of the US dollar against the Canadian dollar would result in an increase/decrease of approximately
$24,000 in the Company’s pre-tax income or loss.
EVENTS AFTER THE REPORTING DATE
Subsequent to February 28, 2019, the Company:
a) entered into a convertible loan facility of $12,000,000 with Beedie Capital (“Beedie”) to fund acquisitions of new
royalties and streams. The loan will be funded by way of an initial advance of $7,000,000 within 90 days from closing
and the remaining $5,000,000 will be available for subsequent advances in minimum tranches of $1,250,000. The
loan facility carried an interest rate of 8.0% on advanced funds and 2.5% on standby funds available, with the principal
payment due 48 months after the date the financing is completed. At the option of Beedie, the principal amount of
the loan will be convertible into common shares of the Company at a conversion price of $1.39 per share;
b) settled its convertible debenture owed to Coeur with the final conversion into 738,241 common shares of the
Company;
c) issued 1,513,728 common shares for the exercise of share purchase warrants for $1,057,794, where 226,000 share
purchase warrants expired unexercised; and

METALLA ROYALTY & STREAMING LTD.
MANAGEMENT’S DISCUSSION AND ANALYSIS
(Expressed in Canadian dollars, unless otherwise indicated)
FOR THE NINE MONTHS ENDED FEBRUARY 28, 2019
Management’s Discussion and Analysis - Page 12
d) entered into a purchase and sale agreement to acquire the following royalties from Alamos Gold Inc. and its affiliates
for total consideration of US$8,600,000 payable in common shares of the Company:
Property Operator Locatiion Stage Terms
El Realito Agnico Eagle Sonora, Mexico Development 2.0% NSR(1)
La Fortuna Minera Alamos Durango, Mexico Development 1.0% NSR(4)
Wasamac Monarch Gold Rouyn-Noranda, Quebec Development 1.5% NSR(2)
Beaufor Mine Monarch Gold Val d’Or, Quebec Production/Dev 1.0% NSR(3)
San Luis
Big Island
SSR Mining
Copper Reef Mining
Peru
Flin Flon, Manitoba
Development
Exploration
1.0% NSR
2.0% NSR
Biricu Guerrero Ventures Guerrero, Mexico Exploration 2.0% NSR
Boulevard Independence Gold Yukon, Ontario Exploration 2.0% NSR
Camflo NW Monarch Gold Val d’Or, Quebec Exploration 1.0% NSR
Edwards Mine Waterton Wawa, Ontario Exploration 1.0% NSR
Goodfish K. War Eagle Mining Kirkland Lake, Ontario Exploration 1.25% NSR
Kirkland-Hudson Kirkland Lake Gold Kirkland Lake, Ontario Exploration 1.0% NSR
Pucarana Buenaventura Peru Exploration 2.0% NSR
Capricho Pucara Resources Peru Exploration 1.8% NSR(4)
Lourdes Pucara Resources Peru Exploration 1.0% NSR
Santo Tomas Pucara Resources Peru Exploration 1.0% NSR
Los Platos Pucara Resources Peru Exploration 1.0% NSR (1) Subject to a 60-day right of first refusal period, 1.0% can be repurchased for US$4,000,000 (2) 0.5% can be repurchased for $7,500,000 (3) Production expected to halt in calendar Q2 2019 (4) Option to purchase at agreed to price
CRITICAL ACCOUNTING ESTIMATES AND JUDGMENTS
The preparation of consolidated financial statements in conformance with IFRS requires management to make estimates,
judgments and assumptions that affect the application of accounting policies and the reported amounts of assets, liabilities,
income and expenses. Actual results may differ from these estimates. Estimates and underlying assumptions are reviewed on
an ongoing basis. Revisions to accounting estimates are recognized in the period in which the estimates are revised and in
any future periods affected.
For full details on the critical accounting estimates and judgments affecting the Company, please refer to the Company’s
audited annual consolidated financial statements and notes and annual MD&A for the year ended May 31, 2018.
METALLA ROYALTY & STREAMING LTD.
MANAGEMENT’S DISCUSSION AND ANALYSIS
(Expressed in Canadian dollars, unless otherwise indicated)
FOR THE NINE MONTHS ENDED FEBRUARY 28, 2019
Management’s Discussion and Analysis - Page 13
NEW ACCOUNTING STANDARDS
Accounting standards adopted during the period
Revenue recognition
Effective June 1, 2018, the Company has adopted IFRS 15 Revenue from Contracts with Customers (“IFRS 15”). The Company
elected to apply IFRS 15 using a modified retroactive approach by recognizing the cumulative effect of initially adopting this
standard at the date of initial recognition. Comparative information has not been restated and continues to be reported under
IAS 18 Revenue (“IAS 18”). The Company has concluded that there was no cumulative effect adjustment required to be
recognized at June 1, 2018. The details of the accounting policy changes are described below.
Revenue is comprised of revenue earned in the period from royalty and mineral stream interests. In accordance with IFRS 15,
the Company recognizes revenue to depict the transfer of the relevant commodity to customers in an amount that reflects
the consideration to which the Company expects to be entitled in exchange for those commodities. For the Company’s royalty
and stream interests, revenue recognition occurs when the relevant commodity is transferred to the end customer by the
operator of the related property. Revenue is measured at the fair value of the consideration received or receivable when
management can reliably estimate the amount, pursuant to the terms of the royalty or stream agreement.
In some instances, the Company will not have access to sufficient information to make a reasonable estimate of consideration
to which it expects to be entitled and, accordingly, revenue recognition is deferred until management can make a reasonable
estimate. Differences between estimates and actual amounts are adjusted and recorded in the period that the actual amounts
are known. Under the terms of certain royalty and stream agreements, revenue may be subject to adjustment upon final
settlement of estimated metal prices, weights, and assays. Provisionally-priced revenues are initially recognized based on
forward prices. Adjustments to revenue from metal prices are recorded at each reporting period and other adjustments are
recorded on final settlement and are offset against revenue when incurred.
Financial instruments
Effective June 1, 2018, the Company has adopted IFRS 9 Financial Instruments (“IFRS 9”). Prior periods were not restated, and
no material changes resulted from adopting this new standard. IFRS 9 introduced a revised model for classification and
measurement, and while this has resulted in several financial instrument classification changes, as presented in Note 12, there
were no quantitative impacts from adoption. The details of the accounting policy changes are described below.
IFRS 9 largely retains the existing requirements in IAS 39 Financial Instruments: Recognition and Measurement (“IAS 39”) for
the classification and measurement of financial liabilities. However, it eliminates the previous IAS 39 categories for financial
assets of held to maturity, loans and receivables, and available for sale.
Under IFRS 9, on initial recognition, financial assets are recognized at fair value and are subsequently classified and measured
at amortized cost, fair value through other comprehensive income (“FVOCI”), or fair value through profit or loss (“FVTPL”). The
classification of financial assets is generally based on the business model in which a financial asset is managed and its
contractual cash flow characteristics. A financial asset is measured at fair value net of transaction costs that are directly
attributable to its acquisition except for financial assets at FVTPL where transaction costs are expensed. All financial assets not
classified and measured at amortized cost or FVOCI are measured at FVTPL.
Derivatives embedded in contracts where the host is a financial asset in the scope of the standard are never separated, and
instead the hybrid financial instrument as a whole is assessed for classification. On initial recognition of an equity instrument
that is not held for trading, the Company may irrevocably elect to present subsequent changes in the investment’s fair value
in other comprehensive income (“OCI”). This election is made on an investment-by-investment basis.
METALLA ROYALTY & STREAMING LTD.
MANAGEMENT’S DISCUSSION AND ANALYSIS
(Expressed in Canadian dollars, unless otherwise indicated)
FOR THE NINE MONTHS ENDED FEBRUARY 28, 2019
Management’s Discussion and Analysis - Page 14
The classification determines the method by which the financial assets are carried on the consolidated statement of financial
position subsequent to initial recognition and how changes in value are recorded. The following accounting policies apply to
the subsequent measurement of financial assets.
• Financial assets at FVTPL - These assets are subsequently measured at fair value. Net gains and losses, including any
interest or dividend income, are recognized in profit or loss.
• Financial assets at amortized cost - These assets are subsequently measured at amortized cost using the effective
interest method. The amortized cost is reduced by impairment losses. Interest income, foreign exchange gains and
losses and impairment are recognized in profit or loss. Any gain or loss on derecognition is recognized in profit or
loss.
• Equity investments at FVOCI - These assets are subsequently measured at fair value. Dividends are recognized as
income in profit or loss unless the dividend clearly represents a recovery of part of the cost of the investment. Gains
or losses recognized on the sale of the equity investment are recognized in OCI and are never reclassified to profit
or loss.
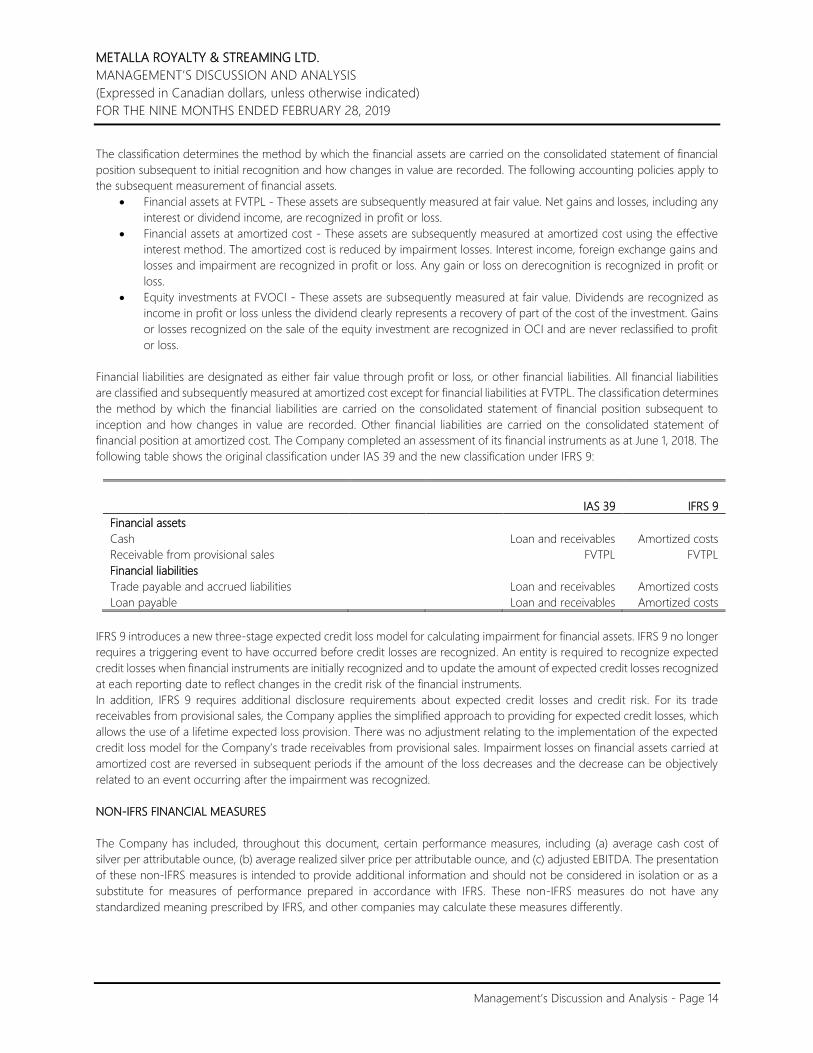
Financial liabilities are designated as either fair value through profit or loss, or other financial liabilities. All financial liabilities
are classified and subsequently measured at amortized cost except for financial liabilities at FVTPL. The classification determines
the method by which the financial liabilities are carried on the consolidated statement of financial position subsequent to
inception and how changes in value are recorded. Other financial liabilities are carried on the consolidated statement of
financial position at amortized cost. The Company completed an assessment of its financial instruments as at June 1, 2018. The
following table shows the original classification under IAS 39 and the new classification under IFRS 9:
IAS 39 IFRS 9
Financial assets
Cash Loan and receivables Amortized costs
Receivable from provisional sales FVTPL FVTPL
Financial liabilities
Trade payable and accrued liabilities Loan and receivables Amortized costs
Loan payable Loan and receivables Amortized costs
IFRS 9 introduces a new three-stage expected credit loss model for calculating impairment for financial assets. IFRS 9 no longer
requires a triggering event to have occurred before credit losses are recognized. An entity is required to recognize expected
credit losses when financial instruments are initially recognized and to update the amount of expected credit losses recognized
at each reporting date to reflect changes in the credit risk of the financial instruments.
In addition, IFRS 9 requires additional disclosure requirements about expected credit losses and credit risk. For its trade
receivables from provisional sales, the Company applies the simplified approach to providing for expected credit losses, which
allows the use of a lifetime expected loss provision. There was no adjustment relating to the implementation of the expected
credit loss model for the Company’s trade receivables from provisional sales. Impairment losses on financial assets carried at
amortized cost are reversed in subsequent periods if the amount of the loss decreases and the decrease can be objectively
related to an event occurring after the impairment was recognized.
NON-IFRS FINANCIAL MEASURES
The Company has included, throughout this document, certain performance measures, including (a) average cash cost of
silver per attributable ounce, (b) average realized silver price per attributable ounce, and (c) adjusted EBITDA. The presentation
of these non-IFRS measures is intended to provide additional information and should not be considered in isolation or as a
substitute for measures of performance prepared in accordance with IFRS. These non-IFRS measures do not have any
standardized meaning prescribed by IFRS, and other companies may calculate these measures differently.

METALLA ROYALTY & STREAMING LTD.
MANAGEMENT’S DISCUSSION AND ANALYSIS
(Expressed in Canadian dollars, unless otherwise indicated)
FOR THE NINE MONTHS ENDED FEBRUARY 28, 2019
Management’s Discussion and Analysis - Page 15
Average cash cost per attributable ounce
Average cash cost per attributable ounce is calculated by dividing the Company’s total cash cost of sales, excluding depletion
by the number of attributable silver ounces sold. The Company presents average cash cost per ounce as it believes that certain
investors use this information to evaluate the Company’s performance in comparison to other streaming companies in the
precious metals mining industry who present results on a similar basis.
Q3 Q3 YTD YTD
Presented in US$ 2019 2018 2019 2018(1)
Cost of sales, excluding depletion $ 399,277 $ 538,064 $ 2,008,039 $ 1,734,820
Cost of sales for NLGM(2) 6,245 7,903 18,738 22,532
Adjust for:
Refining charge 72,469 100,630 378,422 300,983
Total cash cost of sales 477,991 646,597 2,405,199 2,058,336
Total attributable silver oz. sold(3) 76,775 96,543 380,017 291,463
Average cash cost of silver per attributable oz. $ 6.23 $ 6.70 $ 6.33 $ 7.06 (1) The Endeavor silver stream was acquired on July 31, 2017; comparative information includes attributable silver oz. that were
shipped and provisionally invoiced during June and July 2017, where the Company is entitled to the associated trade
receivable amounts. (2) Adjusted for the Company’s proportionate share of NLGM held by Silverback. (3) Payable silver ounces attributable to the Company that were shipped and provisionally invoiced during the period; as at the
reporting date, 77,272 oz. of attributable silver produced were to be sold in the subsequent quarter.
Average realized silver price per attributable ounce
Average realized silver price per attributable ounce is calculated by dividing the Company’s sales by the number of attributable
silver ounces sold. The Company presents average realized silver price per attributable ounce as it believes that certain
investors use this information to evaluate the Company’s performance in comparison to other streaming companies in the
precious metals mining industry that present results on a similar basis.
Q3 Q3 YTD YTD
Presented in US$ 2019 2018 2019 2018(1)
Provisional sales from stream interest $ 1,034,712 $ 1,379,649 $ 5,263,464 $ 4,372,270
Revenue from NLGM(2) 62,451 79,034 187,382 225,320
Adjust for:
Refining charge 72,469 100,630 378,422 300,983
Revenue from stream and other interests 1,169,631 1,559,312 5,829,268 4,898,573
Total attributable silver oz. sold 76,775 96,543 380,017 291,463
Average realized silver price per attributable oz. $ 15.23 $ 16.15 $ 15.34 $ 16.81
Operating cash margin per attributable oz.(3) $ 9.00 $ 9.45 $ 9.01 $ 9.75 (1) The Endeavor silver stream was acquired on July 31, 2017; comparative information includes attributable silver oz. that were
shipped and provisionally invoiced during June and July 2017, where the Company is entitled to the associated trade
receivable amounts. (2) Adjusted for the Company’s proportionate share of NLGM held by Silverback. (3) Operating cash margin is calculated based on average realized price and average cash cost.

METALLA ROYALTY & STREAMING LTD.
MANAGEMENT’S DISCUSSION AND ANALYSIS
(Expressed in Canadian dollars, unless otherwise indicated)
FOR THE NINE MONTHS ENDED FEBRUARY 28, 2019
Management’s Discussion and Analysis - Page 16
Adjusted EBITDA
Management uses adjusted EBITDA to evaluate the Company’s operating performance, to plan and forecast its operations,
and assess leverage levels and liquidity measures. The Company presents adjusted EBITDA as it believes that certain investors
use this information to evaluate the Company’s performance in comparison to other streaming companies in the precious
metals mining industry who present results on a similar basis. However, adjusted EBITDA do not represent, and should not be
considered an alternative to, net income (loss) or cash flow provided by operating activities as determined under IFRS.
Q3 Q3 YTD YTD
Presented in C$ 2019 2018 2019 2018
Net loss $ (446,105) $ (310,845) $ (1,255,084) $ (1,764,636)
Interest expense on loans payable 111,969 106,467 310,750 248,194
Income tax provision 67,285 44,656 600,888 150,271
Depletion and amortization 419,723 872,795 2,137,028 2,720,924
Foreign exchange (gain) loss (25,251) (70,214) 181,270 220,169
Share-based payments(1) 362,547 28,800 856,060 653,229
Adjusted EBITDA $ 490,168 $ 671,659 $ 2,830,912 $ 2,228,151 (1) Includes stock options, RSUs, and performance-based payments.
RISK FACTORS
For further information regarding the Company’s operational risks, please refer to the detailed disclosure concerning the
material risks and uncertainties associated with the Company’s business set out in its annual MD&A, dated September 26,
2018, which is available on SEDAR under the Company’s filer profile.
SHARE POSITION AND OUTSTANDING WARRANTS AND OPTIONS
As at the date of this MD&A, the Company had 131,736,694 common shares issued and outstanding. There were also 8,687,501
options and 8,567,001 share purchase warrants outstanding with expiry dates ranging from May 31, 2019 to August 30, 2021.
QUALIFIED PERSONS
The technical information contained in this MD&A has been reviewed and approved by Charles Beaudry, geologist M.Sc.,
member of the Association of Professional Geoscientists of Ontario and of the Ordre des Géologues du Québec and a director
of Metalla. Mr. Beaudry is a Qualified Person as defined in “National Instrument 43-101 Standards of disclosure for mineral
projects”.
CAUTIONARY STATEMENT ON FORWARD-LOOKING STATEMENTS
This MD&A contains “forward-looking information” and “forward-looking statements” within the meaning of applicable
Canadian and U.S. securities legislation. The forward-looking statements herein are made as of the date of this MD&A only
and the Company does not assume any obligation to update or revise them to reflect new information, estimates or opinions,
future events or results or otherwise, except as required by applicable law.
Often, but not always, forward-looking statements can be identified by the use of words such as “plans”, “expects”, “is
expected”, “budgets”, “scheduled”, “estimates”, “forecasts”, “predicts”, “projects”, “intends”, “targets”, “aims”, “anticipates” or
“believes” or variations (including negative variations) of such words and phrases or may be identified by statements to the
effect that certain actions “may”, “could”, “should”, “would”, “might” or “will” be taken, occur or be achieved. Forward-looking
information in this MD&A includes, but is not limited to, statements with respect to future events or future performance of
Metalla, disclosure regarding the precious metal purchase agreements and royalty payments to be paid to Metalla by property

METALLA ROYALTY & STREAMING LTD.
MANAGEMENT’S DISCUSSION AND ANALYSIS
(Expressed in Canadian dollars, unless otherwise indicated)
FOR THE NINE MONTHS ENDED FEBRUARY 28, 2019
Management’s Discussion and Analysis - Page 17
owners or operators of mining projects pursuant to net smelter returns and other royalty agreements of Metalla,
management’s expectations regarding Metalla’s growth, results of operations, estimated future revenues, carrying value of
assets, future dividends, and requirements for additional capital, production estimates, production costs and revenue, future
demand for and prices of commodities, expected mining sequences, business prospects and opportunities. Such forward-
looking statements reflect management’s current beliefs and are based on information currently available to management.
Forward-looking statements involve known and unknown risks, uncertainties and other factors, which may cause the actual
results, performance or achievements of the Company to be materially different from any future results, performance, or
achievements expressed or implied by the forward-looking statements. A number of factors could cause actual events or
results to differ materially from any forward-looking statements, including, without limitation: fluctuations in the prices of the
primary commodities that drive royalty and stream revenue (gold and silver); fluctuations in the value of the U.S. dollar and
any other currency in which revenue is generated, relative to the Canadian dollar; changes in national and local government
legislation, including permitting and licensing regimes and taxation policies and the enforcement thereof; regulatory, political
or economic developments in any of the countries where properties in which the Company holds a royalty, stream, or other
production-base interest are located or through which they are held; risks related to the operators of the properties in which
the Company holds a royalty, stream, or other production-base interest, including changes in the ownership and control of
such operators; influence of macroeconomic developments; business opportunities that become available to, or are pursued
by the Company; reduced access to debt and equity capital; litigation; title, permit or license disputes related to interests on
any of the properties in which the Company holds a royalty, stream, or non-operating interest; whether or not the Company
is determined to have “passive foreign investment company” (“PFIC”) status as defined in Section 1297 of the United States
Internal Revenue Code of 1986, as amended; potential changes in Canadian tax treatment of offshore streams; excessive cost
escalation as well as development, permitting, infrastructure, operating or technical difficulties on any of the properties in
which the Company holds a royalty, stream, or other production-based interest; the possibility that actual mineral content may
differ from the reserves and resources contained in technical reports; rate and timing of production differences from resource
estimates, other technical reports and mine plans; risks and hazards associated with the business of development and mining
on any of the properties in which the Company holds a royalty, stream, or other production-based interest, including, but not
limited to unusual or unexpected geological and metallurgical conditions, slope failures or cave-ins, flooding and other natural
disasters, terrorism, civil unrest or an outbreak of contagious diseases; and the integration of acquired assets.
The forward-looking statements contained in this MD&A are based on reasonable assumptions that have been made by
management as at the date of such information and is subject to unknown risks, uncertainties and other factors that may cause
the actual actions, events or results to be materially different from those expressed or implied by such forward-looking
information, including, without limitation: the impact of general business and economic conditions; the ongoing operation of
the properties in which the Company holds a royalty, stream, or other production-base interest by the owners or operators of
such properties in a manner consistent with past practice; the accuracy of public statements and disclosures made by the
owners or operators of such underlying properties; no material adverse change in the market price of the commodities that
underlie the asset portfolio; the Company’s ongoing income and assets relating to determination of its PFIC status; no material
changes to existing tax treatment; no adverse development in respect of any significant property in which the Company holds
a royalty, stream, or other production-base interest; the accuracy of publicly disclosed expectations for the development of
underlying properties that are not yet in production; integration of acquired assets; actual results of mining and current
exploration activities; conclusions of economic evaluations and changes in project parameters as plans continue to be refined;
problems inherent to the marketability of precious metals; stock market volatility; competition; and the absence of any other
factors that could cause actions, events or results to differ from those anticipated, estimated or intended.
Although Metalla has attempted to identify important factors that could cause actual actions, events or results to differ
materially from those contained in forward-looking information, there may be other factors that cause actions, events or results
not to be as anticipated, estimated or intended. There can be no assurance that such information will prove to be accurate,
as actual results and future events could differ materially from those anticipated in such information. Investors are cautioned
that forward-looking statements are not guarantees of future performance. The Company cannot assure investors that actual
results will be consistent with these forward-looking statements. Accordingly, investors should not place undue reliance on
forward-looking statements or information.

METALLA ROYALTY & STREAMING LTD.
MANAGEMENT’S DISCUSSION AND ANALYSIS
(Expressed in Canadian dollars, unless otherwise indicated)
FOR THE NINE MONTHS ENDED FEBRUARY 28, 2019
Management’s Discussion and Analysis - Page 18
This MD&A contains future-orientated information and financial outlook information (collectively, “FOFI”) about the Company’s
revenues from royalties, streams and other projects which are subject to the same assumptions, risk factors, limitations and
qualifications set forth in the above paragraphs. FOFI contained in this MD&A was made as of the date of this MD&A and was
provided for the purpose of providing further information about the Company’s anticipated business operations. Metalla
disclaims any intention or obligation to update or revise any FOFI contained in this MD&A, whether as a result of new
information, future events or otherwise, unless required pursuant to applicable law. FOFI contained in this MD&A should not
be used for the purposes other than for which it is disclosed herein.