metal-mott insulator transitionsmafija.fmf.uni-lj.si/seminar/files/2012_2013/alen_horvat_ib.pdf ·...
TRANSCRIPT

University of LjubljanaFaculty of Mathematics and Physics
Seminar Ib
Metal-Mott insulator transitions
Author: Alen Horvat
Advisor: doc. dr. Tomaz Rejec
Co-advisor: dr. Jernej Mravlje
Ljubljana, September 10, 2013
Abstract
In this seminar, we discuss the metal-insulator tranisition that occurs as a consequence of elec-
tronic interactions. The basic experimental phenomenology and simple theoretical explanations
are presented. We start with the band picture of metals and insulators. Next we present the Slater
picture of magnetically ordered insulators and continue with the Mott theory of magnetically dis-
ordered insulators. In the end the Brinkman-Rice theory of metals and the dynamical mean-field
theory are presented.

Seminar Ib Metal-Mott insulator transition 2
CONTENTS
I. Introduction 2
II. Theoretical pictures 3
A. Band picture 3
B. Slater picture 4
C. Mott picture 6
D. Brinkman-Rice picture 8
E. Dynamical mean-field theory (DMFT) 11
III. Conclusion 13
References 14
I. INTRODUCTION
Electrical insulators or poor electric conductors are transparent due to the existence of an en-
ergy gap, Eg. Because energy of the visible light (1.7 − 3.1 eV) is less than the energy gap
Eg ≈ 5− 10 eV in a typical insulator, photon absorption does not occur, and the insulator is trans-
parent. A diamond, which is good electrical insulator, is transparent and has electrical resistivity
ρ ≈ 1011− 1018 Ωm. Metals or good electric conductors partially absorb and reflect light. Reflec-
tion and absorption occur because metals have partially filled band and behave as ideal dielectrics.
A silver, which is good electrical conductor, has electrical resistivity ρ ≈ 10−8 Ωm and its reflec-
tion coefficient is R = 0.90, for the visible light. When a material undergoes a metal-insulator
phase transition (MIT), its electrical resistivity changes for several orders of magnitude. An exam-
ple is V2O3, for which a pressure/electrical resistivity diagram is presented in fig. 2a. At particular
external pressure first order phase transition occurs, where electrical resistivity of V2O3 changes
for 9 orders of magnitude. Two parameters that control the MIT are electronic correlation strength
and electronic band filling. Both are manipulated via external electric/magnetic fields, pressure,
and carrier doping. In materials, that are explicable well in the noninteracting band theory, manip-
ulating conductivity is difficult, e.g., introducing carriers to the diamond. Another set of materials
exist where electronic correlation is dominant. An example is V2O3. Its insulating state is called a
Mott insulator and these are the the subject of the present seminar.
Seminar Ib Metal-Mott insulator transition 3
To get insight into these phenomenon we present theoretical pictures of metallic and insu-
lating phases and mechanisms that cause phase transitions. We present the band, Slater, Mott,
and Brinkman-Rice theoretical pictures. In the end we depict the dynamical mean-field the-
ory (DMFT).
II. THEORETICAL PICTURES
A. Band picture
Consider a Fermi gas placed into a periodic lattice potential. If the lattice potential is constant
in space and time, electrons are equally distributed in the space, and obey the Fermi-Dirac dis-
tribution in the momentum space. When a weak periodic lattice potential V (r) = V (r + R) is
introduced, where R is the lattice vector, an energy gap Eg = 2|V | in vicinity of the Fermi energy
occurs that separates the electronic band into a lower and upper band. If the lowest unoccupied
state is separated from highest occupied state by the energy gap, the system is insulating. In this
case, a weak external electric field does not modify the electron distribution and therefore cannot
induce flow of electrons. At zero temperature fields exceeding the size of a gap per a small length
scale cause Zener breakdown to occur. When the number of electrons per lattice site is even (odd),
the lower band is always fully (partially) occupied. If Eg > 0 and the Fermi level intersects one of
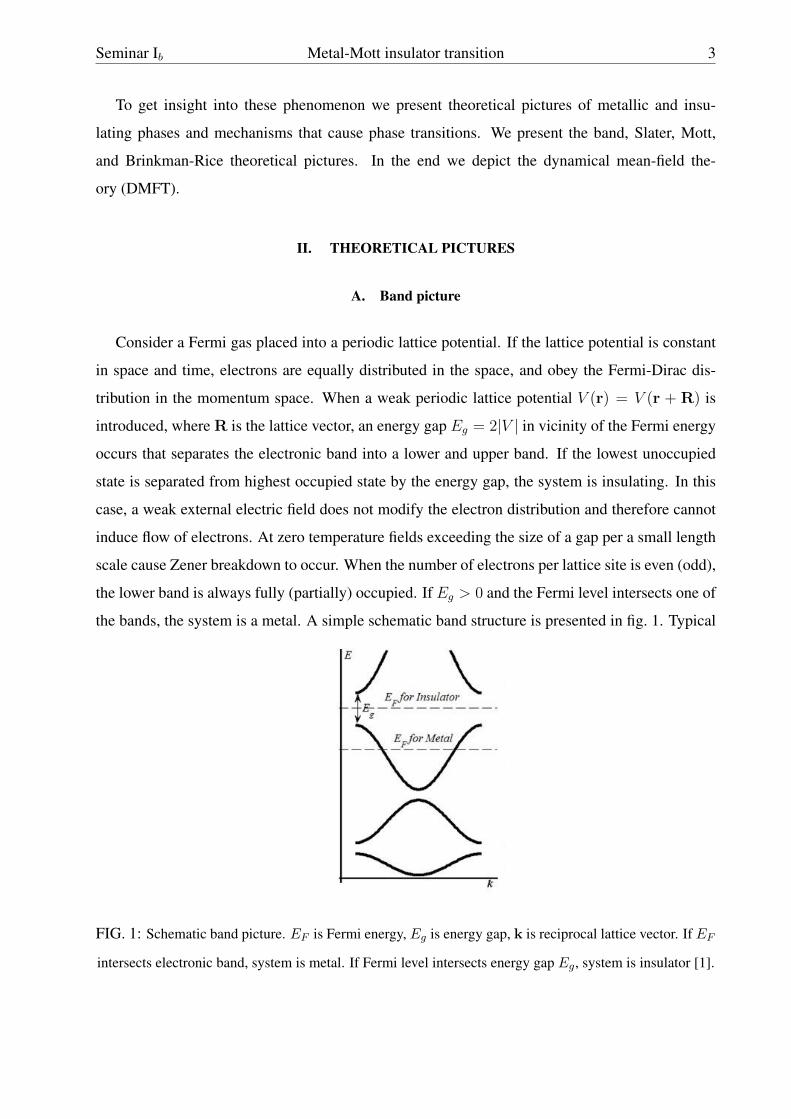
the bands, the system is a metal. A simple schematic band structure is presented in fig. 1. Typical
FIG. 1: Schematic band picture. EF is Fermi energy, Eg is energy gap, k is reciprocal lattice vector. If EF
intersects electronic band, system is metal. If Fermi level intersects energy gap Eg, system is insulator [1].

Seminar Ib Metal-Mott insulator transition 4
energy of a gap is few eV and the thermal energy kBT ≈ 1/40 eV is not enough to induce a flow
of electrons.
MIT occurs if a material is doped by a charge carriers or if the lattice structure is rearranged by
an external pressure. In an insulating state, where the Fermi level lies in the energy gap, adequate
doping of electrons causes the Fermi level EF to rise above the lowest occupied electronic band,
and the system becomes metallic, or vice versa. External pressure exerted on the system changes
the effective lattice potential and consequently width of the energy gap. When an energy gap in
vicinity of the Fermi level disappears or arises, a MIT occurs [2].
The band theory fails to predict behavior of the transition-metal oxides (V2O3, NiO, Fe3O4,
etc.) and Mott insulators. Some transition-metal oxides are insulators although they have odd
number of electrons per lattice site. This is inconsistent with the band theory. Examples are Fe3O4
and Fe2O3, which have same lattice structure and 5 1/2 and 5 electrons per lattice site, respectively.
First is conducting 1011 times better than the second one. The band theory cannot explain the
insulating phase for a partially filled band, neither the occurrence of non-integer band filling [3].
Another example is V2O3, which should have been a metal throughout the phase diagram, while
it displays insulating regime, fig. 2 b), at low temperatures.
B. Slater picture
Some metal-oxides, like V2O3, with partially filled d or f orbitals have anti-ferromagnetic
ground state, narrow bands and are not explicable within non-interacting theories due to strong
electron-electron correlations. Materials corresponding to this description are correlated materials
and are partially explicable by the Hubbard model. In metal-oxides the overlap of the two adjacent
d orbitals is small, consequently the electronic bands are narrow. Degeneracy, of the formed bands,
is lifted under the strong influence of an anisotropic crystal field. The ligand p orbitals in vicinity
of the Fermi level are strongly hybridized with the corresponding d orbitals or are far from the
Fermi level. Hence, a single narrow electronic band remains in vicinity of the Fermi level and the
single band Hubbard model can be used for the description of correlated materials. The Hubbard
model in second quantization reads
H = −t∑〈ij〉
(c†iσcjσ + h.c.) + U∑i
ni↑ni↓. (1)
Seminar Ib Metal-Mott insulator transition 5
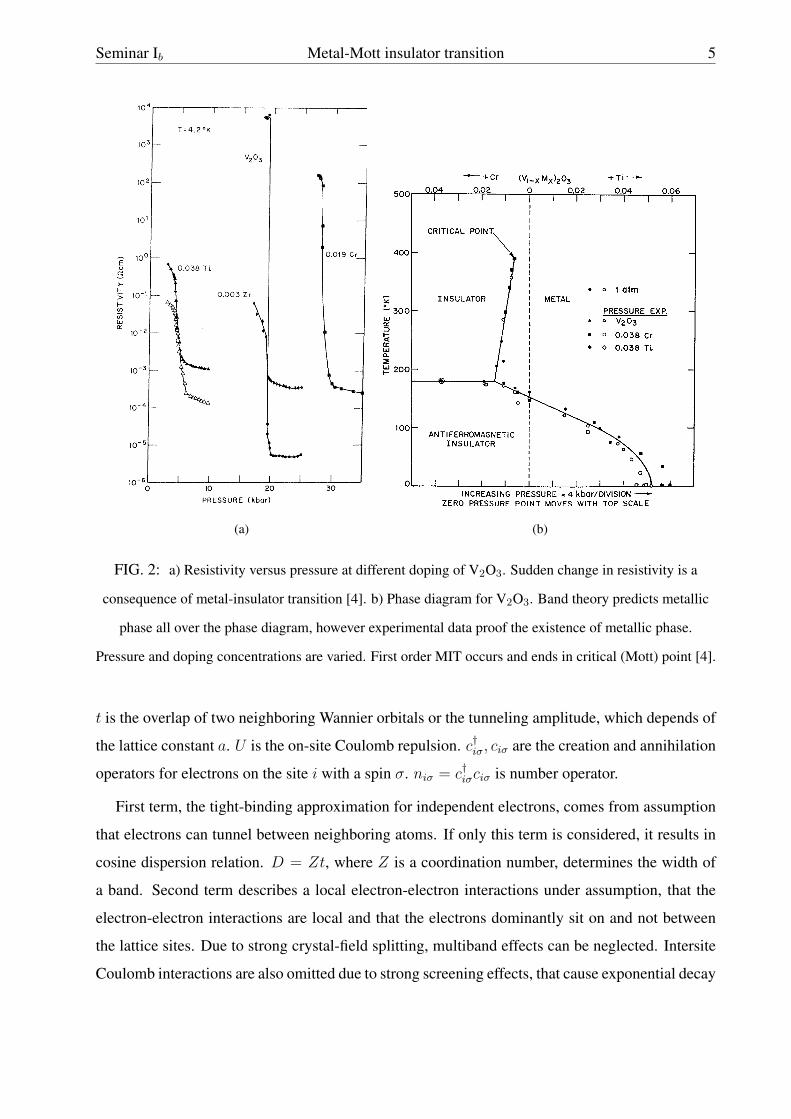
(a) (b)
FIG. 2: a) Resistivity versus pressure at different doping of V2O3. Sudden change in resistivity is a
consequence of metal-insulator transition [4]. b) Phase diagram for V2O3. Band theory predicts metallic
phase all over the phase diagram, however experimental data proof the existence of metallic phase.
Pressure and doping concentrations are varied. First order MIT occurs and ends in critical (Mott) point [4].
t is the overlap of two neighboring Wannier orbitals or the tunneling amplitude, which depends of
the lattice constant a. U is the on-site Coulomb repulsion. c†iσ, ciσ are the creation and annihilation
operators for electrons on the site i with a spin σ. niσ = c†iσciσ is number operator.
First term, the tight-binding approximation for independent electrons, comes from assumption
that electrons can tunnel between neighboring atoms. If only this term is considered, it results in
cosine dispersion relation. D = Zt, where Z is a coordination number, determines the width of
a band. Second term describes a local electron-electron interactions under assumption, that the
electron-electron interactions are local and that the electrons dominantly sit on and not between
the lattice sites. Due to strong crystal-field splitting, multiband effects can be neglected. Intersite
Coulomb interactions are also omitted due to strong screening effects, that cause exponential decay

Seminar Ib Metal-Mott insulator transition 6
of the Coulomb interactions. In spite of these tremendous simplifications, the Hubbard model can
reproduce the Mott insulating phase and the transition between Mott insulators and metals [5].
The Slater theory explains insulating states that arise from an antiferromagnetic ground state
and can be described by the single-band Hubbard model. Consider a bipartite lattice constituted of
A and B sublatices, with one s-electron per site. Nearest neighbor coupling is antiferromagnetic
and nearest neighbors of electron from A are from B, and vice versa. Because the ↑, ↓ spins
mutually repel due to the Coulomb interaction (potential term in eq. (1)), they arrange themselves
that, e.g., spins on A are ↑ and spins on B are ↓. Hence spins form a spin-density wave which is
self-stabilizing. The system is not translational invariant, therefore we have gain in the potential
energy and equivalent loss in the kinetic energy, due to the localization of electrons. Therefore,
more favorable is if doubling of the lattice cells occurs (the Brillouin zone is halved), where the
energy of the system is lower. At the new Brillouin zone boundary a band splitting and a energy
gap for charge excitations occur, therefore the system is insulating [6]. Analogically an attractive
local electron-electron interactions form a charge-density waves, which also lead to an insulating
state.
MIT is closely connected with disappearance of a magnetic ordering at Neel temperature TN .
As temperature rises, thermal fluctuations affect the ordering and the energy gap is narrowed.
When the energy of thermal fluctuations becomes comparable to the coupling energy, the ordering
is destroyed and first order phase transition occurs. Some antiferromagnetic oxides, e.g., V2O3,
remain insulating well above the TN , as can be noticed in phase diagram, fig. 2 b). In the Slater
theory width of an energy gap is comparable to the kBTN , what is much less than width of the
energy gap in realistic materials [2].
C. Mott picture
Magnetically disordered insulators are known as Mott insulators. Consider a system, with half
filling and narrow bands, described by the Hubbard model (1). Whether the system is a metal or
a insulator depends on ratio between the energy gap and the strength of electron-electron corre-
lations, 2t/U . When electron-electron correlations are negligible, t/U 1, the electrons tunnel
between the atoms, and the system is metallic. In the atomic limit, t/U 1, where electron-
electron correlations prevail, the electrons are well localized, and the system is an insulator [7].
A schematic Mott transition is presented in fig. 3 a). Let us consider a system with half filling

Seminar Ib Metal-Mott insulator transition 7
U-D
2D
Decreasing U
EF
LHB
UHB
(a)
Intensity(arb
.unit)
-3 -2 -1 0
E-EF(eV)
U=5.0eV, T=1160KU=5.0eV, T=300K
hν=700eV, T=175K
Schramme et al. [14]
hν=60eV, T=300K
(b)
FIG. 3: a) Schematic Mott transition, where due to decreasing electron correlations lower (LHB) and
upper (UHB) Hubbard band start to overlap and system becomes metallic. b) Photoemission spectra and
the dynamical mean-field theory (DMFT) calculations for V2O3. The quasi-particle peak (E − EF = 0)
and the LHB are clearly seen, however the quasi-particle peak is much wider than the dynamical
mean-field theory simulation predicted [9].
and small overlap of the atomic orbitals, where 2D U . Energy µ+ = E0(N + 1) − E0(N)
necessary to add an electron is given by µ+(N = L) = U−D, since charge excitations with energy
U are mobile, such that they form a band with width D, as in case of the non-interacting electrons.
This band is the upper Hubbard band, which is generally not a one-electron band and it describes
the spectrum of charge excitations for an extra electron added to the ground state. Energy required
for removal of an electron is µ−(N = L) = E0(N) − E0(N − 1) = U + D. The corresponding
spectrum forms the lower Hubbard band. Both bands are presented in fig. 3 a). When D U
we expect that the chemical potential is not continuous and a gap for charge excitations occurs
∆µ(N = L) ≈ U −D > 0. Hence the system is an insulator. If the overlap of the atomic orbitals
is increased U ≈ D, the bandwidth of the upper and the lower Hubbard band D and tendency of
electrons to delocalize increase. As U D the bands start to overlap, as presented in fig. 3 a),
the gap for charge excitations vanishes and the system is a metal [8]. For the intermediate values
U ≈ D a metal-insulator transition occurs.
Energy gap in insulators is of the order of 1eV ≈ 104K, which exceeds the energy scale (the
Neel temperature) predicted by Slater, Eg ≈ kBTN . If on-site repulsion in a insulator is large
compared to kinetic energy, stability of the insulator is guaranteed [2].

Seminar Ib Metal-Mott insulator transition 8
Although the Mott-Hubbard theory gives good description of insulating states, it fails to de-
scribe metallic states accurately. In correlated metals a quasi-particle peak located at the Fermi
energy, in addition to the lower Hubbard band, is observed in photoemission experiments. As an
example a spectra of V2O3 is shown in fig. 3 b) [9]. Note that the photoemission experiments
resolve only the occupied states and hence cannot resolve the upper Hubbard band (the inverse
photoemission experiments, which probe the unoccupied states are able to resolve it). The quasi-
particle peak corresponds to itinerant excitations with similar properties than the non-interacting
electrons. In contrast to the Mott-Hubbard picture, the quasi-particle peak is thus observed. Its
width diminishes on approaching the insulating phase continuously. Simultaneously, the spe-
cific heat coefficient increases. This can be thought of as the consequence of the increase of the
quasi-particle density of states. A better theory that describes itinerant quasi-particle states is thus
needed.
D. Brinkman-Rice picture
The simplest theory that describes the quasi-particle states correctly is based on the Gutzwiller
method. We describe this theory, developed by Brinkman and Rice below. Valence electrons in
the transition metals are from the d-orbitals, where electron-electron correlations are strong [8],
and sites with one electron per site are favorable. In uncorrelated systems most states are doubly
occupied, where the double occupancy occurs as a consequence of minimization of kinetic en-
ergy. In strongly correlated systems double occupancies are too costly due to the strong Coulomb
repulsion. Consider a Hubbard model, where degeneracy of the d-orbitals is lifted by a strong,
anisotropic crystal field, so a single d band remains near the Fermi level. Furthermore, let ligand p
orbitals be far from the Fermi level or be strongly hybridized with the relevant d orbitals [5]. Due
to strong screening of the ionic potential we neglect intersite Coulomb interactions. Solution, for
this model, is equivalent to the solution for narrow, half filled, s bands. We construct Gutzwiller’s
wave function (GWF) Ψ; letG, Γ denote the set of lattice sites occupied by ↑, ↓ spins, respectively.
Φ0 is the vacuum state, and particular spin configuration is
ψGΓ =∏g∈G
c+g↑
∏γ∈Γ
c+γ↓Φ0. (2)

Seminar Ib Metal-Mott insulator transition 9
Any strongly correlated state Ψ is expressed as
Ψ =∏g
[1− (1− η)νng↑ng↓]Φ, (3)
where Φ is wave function of the uncorrelated system [10]. In strongly correlated systems sites with
one electron per site are favorable, while in uncorrelated system most states are doubly occupied.
The exponent, ν, tells us the number of identical lattice sites among the sets G,Γ. Parameter η
is a weight for particular configuration, and depends on the occupancy of states. In uncorrelated
systems η = 1, while in correlated systems η < 1.
Pair correlation function ρ2(g↑, g↓; g↑, g↓), when number of electrons N and lattice dimensions
L limit toward infinity, is
ρ2(g↑, g↓; g↑, g↓) = ν, η =
√ν(L− 2N + ν)
N − ν=
2ν
1− 2ν. (4)
Weight parameter η depends on the average double occupancy ν. We express the effective quasi-
particle mass as m∗ = m/Z. Z ≡ q is discontinuity of single particle density function at Fermi
level. In terms of average double occupancy, ν, discontinuity reads q = 32ν(1 − 2ν). Discon-
tinuity q in terms of weight η, q = 4η/(1 + η)2, indicates, that for strong interactions, η → 0,
discontinuity disappears and electrons are well localized. Therefore, insulators can be envisaged
as systems with one electron per site, while metals can be treated as a sea of doubly occupied sites.
Let us estimate the ground state energy. Potential contribution from the Coulomb interaction
is 〈Ψ|HU |Ψ〉 = DU , where D ≡ ν. To estimate the kinetic part, we neglect spin and charge
short-range correlations, and obtain εη = q(ε↑ + ε↓) + Ud, where d = D/N, εσ = 〈Φ|Ht|Φ〉, q =
1− (U/U0)2. When we minimize the energy in terms of d, we get
εη(U < Uc) = −|ε↑ + ε↓|(
1− U
Uc
)2
, Uc = 8|ε↑ + ε↓|. (5)
For U > Uc system is insulator and η = 0 and εη = 0.
When U → U0, the effective mass, m∗/m = 1/q, diverges as q approaches 0. We express the
static electric susceptibility as
χ−1s =
1− (U/U0)2
ρ(εF )
[1− ρ(εF )U
1 + U/2U0
(1 + U/U0)2
], (6)
which also diverges as U → U0. Beside the susceptibility and the mass enhancement, the ratio
χ/m∗ is constant, as we approach U0 and that was observed in the experiments, fig. 4. Mass,
Seminar Ib Metal-Mott insulator transition 10
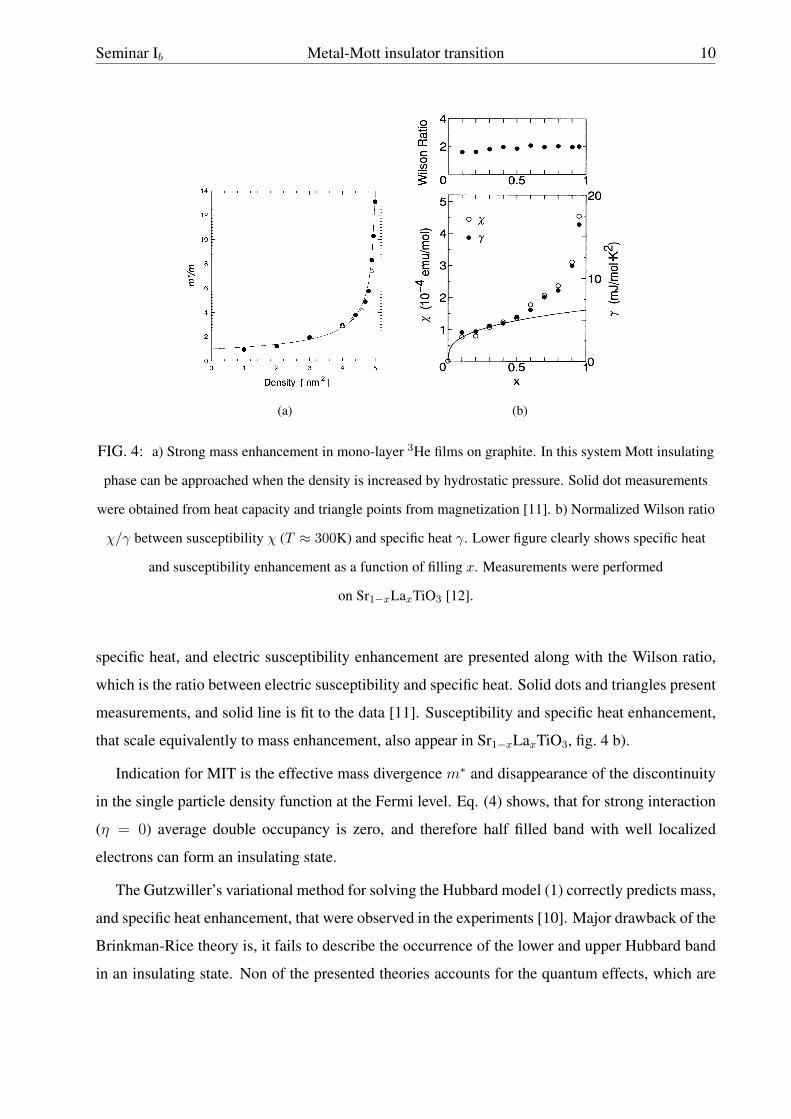
(a) (b)
FIG. 4: a) Strong mass enhancement in mono-layer 3He films on graphite. In this system Mott insulating
phase can be approached when the density is increased by hydrostatic pressure. Solid dot measurements
were obtained from heat capacity and triangle points from magnetization [11]. b) Normalized Wilson ratio
χ/γ between susceptibility χ (T ≈ 300K) and specific heat γ. Lower figure clearly shows specific heat
and susceptibility enhancement as a function of filling x. Measurements were performed
on Sr1−xLaxTiO3 [12].
specific heat, and electric susceptibility enhancement are presented along with the Wilson ratio,
which is the ratio between electric susceptibility and specific heat. Solid dots and triangles present
measurements, and solid line is fit to the data [11]. Susceptibility and specific heat enhancement,
that scale equivalently to mass enhancement, also appear in Sr1−xLaxTiO3, fig. 4 b).
Indication for MIT is the effective mass divergence m∗ and disappearance of the discontinuity
in the single particle density function at the Fermi level. Eq. (4) shows, that for strong interaction
(η = 0) average double occupancy is zero, and therefore half filled band with well localized
electrons can form an insulating state.
The Gutzwiller’s variational method for solving the Hubbard model (1) correctly predicts mass,
and specific heat enhancement, that were observed in the experiments [10]. Major drawback of the
Brinkman-Rice theory is, it fails to describe the occurrence of the lower and upper Hubbard band
in an insulating state. Non of the presented theories accounts for the quantum effects, which are
Seminar Ib Metal-Mott insulator transition 11
Material
(crystalline solid)
Atom
Effective
Medium
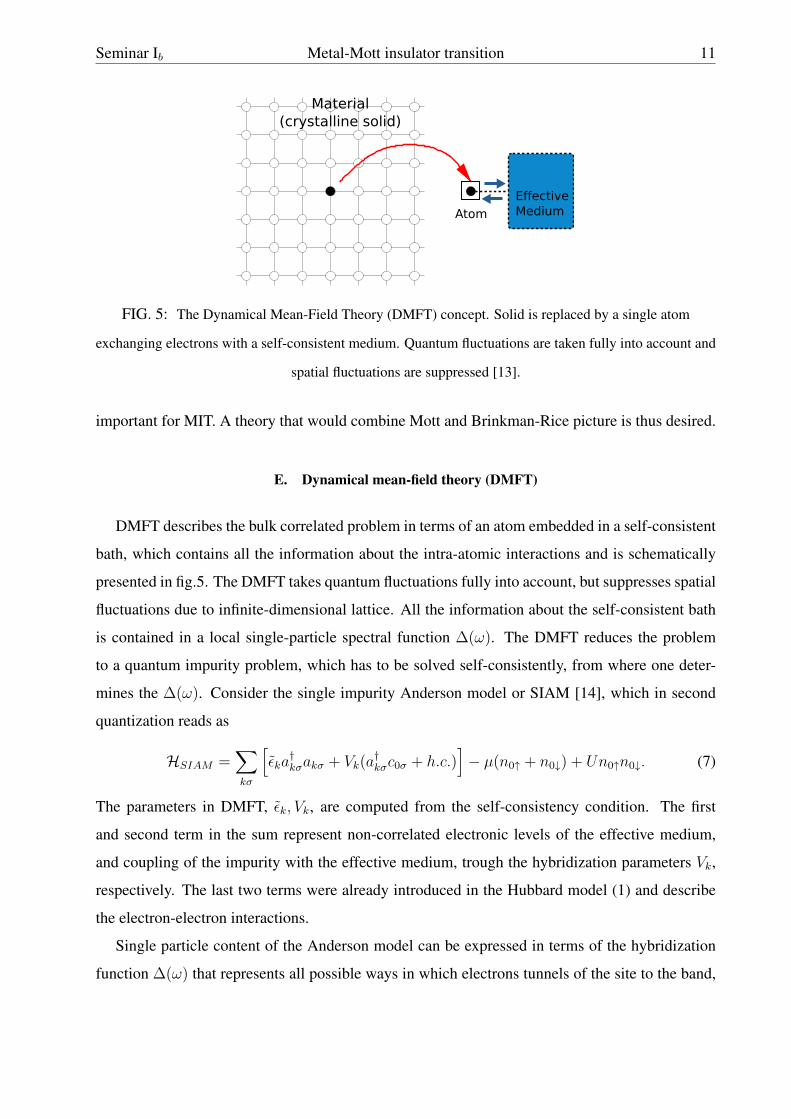
FIG. 5: The Dynamical Mean-Field Theory (DMFT) concept. Solid is replaced by a single atom
exchanging electrons with a self-consistent medium. Quantum fluctuations are taken fully into account and
spatial fluctuations are suppressed [13].
important for MIT. A theory that would combine Mott and Brinkman-Rice picture is thus desired.
E. Dynamical mean-field theory (DMFT)
DMFT describes the bulk correlated problem in terms of an atom embedded in a self-consistent
bath, which contains all the information about the intra-atomic interactions and is schematically
presented in fig.5. The DMFT takes quantum fluctuations fully into account, but suppresses spatial
fluctuations due to infinite-dimensional lattice. All the information about the self-consistent bath
is contained in a local single-particle spectral function ∆(ω). The DMFT reduces the problem
to a quantum impurity problem, which has to be solved self-consistently, from where one deter-
mines the ∆(ω). Consider the single impurity Anderson model or SIAM [14], which in second
quantization reads as
HSIAM =∑kσ
[εka†kσakσ + Vk(a
†kσc0σ + h.c.)
]− µ(n0↑ + n0↓) + Un0↑n0↓. (7)
The parameters in DMFT, εk, Vk, are computed from the self-consistency condition. The first
and second term in the sum represent non-correlated electronic levels of the effective medium,
and coupling of the impurity with the effective medium, trough the hybridization parameters Vk,
respectively. The last two terms were already introduced in the Hubbard model (1) and describe
the electron-electron interactions.
Single particle content of the Anderson model can be expressed in terms of the hybridization
function ∆(ω) that represents all possible ways in which electrons tunnels of the site to the band,
Seminar Ib Metal-Mott insulator transition 12
ω
ρ(ω)
(a) (b)
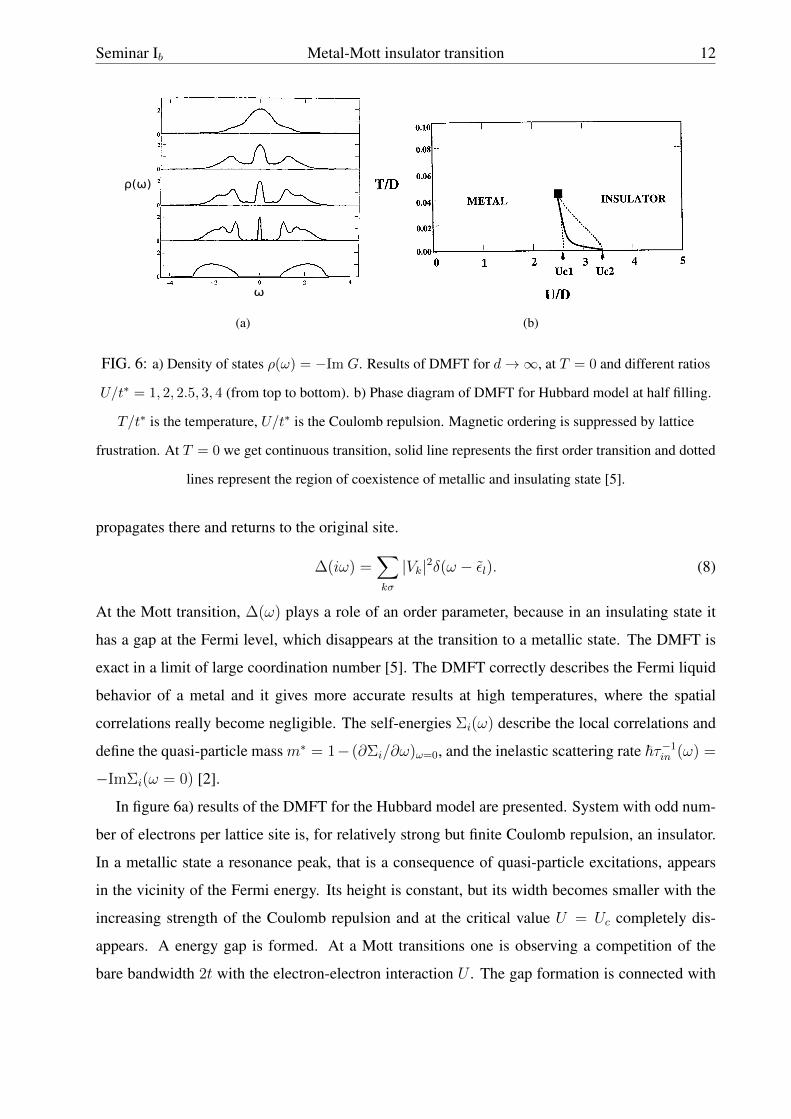
FIG. 6: a) Density of states ρ(ω) = −Im G. Results of DMFT for d→∞, at T = 0 and different ratios
U/t∗ = 1, 2, 2.5, 3, 4 (from top to bottom). b) Phase diagram of DMFT for Hubbard model at half filling.
T/t∗ is the temperature, U/t∗ is the Coulomb repulsion. Magnetic ordering is suppressed by lattice
frustration. At T = 0 we get continuous transition, solid line represents the first order transition and dotted
lines represent the region of coexistence of metallic and insulating state [5].
propagates there and returns to the original site.
∆(iω) =∑kσ
|Vk|2δ(ω − εl). (8)
At the Mott transition, ∆(ω) plays a role of an order parameter, because in an insulating state it
has a gap at the Fermi level, which disappears at the transition to a metallic state. The DMFT is
exact in a limit of large coordination number [5]. The DMFT correctly describes the Fermi liquid
behavior of a metal and it gives more accurate results at high temperatures, where the spatial
correlations really become negligible. The self-energies Σi(ω) describe the local correlations and
define the quasi-particle mass m∗ = 1− (∂Σi/∂ω)ω=0, and the inelastic scattering rate ~τ−1in (ω) =
−ImΣi(ω = 0) [2].
In figure 6a) results of the DMFT for the Hubbard model are presented. System with odd num-
ber of electrons per lattice site is, for relatively strong but finite Coulomb repulsion, an insulator.
In a metallic state a resonance peak, that is a consequence of quasi-particle excitations, appears
in the vicinity of the Fermi energy. Its height is constant, but its width becomes smaller with the
increasing strength of the Coulomb repulsion and at the critical value U = Uc completely dis-
appears. A energy gap is formed. At a Mott transitions one is observing a competition of the
bare bandwidth 2t with the electron-electron interaction U . The gap formation is connected with

Seminar Ib Metal-Mott insulator transition 13
the vanishing renormalization factor Z and the diverging mass of the quasi-particles. Figure 6b)
presents the phase diagram for a half-filled Hubbard model. Solid line denotes the first order tran-
sition, which occurs at higher temperatures and ends with a second order critical point (also called
Mott critical point). Dotted lines denote the region of coexistence of both metallic and insulating
states. At T = 0 temperature continuous transition occurs. In fig. 3b) we can compare the DMFT
results and the photoemission spectra (dotted plots) of V2O3. Quasi-particle peak in vicinity of the
Fermi level and lower Hubbard band are observed. The DMFT predicts narrower quasi-particle
peaks than observed in the experiments, but positions of the peaks match.
The DMFT has given very good results in examining the vicinity of the Mott transition in
clean systems, very well predicted the properties of several transition metal oxides, heavy fermion
systems, and Kondo insulators. It also naturally introduces a dynamical order parameters, that
characterizes the qualitative differences between the various phases [2]. On the other hand, the
DMFT does not give good description of phenomena, that are dominated by spatial fluctuations.
Furthermore it cannot provide description of various physical quantities near the critical point.
The DMFT is very extensive theory and for more details one should see ref. [2] and [14].
III. CONCLUSION
We presented simple theoretical pictures of metals and insulators. The band theory explains
insulating states in terms of the filled conduction bands. Some magnetically ordered materials
with half filling are insulators, due to the doubling of the lattice cell. This is correctly explained by
the Slater theory. Metal-oxides, like V2O3, have odd number of electrons per lattice site and are
insulators, well above the Neel temperature. To explain this, electron-electron interactions have
to be taken into account. Furthermore, in metals a quasi-particle peak, specific heat, and electric
susceptibility enhancement were observed and explained within the Brinkman-Rice theory and
the Fermi liquid theory. A theoretical approach that accounts accurately for all the mentioned
phenomena by bridging the Mott and the Brinkman-Rice picture is the DMFT. The DMFT is
based on a simplification that occurs in the limit of large dimensionality. This simplification
correctly incorporates local charge fluctuations but neglects the long range spatial fluctuations. The

Seminar Ib Metal-Mott insulator transition 14
extensions of the DMFT that incorporate the spatial dependence are currently being developed.
[1] P. Meredith, C. Bettinger, M. Irimia-Vladu, A. Mostert, and P. Schwenn, Reports on Progress in
Physics 76, 034501 (2013).
[2] V. Dobrosavljevic, N. Trivedi, and J. M. Valles Jr, Conductor Insulator Quantum Phase Transitions
(OUP Oxford, 2012).
[3] J. H. de Boer and E. J. Verwey, Proceedings of the Physical Society 49, 59 (1937).
[4] D. B. McWhan, A. Menth, J. P. Remeika, W. F. Brinkman, and T. M. Rice, Phys. Rev. B 7, 1920
(1973).
[5] M. Imada, A. Fujimori, and Y. Tokura, Reviews of Modern Physics 70, 1039 (1998).
[6] F. Gebhard, The mott metal-insulator transition: models and methods, Vol. 137 (Springer, 1997).
[7] N. Francis, Metal-insulator transitions (Taylor & Francis London, 1990).
[8] J. Hubbard, Proceedings of the Royal Society of London. Series A. Mathematical and Physical Sci-
ences 276, 238 (1963).
[9] S.-K. Mo, J. Denlinger, H.-D. Kim, J.-H. Park, J. Allen, A. Sekiyama, A. Yamasaki, K. Kadono,
S. Suga, Y. Saitoh, et al., Physical review letters 90, 186403 (2003).
[10] M. C. Gutzwiller, Phys. Rev. 137, A1726 (1965).
[11] A. Casey, H. Patel, J. Nyeki, B. Cowan, and J. Saunders, Physical review letters 90, 115301 (2003).
[12] Y. Tokura, Y. Taguchi, Y. Okada, Y. Fujishima, T. Arima, K. Kumagai, and Y. Iye, Phys. Rev. Lett.
70, 2126 (1993).
[13] A. Georges, L. d. Medici, and J. Mravlje, Annu. Rev. Condens. Matter Phys. 4, 137 (2013).
[14] A. Georges, G. Kotliar, W. Krauth, and M. J. Rozenberg, Reviews of Modern Physics 68, 13 (1996).