metal-mechanical value chain in latin america: investment dynamics … · 2016-07-25 ·...
TRANSCRIPT

Metal-mechanical value chain in Latin America Investment dynamics 1. Alacero
_ _
Metal-mechanicalvalue chain inLatin America:Investment dynamics
OCTOBER, 2013
BY GERMANO MENDES DE PAULA, DR.

2. Alacero
_ _
About the autor
Germano Mendes De Paula is Professor of Economics at the Federal University of Uberlandia (UFU). Bachelor in Economics by UFU (1987). M.Sc. and Dr. Sc. Industrial and Technology Economics by Federal University of Rio de Janeiro (1992 and 1998). Visiting Research Fellow in Economics (Post-Doctor), Oxford University, UK (1999) and Columbia University, USA (2013).
Since 1989, he is been focusing on worldwide iron ore and steel industry. Main publications: eight books (two as editor), 19 book chapters and more than 300 articles. He lasted book is entitled “Latin American Steel: a retrospective in 101 essays”, which was published by Quartz Business Media, in UK, in 2012.

Metal-mechanical value chain in Latin America Investment dynamics 3. Alacero
_ _
Objective
Methodology
Scope
01. General concepts
02. Key conclusions
03. Macroeconomic investment
in selected countries
04. International trade of metal-
mechanical products
05. Investments in metal-
mechanical value chain
in the selected countries
06. Prospective investments
in the Latin American metal-
mechanical value chain
07. Some recommendations
of public policies to
improve investment in the
metal-mechanical value
chain
P. 05
P. 05
P. 05
P. 06
P. 08
P. 10
P. 12
P. 14
P. 17
P. 21
4. Alacero
_ _
National studies and this executive summary are of the exclusive responsibilityof the authors and do not necessarily reflect Alacero or the members of its Board’s opinions.
Local coordination of these studies was directed by:
Argentina Bernardo Kosacoff (University of Buenos Aires/UBA) and Fernando Grasso (Association of Metallurgical Industrial Companies of Argentina/Adimra)
Brazil Célio Hiratuka (State University of Campinas/Unicamp)
Colombia Andrés Mauricio Ramírez Pulido (RAMIREZP Consultores & Asociados) and Juan ManuelLesmes Patino (Colombia National Associationof Entrepreneurs/ANDI)
Mexico Salvador Quesada and José Vergara (MexicanIron and Steel Association/Canacero).
General coordination was conducted by Germano Mendes de Paula (Federal University of Uberlandia/UFU).

Metal-mechanical value chain in Latin America Investment dynamics 5. Alacero
_ _
This report summarizes the key findings of “Metal-mechanical value chain in Latin America: Investment dynamics” project developed during the first half of 2013 at a request of Alacero, the Latin American Steel Association.
Objective
The key goal of this report is to analyze the investment trends in the metal-mechanical value chain in Latin America, in historical and prospective terms.
In addition, the report makes some recommendations of specific policies to be adopted in each of the Latin American selected countries to foster investment in their metal-mechanical value chains.
Methodology
In order to provide a perspective on the investment dynamics in the selected Latin American countries, this study compares their performance with other chosen economies as benchmarking, due to the reasons explained below.
China and South Korea were selected as examples of high (and consistent) investment rates. Both countries have been really engaged in promoting the manufacturing sector, in general, and the metal-mechanical value chain, in particular.
Czech Republic, Hungary and Poland were chosen because they displayed similar to Latin America development levels in the past. However, due to the adoption of coherent industrial policies, they were able to achieve a good industrial performance.
This study is based on descriptive statistics, in particular regarding international trade and macroeconomic investment.
Concerning the estimation carried out by the metal-mechanical companies, it was required to investigate mainly on each country’s annual manufacturing polls.
In addition, a database on prospective investment for the mentioned value chains was built for Argentina, Brazil and Mexico, employing the same guidelines.
Scope
This report looks into four Latin American countries: Argentina, Brazil, Colombia, and Mexico.
6. Alacero
_ _
01. General concepts
Investment figures
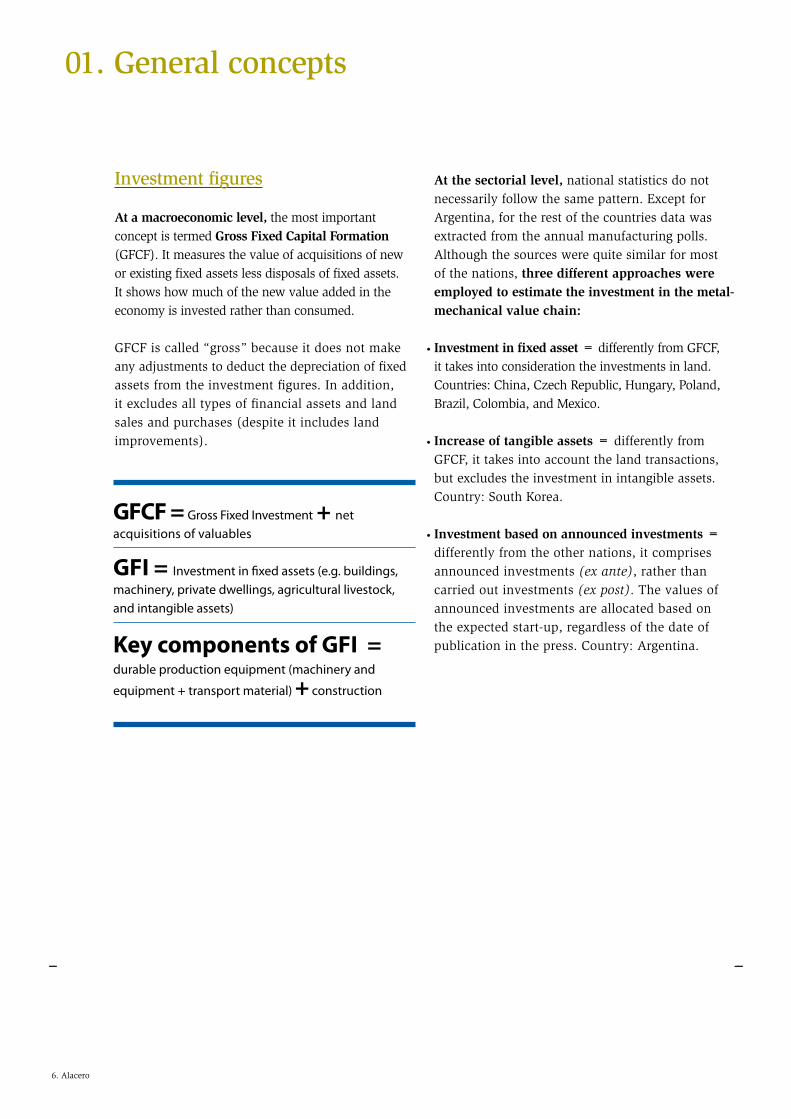
At a macroeconomic level, the most important concept is termed Gross Fixed Capital Formation (GFCF). It measures the value of acquisitions of new or existing fixed assets less disposals of fixed assets. It shows how much of the new value added in the economy is invested rather than consumed.
GFCF is called “gross” because it does not make any adjustments to deduct the depreciation of fixed assets from the investment figures. In addition, it excludes all types of financial assets and land sales and purchases (despite it includes land improvements).
•
•
•
At the sectorial level, national statistics do not necessarily follow the same pattern. Except for Argentina, for the rest of the countries data was extracted from the annual manufacturing polls. Although the sources were quite similar for most of the nations, three different approaches were employed to estimate the investment in the metal-mechanical value chain:
Investment in fixed asset = differently from GFCF, it takes into consideration the investments in land. Countries: China, Czech Republic, Hungary, Poland, Brazil, Colombia, and Mexico.
Increase of tangible assets = differently from GFCF, it takes into account the land transactions, but excludes the investment in intangible assets. Country: South Korea.
Investment based on announced investments = differently from the other nations, it comprises announced investments (ex ante), rather than carried out investments (ex post). The values of announced investments are allocated based on the expected start-up, regardless of the date of publication in the press. Country: Argentina.
GFCF = Gross Fixed Investment + net acquisitions of valuables
GFI = Investment in fixed assets (e.g. buildings, machinery, private dwellings, agricultural livestock, and intangible assets)
Key components of GFI =
durable production equipment (machinery and
equipment + transport material) + construction
Metal-mechanical value chain in Latin America Investment dynamics 7. Alacero
_ _
Metal-mechanical value chain
The metal-mechanical sector, as defined in this report, excludes steel products and their primary transformed products. Basically, the metal-mechanical chain is composed of four large industrial activities: >Automotive and other transport industries. >Infrastructure and construction sectors. >Machinery and equipment production sectors. >Durable consumer goods manufacturing sectors.
When foreign trade is considered, the metal-mechanical chain is defined within Chapters 82 to 90 of the Customs Nomenclature:82: tools and instruments, cutlery and silverware, in ordinary metal.83: diverse manufactures in ordinary metal.84: nuclear reactors, boilers, machines, mechanic appliances and artifacts. 85: machinery, electric materials and their parts.86: vehicles, materials and other parts for railways or similar.87: automobiles, tractors, cycles, other land vehicles, their parts and accessories.88: planes, special vehicles and their parts.89: vessels and other floating artifacts.90: optics, photography and cinematography instruments and appliances.

8. Alacero
_ _
•
•
•
•
•
•
•
•
02. Key conclusions
Macroeconomic investmentsin selected countries
From 1990 to 2012, the average of investment as a proportion of GDP reaches 41% in China and 32%in South Korea.Some Central European countries (Czech Republic, Poland and Hungary) invested around 25% of their GDPs. Meanwhile, selected Latin American countries (Argentina, Brazil, Colombia and México) have invested roughly 20% of their GDPs, due to various hurdles that discouraged investments.Despite a favorable economic cycle during which high prices of raw materials (esp. in Argentina, Brazil and Colombia) stimulated consumption, these Latin American countries displayed low investment levels. A possible consequence of this phenomenon could be the increase of the gap in technological update and production capacity in the region, two factors that could limit its economic growth during the years to come.Over the past decade, the quality of investment in Latin America improved as a result of an increased participation of machinery, equipment and transport equipment (at the expense of construction) in total investment. This improvement in the quality of investment can be considered structural, because of its consistency throughout the period in all the analyzed countries. Nonetheless, the low level of investment as a proportion of GDP remains as the main problem in these countries.On the other hand, Latin America is increasingly dependent on foreign machinery and equipment, which today is a major threat, especially when this is taken into consideration along with the low investment level carried out by domestic producers of capital goods. Nevertheless, this phenomenon could be interpreted as a growth opportunity for the industry through imports substitution, in the case good incentives and circumstances where put in place.
International tradeof metal-mechanical products
From 2003 to 2011, the global exports of metal-mechanical products have doubled to USD 6.4 trillion, which is equivalent to 35% of the world’s merchandise exports.Top 10 countries are responsible for 70% of the global exports of metal-mechanical products.China moved from a USD 15 billion deficit in 2003 to a USD 304 million surplus in 2012. During the same period, South Korea expanded its surplus by 230%.Selected Central European countries considerably improved their metal-mechanical products’ net exports. Jointly considered, the selected Latin American countries changed from zero net trade in 2003 to USD 67 billion net imports in 2012.Roughly 2/3 of the Latin American metal-mechanical imports are mechanical and electrical equipment, in line with the global pattern. Regarding the bilateral trade with China, the deficitin the selected Latin American countries jumped from USD 8 billion in 2003 to USD 71 billion in 2012, describing an always incremental trend.Approximately 90% of the Latin American metal-mechanical imports from China consist of mechanical and electrical equipment. Thus, trade flows coming from China are concentrated exactly in those sectors in which the Latin American metal-mechanical value chain faces the main hurdles.
•
•
•
•
•
•
Metal-mechanical value chain in Latin America Investment dynamics 9. Alacero
_ _
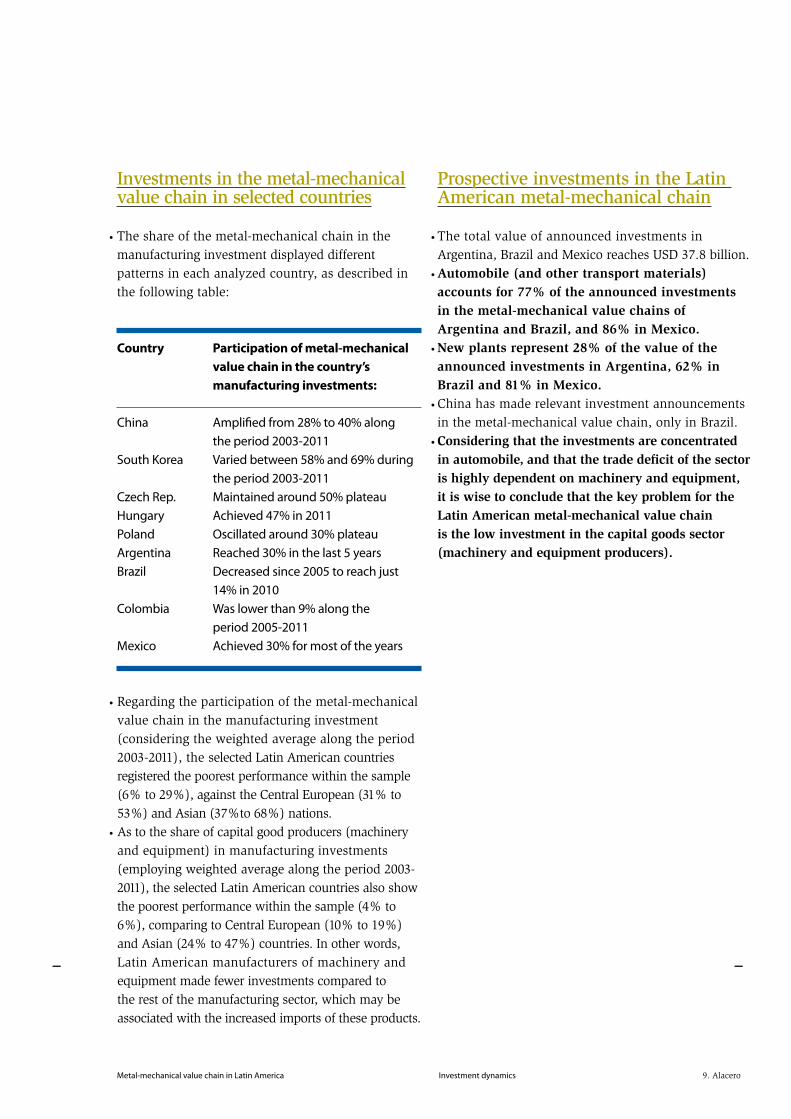
Country Participation of metal-mechanical value chain in the country’s manufacturing investments:
China Amplified from 28% to 40% along the period 2003-2011South Korea Varied between 58% and 69% during the period 2003-2011Czech Rep. Maintained around 50% plateauHungary Achieved 47% in 2011Poland Oscillated around 30% plateauArgentina Reached 30% in the last 5 yearsBrazil Decreased since 2005 to reach just 14% in 2010Colombia Was lower than 9% along the period 2005-2011Mexico Achieved 30% for most of the years
Investments in the metal-mechanicalvalue chain in selected countries
The share of the metal-mechanical chain in the manufacturing investment displayed different patterns in each analyzed country, as described in the following table:
Regarding the participation of the metal-mechanical value chain in the manufacturing investment (considering the weighted average along the period 2003-2011), the selected Latin American countries registered the poorest performance within the sample (6% to 29%), against the Central European (31% to 53%) and Asian (37%to 68%) nations.As to the share of capital good producers (machinery and equipment) in manufacturing investments (employing weighted average along the period 2003-2011), the selected Latin American countries also show the poorest performance within the sample (4% to 6%), comparing to Central European (10% to 19%) and Asian (24% to 47%) countries. In other words, Latin American manufacturers of machinery and equipment made fewer investments compared to the rest of the manufacturing sector, which may be associated with the increased imports of these products.
•
•
•
Prospective investments in the Latin American metal-mechanical chain
The total value of announced investments in Argentina, Brazil and Mexico reaches USD 37.8 billion.Automobile (and other transport materials) accounts for 77% of the announced investments in the metal-mechanical value chains of Argentina and Brazil, and 86% in Mexico.New plants represent 28% of the value of the announced investments in Argentina, 62% in Brazil and 81% in Mexico.China has made relevant investment announcements in the metal-mechanical value chain, only in Brazil.Considering that the investments are concentrated in automobile, and that the trade deficit of the sector is highly dependent on machinery and equipment, it is wise to conclude that the key problem for the Latin American metal-mechanical value chain is the low investment in the capital goods sector (machinery and equipment producers).
•
•
•
•
•

10. Alacero
_ _
03. Macroeconomic investments in selected countries
From 1990 to 2012, China and South Korea displayed high investment rates as a proportion of their GDPs, of 41% and 32% on average respectively. Meanwhile, some Central European countries invested around 25% of their GDPs during the same period, as it can be observed in Graph 1.
Selected Latin American nations, for their turn, have invested roughly 20% of their GDPs along the analyzed period (Graph 2). This is traditionally considered one of the most important macroeconomic hurdles faced by the region.
Source: World Bank
0 %
10 %
20 %
30 %
40 %
50 %
China Czech Rep.
Poland
GROSS CAPITAL FORMATION AS PROPORTION OF GDP,1990-2012 (%)
South KoreaHungary
1990
1991
1992
1993
1994
1995
1996
1997
1998
1999
20
0020
0120
0220
0320
0420
0520
0620
0720
0820
0920
1020
1120
12
GRAPH 1
Source: World Bank
5 %
0 %
10 %
15 %
20 %
25 %
30 %
Mexico Brazil Colombia
1990
1991
1992
1993
1994
1995
1996
1997
1998
1999
20
0020
0120
0220
0320
0420
0520
0620
0720
0820
0920
1020
1120
12
GROSS CAPITAL FORMATION AS PROPORTION OF GDP,1990-2012 (%)
Argentina
GRAPH 2
Metal-mechanical value chain in Latin America Investment dynamics 11. Alacero
_ _
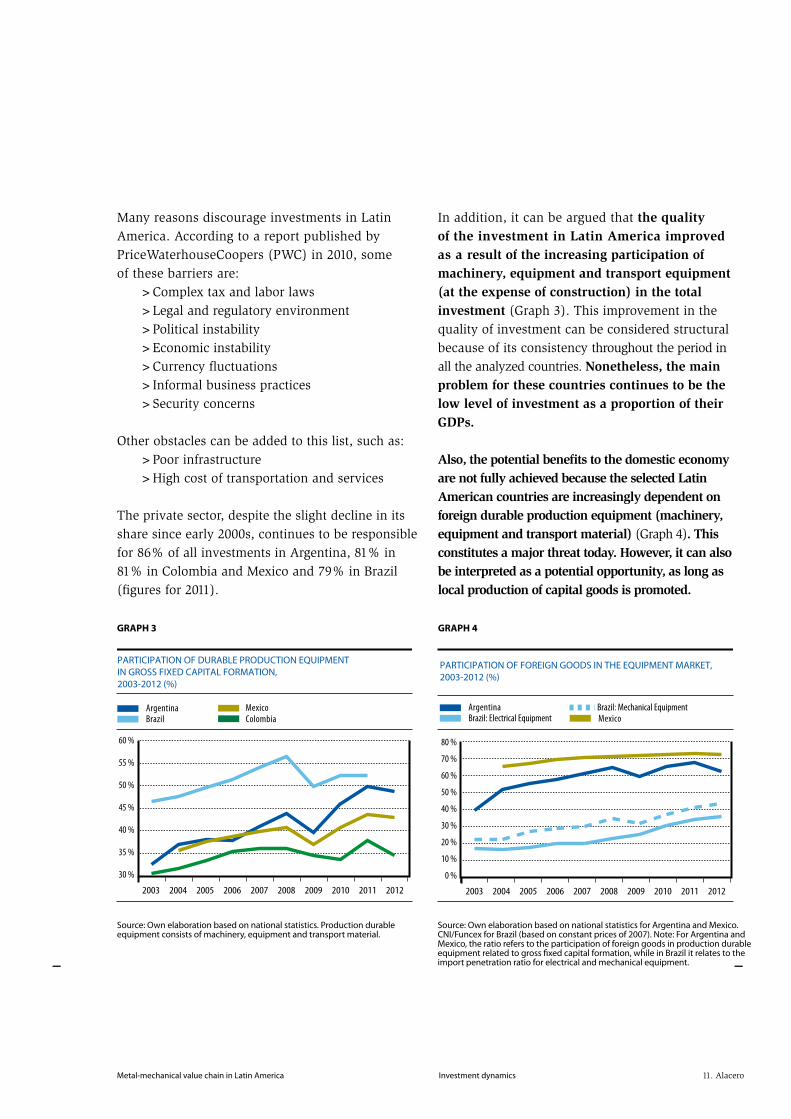
Source: Own elaboration based on national statistics. Production durableequipment consists of machinery, equipment and transport material.
35 %
30 %
40 %
45 %
50 %
55 %
60 %
2003 2004 2005 2006 2007 2008 2009 2010 2011 2012
PARTICIPATION OF DURABLE PRODUCTION EQUIPMENT IN GROSS FIXED CAPITAL FORMATION,2003-2012 (%)
ArgentinaBrazil
Mexico Colombia
GRAPH 3
Source: Own elaboration based on national statistics for Argentina and Mexico. CNI/Funcex for Brazil (based on constant prices of 2007). Note: For Argentina and Mexico, the ratio refers to the participation of foreign goods in production durable equipment related to gross fixed capital formation, while in Brazil it relates to the import penetration ratio for electrical and mechanical equipment.
0 %
20 %
40 %
80 %
50 %
60 %
70 %
30 %
10 %
2003 2004 2005 2006 2007 2008 2009 2010 2011 2012
ArgentinaBrazil: Electrical Equipment
PARTICIPATION OF FOREIGN GOODS IN THE EQUIPMENT MARKET,2003-2012 (%)
Brazil: Mechanical EquipmentMexico
GRAPH 4
Many reasons discourage investments in Latin America. According to a report published by PriceWaterhouseCoopers (PWC) in 2010, someof these barriers are: >Complex tax and labor laws >Legal and regulatory environment >Political instability >Economic instability >Currency fluctuations >Informal business practices >Security concerns
Other obstacles can be added to this list, such as: >Poor infrastructure >High cost of transportation and services
The private sector, despite the slight decline in its share since early 2000s, continues to be responsible for 86% of all investments in Argentina, 81% in 81% in Colombia and Mexico and 79% in Brazil (figures for 2011).
In addition, it can be argued that the qualityof the investment in Latin America improvedas a result of the increasing participation of machinery, equipment and transport equipment (at the expense of construction) in the total investment (Graph 3). This improvement in the quality of investment can be considered structural because of its consistency throughout the period in all the analyzed countries. Nonetheless, the main problem for these countries continues to be the low level of investment as a proportion of their GDPs.
Also, the potential benefits to the domestic economy are not fully achieved because the selected Latin American countries are increasingly dependent on foreign durable production equipment (machinery, equipment and transport material) (Graph 4). This constitutes a major threat today. However, it can alsobe interpreted as a potential opportunity, as long as local production of capital goods is promoted.

12. Alacero
_ _
04. International trade of metal-mechanical products
Global exports of metal-mechanical products doubled from USD 3.2 trillion in 2003 to USD 6.4 trillion in 2011, 35% of the world’s merchandise exports.
Along the period 2003-2011, the composition of world exports of metal-mechanical products remained quite stable. For instance, in 2011, the market shares were: >Mechanical equipment (Chapter 84): 31.6% >Electrical equipment (Chapter 85): 31.5% >Automobile and other transport equipment (Chapter 87): 19.8% >Others (Chapters 82, 83, 86, 88, 89 and 90): 17.1%
In 2011, the Top 10 were responsible for 70% of the global exports of metal-mechanical products. China had a market share of 15.5%. However, if this country was considered along with Hong Kong, its participation reached 19.8%. Mexico is the only Latin American country included in the Top 10, with a 3.1% share of the global exports.
Concerning metal-mechanical products, China moved from a USD 15 billion deficit in 2003 to a USD 304 million surplus in 2012, while South Korea expanded its surplus by 230%. In the meantime, the selected Central European countries improved considerably their metal-mechanical products’ net exports.
During the same period, jointly considered, the selected Latin American countries, changed from zero net trade in 2003 to USD 67 billion net importsin 2012 (Graph 5).
-20
-40
-50
-60
20
10
0
-10
-30
30
2003 2004 2005 2006 2007 2008 2009 2010 2011 2012
ArgentinaBrazil
NET EXPORTS OF METAL-MECHANICAL PRODUCTS, 2003-2012 (USD BILLION)
Colombia Mexico
Source: Own elaboration based on United Nations COMTRADE. 1 Billion = 1.000.000.000
GRAPH 5
Metal-mechanical value chain in Latin America Investment dynamics 13. Alacero
_ _
50 %
90 %
80 %
70 %
60 %
100 %
2003 2004 2005 2006 2007 2008 2009 2010 2011 2012
Global exports Latin American imports from ChinaLatin American imports Latin American imports from ROW
COMPOSITION OF LATIN AMERICAN METAL-MECHANICAL IMPORTS BY ORIGIN, 2003-2012 (%)
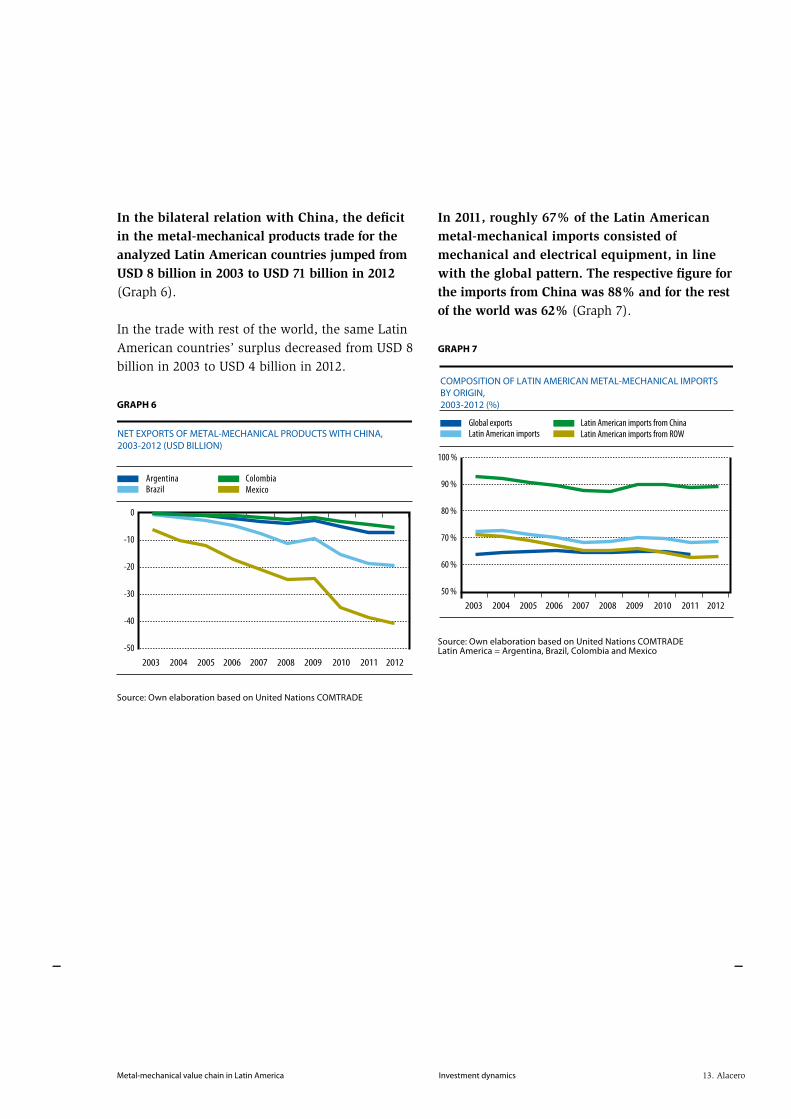
Source: Own elaboration based on United Nations COMTRADELatin America = Argentina, Brazil, Colombia and Mexico
GRAPH 7
-40
-50
-10
-20
-30
0
2003 2004 2005 2006 2007 2008 2009 2010 2011 2012
ArgentinaBrazil
NET EXPORTS OF METAL-MECHANICAL PRODUCTS WITH CHINA, 2003-2012 (USD BILLION)
Colombia Mexico
Source: Own elaboration based on United Nations COMTRADE
GRAPH 6
In the bilateral relation with China, the deficit in the metal-mechanical products trade for the analyzed Latin American countries jumped from USD 8 billion in 2003 to USD 71 billion in 2012 (Graph 6).
In the trade with rest of the world, the same Latin American countries’ surplus decreased from USD 8 billion in 2003 to USD 4 billion in 2012.
In 2011, roughly 67% of the Latin American metal-mechanical imports consisted of mechanical and electrical equipment, in line with the global pattern. The respective figure for the imports from China was 88% and for the rest of the world was 62% (Graph 7).
14. Alacero
_ _
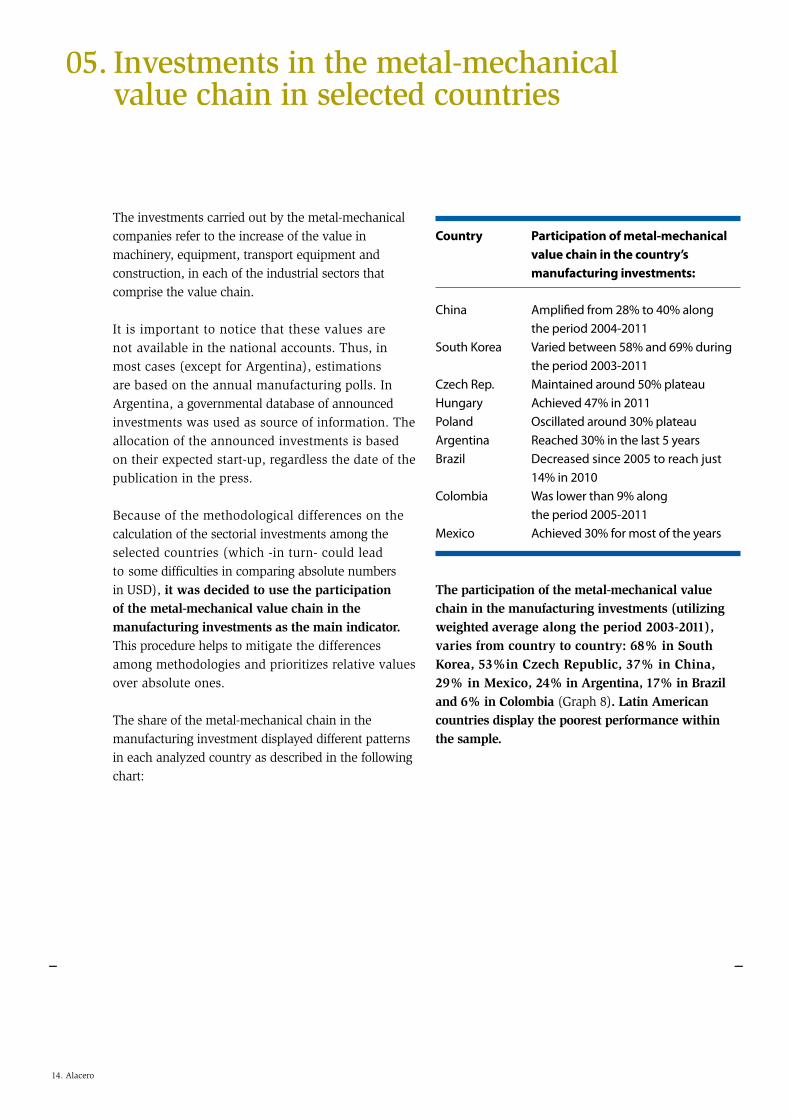
China Amplified from 28% to 40% along the period 2004-2011South Korea Varied between 58% and 69% during the period 2003-2011Czech Rep. Maintained around 50% plateauHungary Achieved 47% in 2011Poland Oscillated around 30% plateauArgentina Reached 30% in the last 5 yearsBrazil Decreased since 2005 to reach just 14% in 2010Colombia Was lower than 9% along the period 2005-2011Mexico Achieved 30% for most of the years
05. Investments in the metal-mechanical value chain in selected countries
The investments carried out by the metal-mechanical companies refer to the increase of the value in machinery, equipment, transport equipment and construction, in each of the industrial sectors that comprise the value chain.
It is important to notice that these values are not available in the national accounts. Thus, in most cases (except for Argentina), estimations are based on the annual manufacturing polls. In Argentina, a governmental database of announced investments was used as source of information. The allocation of the announced investments is based on their expected start-up, regardless the date of the publication in the press.
Because of the methodological differences on the calculation of the sectorial investments among the selected countries (which -in turn- could lead to some difficulties in comparing absolute numbers in USD), it was decided to use the participation of the metal-mechanical value chain in the manufacturing investments as the main indicator. This procedure helps to mitigate the differences among methodologies and prioritizes relative values over absolute ones.
The share of the metal-mechanical chain in the manufacturing investment displayed different patterns in each analyzed country as described in the following chart:
The participation of the metal-mechanical value chain in the manufacturing investments (utilizing weighted average along the period 2003-2011), varies from country to country: 68% in South Korea, 53%in Czech Republic, 37% in China, 29% in Mexico, 24% in Argentina, 17% in Brazil and 6% in Colombia (Graph 8). Latin American countries display the poorest performance within the sample.
Country Participation of metal-mechanical value chain in the country’s manufacturing investments:

Metal-mechanical value chain in Latin America Investment dynamics 15. Alacero
_ _
PARTICIPATION OF THE METAL-MECHANICAL CHAIN IN THE COUNTRY’SMANUFACTURING INVESTMENTS, 2003-2011 - WEIGHTED AVERAGE (%)
European and Asian selected countriesLatin American selected countries
0 %
70 %
60 %
50 %
40 %
30 %
20 %
10 %
80 %
SouthKorea
CzechRep.
Hungary China Poland Mexico Arg. ColombiaBrazil
68
53
46
37
3129
24
17
6
Source: Own elaboration based on national statistics. Different conceptsof investment were applied, due to the different available data.
GRAPH 8
Source: Own elaboration based on national statistics. Different concepts of investment were applied, due to the different available data. Capital goods = electrical equipment, mechanical equipment, computer and electronic.
PARTICIPATION OF THE METAL-MECHANICAL CHAIN IN THE COUNTRY’SMANUFACTURING INVESTMENTS, 2003-2011 - WEIGHTED AVERAGE (%)
0 %
70 %
50 %
30 %
20 %
80 %
SouthKorea
CzechRep.
Hungary China Poland Mexico Arg. ColombiaBrazil
European and Asian selected countriesLatin American selected countries
60 %
40 %
10 %
6
17
242931
37
46
53
68
GRAPH 9
Not only is it important to analyze the relative importance of the metal-mechanical value chain in the manufacturing investments, but also to investigate the composition of the investments within the metal-mechanical value chain.
In order to carry out this analysis, the investments were initially grouped into five main sectors: 1) mechanical equipment; 2) electrical equipment; 3) computers and electronics; 4) automobile and other transport equipment; and 5) other (mainly metal products and instruments). The next step
estimates the participation of the manufacturers of capital goods (machinery and equipment, electrical equipment, computers and electronics) in the investments of the metal-mechanical value chain.
The participation of capital goods producers in the metal-mechanical investments, employing weighted average along the period 2003-2011, varies from 69% in South Korea to 18% in Mexico (Graph 9).
Country Participation of metal-mechanical value chain in the country’s manufacturing investments:

16. Alacero
_ _
Source: Own elaboration based on national statistics. Different concepts of investment were applied, due to the different available data
0 %
50 %
40 %
30 %
20 %
10 %
Asian and European Selected CountriesLatin American Selected Countries
PARTICIPATION OF CAPITAL GOODS IN THE COUNTRY’S MANUFACTURINGINVESTMENTS, 2003-2011 – WEIGHTED AVERAGE (%)
47
24
1917
106 55 4
SouthKorea
China CzechRep.
Hungary Poland Brazil Mexico ColombiaArg.
GRAPH 10Argentina and Mexico showed the lowest participations within the sample. Compared to the other examined experiences, investments in the Latin American metal-mechanical value chain (except for Colombia) are proportionately more concentrated in the automotive sector.
The reduced share of this sector in Colombia can be explained as the first automobile assembly line started-up just recently, in 2013.
From the preceding paragraphs it can be inferred, that the Latin American metal-mechanical value chain displays the lowest participation in the manufacturing investments, when compared to other economies. Also, producers of capital goods have a small participation within the Latin American metal-mechanical value chain. Consequently, the share of the investments made by the producers of capital goods as part of the manufacturing investments is substantially lower in the region.
The participation of capital goods in the manufacturing investments (using weighted average along the period 2003-2011), varies from 47% in South Korea to 4% in Colombia (Graph 10). The selected Latin American countries describe the lowest proportion within the sample.
Metal-mechanical value chain in Latin America Investment dynamics 17. Alacero
_ _
06. Prospective investments in Latin American metal-mechanical value chain
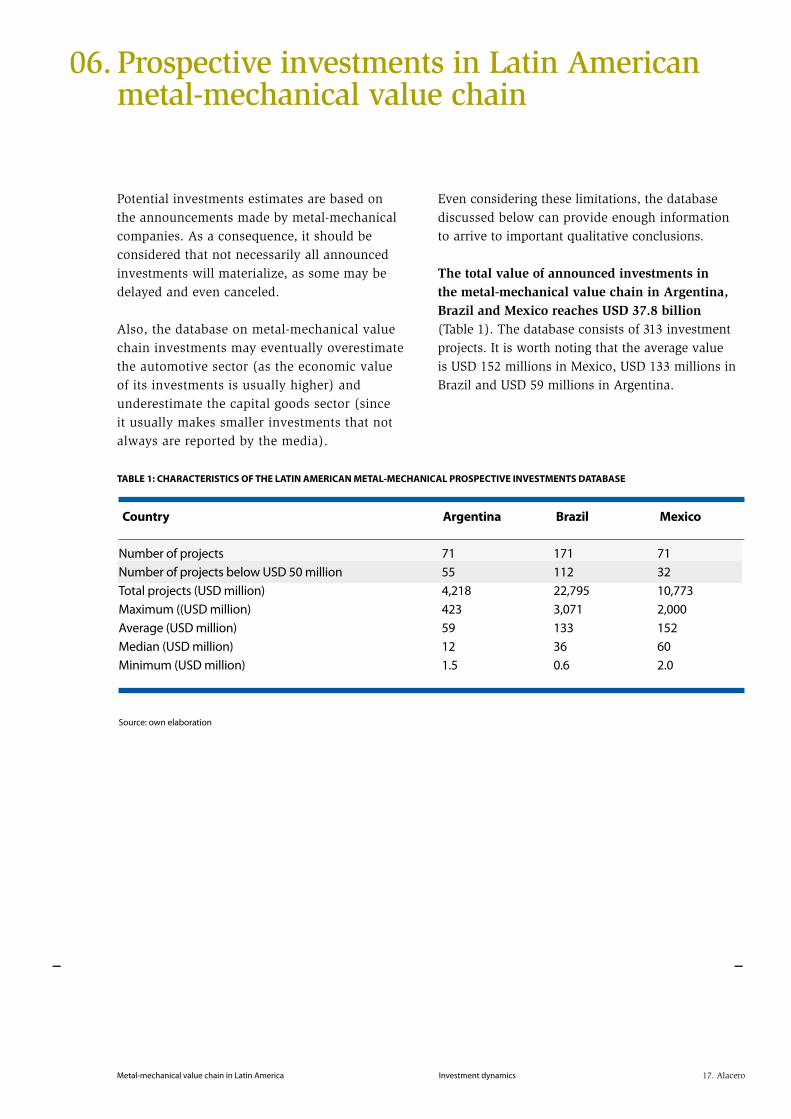
Potential investments estimates are based on the announcements made by metal-mechanical companies. As a consequence, it should be considered that not necessarily all announced investments will materialize, as some may be delayed and even canceled.
Also, the database on metal-mechanical value chain investments may eventually overestimate the automotive sector (as the economic value of its investments is usually higher) and underestimate the capital goods sector (since it usually makes smaller investments that not always are reported by the media).
Even considering these limitations, the database discussed below can provide enough information to arrive to important qualitative conclusions.
The total value of announced investments in the metal-mechanical value chain in Argentina, Brazil and Mexico reaches USD 37.8 billion (Table 1). The database consists of 313 investment projects. It is worth noting that the average value is USD 152 millions in Mexico, USD 133 millions in Brazil and USD 59 millions in Argentina.
TABLE 1: CHARACTERISTICS OF THE LATIN AMERICAN METAL-MECHANICAL PROSPECTIVE INVESTMENTS DATABASE
Country Argentina Brazil Mexico
Number of projects 71 171 71Number of projects below USD 50 million 55 112 32Total projects (USD million) 4,218 22,795 10,773Maximum ((USD million) 423 3,071 2,000Average (USD million) 59 133 152Median (USD million) 12 36 60Minimum (USD million) 1.5 0.6 2.0
Source: own elaboration
18. Alacero
_ _
Source: Own elaboration. Capital goods = electrical equipment, mechanical equipment, computer and electronic.
COMPOSITION OF THE VALUE OF ANNOUNCED INVESTMENTSIN THE METAL-MECHANICAL CHAIN BY SECTOR (%)
2
Argentina Brazil Mexico
Automotive OthersCapital Goods
10
0 %
80 %
60 %
40 %
20 %
100 %
212
5
9
13
77 77
86
GRAPH 11
Source: own elaboration
COMPOSITION OF THE VALUE OF ANNOUNCED INVESTMENTSIN THE METAL-MECHANICAL VALUE CHAIN BY TYPE (%)
Argentina Brazil Mexico
New plants OtherExpansion and modernization
28
711
0 %
80 %
60 %
40 %
20 %
100 %38
181
62
81
GRAPH 12
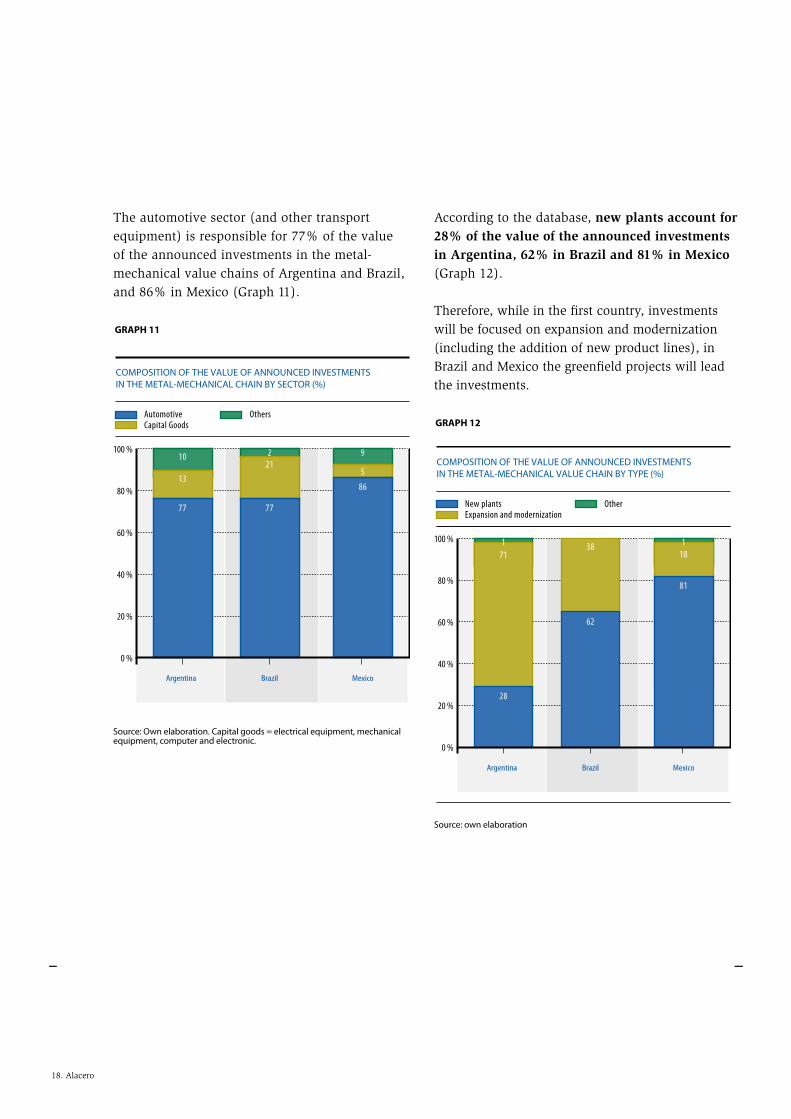
The automotive sector (and other transport equipment) is responsible for 77% of the value of the announced investments in the metal-mechanical value chains of Argentina and Brazil, and 86% in Mexico (Graph 11).
According to the database, new plants account for 28% of the value of the announced investments in Argentina, 62% in Brazil and 81% in Mexico (Graph 12).
Therefore, while in the first country, investments will be focused on expansion and modernization (including the addition of new product lines), in Brazil and Mexico the greenfield projects will lead the investments.
Metal-mechanical value chain in Latin America Investment dynamics 19. Alacero
_ _
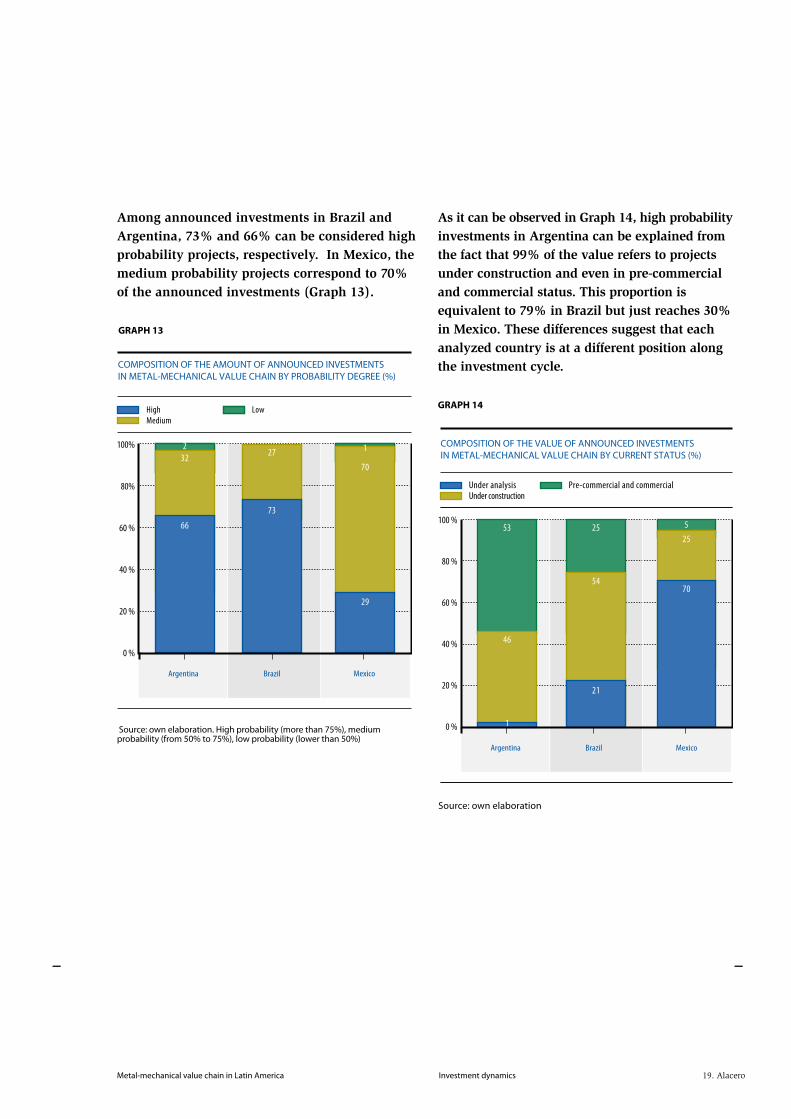
Among announced investments in Brazil and Argentina, 73% and 66% can be considered high probability projects, respectively. In Mexico, the medium probability projects correspond to 70% of the announced investments (Graph 13).
As it can be observed in Graph 14, high probability investments in Argentina can be explained from the fact that 99% of the value refers to projects under construction and even in pre-commercial and commercial status. This proportion is equivalent to 79% in Brazil but just reaches 30% in Mexico. These differences suggest that each analyzed country is at a different position along the investment cycle.
COMPOSITION OF THE VALUE OF ANNOUNCED INVESTMENTSIN METAL-MECHANICAL VALUE CHAIN BY CURRENT STATUS (%)
Under analysis Pre-commercial and commercialUnder construction
Argentina Brazil Mexico
1
46
53
0 %
80 %
60 %
40 %
20 %
100 %25
25
5
54
21
70
Source: own elaboration
GRAPH 14High LowMedium
COMPOSITION OF THE AMOUNT OF ANNOUNCED INVESTMENTS IN METAL-MECHANICAL VALUE CHAIN BY PROBABILITY DEGREE (%)
Argentina Brazil
66
322
0 %
80%
60 %
40 %
20 %
100%27
70
1
73
29
Source: own elaboration. High probability (more than 75%), mediumprobability (from 50% to 75%), low probability (lower than 50%)
GRAPH 13
Mexico

20. Alacero
_ _
0 %
100 %
80 %
60 %
40 %
20 %
Argentina Brazil Mexico
USAItaly
Germany
COMPOSITION OF THE VALUE OF ANNOUNCED INVESTMENTSIN METAL-MECHANICAL VALUE CHAIN BY COUNTRY OF ORIGIN (%)
FranceJapanChina
DomesticOthers
6 1311
18
9
14
22
20
614
718
11
8
23
12
446
18
20
Source: own elaboration
GRAPH 16The United States have a prominent role as origin of the announced investments in Argentina, Brazil and Mexico (Graph 15). Germany has more importance in Argentina and Mexico, while Japan is extremely relevant in Mexico and, to a lesser extent, in Argentina. China has made relevant investment announcements in the metal-mechanical value chain only in Brazil.
Metal-mechanical value chain in Latin America Investment dynamics 21. Alacero
_ _
07. Some recommendations of public policies to improve investment in the metal-mechanical value chain
At the macroeconomic level, to reach investment levels that enable sustainable development -based on an industrializing strategy-, in the selected Latin American countries investment as a proportion of GDP should move towards a range of 22%-25% in the next 10 years. Moreover, investments in machinery, equipment and transport equipment (which define the quality of investment) should increase their participation to 50% of the total investment.
In the case of the metal-mechanical value chain, a specific target cannot be determined since investment level depends on various factors, including macroeconomic and sectorial features. However, it could be suggested that the participation of the metal-mechanical value chain in the manufacturing investment should be around 30% for Argentina, Brazil and Mexico and above 10% for Colombia.
In addition, in order to reach a qualitative transformation, the composition of the investment in the Latin American metal-mechanical value chain should change to display a much higher participation of capital goods producers.
In Brazil, a share higher than 40% could be considered satisfactory, while in Argentina and Mexico it would be adequate to reach shares above 30%. On the other hand, Colombia should follow the opposite direction, as for this country, it would be better to improve the participation of the automotive industry within the metal-mechanical investment.
Possible Promotion Policies
ArgentinaReduce income tax rates when profits are reinvested locally.Establish a system of accelerated depreciation and anticipated refund of Value Added Tax (tax credit).Establish specific pre- and post-financing lines for metal-mechanical exports.Create special credit lines for metallurgical companies, to encourage new product development.Guarantee to the purchase of products at the local market a similar treatment as that given to temporary imports.Expand the budget and specialize the supply of instruments and funding programs that promote in-company innovation projects.Approve the proposed amendments to Law 25.551 “Buy Argentine Work”.Continue and strengthen existing programs for metal-mechanical SMEs.
•
•
•
•
•
•
•
•
22. Alacero
_ _
Brazil
Create programs for the sector or for the production chains that co-ordinate incentives, financing and regulation, following the example of “Innovate-Auto”.Keep tax exemptions for investments.Grant an accelerated depreciation regime for investments.Include and improve the mechanisms that measure local content of those goods that are subject of margins of preference.Include the margin of preference in the infrastructure concessions programs.Maintain strategic programs, such as the Investment Support Program (PSI)
Mexico
Implement a process of re-industrialization and strengthen the domestic market, developing the value chains.Support in-company innovation in production and business management.Encourage local competitiveness quickly and efficiently, by addressing unfair trade practices with accurate criteria.Ensure that all governmental purchases contain at least 50% national content, except for those cases when local products cannot meet the requirements.Implement a comprehensive reform that minimizes corporate tax burden, such as the unification of income tax and corporate flat tax (ISR and IETU).Transform the energy sector into an engine for economic growth to reduce the social costs of producing, processing, distributing and delivering power, either for household consumption or as production input.
•
•
•
•
•
•
•
•
•
•
•
•


Latin American Steel AssociationBenjamín 2944 - 5º floor - Las Condes Santiago, ChilePhone (56-2) 2233-0545 Fax (56-2) [email protected] @RedAlacero Alacero
V. 22.11.13