metal composition of soil, sediments, and urban dust and dirt samples from the menomonee river...
TRANSCRIPT
M E T A L C O M P O S I T I O N OF S O I L , S E D I M E N T S , A N D U R B A N
D U S T A N D D I R T S A M P L E S F R O M T H E M E N O M O N E E R I V E R
W A T E R S H E D , W I S C O N S I N , U . S . A .
A. DONG
Department of Land, Air and Water, University of California, Davis, CA 95616, U.S.A.
G. CHESTERS and G. V. SIMSIMAN
Water Resources Center and Department of Soil Science, University of Wisconsin, Madison, WI 53706, U.S.A.
(Received November 25, 1982; revised September 23, 1983)
Abstract. The A1, Cd, Cr, Cu, Fe, Mn, Ni, Pb, and Zn contents of the sand, silt, and clay fractions were determined for soils, urban street dust and bottom- and suspended-sediments sampled in the Menomonee River watershed, Wisconsin. The samples were dispersed by ultrasound prior to fractionation. The ultrasound dispersion avoids chemical contamination or alteration resulting from use of chemical disper- sants and insures the dispersion of aggregates present in mechanically-sieved samples.
Chemical analyses of fractionated samples were more precise than analyses of unfractionated samples in identifying areas in the watershed receiving pollutant inputs. Higher levels of Cr, Cu, Fe, and Ni were found in the coarser particles than in the finer particles of urban street dust samples. The Cd, Pb and Zn contents of some bottom and suspended sediments were greater than in the soils of the watershed. Contents of these metals were correlated significantly with each other in the clay-sized fraction of sediments but not in soils. The metal contents of sediments were largely controlled by vehicular emission.
1. Introduction
Sediments• are potential carriers of nutrients, organic compounds and metals from a
watershed to the receiving body of water. It has been estimated that 40 to 80~o of the
total Pb loading to the Great Lakes is associated with sediments (PLUARG, 1978).
Pollutants in the sediments often are more concentrated in the fine fraction than in the
coarse fraction due to the high surface area of small particles. Phosphorus levels in
bottom and suspended sediments were found to be higher in the clay fraction than in
the silt or sand fractions (Dong et al., 1983b). The fine textured materials also tend to
stay in suspension for a longer time, while coarse materials tend to sediment quickly.
The longer the time particles stay in aqueous suspension the greater the degree of
adsorption and/or desorption of pollutants, and the more extensive the biological
transformations of degradable components. However, the importance of the clay
fractions of sediments as carriers of pollutants is overlooked when total unfractionated
samples are used for chemical analyses (USEPA, 1977; Pilotte et aI., 1978; Presley
et al., 1980). Because of the higher sorptive capacity of the clay fraction, the pollutant
content of unfractionated samples varies with clay content, Lack of uniformity in the
chemical composition of unfractionated samples is avoided by analyzing each particle-
size fraction individually. Special consideration is given to the clay fraction due to its large surface area and ease of transportation in aqueous systems.
Water, Air, and Soil Pollution 22 (1984) 257-275. 0049-6979/84/0223-0257502.85. @ 1984 by D. Reidel Publishing Company.
258 A. D O N G ET AL.
The commonly-used fractionation procedures interfere with the chemical analysis of samples. The hydrogen peroxide/sodium hexametaphosphate ('calgon') procedure for dispersing samples, destroys the organic matter (Wail et al., 1978) and desorbs chemical constituents associated with the organic fraction. The procedure of dry sieving (Pitt and Amy, 1973; Pitt, 1979) does not distinguish between discrete and tightly-bound aggre- gates of particles. Using ultrasound dispersion, it is possible to obtain totally dispersed particles while retaining their associated organic matter and metals (Dong et aL, 1983a).
The objective of the study is to analyze and compare the metal compositions of fractionated samples from urban and rural areas of the Menomonee River watershed. The metal composition of each size fraction - sand, silt and clay - of soils, urban street dust, bottom- and suspended-sediments was determined following ultrasound dis- persion and fractionation. Attempts were made to identify sources along the river of high metal input based on the metallic composition of the clay fractions of sediments.
The 35 000 ha Menomonee River watershed, located in the southeastern corner of Wisconsin, U.S.A., discharges into Lake Michigan at the Milwaukee harbor and carries an average sediment loading of about 10 000 tonne yr- 1. The lower portion of the watershed which includes part of the City of Milwaukee, is a commercial-industrial complex with some residential land use. Primarily residential areas with a few light industries are found in the center of the watershed. The upper portion is mostly agricultural with scattered areas that are rapidly changing from rural to urban residential (Simsiman et al., 1979). Thus the Menomonee River watershed provides a situation where rural and urban sources of sediments and associated pollutants could be
evaluated.
2. Materials and Methods
2.1. SAMPLING
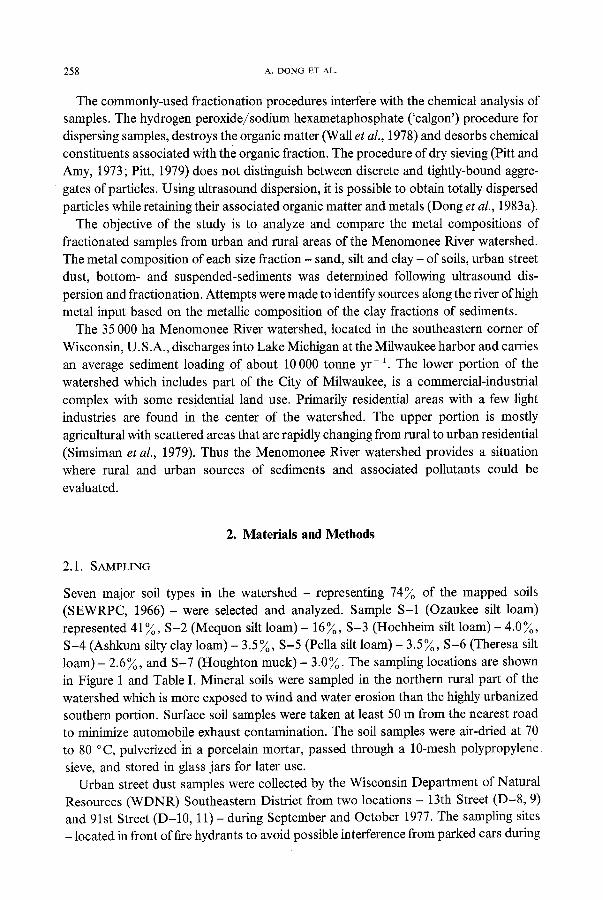
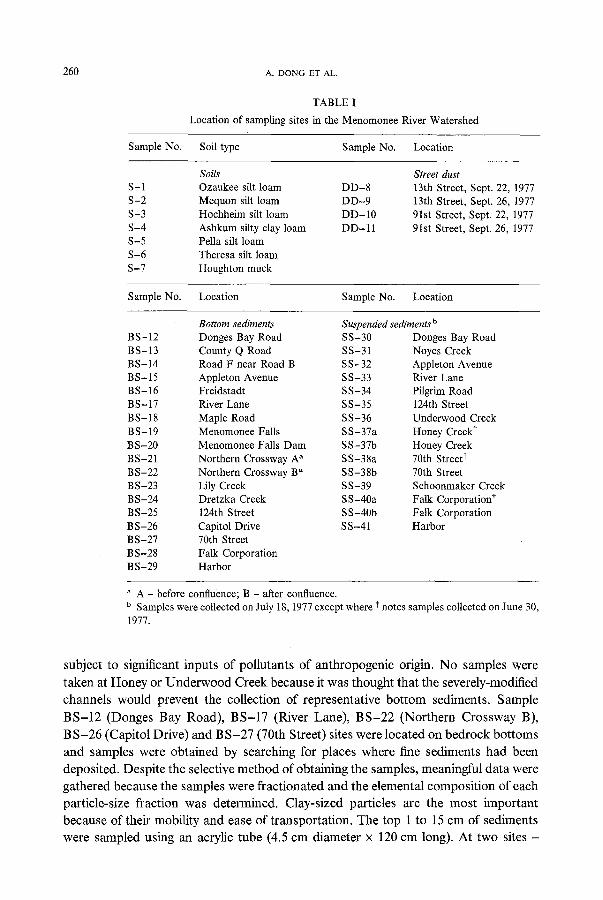
Seven major soil types in the watershed - representing 74~/o of the mapped soils (SEWRPC, 1966) - were selected and analyzed. Sample S-1 (Ozaukee silt loam) represented 41 To, S-2 (Mequon silt loam) - 16~o, S-3 (Hochheim silt loam) - 4.0~o, S-4 (Ashkum silty clay loam) - 3.5%, S-5 (Pella silt loam) - 3.5%, S-6 (Theresa silt loam) - 2.6~o, and S-7 (Houghton muck) - 3.0~o. The sampling locations are shown in Figure 1 and Table I. Mineral soils were sampled in the northern rural part of the watershed which is more exposed to wind and water erosion than the highly urbanized southern portion. Surface soil samples were taken at least 50 m from the nearest road to minimize automobile exhaust contamination. The soil samples were air-dried at 70 to 80 ° C, pulverized in a porcelain mortar, passed through a 10-mesh polypropylene sieve, and stored in glass jars for later use.
Urban street dust samples were collected by the Wisconsin Department of Natural Resources (WDNR) Southeastern District from two locations - 13th Street (D-8, 9) and 91st Street (D-10, 11)- during September and October 1977. The sampling sites - located in front of fire hydrants to avoid possible interference from parked cars during
SS 33
IIS5
6 ERMANTOWN
s6,,/
BS 22 "~ ~k. A
BS23
METAL COMPOSITION OF SOIL
$ 2 • #
• S 4 B / sl ~ l ' (
~ I p ss 30 BS 1 2 , O ~ 89"00' W 88"00'W
• SOILS (S)
• BOTTOM SEDIMENTS (BS)
SANITARY TREATMENT PLANT
. OUTFALLS
259
SS32
BROOKFIELD
l Dousman Ditch
0 1 2 INm~SSSS~]
Mi 0 2 4
Km
WAUWATOSA
SS36
,...,,.,..".,,,.~',~MI LWAUKEE BS29 SS41 ([
BS 28
SS37
HARBOR
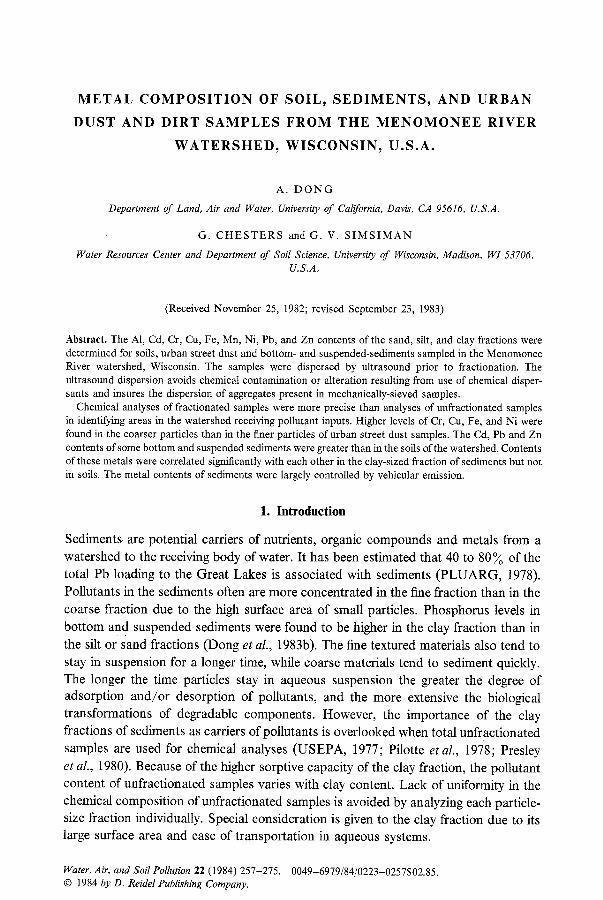
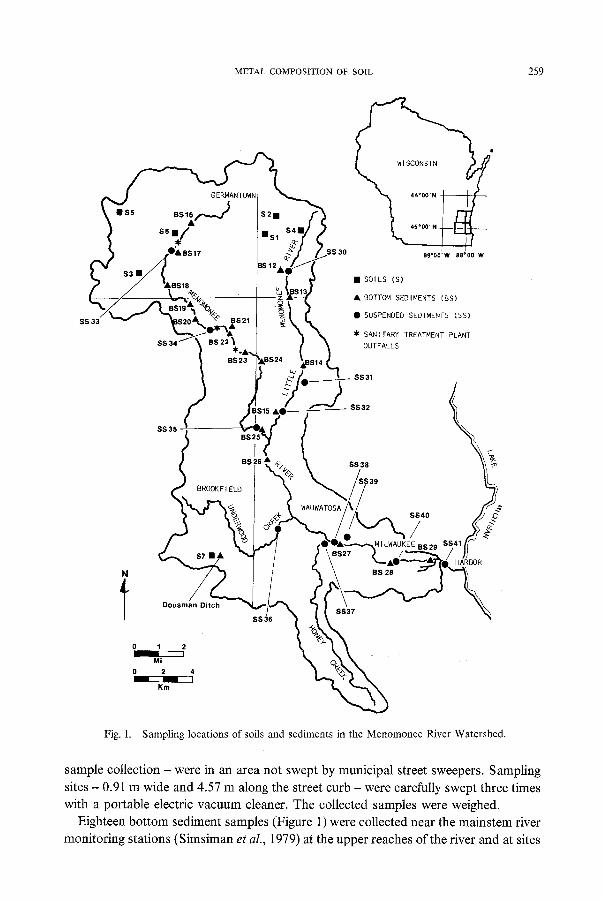
Fig. 1. Sampling locations of soils and sediments in the Menomonee River Watershed.
sample collection - were in an area not swept by municipal street sweepers. Sampling
sites - 0.91 m wide and 4.57 m along the street curb - were carefully swept three times
with a portable electric vacuum cleaner. The collected samples were weighed.
Eighteen bot tom sediment samples (Figure 1) were collected near the mainstem river
monitoring stations (Simsiman et al., 1979) at the upper reaches of the river and at sites
260 A. DONG ET AL.
TABLE I
Location of sampling sites in the Menomonee River Watershed
Sample No. Soil type Sample No. Location
Soils S-1 Ozaukee silt loam S-2 Mequon silt loam S-3 Hochheim silt loam S-4 Ashkum silty clay loam S-5 Pella silt loam S-6 Theresa silt loam S-7 Houghton muck
Street dust DD-8 13th Street, Sept. 22, 1977 DD-9 13th Street, Sept. 26, 1977 DD-10 91st Street, Sept. 22, 1977 DD-11 91st Street, Sept. 26, 1977
Sample No. Location Sample No. Location
Bottom sediments Suspended sediments b BS-12 Donges Bay Road SS-30 Donges Bay Road BS-13 County Q Road SS-31 Noyes Creek BS-14 Road F near Road B SS-32 Appleton Avenue BS-15 Appleton Avenue SS-33 River Lane BS- 16 Freidstadt SS-34 Pilgrim Road BS-17 River Lane SS-35 124th Street B S- 18 Maple Road S S-36 Underwood Creek BS-19 Menomonee Falls SS-37a Honey Creek* BS-20 Menomonee Falls Dam SS-37b Honey Creek BS-21 Northern Crossway A" SS-38a 70th Street* BS-22 Northern Crossway B ~ SS-38b 70th Street BS-23 Lily Creek SS-39 Schoonmaker Creek BS-24 Dretzka Creek SS-40a Falk Corporation* BS-25 124th Street SS-40b Falk Corporation BS-26 Capitol Drive SS-41 Harbor BS-27 70th Street BS-28 Falk Corporation B S-29 Harbor
" A - before confluence; B - aRer confluence. b Samples were collected on July 18,1977 except where * notes samples collected on June 30, 1977.
subject to significant inputs of pol lutants of anthropogenic origin. N o samples were
taken at Honey or U n d e r w o o d Creek because it was thought that the severely-modified
channels would prevent the collection of representat ive bo t tom sediments. Sample
B S - 1 2 (Donges Bay Road) , B S - 1 7 (River Lane), B S - 2 2 (Nor thern Crossway B),
B S - 2 6 (Capitol Drive) and B S - 2 7 (70th Street) sites were loca ted on bedrock bot toms
and samples were obta ined by searching for places where fine sediments had been
deposi ted. Despi te the selective method of obtaining the samples, meaningful da t a were
gathered because the samples were f ract ionated and the elemental composi t ion of each
part icle-size fraction was determined. Clay-sized part icles are the mos t impor tan t
because of their mobil i ty and ease of t ranspor ta t ion. The top 1 to 15 cm of sediments
were sampled using an acrylic tube (4.5 cm diameter x 120 cm long). At two sites -
METAL COMPOSITION OF SOIL 261
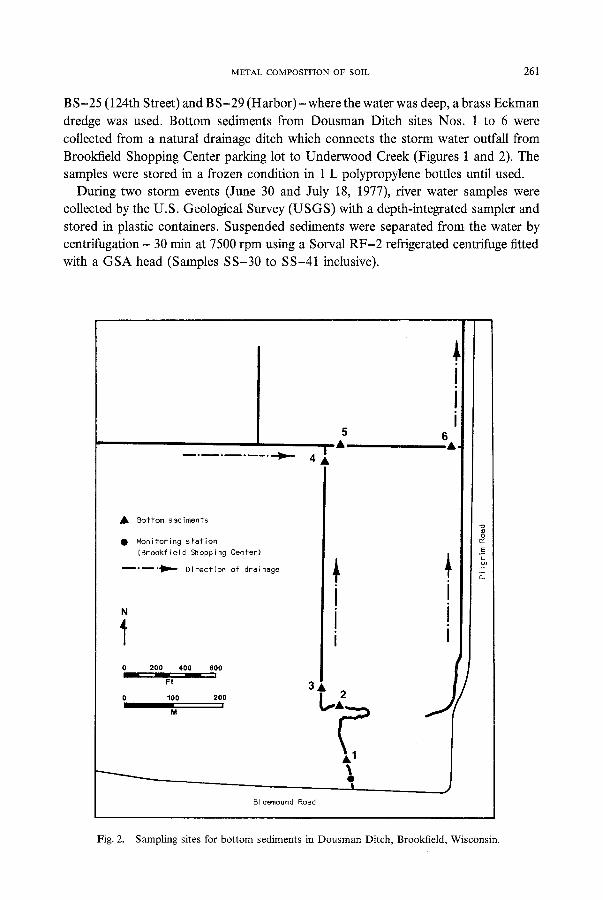
B S-25 (124th Street) and B S-29 (Harbor) - where the water was deep, a brass Eckman dredge was used. Bottom sediments from Dousman Ditch sites Nos. 1 to 6 were collected from a natural drainage ditch which connects the storm water outfall from Brookfield Shopping Center parking lot to Underwood Creek (Figures 1 and 2). The samples were stored in a frozen condition in 1 L polypropylene bottles until used.
During two storm events (June 30 and July 18, 1977), river water samples were collected by the U.S. Geological Survey (USGS) with a depth-integrated sampler and stored in plastic containers. Suspended sediments were separated from the water by centrifugation - 30 min at 7500 rpm using a Sorval RF-2 refrigerated centrifuge fitted with a GSA head (Samples SS-30 to SS-41 inclusive).
• Botto~ sediments
• Monitoring station (Brookfield Shopping Center)
.... "liD" Direction of drainage
0 200 400 600
Ft
0 100 200 w
M
5
I • 4 •
I i I
3,11,
Bluemound Road
6
O~
O-
Fig. 2. Sampling sites for bottom sediments in Dousman Ditch, Brookfield, Wisconsin.
262 A. DONG ET AL.
2.2. F R A C T I O N A T I O N AND ANALYSIS
Samples (2 to 12 g) were placed in glass beakers (30 mL) and soaked overnight prior to ultrasound dispersion - 15 min at 100 to 125 W using a Braun model 1510 ultrasonic generator with a standard probe. Dispersion tests (length of ultrasonic treatment needed to achieve a plateau of particle-size distribution) indicate that 15 min is sufficient time to disperse the samples. Although Genrich and Bremner (1972) indicated that overnight soaking was unnecessary, this step was included as a precautionary measure against incomplete dispersion. The dispersed samples were fractionated by centrifugation and gravity settling. Particles-size fractions chosen were: sand, 2000 to 62 rtm; silt, 62 to 4 gm; and clay, < 4 gm, as used by the USGS. Each fraction was oven-dried at 110 ° C, weighed, and digested with HNO3 and HC1 (USEPA, 1976).
The contents of Cd, Cr, Cu, Ni, and Pb'were determined by tameless atomic absorption spectroscopy (AAS) using a Perkin Elmer model 603 AA spectrophotometer with deuterium arc background correction. Analysis ofAl, Fe, Mn, and Zn in the digests required dilution which served to diminish salt interference. The elements were deter- mined by flame AAS using a Perkin Elmer 306 AA spectrophotometer.
Metal content of soil, urban street dust and suspended sediment samples was analyzed in duplicate; bottom sediment samples were analyzed in triplicate.
3. Results
3.1. M E T A L S IN SOILS
Metal compositions of each particle-size fraction - sand, silt, and clay - of seven major soil types of the Menomonee River watershed were analyzed to provide an estimate of metal contents in soils subject to erosion in the Menomonee River watershed (Table II). Contents of A1, Cd, Cr, Cu, Fe, Mn, Ni, Pb, and Zn in the six mineral soil samples were greater in the clay than silt fractions; Cd, Cr, Cu, Pb, and Zn contents were greater in the silt than sand fractions. The metal contents of the clay-sized fraction of the organic soil (44% organic C) were considerably lower (2 to 20 times) than the values found for the mineral soils. Moreover, the metal contents of the three particle size fractions from the organic soil were almost equal, indicating that the organic constituents in each particle-size fraction consisted largely of plant material in various stages of decompo- sition. The soil was developed in a boggy area and represents a sink for sediment and pollutants rather than a source. This soil was included for completeness sake but was not included in the data interpretation because of its low erosion potential.
The metal composition of the six mineral soils was used for comparison with urban street dust, bottom- and suspended-sediment samples. Urban dust and sediments with higher metal levels in their clay fractions than those in soils were suspected of receiving anthropogenic pollutant inputs.
METAL COMPOSITION OF SOIL 263
TABLE II
Metal contents of each particle-size fraction of soils from the Menomonee River Watershed
Sample Size Metal (pg g - l)
No. distribu- tion (~o) Pb Cd Cu Zn Ni Cr A1 Fe Mn
S-1 Sand-24 ND ND a 2.3 12 7.2 11 2 460 4 280 215 Silt-57 9.5 0.16 17 32 9.1 17 5 970 10 000 647 Clay-29 58 0.78 90 110 49 75 62 400 53 100 2610
S - 2 Sand-35 4.7 ND 4.0 12 8.9 9.4 866 10 100 191 Silt-36 11 0.25 15 29 15 14 7 860 18 900 984 Clay-29 39 0.73 82 64 48 63 50 700 56 600 1160
S-3 Sand-29 5.5 ND 1.8 6.9 4.2 7.0 2 450 7 520 111 Silt-44 9.8 0.11 7.3 41 7.7 15 6 160 9 550 575 Clay-27 56 0.35 41 192 50 75 85 400 61 000 2270
S -4 Sand-21 9.0 ND 2.0 9.8 2.3 3.7 5 500 2 770 47 Silt-44 14 0.53 27 71 7.8 15 6 870 6 180 149 Clay-35 36 1.24 106 154 35 71 61 200 40 600 238
S-5 Sand-14 9.8 ND 1.9 10 3.2 4.2 6 580 5 210 41 Silt-49 10 0.23 8.2 40 5.0 13 5 680 6 270 323 Clay-37 39 0.81 44 204 30 96 65 500 57 100 1300
S -6 Sand-22 ND ND 2.1 10 2.1 14 2 200 10 300 100 Silt-62 6.0 0.12 4.8 20 6.0 13 6 380 8 750 477 Clay-16 55 0.44 36 345 45 69 79 200 60 600 1640
S -7 Sand-1 ND ND ND ND ND ND 3 590 10 370 104 Silt-38 12.3 ND 17 34 12 8.6 4 390 8 180 77 Clay-61 13 ND 15 31 12 11 4 500 8 960 130
Pooled Sand 0.66 0.37 1.2 0.64 1.4 761 711 7.7 SD b Silt 1.i 0.10 2.7 23 2.0 2.6 783 1 240 77
Clay 1.9 0.08 2.2 88 1.0 15 4 498 4 660 104
a ND is not detected. b Pooled standard deviation.
3.2. METALS IN URBAN STREET DUST
Urban street dust samples (D-8 to D-11) (Table III) were analyzed for metals in sand, silt, and clay fractions to provide an estimate of metal pollution of storm water runoff. Aluminum and Mn contents of D - 8 to 11 were less than those of the six mineral soils, probably because the origin of the samples was not surface soil. Iron contents of the three particle-size fractions were similar in range, suggesting that Fe is derived from steel with varying degrees of corrosion and pulverization. The Cd, Cr, Cu, Ni, Pb, and Zn contents of the three fractions were greater than those found in the comparable fractions of the six mineral soils.
For samples D- 8 and 9, A1, Fe, Mn, and Pb contents were lower while Zn and Cd were higher than in D-10 and 11. Samples D - 8 and 9 were taken in the Industrial Valley of Milwaukee and receive appreciable atmospheric fallout. Samples D-10 and 11 were from the central portion of the watershed in a mixed commercial-residential area.
264 h. DONG ET AL.
TABLE III
Metal contents of each particle-size fraction of urban street dust from the Menomonee River Watershed
Sample Size Metal(#g g-a) No. distribu-
tion (~o) Pb Cd Cu Zn Ni Cr A1 Fe Mn
D-8 Sand-86 142 0.95 164 396 37 33 3 190 46 000 283 Silt-9 370 6.2 166 810 57 43 5 560 34 300 332 Clay-5 120 19 319 2590 75 87 15 400 43 900 614
D-9 Sand-90 245 2.0 275 495 66 41 2 900 63 300 348 Silt-6 810 11 268 1070 64 53 6 170 47 400 437 Clay-4 2320 29 433 2890 73 108 16 800 55 500 764
D-10 Sand-86 540 1.3 270 637 49 53 1 520 69 700 439 Silt-8 1650 12 357 1070 69 43 8 600 49 900 770 Clay-6 2890 15 356 1720 76 72 32 160 65 500 1090
D-11 Sand-82 780 2.7 241 910 67 27 1 640 57 100 554 Silt-12 2570 17 478 1320 80 44 8 550 67 800 790 Clay-5 5080 22 376 1800 82 80 28 000 77 900 1310
Pooled Sand 62 0.38 128 130 13 6.8 809 1 490 46 SD Silt 47 0.61 24 106 7 5.4 2 400 5 570 68
Clay 166 1.3 34 248 5 11 4 480 5 390 284
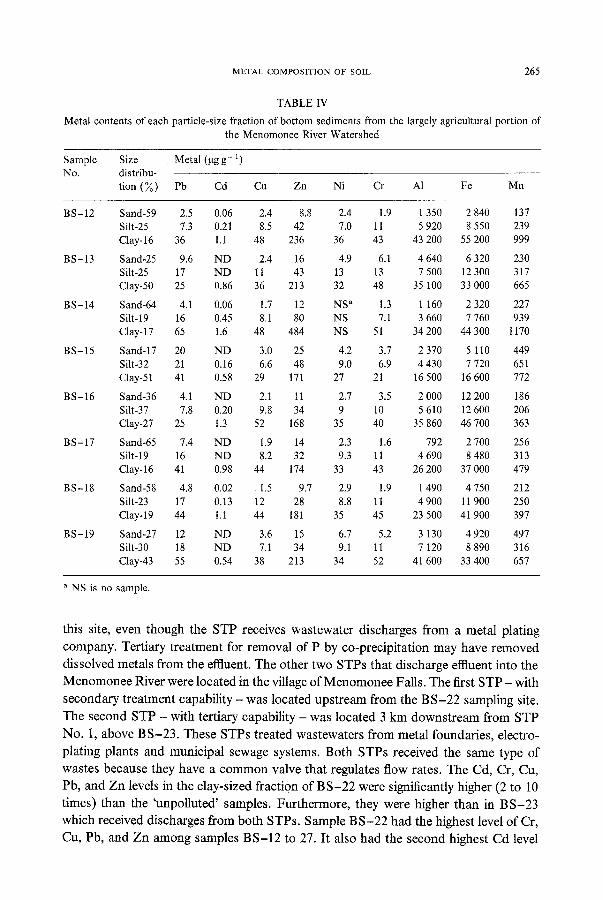
3.3. METALS IN BOTTOM SEDIMENTS
Metal compositions for each size fraction of the bottom sediments are given in Tables IV and V. The Cd, Cr, Cu, Ni, Pb, and Zn contents of the clay fractions of the bottom sediments from the predominantly agricultural area (Table IV) (BS-12 to 19) were found to be less than samples from the remaining portion of the river (Table V) (BS-21 to 29), and less than or equal to the six mineral soils. Except for BS-14, the samples from agricultural areas, were largely 'unpolluted' and were used as a basis for compa- rison with other bottom sediment samples. Metal contents of the clay fractions of the 'unpolluted' bottom sediments were in ranges similar to each other even though the sampling sites extended a distance of 24 km along the Little and Upper Menomonee River (Figure 1). Sample BS-14 had higher Cd, Pb, and Zn levels in the clay fraction than the 'unpolluted' samples, but not higher than the levels in the six major soils. Sample, B S-21, located in the Northern Crossway Creek before its confluence with the Upper Menomonee River (Figure 1), also showed elevated levels of Pb and Zn. Both BS-14 and 21 were sampled near well-travelled roads. The increase in Pb presumably was from use of leaded gasoline, and Zn from vulcanized rubber tires and oil lubricants (Sylvester and Dewalle, 1972; Shaheen, 1975).
Sample BS-17 was from below the Germantown tertiary Sanitary Treatment Plant (STP) outfall and adjacent to a golf course with a sediment trap. No measurable increases in Cd, Cr, Cu, Pb, Ni, and Zn levels occurred in the bottom sediments from
Metal contents of each
METAL COMPOSITION OF SOIL 265
TABLE IV
particle-size fraction of bottom sediments from the largely agricultural portion of the Menomonee River Watershed
Sample Size Metal (gg g - 1) No. distribu-
tion (%) Pb Cd Cu Zn Ni Cr A1 Fe Mn
BS-12 Sand-59 2.5 0.06 2.4 8.8 2.4 1.9 1 350 2 840 137 Silt-25 7.3 0.21 8.5 42 7.0 11 5 920 8 550 239 Clay-16 36 1.1 48 236 36 43 43 200 55 200 999
BS-13 Sand-25 9.6 ND 2.4 16 4.9 6.1 4 640 6 320 230 Silt-25 17 ND 11 43 13 13 7 500 12 300 317 Clay-50 25 0.86 36 213 32 48 35 100 33 000 665
BS-14 Sand-64 4.1 0.06 1.7 12 NS a 1.3 1 160 2 320 227 Silt-19 16 0.45 8.1 80 NS 7.1 3 660 7 760 939 Clay-17 65 1.6 48 484 NS 51 34 200 44 300 1170
BS-15 Sand-17 20 ND 3.0 25 4,2 3.7 2 370 5 1 I0 449 Silt-32 21 0.16 6.6 48 9.0 6.9 4 430 7 720 651 Clay-51 41 0.58 29 171 27 21 16 500 16 600 772
BS-16 Sand-36 4.1 ND 2.1 11 2.7 3.5 2 000 12 200 186 Silt-37 7.8 0.20 9.8 34 9 10 5 610 12 600 206 Clay-27 25 1.3 52 168 35 40 35 860 46 700 363
BS-17 Sand-65 7.4 ND 1.9 14 2.3 1.6 792 2 700 256 Silt-19 16 ND 8.2 32 9.3 11 4 690 8 480 313 Clay-16 41 0.98 44 174 33 43 26 200 37 000 479
BS-18 Sand-58 4.8 0.02 1.5 9.7 2.9 1.9 1 490 4 750 212 Silt-23 17 0.13 12 28 8.8 11 4 900 11 900 250 Clay-19 44 1,1 44 181 35 45 23 500 41 900 397
BS-19 Sand-27 12 ND 3.6 15 6.7 5.2 3 130 4 920 497 Silt-30 18 ND 7.1 34 9.1 11 7 120 8 890 316 Clay-43 55 0.54 38 213 34 52 41 600 33 400 657
a NS is no sample.
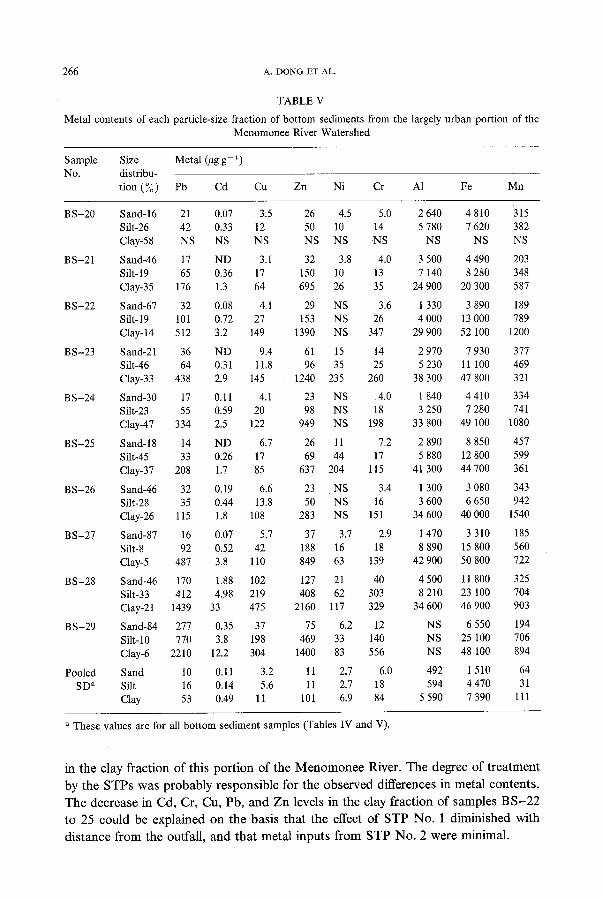
this site, even though the STP receives wastewater discharges from a metal plating company. Tertiary treatment for removal of P by co-precipitation may have removed dissolved metals from the effluent. The other two STPs that discharge effluent into the Menomonee River were located in the village of Menomonee Falls. The first STP - with secondary treatment capability - was located upstream from the BS-22 sampling site. The second STP - with tertiary capability - was located 3 km downstream from STP No. 1, above BS-23. These STPs treated wastewaters from metal foundaries, electro- plating plants and municipal sewage systems. Both STPs received the same type of wastes because they have a common valve that regulates flow rates. The Cd, Cr, Cu, Pb, and Zn levels in the clay-sized fraction of BS-22 were significantly higher (2 to 10 times) than the 'unpolluted' samples. Furthermore, they were higher than in BS-23 which received discharges from both STPs. Sample BS-22 had the highest level of Cr, Cu, Pb, and Zn among samples BS-12 to 27. It also had the second highest Cd level
266 A. DONG ET AL.
TABLE V
Metal contents of each particle-size fraction of bottom sediments from the largely urban portion of the Menomonee River Watershed
Sample Size Metal (/~g g 1) No. distribu-
tion (~o) Pb Cd Cu Zn Ni Cr A1 Fe Mn
BS-20 Sand-16 21 0.07 3.5 26 4.5 5.0 2 640 4 810 315 Silt-26 42 0.33 12 50 10 14 5 780 7 620 382 Clay-58 NS NS NS NS NS NS NS NS NS
Sand-46 17 ND 3.1 32 3.8 4.0 3 500 4 490 203 Silt-19 65 0.36 17 150 10 13 7 140 8 280 348 Clay-35 176 1.3 64 695 26 35 24 900 20 300 587
Sand-67 32 0.08 4.1 29 NS 3.6 1 330 3 890 189 Silt-19 101 0.72 27 153 NS 26 4 000 13 000 789 Clay-14 512 3.2 149 1390 NS 347 29 900 52 100 1200
Sand-21 36 ND 9.4 61 15 14 2 970 7 930 377 Silt-46 64 0.31 11.8 96 35 25 5 230 11 100 469 Clay-33 438 2.9 145 1240 235 260 38 300 47 800 321
Sand-30 17 0.11 4.1 23 NS 4.0 1 840 4 410 334 Silt-23 55 0.59 20 98 NS 18 3 250 7 280 741 Clay-47 334 2.5 122 949 NS 198 33 800 49 100 1080
Sand-18 14 ND 6.7 26 11 7.2 2 890 8 850 457 Silt-45 33 0.26 17 69 44 17 5 880 12 800 599 Clay-37 208 1.7 85 637 204 115 41 300 44 700 361
Sand-46 32 0.19 6.6 23 NS 3.4 1 300 3 080 343 Silt-28 35 0.44 13.8 50 NS 16 3 600 6 650 942 Clay-26 115 1.8 108 283 NS 151 34 600 40 000 1540
Sand-87 16 0.07 5.7 37 3.7 2.9 1 470 3 310 185 Silt-8 92 0.52 42 188 16 18 8 890 15 800 560 Clay-5 487 3.8 110 849 63 139 42 900 50 800 722
Sand-46 170 1.88 102 127 21 40 4 500 11 800 325 Silt-33 412 4.98 219 408 62 303 8 210 23 100 704 Clay-21 1439 33 475 2160 117 329 34 600 46 900 903
Sand-84 277 0.35 37 75 6.2 12 NS 6 550 194 Silt-10 770 3.8 198 469 33 140 NS 25 100 706 Clay-6 2210 12.2 304 1400 83 556 NS 48 100 894
Sand 10 0.11 3.2 11 2.7 6.0 492 1 510 64 Silt 16 0.14 5.6 11 2.7 18 594 4 470 31 Clay 53 0.49 11 101 6.9 84 5 590 7 390 111
BS-21
BS-22
BS-23
B S - 2 4
BS-25
BS-26
BS-27
BS-28
BS-29
Pooled SD"
a These values are for all bottom sediment samples (Tables IV and V).
in the clay f rac t ion o f this po r t i on o f t he M e n o m o n e e River. T h e degree o f t r e a t m e n t
by the S T P s w a s p r o b a b l y r e s p o n s i b l e for the o b s e r v e d d i f fe rences in m e t a l c o n t e n t s .
T h e d e c r e a s e in Cd , Cr, Cu, Pb , a n d Z n levels in t he clay f r ac t ion o f s a m p l e s B S - 2 2
to 25 cou ld be exp la ined on the bas i s t h a t t he effect o f S T P N o . 1 d i m i n i s h e d wi th
d i s t a n c e f r o m the outfall , a n d t h a t me ta l i npu t s f r o m S T P N o . 2 w e r e min imal .

METAL COMPOSITION OF SOIL 267
The clay fraction of BS-26 showed an increase in Cd, Cr, Cu, and Mn over the levels found in BS-25. A decrease in metal content was expected at BS-26 because it was located after the confluence of the Upper Menomonee River and the Little Menomonee River (Figure 1). Evidence should exist of diminution of metal contents in the bottom sediments, particularly since bottom sediments from the Little Menomonee River were 'unpolluted'. Furthermore, the site is located at a greater distance from the Menomonee Falls STP. Thus, it was suspected that another source of the metals existed. It has been reported by the Southeastern Wisconsin Regional Planning Commission (SEWRPC, 1976) that an electroplating company had one of its wastewater discharge outfalls leading directly to the Menomonee River about 1.6 km upstream from site BS-26 and about 1 km downstream from BS-25. In each of the three sampling surveys taken by the WDNR and the SEWRPC from April 1973 to August 1974 (SEWRPC, 1976), the concentrations of Cd, Cr, and Pb in the electroplating plant's wastewater discharge exceeded the maximum concentration recommended for surface water supporting fish and other aquatic life. Other metals used by the electroplating company included Cu and Ni. Thus, three of the five metals (Cd, Cr, and Cu) that were discharged by this company showed increased levels in the clay fraction of the bottom sediment sampled 1.6 km downstream from the outfall. As of June 1975, the plating company claimed to have stopped discharging wastewater directly into the Menomonee River. This indicates that either a 'memory' of metals exist in the sediments and/or other sources of metals are present. Several other industrial surface discharge sites leading to the Menomonee River in this area have been reported (SEWRPC, 1976).
Sample BS-27 showed increased levels of Cd, Cr, Pb, and Zn in the clay fraction. This section of the river traverses an industrial park and receives water from Underwood and Honey Creeks - subwatersheds which include some heavy industries possibly contributing to pollutants at site B S-27. The traffic density and surface imperviousness of the subwatersheds increased as the river approached the inner City of Milwaukee. Increased metal contents were found in the clay fractions of BS-28 and 29. Both sampling sites were in the Industrial Valley of the City of Milwaukee and receive stormwater runoff from a railroad yard, chemical plants, foundaries, and Interstate Highway 1-94.
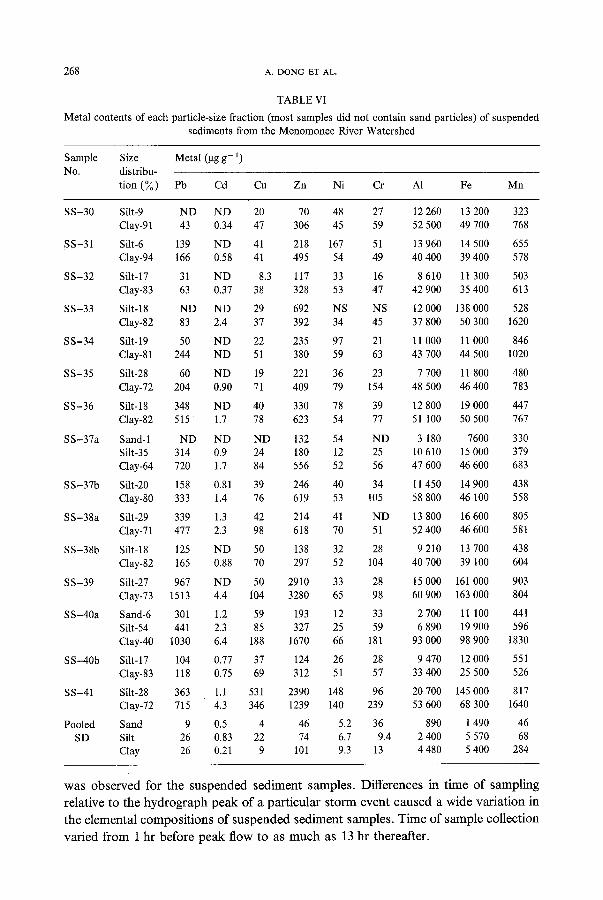
3.4. M E T A L S IN SUSPENDED SEDIMENTS
Metal contents of suspended sediments were measured to determine the short-term sediment and associated pollutant input from the Menomonee River watershed to Lake Michigan. Pollutant content of the urban suspended sediment is affected by the length of the dry period preceding the storm event, the amount of dust and dirt accumulation on streets, street sweeping practices, and the intensity of the storm event. Long-term trends are difficult to extrapolate from a small set of suspended sediment data.
Two sets of suspended sediment samples were taken on June 30 and July 18, 1977 (Table VI). The elemental composition of each size fraction was determined to allow general comparisons with the composition of bottom sediments and soils. Unlike the bottom sediments, no general pattern or association of metal content with sampling sites
268 A. DONG ET AL.
Metal contents of each
TABLE VI
particle-size fraction (most samples did not contain sand particles) of suspended sediments from the Menomonee River Watershed
Sample Size Metal (gg g- 1) No. distribu-
tion (~o) Pb Cd Cu Zn Ni Cr A1 Fe Mn
s s - 3 0 Silt-9 ND ND 20 70 48 27 12 260 13 200 323 Clay-91 43 0.34 47 306 45 59 52 500 49 700 768
SS-31 Silt-6 139 ND 41 218 167 51 13 960 14 500 655 Clay-94 166 0.58 41 495 54 49 40 400 39 400 578
SS-32 Silt-17 31 ND 8.3 117 33 16 8 610 11 300 503 Clay-83 63 0.37 38 328 53 47 42 900 35 400 613
SS-33 Silt-18 ND ND 29 692 NS NS 12 000 138 000 528 Clay-82 83 2.4 37 392 34 45 37 800 50 300 1620
SS-34 Silt-19 50 ND 22 235 97 21 11 000 11 000 846 Clay-81 244 ND 51 380 59 63 43 700 44 500 1020
SS-35 Silt-28 60 ND 19 221 36 23 7 700 11 800 480 Clay-72 204 0.90 71 409 79 154 48 500 46 400 783
SS-36 Silt-18 348 ND 40 330 78 39 12 800 19 000 447 Clay-82 515 1.7 78 623 54 77 51 100 50 500 767
SS-37a Sand-1 ND ND ND 132 54 ND 3 180 7600 330 Silt-35 314 0.9 24 180 12 25 10 610 15 000 379 Clay-64 720 1.7 84 556 52 56 47 600 46 600 683
SS-37b Silt-20 158 0.81 39 246 40 34 11 450 14 900 438 Clay-80 333 1.4 76 619 53 105 58 800 46 100 558
SS-38a Silt-29 339 1.3 42 214 41 ND 13 800 16 600 805 Clay-71 477 2.3 98 618 70 51 52 400 46 600 581
SS-38b Silt-18 125 ND 50 138 32 28 9 210 13 700 438 Clay-82 165 0.88 70 297 52 104 40 700 39 100 604
SS-39 Silt-27 967 ND 50 2910 33 28 15 000 161 000 903 Clay-73 1513 4.4 i04 3280 65 98 60 900 163 000 804
SS-40a Sand-6 301 1.2 59 193 12 33 2 700 11 100 441 Silt-54 441 2.3 85 327 25 59 6 890 19 900 596 Clay-40 1030 6.4 188 1670 66 181 93 000 98 900 1830
SS-40b Silt-17 104 0.77 37 124 26 28 9 470 12 000 551 Clay-83 118 0.75 69 312 51 57 33 400 25 500 526
SS-41 Silt-28 363 1.1 531 2390 148 96 20 700 145 000 817 Clay-72 715 4.3 346 1239 140 239 53 600 68 300 1640
Pooled Sand 9 0.5 4 46 5.2 36 890 1 490 46 SD Silt 26 0.83 22 74 6.7 9.4 2 400 5 570 68
Clay 26 0.21 9 101 9.3 13 4 480 5 400 284
w a s o b s e r v e d for the s u s p e n d e d s e d i m e n t s amples . D i f fe rences in t ime o f s amp l i n g
re la t ive to the h y d r o g r a p h p e a k o f a pa r t i cu la r s t o r m even t c a u s e d a w i d e var ia t ion in
t he e lementa l c o m p o s i t i o n s o f s u s p e n d e d s e d i m e n t s amples . T i m e o f s a m p l e co l lec t ion
va r i ed f r o m 1 hr be fo re p e a k f low to as m u c h as 13 hr thereaf te r .
METAL COMPOSITION OF SOIL 269
Metal contents in the clay fraction of SS-30 - located in the upper reaches of the Little Menomonee River - were less than or equal to the levels found in soils and consequently were considered to be 'unpolluted'. Sample S S-33 - located in the Upper Menomonee River- was found to be polluted with Cd and Mn, as well as P (Dong et al., 1983b). This might result from stormwater overflow at the upstream STP (Figure 1). Pollutants generated in this manner are more likely to be detected in suspended sediments than in bottom sediments. Correspondingly high Cd or Mn levels were not found for sample BS-17 collected at the same site.
Sample SS-34 was collected in the village of Menomonee Falls above the two Menomonee Falls STPs. It received stormwater from the village of Menomonee Falls, which could account for the sharp increase in Pb resulting from heavy vehicular traffic flow. The Pb level of the clay fraction was significantly higher than the levels in soils even though the sample was taken 12 hr after peak flow. Although Zn is commonly associated with vehicular emissions, no measurable increase over the soil level was observed. This can possibly be explained on the basis that Zn is more soluble or more rapidly removed from streets during the initial phase of the storm than is Pb. Alterna- tively another unknown source of Pb exists which was not associated with Zn.
Sample SS-35 received effluent from both Village of Menomonee Falls STPs. The Cr, Cu, Ni, Pb, and Zn contents of the clay fractions of the suspended sediment were higher than the soil levels even when the sample was collected after peak flow. This finding agreed with the bottom sediment analyses of this portion of the Menomonee River, i.e., a large amount of metals was contributed from the Menomonee Falls STP No. 1 outfall.
Metal contents of samples SS-38b and 40b were low, with values similiar to those found at S S-30. The two samples were collected 12.5 hr after peak flow. Sample SS-39 was from a highly urbanized medium-density residential area and contained unusually high A1, Cd, Cu, Fe, Pb, and Zn contents, compared to other suspended sediment samples. Possible explanations include a low flow rate (1.98m 3 s -1 peak) at Schoonmaker Creek, draining the subwatershed, thus permitting long contact time with pollutants; a high degree of connected impervious areas (54 ~o) (Simsiman et al., 1979); and close proximity to the Industrial Valley of Milwaukee which receives large amounts of atmospheric fallout. Although sample SS-31 (from a medium-density residential area) showed an increased Pb and Zn content, it was not nearly so high as in sample SS-39. Sample SS-31 was collected 8 km north of the SS-38 sampling site (Figure 1) and was thus further away from the Industrial Valley. The site was subject to lower traffic volume but probably has some sediment input from a housing construction site.
3.5. M E T A L S IN DO U SMA N DITCH BOTTOM SEDIMENTS
Sediments that are transported from a subwatershed to a receiving body of water often traverse through natural drainage ditches or marshes where sediments are trapped. The Brookfield Shopping Center site was chosen to evaluate such an effect. It has a stormwater outfall connected to Underwood Creek by a natural drainage ditch (Dousman Ditch) and traverses through a marsh. Dousman Ditch samples 1 to 6
270 A. DONG ET AL.
TABLE VII
Particle-size distribution and metal contents of each particle-size fraction of Dousman Ditch bottom sediments
Sample Size Metal (/~g g- 1) No. distribu-
tion (~o) Pb Cd Cu Zn Ni Cr A1 Fe Mn
Dousman 1 Sand-20 141 0.68 7.9 39 4.3 7.4 2 890 7 190 261 Silt-55 208 1.0 24 104 12 21 8 840 12 300 392 Clay-25 932 5.0 31 671 62 102 41 800 54 800 574
Dousman 2 Sand-3 NS 3.9 24 34 NS 17 5 020 679 92 Silt-42 36 2.0 14 45 23 15 10 300 7 960 138 Clay-55 60 2.6 54 113 28 21 103 000 10 200 126
Dousman 3 Sand-7 55 0.91 5.8 43 13 9.8 6 200 6 650 378 Silt-35 62 0.72 12 56 13 9.1 8 170 9 180 442 Clay-58 163 1.5 44 200 36 59 40 600 29 500 361
Dousman 4 Sand-27 11 0.48 4.8 23 4.0 4.6 3 830 6 090 170 Silt-32 46 0.37 17 54 13 11 5 900 14 700 220 Clay-41 134 1.6 46 209 31 53 28 800 25 700 245
Dousman 5 Sand-22 10 0.14 4.6 37 3.4 4.7 3 070 6 520 202 Silt-45 53 0.71 21 61 12 12 5 340 13 200 325 Clay-33 124 1.7 38 184 27 41 23 400 23 800 344
Dousman 6 Sand-23 16 0.09 6.4 21 4.2 4.5 2 880 6 420 392 Silt-40 38 0.34 12 37 9.0 9.5 4 890 10 900 289 Clay-37 167 1.3 54 " 234 36 69 39 600 34 400 413
Pooled Sand 6.1 0.20 0:80 7.2 2.3 1.5 1 050 1 370 27 SD Slit 4.7 0.16 1.3 7.1 1.4 1.5 1 570 890 25
Clay 25 0.27 3.1 22 5.9 5.6 11 470 1 025 10
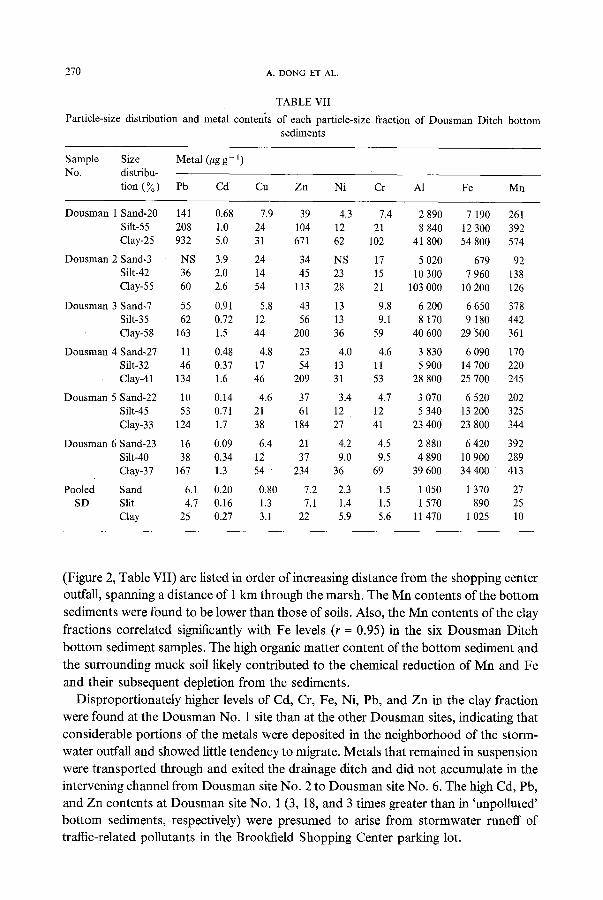
(Figure 2, Table VII) are listed in order of increasing distance from the shopping center
outfall, spanning a distance of 1 km through the marsh. The M n contents of the bot tom
sediments were found to be lower than those of soils. Also, the Mn contents of the clay
fractions correlated significantly with Fe levels (r = 0.95) in the six Dousman Ditch
bot tom sediment samples. The high organic matter content of the bot tom sediment and
the surrounding muck soil likely contributed to the chemical reduction of M n and Fe
and their subsequent depletion from the sediments.
Disproportionately higher levels of Cd, Cr, Fe, Ni, Pb, and Z n in the clay fraction
were found at the Dousman No. 1 site than at the other D ousma n sites, indicating that
considerable portions of the metals were deposited in the neighborhood of the storm-
water outfall and showed little tendency to migrate. Metals that remained in suspension
were transported through and exited the drainage ditch and did not accumulate in the
intervening channel from Dousman site No. 2 to Dousma n site No. 6. The high Cd, Pb,
and Z n contents at Dousman site No. 1 (3, 18, and 3 times greater than in 'unpolluted'
bot tom sediments, respectively) were presumed to arise from stormwater runoff of
traffic-related pollutants in the Brookfield Shopping Center parking lot.

METAL COMPOSITION OF SOIL 271
3.6. C O R R E L A T I O N ANALYSIS
Six soils were considered to be too small a sample number for making generalizations about soil properties, however, they were useful for making comparisons of composi- tion with bottom- and suspended-sediments. No significant correlations existed among the metals in the sand, or silt fractions of bottom- and suspended-sediments. The Cd, Pb and Zn levels in the clay fractions of bottom- and suspended-sediments were correlated significantly with each other (P = 0.01); less significant correlations were found among Cr, Cu, and Ni contents in the same fractions. Significant correlations were not found between the metals in soil samples suggesting that soils were not the primary sources of the metals in sediments. The area surrounding several sediment sampling sites had high density automobile traffic (B S-14 to 21), parking lots (Dousman Ditch), urban areas with a higher degree of imperviousness (SS-31, 39), and an area with large amounts of connected impervious surfaces in its immediate surrounding (SS-34), indicating that vehicular emissions were probably the major sources of the metals to the sediment samples. To a lesser degree, Cu, Cr, and Ni contents in the clay fractions of suspended and bottom sediments also were correlated with each other.
4. Discussion
Metal contents of each size fraction - sand, silt and clay - of the six major soil types from the watershed were found to be similar in range and were used for comparison with sediments and urban street dust. The Cd, Cr, Cu, Ni, Pb, and Zn contents were sufficiently low in soils to permit detection of the nonagricultural contribution of the metals to sediments; while A1, Fe, and Mn contents were high. Sediments with lower Fe, Mn, and A1 contents than soils may result from their chemical reduction and/or leaching during aqueous transport.
The Cr, Cu, Fe, and Ni contents of the coarse fractions of urban street dust samples occasionally were found to be greater than the fine materials, e.g., sand compared to silt and silt compared to clay. The usual surface sorption characteristic suggesting that higher content of sorbed metals is associated with the smaller particles does not hold. However, the presence of Cr, Cu, Fe, and Ni eroded or abraded from metal surfaces could explain their high levels in the coarse particles of urban street dust. Their presence as metal particles also is consistent with the large standard deviation obtained in the determination of these metals in the coarse fractions.
The A1, Cd, Pb, and Zn contents were found to be lower in the coarse fractions than in the clay fraction of the urban street dust samples. This behavior also was found for P (Dong et al., 1983b). The standard deviations for A1, Cd, Pb, and Zn contents were lower than for Cr, Cu, and Ni contents of the sand fractions of the urban street dust samples. Much of the Cd, P, Pb, and Zn from combustion of leaded gasoline and oil lubricants probably passes through a vapor phase prior to sorption on particle surfaces and tends to be concentrated on particles of large surface area. Dissolved A1, Cd, and Zn due to corrosion would have passed through a molecular phase. Thus, for these
272 A. DONG ET AL.
elements, the surface sorption model was adequate to account for the higher Cd, P, Pb, and Zn contents in the fine fractions. A similar distribution pattern of elements in urban street dust samples was reported by Pitt (1979). This pattern consisted of high Cr and
Cu and low Cd, Ni, P, Pb, and Zn levels in the coarse fractions. However, the data were obtained from dry-sieved samples without prior dispersion.
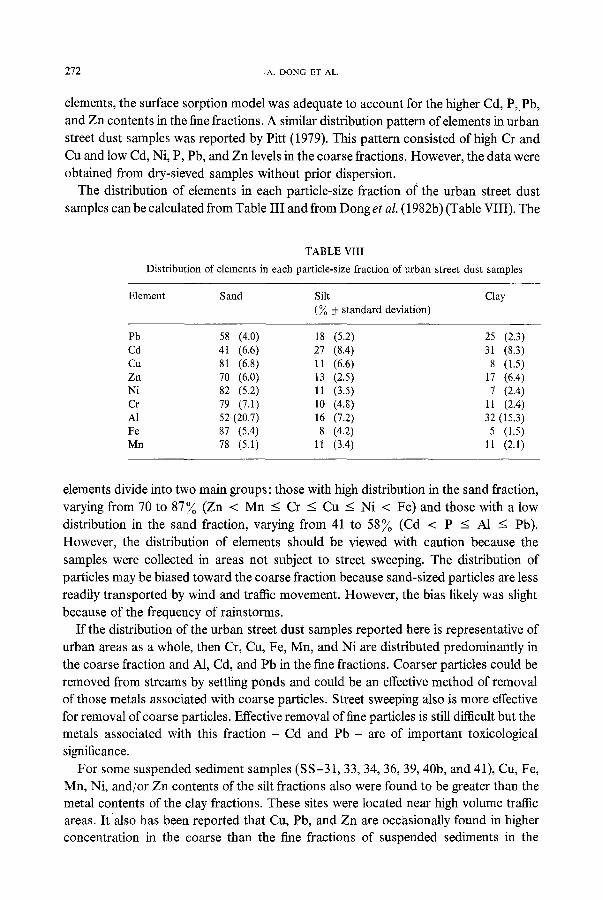
The distribution of elements in each particle-size fraction ot ~ the urban street dust samples can be calculated from Table III and from Dong et al. (1982b) (Table VIII). The
TABLE VIII Distribution of elements in each particle-size fraction of urban street dust samples
Element S and Silt Clay (~o + standard deviation)
Pb 58 (4.0) 18 (5.2) 25 (2.3) Cd 41 (6.6) 27 (8.4) 31 (8.3) Cu 81 (6.8) 11 (6.6) 8 (1.5) Zn 70 (6.0) 13 (2.5) 17 (6.4) Ni 82 (5.2) 11 (3.5) 7 (2.4) Cr 79 (7.1) 10 (4.8) 11 (2.4) A1 52 (20.7) 16 (7.2) 32 (15.3) Fe 87 (5.4) 8 (4.2) 5 (1.5) Mn 78 (5.1) 11 (3.4) 11 (2.1)
elements divide into two main groups: those with high distribution in the sand fraction, varying from 70 to 87~o (Zn < Mn < Cr -< Cu < Ni < Fe) and those with a low distribution in the sand fraction, varying from 41 to 58~o (Cd < P < A1 < Pb). However, the distribution of elements should be viewed with caution because the
samples were collected in areas not subject to street sweeping. The distribution of particles may be biased toward the coarse fraction because sand-sized particles are less readily transported by wind and traffic movement. However, the bias likely was slight because of the frequency of rainstorms.
If the distribution of the urban street dust samples reported here is representative of urban areas as a whole, then Cr, Cu, Fe, Mn, and Ni are distributed predominantly in the coarse fraction and A1, Cd, and Pb in the fine fractions. Coarser particles could be removed from streams by settling ponds and could be an effective method of removal of those metals associated with coarse particles. Street sweeping also is more effective for removal of coarse particles. Effective removal of fine particles is still difficult but the metals associated with this fraction - Cd and Pb - are of important toxicological significance.
For some suspended sediment samples (SS-31, 33, 34, 36, 39, 40b, and 41), Cu, Fe, Mn, Ni, and/or Zn contents of the silt fractions also were found to be greater than the metal contents of the clay fractions. These sites were located near high volume traffic areas. It also has been reported that Cu, Pb, and Zn are occasionally found in higher concentration in the coarse than the fine fractions of suspended sediments in the

METAL COMPOSITION OF SOIL 273
Menomonee River and other Great Lakes streams (Armstrong et al., 1979). However, the samples were fractionated without prior dispersion and thus may have contained aggregates of fine particles. With the exception of Mn, the bottom sediments did not show a greater distribution of metals in the coarse fraction.
As the land use in the source areas of the sediments shifts from rural to urban, trace metal contents (Cd, Cr, Cu, Ni, Pb, and Zn) in the clay fractions of the bottom- and suspended-sediments increase. The Cd, Pb, and Zn contents of rural sediment samples located near or affected by automobile traffic were found to be slightly higher than other rural sediment samples. Samples collected below tertiary STPs outfalls (B S-17 and 23) which treat industrial wastewater, showed no significant increases in metal content over comparable upstream sites. However, sharp increases existed in metal contents of bottom sediments collected below a secondary STP (B S-22). The lower metal content of sediments sampled below the tertiary STP outfall was presumed to result from P removal by co-precipitation, which would have some influence on removing metals from the effluent.
The increase in metal content of the bottom sediment B S-22 was followed by a 50 % decrease 8 km downstream. Similarly, a sharp decrease was observed in metal contents of Dousman Ditch No. 2 compared to Dousman No. 1, located below a stormwater outfall. High metal contents of sample B S-26 were associated with inputs from several years ago. It seems that metals can settle out with the bottom sediments, but after a while they are covered by new sediments which effectively bury the older sediments, thereby reducing the biological availability of metals in the older sediments. However, if the river is scoured by an intense storm, the older deposits are resuspended and become biologically viable.
5. Summary and Conclusions
Compared to unfractionated samples, chemical analyses of fractionated and dispersed soil and sediment samples improve our ability to evaluate differences in metal pollution levels and bio-availability. To explain the sources of metals in sediments and to directly compare the composition of soils and sediments it is essential to fractionate the samples prior to analysis. Chemical analyses of different particle size fractions revealed that not all metals are concentrated in the fine fractions. The Cr, Cu, Fe, and Ni in urban street dust samples were more evenly distributed among particle size fractions suggesting that they were derived from abrasion of metal surfaces with varying degrees of corrosion and pulverization. Contents of A1, Cd, and Pb were greater in the fine fraction indicating that these metals passed through a vapor or molecular phase prior to sorption. For suspended sediments, Cr, Cu, and Fe contents also were high in the coarse fraction. Metals associated with the coarse fractions settle more quickly while those associated with the fine fractions stay in suspension longer, are transported greater distances, are more bio-avallable and have greater impact on water quality.
Presently, no national guidelines exist for identifying the extent of metal pollution in bottom sediments or dredge spoils. Region V of the U.S. EPA has developed an interim
274 A. DONG ET AL.
guideline for classifying the extent of metal pollution from dredge spoils taken from Great Lakes harbors, based on the elemental composition of unfractionated sediment samples. The guideline is limited to the harbor area and is not applicable to upstream sites where particle size distribution varies considerably. From the present study, chemical analyses of fractionated samples would be a preferable method for setting guidelines since the data are more readily compared from one type of sample to another. Ultrasound dispersion prior to fractionation is a suitable method of particle size separation because it permits the organic matter and pollutants associated with particular particles to remain intact. Protocols for classifying bottom sediments based on pollutant load should include analyses of fractionated samples rather than unfrac- tionated samples.
If the bottom sediments sampled are representative of conditions in the total water- shed, then the importance of sources of metals (Cd, Cr, Cu, Ni, Pb, and Zn) to the river is: runoff and discharges from industrial areas > secondary STP > urban street surfac- es > tertiary STP = agricultural areas. The removal of P from tertiary STP effluent also effectively removed metals. Vehicular emission contributed much of the Cd, Pb, and Zn to bottom and suspended sediments.
Acknowledgments
This research was supported by a Great Lakes National Program grant from the U.S. Environmental Agency No. R005142.
References
Armstrong, D. E., Perry, J. R., and Flatness , D. E.: 1979, 'Availability of Pollutant Associated with Suspended and Settled River Sediment which Gain Access to the Great Lakes', EPA-905/4-79-028, U.S. Environmental Protection Agency, Great Lakes National Program Office, Chicago, Illinois. 104 pp.
Dong, A., Chesters, G., and Simsiman, G. V.: 1983a, Soil Sei. 136, 208. Dong, A., Simsiman, G. V., and Chesters, G.: 1983b, Water Res. 17, 569. Genrich, D. A. and Bremner, J. M.: 1972, Soil Sei. Soc. Am. Pro¢. 36, 944. Pitt, R.: 1979, 'Demonstration of Nonpoint Pollution Abatement Through Improved Street Cleaning
Practices', U.S. Environmental Protection Agency, Municipal Environmental Research Laboratory, Cincinnati, OH.
Pitt, R. E. and Amy, G.: 1973, 'Toxic Material Analysis of Street Surface Contaminants', EPA-600/2-75-004, U.S.. Environmental Protection Agency.
Pilotte, J. O., Winchester, J. W., and Glassen, R. C.: 1978, Water, Air, and Soil Pollut. 9, 363. PLUARG: 1978, 'Environmental Management Strategy for the Great Lakes System. International
Reference Group for Great Lakes Pollution from Land Use Activities', Final Report for International Joint Commission, Ontario, Canada. 115 pp.
Presley, B. J., Trefry, J. H., and Shokes, R. F.: 1980, Water, Air, and Soil Pollut. 13, 481. SEWRPC: 1966, 'Soils of Southeastern Wisconsin', Planning Report No. 8, Southeastern Wisconsin
Regional Planning Commission, Waukesha, WiscOnsin. SEWRPC: 1976, 'A Comprehensive Plan for the Menomonee River Watershed', Vol. 1. Inventory Findings
and Forecasts, Planning Report No. 26, Southeastern Wisconsin Regional Planning Commission, Wau- kesha, Wisconsin.
Shaheen, D. G.: 1975, 'Contribution of Urban Roadway Usage to water Pollution', EPA-600/25-005, U.S. Environmental Protection Agency, Washington, D.C.

METAL COMPOSITION OF SOIL 275
Simsiman, G. V.; Chesters, G., Bannerman, R., Konrad, J. G., and Goodrich-Mahoney, J.: 1979, 'Meno- monee River Pilot Watershed Study', Vol. 2. Land Use, Population, and Physical Characteristics of the Menomonee River Watershed, EPA-905/4-79-029B, U.S. Environmental Protection Agency, Great Lakes National Program Office, Chicago, Illinois. 124 pp.
Sylvester, R. O. and Dewalle, F. B.: 1972, 'Character and Significance of Highway Runoff Waters: A Preliminary Appraisal', Dept. of Civil Engineering, Univ. of Washington, Seattle, Washington.
U.S. EPA: 1976, 'Manual of Methods for Chemical Analysis of Water and Wastes', EPA-624/6-74-003, U.S. Environmental Protection Agency, Environmental Research Center, Cincinnati, Ohio.
U.S. EPA: 1977, 'Guidelines for the Pollutional Classification of Great Lakes Harbor Sediments', Unpub- lished Report, U.S. Environmental Protection Agency, Chicago, Illinois.
Wall, G. J., Wilding, L. P., and Smeck, N. E.: 1978, J. Environ. Qual. 7, 319.