metabolomics of rhabdomyosarcoma cell during echovirus 30
TRANSCRIPT

Tiwari and Dhole Virology Journal (2017) 14:144 DOI 10.1186/s12985-017-0812-7
RESEARCH Open Access
Metabolomics of Rhabdomyosarcoma CellDuring Echovirus 30 Infection
Sarika Tiwari1,2* and Tapan N. Dhole1Abstract
Background: Echovirus 30 (E30) causes acute aseptic meningitis. Viral replication requires energy and macromolecularprecursors derived from the metabolic network of the host cell. The effect of viral infection within a host cell metabolicactivity remains unclear.
Methods: To gain an insight into cell-virus interaction during E30 infection we used a human rhabdomyosarcomacell line. In a new approach to metabolomics, 1H NMR was used to measure the level of various cellular metabolitesat different times of infection and morphological examination of the cells. Statistical analysis was done by usingConfidence interval (CI) 95% and One-way ANOVA test.
Results: The1H NMR metabolite spectrum signals were observed between mock infected and virus infectedcells. Both mock infected and virus infected cells utilized glucose through metabolic pathways and releasedmetabolic end products. Upon infection, the concentration of Alanine, Lactate, Acetate, Glutamate, Tyrosine,Histidine, Phenylalanine, Creatine, Choline and Formate, increased. Interestingly, all of these augmentedmetabolites were decreased during later stage of infection. The cells showed wide-ranging lipid signals atthe end of infection, which correlates with the morphological changes as apoptosis (programmed cell death) of cellswas observed. A significant association was found between time interval (12 h, 24 h, and 48 h) and metaboliteslikewise Alanin, Lactate, Acetate, Glutamate, Tyrosine, Histidine, Phenylalanine, Creatine, Choline and Formaterespectively released by cell during infection, which is highly significant (p < 0.01).
Conclusion: Progressive breakdown and utilization of all cellular components were observed as the infectionincreased. This study is useful for monitoring the cellular metabolic changes during viral infection.
Keywords: Echovirus 30, NMR, Cellular metabolomics, Aseptic meningitis, Tissue culture
BackgroundEnteroviruses (EVs) are responsible for 30,000 to50,000 hospitalizations for aseptic meningitis per yearin the United States. Echovirus 30 (E30) (genus:Enterovirus; family, Picornaviridae) is one of themost frequently isolated EVs, causing extensive out-breaks of E30 in temperate climates in several coun-tries [1, 2].Metabolomics is a new approach that facilitates
multivariate profiling of the integrated metabolicresponses of complex systems to pathophysiological
* Correspondence: [email protected] of Microbiology (Virology Section), Sanjay Gandhi PostGraduate Institute of Medical Sciences (SGPGIMS), Lucknow, Uttar Pradesh-226014, India2Centre for Animal Disease Research and Diagnosis, Indian VeterinaryResearch Institute, Bareilly, UP, India
© The Author(s). 2017 Open Access This articInternational License (http://creativecommonsreproduction in any medium, provided you gthe Creative Commons license, and indicate if(http://creativecommons.org/publicdomain/ze
stress and provides corresponding information togenomics and proteomics [3]. The use of high-resolution nuclear magnetic resonance (NMR) spec-troscopy to study metabolomics in biological fluids,tissues, and cells and to investigating the biochemicalconsequences of human disease is rapidly increasing[4–6]. This approach is attractive in the study of cellmetabolism owing to its unique non-invasive charac-teristics which can generate information on multiplepathways monitored simultaneously in a single step.During viral infection in the host cell, delivery of viral
nucleic acid involves a complex series of tightly regu-lated events where the invading virus utilizes the bio-synthetic components of the host cell to reach its goal,altering cell metabolism. Depending on the host celland virus type, different altering mechanisms have been
le is distributed under the terms of the Creative Commons Attribution 4.0.org/licenses/by/4.0/), which permits unrestricted use, distribution, andive appropriate credit to the original author(s) and the source, provide a link tochanges were made. The Creative Commons Public Domain Dedication waiverro/1.0/) applies to the data made available in this article, unless otherwise stated.
Tiwari and Dhole Virology Journal (2017) 14:144 Page 2 of 10
proposed [7]. Studies on virus-cell interactions haveproven to be valuable in elucidating viral-cellular pro-cesses [8–13].Cell culture is widely used as an in vitro model due to
increased experimental control of physiological parame-ters than tissue or in vivo studies. The widespread use ofanimal cells grown in tissue culture as models forinvestigation of properties of normal and malignant cellsintensifies the importance of a clear understanding ofthe dynamics of cellular metabolism [14]. The currentunderstanding of the effect of viral infection on themetabolism of all metabolites in tissue culture is stillrelatively inadequate.Thus far, there have been no reports on metabolic studies
of E30 infection in human cell lines using NMR spectros-copy. In this study, we use high resolution 1H NMR spec-troscopy to investigate the effect of E30 infection duringacute, sub-acute and chronic stage infections in a rhabdo-myosarcoma embryonic (RD) human cell line. NMR spec-troscopy can play a strategic role in this scientific challengeas it can be used to study the interactions, both fromthermodynamic and kinetic points of view, between andamong biomolecules and small ligands, monitoring wholemetabolic processes. In addition, NMR spectroscopy canbe used to solve the structure of biomolecules and tell howthe biomolecules interact. Theoretically, the combinationof a metabolite and an analogue capable of antagonizing itsbiological action at very low concentrations could provide asensitive system for determining slight amounts of metabo-lites. This study investigates the interaction between E30and human cells using NMR spectroscopy to determinethe mechanistic contribution of a viral infection.
MethodsPreparation of cellRD cells were obtained from the Center for DiseaseControl and Prevention, Atlanta, GA, USA and werecultivated in the Eagle’s minimum essential medium(MEM) (Eagle 1959) supplemented with 10% fetalbovine serum (FBS), 100 U ml−1 of penicillin, and 10 mgml−1 of streptomycin, essential amino acids, andL-glutamine (obtained from Sigma-Aldrich Co). Thecells were cultured in 75 cm2 flasks (Corning Inc. USA).The cell monolayer was washed twice with 1× phosphatebuffered saline solution without calcium and magnesiumions (Sigma-Aldrich), then trypsinized (0.5 g trypsin;0.2 g EDTA.4Na/l HBSS, Sigma-Aldrich) and kept at36.5 °C in the incubator until the cells detached fromthe surface. Cells were counted using a hemocytometerby taking quadruplicate samples from each of threeflasks using the procedure of Jenkin and Anderson [15].Fresh medium (30 ml) was then added into the flask.The cells were subcultured at 5 to 7 day intervals.
VirusE30 used in this study was isolated from environmentalspecimens. The virus was serotyped according to WorldHealth Organization’s protocol [16] and confirmed byRT-PCR with specific primers [17]. Virus stock wasprepared by infecting RD cells in 25 cm2 flasks (Corn-ing Inc. USA). Virus infected and mock infected cellswere incubated at 36.5 °C with 2% MEM. After 48 h ofinfection, the culture was aliquoted and kept at-80 °Cfor further use.
Plaque assayPlaque assays of E30 were performed on monolayers ofRD cells in 60-mm six-well tissue culture plates. Tenfoldserial dilutions of virus stock were added to 90% conflu-ent monolayer. After 1 h incubation at 36.5 °C with 5%CO2, unabsorbed virus was removed by gentle washingwith PBS and an overlay of fresh media (1% agarose inMEM with 1% FBS) was added. After 4 days incubation,the cells were fixed with 10% formaldehyde and stainedwith 0.5% crystal violet and plaques were counted.
Virus infectionAfter the cells were grown with 100% confluence, thegrowth medium (MEM with 10% FBS) was replaced withmaintenance medium (MEM with 2% FBS) from all theflasks. Three flasks were inoculated with 200 μl of virus(1 × 10 [5] Pfu/ml), while the other three flasks wereinoculated with 200 μl of sterile PBS served as mockinfected for each time point (12 h, 24 h, 48 h). After12 h, one set of flasks both mock infected and virusinfected was taken out from the incubator, photographsof the cells were taken under a Nikon inverted micro-scope at a magnification of X 400 and the maintenancemedium was taken out and stored at −80 °C until 1HNMR experiments were performed for analyzing theextracellular metabolites from the medium. The cellswere harvested by trypsinization, stained with trypanblue and counted, washed twice with ice-cold PBS 1X(4 °C, pH = 7. 4) and suspended in buffered D2O (50 mlPBS 10X and 450 ml D2O) for 1H NMR experiments ofthe whole cells. Virus infection in the remaining two setsof flasks was continued for 24, 48 h period and, at theend of each period, photographs of cells were taken, themaintenance medium was taken out for 1H NMR exper-iments and the cells were harvested, counted and sus-pended in buffered D2O as described above for flaskswith 12 h virus infected and mock infected cells.
Other componentsEagle’s minimum essential medium, HEPES buffer (N-2-hydroxyethylpiperazine-N0-2-ethanesulfonic acid), sodiumbicarbonate, phenol red, deuterium oxide (D2O),trimethyl-silylpropionic acid (TSP), sodium salt (all from Sigma

Tiwari and Dhole Virology Journal (2017) 14:144 Page 3 of 10
Aldrich, USA), penicillin, streptomycin, FBS, L-Glutamine,PBS, fungizone, trypsin, trypan blue stain, (all fromGIBCO, USA) and cell culture flask 75 cm2 (Corning, Inc.USA) were used for the study.
NMR experimentsOne and two-dimensional NMR analyses were performedon a Bruker Biospin Avance 400 MHz NMR spectrometerusing a 5 mm broadband inverse probe equipped with z-gradient. Analyses were performed according to the proto-col described in a previously published article Tiwari et al.in 2012 [16]. An experiment was performed in triplicates.
Extracellular metabolitesCollected extracellular media from virus infected cellsand mock infected cell counterparts were thawed. Analiquot of 0.5 ml of each medium was drawn separatelyinto 5 mm NMR tubes and 1H NMR spectra wererecorded. After inserting a TSP control capillary, allspectra comparing the metabolite patterns excreted byvirus infected and mock infected cells were recordedunder identical experimental conditions.
Whole-cell metabolitesAll virus infected cells (12–48 h post infection) andmock infected cells (12–48 h post infection) werewashed twice with 1× PBS and suspended in bufferedD2O (50 μl PBS 10× and 450 μl D2O). Cells were thentransferred to 5 mm NMR tubes and 1H NMR spectrawere recorded under identical experimental conditions.
Intracellular metabolitesWater-soluble intracellular metabolites of virus infectedand mock infected whole cells were extracted into PBSprepared in D2O (50 μl PBS 10× and 450 μl D2O) bysonicating the cells under ice-cold conditions. This wasfollowed by centrifugation at 12,000 rpm at 4 °C for10 min. The supernatants were stored for lipid extrac-tion. The whole cell lysate was thoroughly mixed byvortexing the sample and brought up to a total volumeof 0.5 ml. The whole cell lysates containing water-soluble cellular metabolites were then placed in 5 mmNMR tubes and one-dimensional 1H NMR spectra wererecorded. Suppressing the residual water by pre-saturation allowed for spectra to be collected underidentical conditions. For 48 h virus infected and mockinfected cell extracts, a 1H–1H two-dimensionaldouble-quantum filtered correlated spectroscopy (DQF-COSY) experiment was also performed by suppressingthe residual water signal by pre-saturation. Afterrecording the spectra, all samples were stored at-80 °Cfor lipid extraction.
Cell lipidsCell lysates, stored at-80 °C after recording the protonNMR spectra, were subjected to lipid extraction follow-ing Folch’s extraction procedure [18]. Supernatant andresidue were lyophilized. Briefly, the residual cell pelletwas mixed with 3.18 ml of chloroform, methanol andsaline water in a ratio of 2.0:1.0:0.18. The resultant mix-ture was sonicated for 3 min under ice cold conditionsand centrifuged at 2400 rpm for 10 min to allow a clearseparation of the aqueous and non-aqueous phases. Sub-sequently, the aqueous (upper) phase was collected andsubjected to re-extraction of the remaining lipids, if any,by treatment with 2.0 ml of chloroform and methanol ina ratio of 2:1, sonicated and centrifuged for 10 min. Thenon-aqueous (lower) phase from both extraction stepswere pooled and dried using nitrogen gas. The residueobtained was dissolved in 0.5 ml CDCl3:CD3OD mix-tures in a ratio of 2:1 and 1H NMR spectra wererecorded.
Statistical analysisThe multiple comparisons of time intervals correspond-ing to various chemical components (dependent vari-able) and their significant value were calculated. TheConfidence interval (CI) 95% was also estimated. TheOne-way ANOVA test was performed with all timeinterval groups were also calculated. A significant associ-ation was found between time interval (12 h, 24 h, and48 h) and metabolites likewise Alanin, Lactate, Acetate,Glutamate, Tyrosine, Histidine, Phenylalanine, Creatine,Choline and Formate respectively released by cell duringinfection, which is highly significant (p < 0.01).
ResultsMicroscopic observationThe total cell count at 12 h post virus infection wasslightly less when compared with mock infected cellsunder similar conditions. However, no morphologicalchanges were seen at 12 h infection when comparedwith mock infected cells as observed under the micro-scope (Fig. 1b). At 24 h (Fig. 1c) and 48 h post infection(Fig. 1d), cytopathic effects are visible in virus infectedcells when compared with mock infected control cells(Fig. 1a). At 24 h post infection, detachment of cellsfrom the flask surface was observed (Fig. 1c). Thisdetachment increased with time. At 48 h, all virusinfected cells detached from the flask surface andshowed morphological changes (rounding of cells) (Fig. 1d),whereas no morphological changes were seen in mockinfected cells.
NMR analysisSpectra of extracellular media from mock infected cellsand virus infected cells are shown in Fig. 2. It has

Fig. 1 Cells in culture flasks monitored under a Nikon inverted microscope at a magnification of 400×: (a) mock infected RD cells; (b) –(d) RDcells infected with E30 for (b) 12 h, (c) 24 h, and (d) 48 h
Fig. 2 400 MHz 1H NMR spectra of extracellular media of (a) 12 h mock infected cells, (b) 12 h virus infected cells, (c) 24 h virus infected cells, and (d)48 h virus infected cells with E30. All spectra were recorded under identical conditions and plotted with the same vertical scale for direct comparison
Tiwari and Dhole Virology Journal (2017) 14:144 Page 4 of 10

Tiwari and Dhole Virology Journal (2017) 14:144 Page 5 of 10
possibly well known, in Fig. 2, the quantity of acetate iseminent at 24, and 48 h, post virus infection in compari-son with 12 h. In contrast, the quantity of lactateincreases gradually from 12 to 48 h post virus infection(Fig. 2). The increased level of acetate at 24 and 48 hmay be attributed to the conversion of lactate into acet-ate. Whereas metabolites like lysine and alanine bothwere slightly increased from 12 h to 48 h post infection.The amount of succinate was slightly decreased at 12 hinfection while no major change was seen at 24 and 48 hpost infection. It may be because of normal cell metabol-ism. Such conversion of lactate to acetate, which accu-mulated in the growth medium, is reported in severalbacterial [19, 20] and viral system [16]. The whole cellspectra showed arised signals of alanine acetate, Creatine,choline, phosphocholine, glycine, and lipids respectively at12 h mock infected cells (Fig. 3a). The cells after 12 h virusinfection showed increased amount of glutamine andglutamate that were not observed in mock infected cells(Fig. 3a). A very high concentration of acetate wasobserved after 24 h virus infection as compared to mockinfected cells as well as 12 h virus infected cells. Whereasthe remarkable changes were seen in some metaboliteslike Creatine, lactate, phosphocholine and glycine werestarted to decrease gradually at 12 to 48 h post virus infec-tion. At 48-h interval, almost metabolites of infected cellswere consumed except some component like lipid andacetate (Fig. 3d).
Fig. 3 Portions of 400 MHz 1H NMR spectra of RD cells: (a) 12 h mock infeinfected. All spectra were obtained under identical conditions and plotted
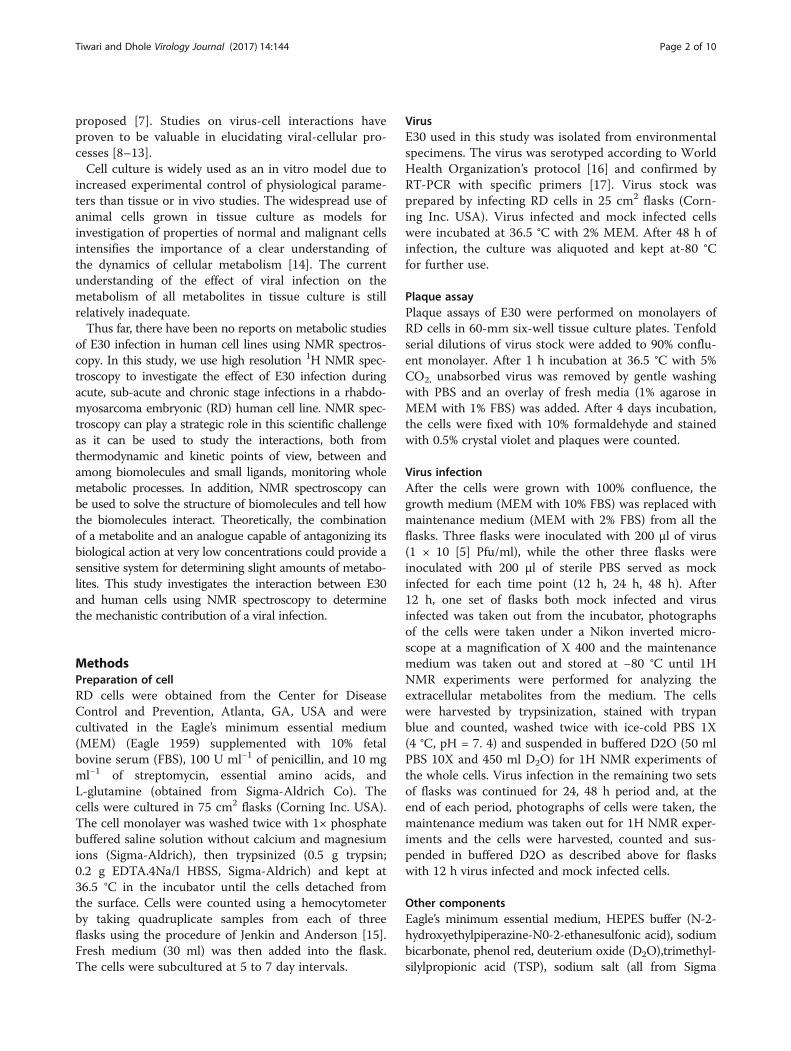
Figure 4 shows the intracellular metabolites like glu-tamine, methionine, aspartic acid, glycine, myoinositol,threonine, tyrosine, histidine, uracil, and phenylalaninerespectively at 12 h virus infection, however, these me-tabolites were not seen in mock infected cells. At 24 hinfection the glutamine, acetate, and formate were seen,while acetate showed high signals at 24 h and at 48 h.remaining residual metabolites like as lysine, alanine,lactate, and BCAA (Branched chain amino acid) werepresent at 48 h post infection (Fig. 4d).
1H NMR spectra of cellular lipids extracted in organicsolvent- chloroform, showed signals of lipids, cholesterol,phosphatidylcholine and phosphatidylethanolamine re-spectively (Fig. 5a-d). The intensities of these lipid signalswere increased in virus infected cells as compared tomock infected cells. However, the NMR signals were bet-ter determined and more metabolites can be identified, asshown in the 400 MHz DFQ-COSY spectrum of extractfrom 48 h infected cells (Fig. 6). The recognized metabo-lites from the two-dimensional (2D) spectra were alanine,valine, leucine, isoleucine, lysine, glutamate, tyrosine, lac-tate, acetate, aspartic acid, creatine, choline, phosphocho-line, phenylalanine, myoinositol, uracil, and formatereleased respectively. While in case of the spectra of virusinfected cells shows (Fig. 3), an increase in viral infectiontime, all these metabolites gradually reduced at 48 h. Inthe Figs. 2, 3, 4 and 5 it is clearly seen that amount of cel-lular lipids increases with increase in E30 infection.
cted cells (b) 12 h virus infected (c) 24 h virus infected and (d) 48 hwith identical vertical scale for direct comparison
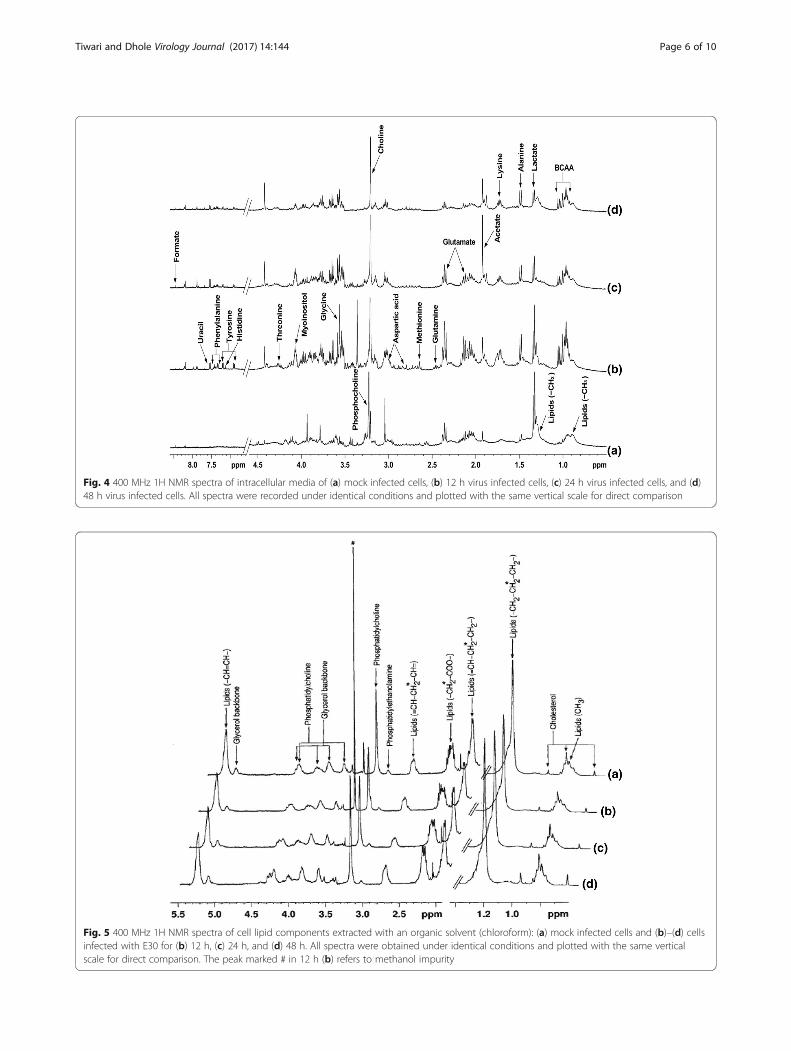
Fig. 4 400 MHz 1H NMR spectra of intracellular media of (a) mock infected cells, (b) 12 h virus infected cells, (c) 24 h virus infected cells, and (d)48 h virus infected cells. All spectra were recorded under identical conditions and plotted with the same vertical scale for direct comparison
Fig. 5 400 MHz 1H NMR spectra of cell lipid components extracted with an organic solvent (chloroform): (a) mock infected cells and (b)–(d) cellsinfected with E30 for (b) 12 h, (c) 24 h, and (d) 48 h. All spectra were obtained under identical conditions and plotted with the same verticalscale for direct comparison. The peak marked # in 12 h (b) refers to methanol impurity
Tiwari and Dhole Virology Journal (2017) 14:144 Page 6 of 10

Fig. 6 Portion of a 400 MHz COSY spectrum of water-soluble intracellular metabolites of RD cells infected with E30 for 48 h: Alanine, lactate,aspartic acid, valine, leucine, isoluecine, lysine, glutamate, tyrosine, proline, Phenylalanine, Threonine, histidine, and uracil
Tiwari and Dhole Virology Journal (2017) 14:144 Page 7 of 10
In this study the spectra of lipid extracts for distinctiveall time points of mock infected cells and virus infectedcells showed major differences in the metabolites. Thevalue of all metabolites gradually decreased during timeinterval (12, 24 and 48 h) of virus infected cells, whereasmock infected cells utilized the less amount of metabo-lites corresponding to virus infected cells and releasedsome excretory metabolites during infection as endproduct (Fig. 7).
DiscussionA significant association was found between virusinfected and mock infected cells at time intervals12, 24,and 48 h for metabolites Alanine, Lactate, Acetate,Glutamate, Tyrosine, Histidine, Phenylalanine, Creatine,Choline and Formate respectively released by cell duringinfection, which is highly significant (p < 0.01). Someinsignificant association was also found during the infec-tion period that cells did not use some proportion ofmetabolites after 12, 24 and 48 h, namely Glutamine andPhosphocholine (Fig. 3).Cell death through viruses is associated with inhibition
of cellular macromolecular synthesis and changes incellular morphology. The morphological changes are notdirect consequences of viral inhibition of host macro-molecular synthesis [21]. All cellular components were
utilized as time was increased, whereas cell lipid compo-nents like phosphatidylcholines, phosphatidylethanol-amine, cholesterol, backbone of glycerol and someadditional functional group lipid (−CH = CH-), lipid(=CH-CH2-CH=), lipid (−CH2COO-), lipid (=CH-CH2-CH2), lipid (−CH2-CH2-CH), and lipid (−CH3) wereincreased. Thus, these results clearly indicating that EV30virus does not utilize cell lipids during its viral particlesynthesis, in spite of all other cellular components beingutilized when cellular damage takes place, as observed bythe optical microscopy (Fig. 1). Cell lipid components like,phophatidylethanolamine and phospholipids were alsoincreases in Adenoviruses infected on HEK cell along withuninfected cells [22]. Fetal bovine serum in the mediumhelps the maintenance of viability of the virus to about thesame level as observed in medium containing calf serum;therefore, bovine serum was used for this study. Thestimulatory effect of sodium oleate on Japanese encephal-itis virus growth is clearly shown, where the viral infectivitywas almost 50-fold higher in the presence of 9-18:1 (20 μgml−1) than in control medium [23]. It may be noted thatE30 does not contain envelop in its outer structure sounable to utilize cell lipids during its viral particle synthe-sis, 1H NMR results indicate an increase in the cell lipidsas time was increased. This hypothesis could account forthe increase of enterovirus growth in the presence of fetal

Fig. 7 Time interval showing changes in Metabolites after infection in cells
Tiwari and Dhole Virology Journal (2017) 14:144 Page 8 of 10
bovine serum in the medium, in addition to the virus pro-tective effect of the FBS. There would be one possible rea-son for increasing concentration of cell lipid with infectiontime that is the cell death, which is normally an increase ina programmed cell death. A rounding of the cells whencome in contact with an antigen and, when mixed in sus-pension, by the inability of cells to spread normally [24],manifests this phenomenon. Presumably, these effects canbe related to changes in cellular membranes and arereflected in the alteration in the lipid metabolism noted.Interestingly, the intensity of the total lipid signals in
the spectra of the cells was similar for the mock infected[25] and 12 h virus infected cells, whereas they graduallyincrease with virus infection time (Fig. 3). Jenkin andAnderson showed that the sodium salt investigationeffect of the fatty acids on viral growth without back-ground interference from the cell [15]. This correlates tothe fact that the total quantity of lipid is the same at alltime points of mock infected and gradually increased invirus infected cells, as determined from subsequent lipidextraction from whole cells in Fig. 5. It is clearly seenthat cell lipid were not utilized by the E30, a non-enveloped virus (Figs. 3, 4 and 5). Unraveling the effectsof biological perspective is important only if the intra-cellular environment can influence the properties of
metabolites. The most apparent difference between in-vitro sample and in-vivo is the solute concentration.Macromolecular solutes reach concentrations of hun-dreds of grams per liter in cells and other biologicalfluids, but most in-vitro studies are performed in thebuffered solution with <1% of the cellular macromol-ecule concentration. These conditions give optimal sig-nals, but may lack biological relevance [26].Aspartate and glutamate participate within the neuro-
transmitter family of substances which play importantrole in cell. Whereas glutamate is one of the mostimportant excitatory transmitters of central nervoussystem in lower animals and may also be important inhumans. Figure 3 shows that the extracellular metabo-lites released by cells after infection of E30; At 24 h postvirus infection concentration of aspartic acid was high,while it was not observed in mock infected cells andafter 48 h virus infection cells were consumed the glu-tamate and aspartic acid. Glutamate and aspartate arealso very important in the TCA cycle. Excitatory trans-mitters such as aspartate lead to depolarization of thenerves in humans; on the other hand, inhibitory trans-mitters cause hyperpolarization. When cells showed anapoptotic effect during infection and showed an adversestress effect. Some of the vital sources like alanine for
Tiwari and Dhole Virology Journal (2017) 14:144 Page 9 of 10
the production of protein, essential for proper functionsof the central nervous system cells and help form neuro-transmitters. In-vitro study of uninfected control and in-fected cell released the alanine in both conditions.Alanine increases during 12 to 24 h post virus infection(Fig. 3) but at 48 h post virus infection it consumedcompletely. The consumption of alanine is due to readilyconversion into glucose when sugar levels fall and aminoacids are liberated from cells to provide energy. Alaninemay help keep sugar levels stable during virus infectioncells. When the energy required for the cells, alanine isconverted into the glucose, and thus it may help to main-tain the sugar level. Alanine is one of the simplest aminoacid and is involved in the energy-production throughbreakdown of 7glucose. The cells utilized glucose throughglycolysis and TCA metabolic pathways to produce severalof the metabolic end products such as lactate, acetate andformate respectively into the extracellular medium [16].In –vitro cells study, the creatine was present in the
mock infected cells as well as virus infected cells. It wasgradually decreased because of the large number of celldeath after 48 h infection. The cells get creatine withsupplements from minimum essential media (Eagle’sMedia) for cell growth. It was interesting that a signifi-cant increase in the acetate incorporation into lipidscould be obtained even after infection with the virus.The specific activity of the extracted lipid from virusinfected cells and mock infected cells are compared. Theseresults suggested that the increased lipid metabolism mighthave not been induced by the infective virus, but by a com-ponent of the virus capsid. It is not known whether thislipid stimulation reflects the formation of membranesnecessary for these early events or an introduction to thelater synthesis and assembly of particles. It is of interestthat a similar increase in lipid synthesis has been describedin cells infected with vaccinia [27] and poliovirus [28, 29].
ConclusionThe present study shows the metabolomics of E30 infectedmammalian cells. The NMR analysis revealed no ambigu-ous signals using the RD cell line. The present protonNMR spectroscopic study, monitoring cellular meta-bolic changes during virus infection in cells, is useful inprobing the molecular mechanism of virus-cell interac-tions. The fact that the effects of viral infection couldbe observed through metabolic changes at much earlierstages than previously reported indicates an applicationfor NMR spectroscopy in studying cell-virus interac-tions. Regardless of the actual mechanism leading to cellshrinkage, it could have significance in late viral functions.In addition to the consumption of metabolites, the
virus-specific RNA and protein synthesis may also beaffected by cell shrinkage, the cellular concentration of
amino acids, nucleotide concentrations, and otherrequirements for macromolecular synthesis.
AbbreviationsCO2: Carbon Dioxide; D2O: Deuterium Oxide; E30: Echovirus 30;EVs: Enteroviruses; FBS: Fetal Bovine Serum; HCl: Hydrochloric acid; HEPES:N-2-hydroxyethylpiperazine-N0-2-ethanesulfonic acid; KCl: PotassiumChloride; MEM: Minimum Essential Medium; MgCl2: Magnesium Chloride;NMR: Nuclear Magnetic Resonance; PBS: Phosphate Buffered Saline;PFU: Plaque Forming Unit; RD: Rhabdomyosarcoma;TSP: TrimethylSilylPropionic acid
AcknowledgementsAuthor Sarika Tiwari is exceedingly grateful to the Indian Council of MedicalResearch, New Delhi, India for providing a Senior Research Fellowship, andboth authors are thankful to the World Health Organization for partialsupport. Thanks to Prof. Raja Roy for cooperation during the NMRexperiments and analysis. Both authors are also thankful to Mr. Rishi for hiskind assistance during experiments and writing of the manuscript,unfortunately he is no more in this world to read this manuscript.
FundingThis research did not receive any specific grant from funding agencies in thepublic, commercial, or not-for-profit sectors.
Availability of data and materialsAll data available in this article is supporting the results reported in apublished article can be found online (Pubmed, Medline or Google search).
Authors’ contributionsBoth authors contributed equally to this research work and writing of themanuscript. Both authors read and approved the final manuscript.
Ethics approval and consent to participateNot applicable.
Consent for publicationNot applicable.
Competing interestsThe authors declare that there is no competing interest regarding thepublication of this article.
Publisher’s NoteSpringer Nature remains neutral with regard to jurisdictional claims inpublished maps and institutional affiliations.
Received: 8 May 2017 Accepted: 21 July 2017
References1. Oberste MS, Maher K, Kennett ML, Campbell JJ, Carpenter MS, Schnurr D,
Pallansch MA. Molecular epidemiology and genetic diversity of echovirustype 30 (E30): genotypes correlate with temporal dynamics of E30 isolation.J ClinMicrobiol. 1999;37:3928–33.
2. Trallero G, Casas I, Tenorio A, Echevarria JE, Castellanos A, Lozano A, Brena PP.Enteroviruses in Spain: virological and epidemiological studies over 10 years(1988-97). Epidemiol Infect. 2000;124:497–506.
3. Lindon JC, Holmes E, Nicholson JK. Metabonomics and its role in drugdevelopment and disease diagnosis. Expert Rev Mol Diagn. 2004;4(2):189–99.
4. Nicholson JK, Wilson ID. Opinion: understanding ‘global’ systems biology:metabonomics and the continuum of metabolism. Nat Rev Drug Discov.2003;2(8):668–76.
5. Nicholson JK, Lindon JC, Holmes E. Metabonomics understanding themetabolic responses of living systems to pathophysiological stimuli viamultivariate statistical analysis of biological NMR spectroscopic data.Xenobiotica. 1999;29(11):1181–9.

Tiwari and Dhole Virology Journal (2017) 14:144 Page 10 of 10
6. Wang Y, Utzinger J, Xiao SH, Xue J, Nicholson JK, Tanner M. System levelmetabolic effects of a Schistosoma japonicum infection in the Syrianhamster. Mol Biochem Parasitol. 2006;146(1):1–9.
7. Dagan R, Jenista JA, Menegus MA. Association of clinical presentation,laboratory findings, and virus serotypes with the presence of meningitis inhospitalized infants with enterovirus infection. J Pediatr. 1988;113:975–8.
8. Carrasco L. Entry of animal viruses and macromolecules into cells. FEBS Lett.1994;350:151–4.
9. Caudai C, Bianchi Bandinelli ML, Lepri A, Valensin PE. Nuclear magneticresonance investigation of virus-lymphomonocyte interactions. NewMicrobiol. 1994;17:15–9.
10. Knipe DM, Samuel CE, Palese P. Virus–host cell interaction. In: Knipe DM,Howley PM, Griffin DE, Lamb RA, Martin MA, Roizman B, Straus SE, editors.Fields Virology. Philadelphia: Lippincott Williams & Walkins; 2001. p. 133–70.
11. Mountford CE, Grossman G, Hampson AW, Holmes KT. Influenza virus:an NMR study of mechanisms involved in infection.BiochimBiophysActa. 1982;720:65–74.
12. Stuart AD, McKee TA, Williams PA, Harley C, Shen S, Stuart DI, Brown TD,Lea SM. Determination of the structure of a decay accelerating factor-binding clinical isolate of echovirus 11 allows mapping of mutants withaltered receptor requirements for infection. J Virol. 2002;76:7694–704.
13. Valensin PE, Bianchi Bandinelli ML, Zazzi M, Gaggelli E, Valensin G.NMR investigation of cell cultures: early detection of infection by herpessimplex virus type 2 and transformation. Microbiologica. 1990;13:11–9.
14. Bissell MJ, White RC, Hatie C, Bassham JA. Dynamics of metabolism ofnormal and virus-transformed chick cells in culture. Proc Natl AcadSci USA.1973;70:2951–5.
15. Jenkin HM, Anderson LE. The effect of oleic acid on the growth of monkeykidney cells (LLC-MK2). Exp Cell Res. 1970;59:6–10.
16. Tiwari S, Singh RK, Bharti S, Roy R, Singh RK, Dhole TN. An in vitro study-Indian strain of Japanese encephalitis virus infection in porcine stablekidney cell using 1H NMR spectroscopy. International Journal ofExperimental Pharmacology. 2012;2(2):50–8.
17. Kilpatrick DR, Quay J, Pallansch MA, Oberste MS. Type-specific detection ofechovirus 30 isolates using degenerate reverse transcriptase PCR primers.J ClinMicrobiol. 2001;39:1299–302.
18. Folch J, Lees M, Sloane Stanley GH. A simple method for the isolation andpurification of total lipides from animal tissues. J BiolChem. 1957;226:497–509.
19. Talabardon M, Schwitzguébel JP, Péringer P. Anaerobic thermophilicfermentation for acetic acid production from milk permeate. J Biotechnol.2000;76:83–92.
20. Pintado J, Raimbault M, Guyot JP. Influence of polysaccharides on oxygendependent lactate utilization by an amylolytic lactobacillus plantarum strain.Int J Food Microbiol. 2005;98:81–8.
21. Eagle H. Amino acid metabolism in mammalian cell cultures. Science.1959;130:432–7.
22. McIntosh K, Payne S, Russell WC. Studies on lipid metabolism in cellsinfected with adenovirus. J Gen Virol. 1971;10:251–65.
23. Makino S, Jenkin HM. Effect of fatty acids on growth of Japaneseencephalitis virus cultivated in BHK-21 cells and phospholipid metabolismof the infected cells. J Virol. 1975;15:515–25.
24. Russell WC, Hayashi K, Sanderson PJ, Pereira HG. Adenovirus antigens–astudy of their properties and sequential development in infection.J Gen Virol. 1967;1:495–507.
25. Rothblat GH. Lipid metabolism in tissue culture cells. In: Paoletti P, Kritchevsky D,editors. Advances in lipid research. New York: Academic Press Inc; 1969.p. 135–63.
26. Charlton LM, Pielak GJ. Peeking into living eukaryotic cells with high-resolution NMR. Proc Natl AcadSci USA. 2006;103:11817–8.
27. Gaush CR, Youngner JS. Lipids of virus infected cells. II. Lipid analysis of HeLacells infected with vaccinia virus. Proc SocExpBiol Med. 1963;112:1082–5.
28. Cornatzer WE, Sandstrom W, Fischer RG. The effect of poliomyelitis virustype I (Mahoney strain) on the phospholipid metabolism of the HeLa cell.BiochimBiophysActa. 1961;49:414–5.
29. Penman S. Stimulation of the incorporation of Choline in poliovirus-infectedcells. Virology. 1965;25:149–52.
• We accept pre-submission inquiries
• Our selector tool helps you to find the most relevant journal
• We provide round the clock customer support
• Convenient online submission
• Thorough peer review
• Inclusion in PubMed and all major indexing services
• Maximum visibility for your research
Submit your manuscript atwww.biomedcentral.com/submit
Submit your next manuscript to BioMed Central and we will help you at every step: