metabolism of antarctic micronektonic crustacea - int … · metabolism of antarctic micronektonic...
TRANSCRIPT

Vol. 113: 207-219.1994 MARINE ECOLOGY PROGRESS SERIES Mar. Ecol. Prog. Ser.
Published October 27
Metabolism of Antarctic micronektonic Crustacea as a function of depth of occurrence and season
J. J. Torres', A.V. ~ a r s e t ~ , J. Donnellyl, T. L. ~opk ins ' , T. M. Lancraftl, D. G . Ainley3
'Dept of Marine Science, University of South Florida, 140 Seventh Ave. South, St. Petersburg, Florida 33701, USA 'Lilleveien 5, N-6006 h e s u n d , Norway
3Point Reyes Bird Observatory, 4990 Shoreline Hwy, Stinson Beach, California 94970, USA
ABSTRACT: Oxygen consun~ption rates were determined on 21 species of crustaceans typical of the Southern Ocean micronektonic crustacean assemblage during spring (November), fall (March), and winter (June-August). Specimens were collected in the Scotia-Weddell Sea region in the vicinity of 60" S, 40" W in the upper 1000 m of the water column. Respiration (y, p1 O2 m g ' wet mass h-') declined with depth of occurrence ( X , m) according to the equation y = 0.125 x - ~ - ~ ~ ~ ' ~ ~ ~ ~ (p < 0.05) despite the isothermal character of the water column, suggesting that lower metabolic rates are a temperature- independent adaptation to life in the deep sea. Three species of Crustacea showed a lowered meta- bolism during the winter season: the krill Euphausia superba and the 2 hyperiid amphipods Cyllopus lucasii and Vibilia stebbingi. Critical oxygen partial pressure (Pc) varied between 29 and 52 mm Hg, well below the lowest PO, found in the water column. It is suggested that the long nights of the Ant- arctic winter decrease the effectiveness of visual predation in the epipelagic zone, allowing lowered metabolic rates to be a viable overwintering strategy for some species.
KEY WORDS: Metabolism - Antarctic. Pelagic Crustacea . Overwinter
INTRODUCTION
The micronektonic crustacean fauna of the Southern Ocean is comprised of 2 distinct faunal groups: repre- sentatives of a cosmopolitan pelagic fauna (mainly deep living) and species which are found only in waters south of the Antarctic convergence (Nagata 1986, Iwasaki & Nemoto 1987, Lancraft et al. 1989, 1991). Virtually all of the groups considered to be classical midwater crustaceans, including the deep- living mysids and ostracods, are absent south of the Weddell-Scotia confluence, which coincidentally is the northward limit of winter sea ice in the Atlantic sector. The overall result of the faunal changes is that the character of a midwater trawl catch in the Antarctic is vastly different from that of other regions of the world ocean.
Three characteristics of the Antarctic pelagial are unique to the system. First, temperatures are uniformly cold in the horizontal and vertical planes. Sea surface temperatures vary between -1.87 and 0°C near the
continent to l to 4 "C near the convergence (Gordon et al. 1982). The remainder of the water column is nearly isothermal with temperatures changing less than 2°C between 100 and 1000 m. Second, sea ice cover expands and contracts with the seasons, altering the light field of the water column beneath it. In the Atlantic sector, winter sea ice extends to the Weddell- Scotia confluence, located at a latitude of approxi- mately 60" S, thus covering all of the Weddell Sea and part of the southern Scotia Sea at its maximum extent (Zwally et al. 1983). Third, day length varies with latitude from 0 to 6 h in winter to 18 to 24 h in summer (Smith & Sakshaug 1990). As a consequence, primary production varies from near zero in the winter months to local maxima of greater than 500 mg C m-2 d-' at the spring ice edge (Smith & Nelson 1990).
Pronounced seasonal changes in the physical and biological environment of the Southern Ocean alter the character of the resource spectrum available to the micronektonic Crustacea. Not only is winter primary production near zero (W. 0. Smith unpubl. data), pat-
O Inter-Research 1994 Resale of full article not permitted

208 Mar. Ecol. Prog. Se
terns of zooplankton distribution are quite different in the winter months; zooplankton biomass is reduced in the upper 100 m of the water column (Hopkins et al. 1993) with at least 2 of the dominant species of cope- pods descending to mesopelagic depths to overwinter in a diapause state (Hopluns et al. 1993). The seasonal changes in available food energy have a potentially profound influence on both feeding success and meta- bolic processes. The nature of that influence will vary with the trophic position of the species. For example, primarily herbivorous species such as Euphausia superba face several months of low algae production and therefore low food during the winter season. In contrast, deeper-living carnivorous species such as Pasiphaea scotiae might be expected to capitalize on the populations of diapausing copepods at meso- pelagic depths as a lipid-rich and non-motile food source (Alldredge et al. 1984, Everson 1984). It was the purpose of this study to describe the metabolic rates of a broad range of Southern Ocean micro- nektonic crustacean species of various taxa and depth distributions. The study was designed to provide basic information on metabolism of Antarctic species for comparison with those living in other ocean systems and to examine the influence of season on metabolic rate.
MATERIALS AND METHODS
Collection of specimens. Crustaceans were col- lected using either mouth-closing Tucker trawls (9.0 m2 or 2.25 m2 mouth area) or downward-looking, vertically deployed plummet nets (1 m2 mouth area). Tucker trawls were equipped with either blind or thermal-turbulence-protecting cod-ends (Childress et al. 1978); plummet nets terminated in blind cod-ends only. Specimens were taken in the upper 1000 m of the water column in the vicinity of the marginal ice zone during spring (November-December) 1983, fall (March) 1986, and winter (June-August) 1988 as part of the AMERIEZ (Antarctic Marine Ecosystem Research at the Ice Edge Zone) program to study ice edge biology. Sampling locations were all in the Scotia-Weddell Sea region but moved with seasonal movement of the pack ice edge. Thus, spring and winter collections were in the Scotia Sea in the vicinity of 60" S, 40" W; fall sampling took place further south, 65" S, 46" W. Col- lections were made on a continuum from deep in the pack ice out to 300 km seaward of the ice edge in fall and winter In spring, collections were made in the open water only. Station locations are given in Donnelly et al. (1990).
The entire catch from each deployment of the Tucker trawl was transferred into seawater at approximately
0°C immediately on reaching the deck. Plummet net catches were transferred as quickly as possible, typi- cally within 30 min. Indiv~duals were removed for respiratory measurements and placed in 28 1 cylin- drical tanks at a temperature of 0 to 1 'C, where they were held for not more than 3 h before being placed in respirometers. A 3 h holding time was chosen as the best compromise between allowing the individuals to recover from the stress of capture and minimizing any effects of prolonged starvation. All specimens used in respiratory measurements were in excellent condition: very lively and with no visible damage. Specimens in equivalent condition could be maintained indefinitely in the laboratory.
Respiratory measurements. Oxygen consumption rates were determined by allowing individuals to deplete the oxygen in a sealed container filled with fil- tered (0.45 pm pore size) seawater. Temperature was maintained at 0.5 "C (* 0. l 'Cj using a refrigeraleci water bath. Oxygen partial pressure (PO*) was contin- uously monitored using a Clark polarographic oxygen electrode (Clark 1956) as an individual reduced oxygen levels to low (10 to 20 mm Hg) partial pres- sures. Electrodes were calibrated using air- and nitrogen-saturated seawater at the experimental temperature. The time required for consumption of oxygen to low levels varied from 12 to 18 h. Strepto- mycin and Neomycin (each 25 mg 1-l) were added to the seawater to minimize microbial growth. To control for possible oxygen consumption by microorganisms, an individual was removed after selected runs, its volume was replaced with fresh seawater, and oxygen consumption was again measured for 2 to 4 h. In all cases microbial oxygen consumption was negligibly low.
Water-jacketed, rectangular, lucite chambers were used for intermediate-sized and larger (wet mass, WM >50 mg) individuals. In this design, a perforated lucite false bottom isolated the experimental subject from a stir bar; stir bars rotated at the minimum speed needed to assure proper function of the oxygen elec- trodes. Chamber sizes used for intermediate and larger-sized individuals varied from 50 to 1350 m1 depending on individual size. For example, intermedi- ate-sized krill (45 mm) were placed in chambers 200 to 250 m1 in volume. Individuals were allowed to swim freely within the confines of a chamber. Most often, after a brief period of high activity immediately follow- ing introduction into the chamber, individuals settled into a low-level sculling with the pleopods to maintain station at mid-depth in the chamber.
Smaller lucite chambers or plastic syringes were used to accomodate the smallest individuals. Micro- cathode oxygen electrodes were machined to act as plungers in the barrels of 10 m1 plastic syringes which

Torres et al.: Metabolism of Antarctic Crustacea 209
had had their ends cut off. The respiratory chamber within the syringe barrel was defined at one end by the syringe plunger and at the other by the oxygen elec- trode. Microcathode oxygen electrodes require no stirring; they were used in both the small lucite and syringe barrel respirometers. All experiments took place in the dark with brief periods of observation in low light.
Data were recorded using a computer-controlled digital data-logging system. Each oxygen probe was scanned once per minute, its signal averaged over a period of 1 S, and then recorded. Data were reduced by first averaging the 30 recorded values in each 30 min increment of an entire 12 to 18 h experiment, produc- ing 24 to 36 30-min points per run. Data obtained during the first hour were discarded due to the high activity of individuals just after introduction to the respirometer. All 30-min points thereafter, down to an oxygen partial pressure of about 60 mm Hg, were averaged to produce a routine rate for each individual. Maximum rates were the maximum 30-min rate and minimum rates the minimum 30-min rate recorded for each individual after the first hour, but above a PO2 of 60 mm Hg. Maximum rates were usually associated with the beginning of an experiment, minimum rates were most commonly recorded during the middle of a run. Critical oxygen partial pressures (Pc) were assigned at the PO2 where the oxygen consumption rate declined precipitously toward zero.
Data. Mass variability within many species was suffi- ciently large to necessitate breaking up the data into size classes (cf. Ikeda 1988). Size classes were arbi- trarily created by halving each order of magnitude change in mass, e.g. size class 1: 0.0000 to 0.0049 g, size class 2: 0.0050 to 0.0099 g, size class 3: 0.010 to 0.049 g, size class 4: 0.050 to 0.099 g, etc. Size classes are best illustrated in the data on Euphausia superba in Table 3.
Individual runs were grouped according to season and size class and tested for differences using either ANOVA or, if variances were not homogeneous, a Kruskal-Wallis test. Interspecific comparisons were done by using the data from the largest individual size class of each species in the spring or fall seasons. If there were no significant differences, the data for the 2 seasons were lumped to produce a common mean. In 5 cases winter data were used due to a lack of data for the other 2 seasons. Species for which total n < 3 were not used in statistical analyses; they are presented in Tables 1 to 4 for purposes of comparison only. Analyses were done using the summary data presented in Table 5. Regressions were done using the least- squares method. Analysis of covariance was performed using the methods outlined in Snedecor & Cochran (1967).
Mass-normalized respiratory data (a in Table 5) were calculated using a b-value of 0.75 to standardize to a mass of 1 g. Data were temperature corrected using a Qlo of 2.0. Minimum depths of occurrence (MDO, that depth below which about 90 % of the population lives; Childress & Nygaard 1973) for the species examined by Ikeda (1988) were taken from distribution data in Tables 1 to 4
Depth distributions. Vertical distributions were taken directly from Lancraft et al. (1989, 1991) or from unpublished data acquired on the species from the hundreds of opening-closing net tows executed during the AMERIEZ trawling program. Depths shown in Tables 1 to 5 are considered for purposes of analysis to be equivalent to minimum depth of occurrence. They are in fact the shallowest depth of capture for the species. Seasonal differences in vertical distributions were observed and these are reflected in the values reported in Tables 1 to 5.
RESULTS
Grammarid amphipods
Routine oxygen consumption rates varied from 0.015 1.11 O2 mg-' WM h-' in the large bathypelagic amphipod Euandania gigantea to 0.137 p1 0, mg-l WM h-' in the under-ice (sympagic) species Eusirus antarcticus (Table 1). Maximum rates were consis- tently about double the routine rates (X * SD, 2.07 + 0.82). Maximum to minimum ratios were more highly variable with an overall mean of 6.64 (k 5.91). Values for Pc were obtained for the 2 species of Cyphocaris, 33 and 31 mm Hg O2 for C. faueri and C. richardi respectively. Eusirus antarcticus showed a slightly higher value: 40 mm Hg 0,. The Pc-values exhibited by these 3 species are well below the minimum oxygen partial pressure found within their vertical range and within the Scotia-Weddell Sea region in general, ca 100 mm Hg (Gordon et al. 1982), suggesting that oxygen is not a limiting variable within the water column.
Data were available in 2 seasons for 3 species (Cyphocams faueri, C. richardi, and Parandania boecki) but only in P. boecki were there sufficient numbers in any one size class to attempt a seasonal comparison. No significant effect of season on routine metabolism was observed (p > 0.05, ANOVA).
Sufficient numbers and size differences were avail- able in the routine rates of Cyphocaris richardi to test for effects of mass on metabolism. The relation was described by the equation y = 0.068 x'.05 * 0.072 (b + SE, r2 = 0.968, p > 0.05), suggesting that metabolism scales directly with mass in this species.

210 Mar. Ecol. Prog. Ser. 113: 207-219, 1994
Table 1. Oxygen consumption rates of gammand amphipods All values expressed as mean (SD). To use conversion factors multiply wet-mass-specific rate by indicated value to yield dry-mass-speciflc or ash-free dry-mass-specific rates. Size classes and depth distributions determined as described in text. n: number of replicates used in determining routine rates. MDO: minimum depth of occurrence; Pc: critical oxygen partial pressure; WM: wet mass; DM: dry mass; AFDM: ash-free dry-mass. F: fall;
S: spnng, W: winter
Species (n) Season Mean Size wet mass class
(9)
Oxygen consumption rate (p1 O2 mg-l WM h-')
Routine Min. Max.
0.108 0.049 0.231
0.053 0.039 0.067 (0.024) (0.004) (0 003)
0.063 0.020 0.135 (0.020) (0.000) (0.001)
0.037 0.016 0.079
Pc Conversions (mmHg) DM AFDM
Cyphocans faueri (1) F
C. fauen (6) S
C. faueri (2) F
C. fauen (1) W
C. richardi (1) S C. richardi (2) W
C. richardi (3) S
C. richardi (2) F
Euandania gigantea (1) S
Eusirus antarcticus (26) F
E. microps (1) F
E. propeperdentatus ( 2 ) F
Parandania boecki (1) W
P. boecki (6) S
P. boecki (3) \V
As a group, the gammarids are well represented throughout the water column, showing minimum depths of occurrence from 0 to 1000 m. The eusirids predominate in the upper 100 m, with the cypho- carids dominating from 100 to 500 m. Below 500 m Parandania boecki is the most common gammarid, with Euandania gigantea being present, but very rare, below 1000 m. P. boecki and E. gigantea, the 2 deepest-dwelling species, show the lowest routine rates (Table l ) . The routine rates of species living above (Z = 0.090 p1 O2 mg-' WM h- ' ) and below (0.028 p1 O2 mg-' WM h-') 500 m are significantly different (Kruskal-Wallis, p < 0.05). If effects of mass are minimized by normalizing all rates to a mass of 1 g (see Table 5), the rates above and below 500 m remain significantly different (Kruskal-Wallis, p < 0.05). Rates expressed as dry or ash-free dry mass show no trend with depth.
Hyperiid amphipods
Routine rates varied from 0.051 p1 O2 mg-' WM h-' in the intermediate size class of Primno macropa during winter to 0.225 p1 O2 mg-' WM h-' in the smallest size class of P. macropa during fall (Table 2). Rates for the hyperiid amphipods tended to be higher on average than those of the gammarids (R = 0.121 vs 0.072 p1 O2 mg-' WM h-'). The difference was at least partially due to the fact that hyperiids also tend to be smaller Rates normalized to 1 g showed Iess of a difference: 0.074 p1 O2 mg-' WM h- ' for the hyperiids vs 0.054 for the gammarids (see Table 5). The ratio of maximum to routine rate in the hyperiids was 1.76 i 0.27 (Z 2 SD); maximum to minimum ratio was 4.40 i 2.54. Pc-values were similar to those of the gam- mands, ranging from a low of 29 mm Hg O2 in Vibilia stebbingi to 41 mm Hg O2 in Cyllopus lucasi.

Torres et a1 - Metabolism of Antarctic Crustacea 211
Table 2. Oxygen consun~ption rates of hyperiid amphipods. All values expressed as mean (SD). See Table 1 for abbreviations
Species (n) Season M D 0 Mean Size Oxygen consumption rate Pc Conversions (m) wet mass class (p1 O2 mg- ' WM h- ') (mm Hg) DM AFDM
(S ) Routine Min. Max.
Cyllopus lucasii (4) F 0 0.048 3 0.200 0 076 0.328 3.19 3 82 (0.008) ( 0 047) ( 0 032) (0.135)
C. lucasii (1) W 0 0.043 3 0.175 0 015 0.317 4.46 5.64
C lucasii (2) S 0 0.149 5 0.210 0 189 0.354 2.75 3.24 (0 021) (0.047) (0 070) (0.115)
C. lucasii (5) F 0 0 197 5 0.149 0 119 0.353 3.19 3.82 (0 059) (0.023) (0 015) (0.059)
C. lucasii (6) W 0 0.189 5 0.115 0 050 0.175 4.46 5.64 (0 019) (0.023) (0 039) (0.029)
Hyperoche medusarum (2) F 0 0.072 4 0 105 0.027 0.210 5.39 6.86 (0.002) (0.012) (0.004) (0.007)
Primno macropa (3) F 50 0.034 3 0.225 0.121 0.388 3.40 4.32 (0.014) (0.010) (0.036) (0.051)
P macropa (1) W 50 0.026 3 0.214 0.019 0.558 4.25 5.38
P macropa (10) F 50 0 061 4 0.154 0.061 0.268 3.40 4.32 (0.008) (0.060) (0.034) ( 0 078)
P. macropa (1) W 50 0.056 4 0.051 0.006 0 108 4 25 5.38
P. macropa (6) F 50 0.129 5 0.148 0.086 0 234 3.40 4.32 (0.007) (0.045) (0.031) (0 072)
Themisto gaudichaudi (2) W 0 0.091 4 0.133 0.034 0.211 4.73 5.81 (0.003) (0.016) (0.004) (0 029)
T. gaudichaudi (2) W 0 0 3 1 4 5 0.054 0.010 0 109 5 19 6.87 (0 03 1) (0.013) (0.007) (0.001)
Vibilla s tebbing~ (4) F 0 0.048 3 0.166 0.115 0.277 4 .18 5.29 (0.010) (0.026) (0.027) (0.040)
V stebbingi (8) W 0 0.033 3 0.088 0.041 0.181 4.33 5.25 (0.010) (0.027) (0.026) (0.056)
V stebbingi (2) F 0 0.117 5 0.148 0.078 0.202 35 4.80 6.34 (0.003) (0.004) (0,010) (0.002)
Sufficient data were available in 1 size class to test for the effects of season in 2 species, Cyllopus lucasi and Vibilia stebbingi. C. lucasi showed a significant decline from spring to fall and from fall to winter (p < 0.05, ANOVA). V. stebbingi showed a significant decline from fall to winter (p < 0.05, ANOVA).
The relation of metabolism ( y , m1 ind.-' h-') to mass (X, g) in Primno macropa for the fall season was described by the equation: y = 0.401 X 0.773 * ( b + S E , r2 = 0.585, p < 0.001), suggesting that mass-specific metabolism declines with increasing mass.
The hypenid species shown in Table 2 are widely distributed in the upper 500 m of the water column; their vertical profile virtually always includes a strong component in near-surface waters (Lancraft et al. 1989, 1991), which precludes any analysis for effects of depth of occurrence. Themisto gaudichaudii excepted, they are most similar to the sympagic gammarid amphipod Eusirus antarcticus in size and routine rate.
Euphausiids
Routine rates varied from 0.062 p1 O2 mg- ' WM h- ' in the largest size class of Euphausia superba during winter to 0.250 p1 O2 mg-' WM h- ' in size class 3 during fall (Table 3) . Rates for E. triacantha (0.101 to 0.127 p1 O2 mg- ' WM h-') and Thysanoessa inacrura (0.123 to 0.216 p1 O2 mg-' WM h- ') fell in the mid- range of these values (Table 3) . Ratios of maximum to routine rates (1.81 * 0.37) and maximum to minimum rates (5.56 + 3.40) were similar to those of the amphi- pods. Pc-values were obtained for a variety of size classes of E. superba and ranged from 30 to 52 mm Hg 02. Pc values for T. macrura were similar, ranging from 32 to 40 mm Hg 02. Like the amphipods, aerobic respi- ration in euphausiids is not limited by ambient PO2.
Sufficient data were available to examine the effects of season on routine metabolism in Euphausia superba. Two methods of comparison were used. In the first, the

212 Mar. Ecol Prog. Ser. 113: 207-219, 1994
Table 3. Oxygen consumption rates of euphausiids. All values expressed as mean (SD). See Table 1 for abbrev~ations
Species (n) Season M D 0 Mean Size (m) wet mass class
- (g)
Euphausia superba (9) W 0 0.003 1 (0.001)
E. superba (6) W 0 0.006 2 (0.001)
E superba (1) S 0 0.017 3
E. superba (4) F 0 0.036 3 (0.007)
E. superba (2) W 0 0.017 3 (0.000)
E. superba (2) F 0 0.060 4 (0.000)
E. superba (1) W 0 0.056 4
E. superba (3) S 0 0.413 5 (0.107)
E. superba (3) F 0 0.382 5 (0.039)
E. superba (27) W 0 0.280 5 (0.112)
E. superba (7) S 0 0.780 6 (0.155)
E. superba (5) F 0 0.701 6 (0.104)
E. superba (17) W 0 0.618 6 (0.071)
E. superba (2) S 0 1.118 7 (0.068)
E. superba (1) W 0 1.120 7
E triacantha (5) W 50 0.058 4 (0.019)
E. triacantha (2) W 50 0.154 5 (0.007)
Thysanoessa macrura (10) W 50 0.033 3 (0.006)
7 macrura (1) F 100 0.075 4
T macr~lra (10) W 50 0.071 4 (0.011)
Tmacrura (6) W 50 0 129 5 (0.029)
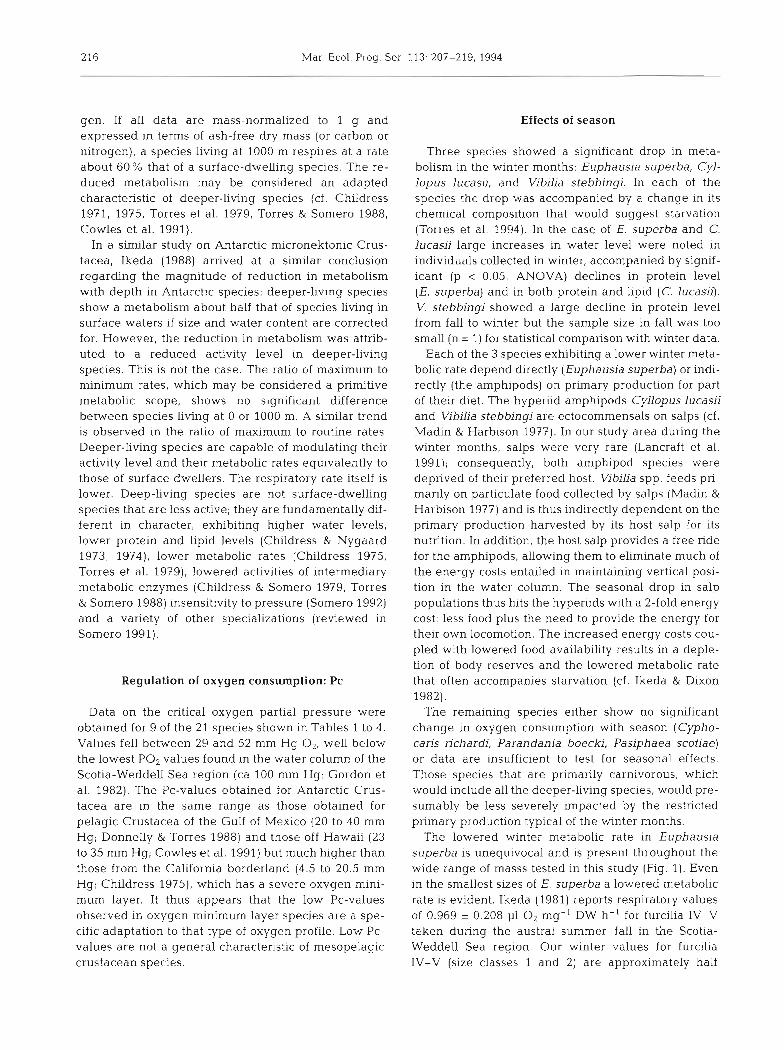
size class for whlch the greatest quantity of data were available (size class 6) was compared across all 3 seasons. Spring and fall data were not significantly different (p > 0.05, ANOVA); these were lumped and compared to winter data using ANOVA. The mean routine rate for spring/fall (0.152 + 0.022 p1 O2 mg-' WM h- ' ; F + 95 % CL) was significantly different from the winter rate (0.066 + 0.018 pl O2 mg-' WM h- ') (p < 0.001, ANOVA). The second comparison that was made was of the regression lines of routine rate versus mass for the spnng/fall data and the winter data using ANCOVA (Fig. 1). ANCOVA compares 3 properties of regression lines: the residual variances, the slope, and
Oxygen consumption rate (p1 O2 rng-l WM h-')
Routine Min. Max. -
0.171 0.046 0.312 (0.037) (0.043) (0.084)
0.146 0.057 0.343 (0.029) (0.019) (0.124)
0.229 0.097 0.265
0.250 0.062 0.357 (0.066) (0.063) (0.045)
0.248 0.030 0.446 (0.026) (0.008) (0.021)
0.159 0.062 0.357 (0.033) (0.039) (0.045)
0.105 0.041 0.217
0.133 0.065 0.211 (0.014) (0.023) (0.036)
0.152 0.067 0.242 (0.057) (0.063) (0.050)
0.071 0.018 0.148 (0.019) (0 011) (0.057)
0.14: 0 097 0.199 (0.027) (0.026) (0.069)
0.166 0.099 0.248 (0.064) (0.049) (0.090)
0.067 0.021 0.153 (0.021) (0.012) (0.050)
0.174 0.122 0.261 (0.004) (0.013) (0.017)
0.062 0.033 0.118
0.127 0.055 0.226 (0.015) (0.030) (0.049)
0,101 0.062 0.138 (0.025) (0.021) (0.042)
0.179 0.038 0.400 (0 035) (0.023) (0.072)
0.216 0.030 0.381
0.145 0.058 0.276 (0.045) (0.030) (0.084)
0.120 0.051 0.259 (0.015) (0.023) (0.099)
Pc Conversions (mm Hg) DM AFDM
3.38 3.73
3.44 3.86
3 68 4.36
2.90 3.26
3.37 3.91
3.25 3.69
3.33 3.68
3.68 4.36
4.53 5.23
4.07 4.67
3 68 4.36
3.43 3.72
4.63 5.38
3.68 4.36
3.68 4.09
3.94 4.66
3.90 4.70
3.25 3.61
2.86 3.12
3 2 3.37 3.81
4 0 3.53 4.12
the elevation of the lines. The residual variances and slopes were not significantly different (p > 0.05) but the point of comparison most relevant to a lowered winter metabolic rate, the elevations of the lines, was signifi- cantly different (p < 0.05). Analysis of the seasonal data using both ANOVA and ANCOVA strongly suggests that metabolic rate is lowered in E. superba during the winter season. The difference is not subtle; winter metabolic rates are about 45 % of those in the spring and fall in the larger size classes.
The relation of routine rate (y, m1 O2 ind.-' h - ' ) to wet mass (X, g) in Thysanoessa macrura during the winter season was described by the equation: y =

Torres et al.. Metabolism of Antarct~c Crustacea 213
0 . 3 5 2 ~ 0.786*0098 ( b * SE, r2 = 0.727, p < 0.001). The routine rate of T. macrura thus scales with mass in a conventional manner.
The euphausiids, like the hyperiids, are dis- tributed throughout the upper 500 m of the water column with a large fraction of the population found in surface waters, particu- larly in Euphausia superba. Their routine rates are similar to the shallow-dwelling hyperiids and gammarids.
Decapods
Routine rates in the decapods showed little variability between species. Petalidium foli- aceum had the lowest rate (0.036 p1 O2 mg-' WM h-') and Gennadas kernpi the highest (0.056 p1 O2 mg-' WM h-') (Table 4). Ratios of maximum to routine rate (2.64 0.58) were similar to those observed in the other groups; maximum to minimum were somewhat higher (9.24 % 4.67).
INDIVIDUAL WET MASS (rng)
Fig. 1. Oxygen consumption rate of Euphausia superba as a function of season. (D) Spnng/fall values; (0 ) winter values. Slopes are expressed * standard error. Regressions were fitted using the least squares
method; lines are significantly different (p 0.01, ANCOVA)
Table 4. Oxygen consumption rates of decapods, isopods, mysids and ostracods. All values expressed as mean (SD). See Table 1 for abbreviations
Group Season MD0 Mean Size Oxygen consumption rate Pc Conversions Species (n) (m) wet mass class (.p1 0, mg-' WM h-') (mmHg) DM AFDM
(9) Routlne Min Max.
Decapoda Gennadas kempi (1) W 1000 0.231 5 0.051 0.014 0.101 3.91 4.19 G. kempi (3) W 1000 1.039 0.056 0.008 0.101 3.53 3.85
(0.111) (0.010) (0.005) (0.026) Petalidium foliaceum (2 ) W 1000 1 .l64 0.036 0.009 0.100 3.30 3.57
(0.206) (0.019) (0.006) (0.058) Pasiphaea scotiae (71 S 100 5.471 1 0.037 0.021 0.049 3.02 3.16
(1.563) (0.004) (0.004) (0.006) P. scotiae (3) W 1000 1.898 0.043 0.010 0.109
(1.058) (0.005) (0.003) (0.0421
Isopoda
2.59 2.82 l Anuropus australis (1) S 100 0.772 6 0.025 0.007 0.043 6.60 8.30 A. australis (1) F 100 0.714 6 0.042 0.006 0.087 6.60 8.30 A. australis (1) S nd 2.258 7 0.029 0.008 0.041 6.60 8.30
Mysidacea Gnathophausia gigas (2) S 1000 0.503 0.053 0.009 0.059 2.72 4.17
(0.250) (0.011) (0.001) (0.007) G. gigas (1 ) W 1000 0.363 1 0.041 0.027 0.050 4.00 4.64 G. gigas (2) W 1000 6.321 1 0.038 0.013 0.069 3.65 4.61
(0.138) (0.003) (0.007) (0.021)
Ostracoda Gigantocypns mulleri (2) S 500 0.594 0.016 0.007 0.029 10.00 12.50
(0.002) (0.001) (0.005) (0.004) G. mulleri ( 2 ) S 500 1.220 0.012 0.007 0.020 30 10.00 12.60
(0.044) (0.003) (0.003) (0.003) G. mulleri (2) W 500 1.690 0.009 0.002 0.026 13.18 17.43
(0.558) (0.002) (0.001) (0.004)

Tab
le 5
. Sum
mar
y o
f res
pira
tion
in A
ntar
ctic
mic
rone
kton
ic c
rust
acea
ns. V
alue
s ar
e fo
r th
e la
rges
t siz
e cl
asse
s o
f eac
h sp
ecie
s, a
: rou
tine
rat
e co
rrec
ted
to 1
g; n
d: n
o da
ta.
Con
vers
ion
fact
ors
and
abbr
evia
t~on
s are
as
in T
able
s 1 to
4
Gro
up
Seas
on
MD
0
Mea
n O
xyg
en c
onsu
mpt
ion
rate
C
onve
rsio
ns
Spec
ies
(n)
wet
mas
s (p
1 O
2 m
g-'
WM
h-'
) (9
) R
outi
ne
Min
. M
ax.
a D
M
AF
DM
P
rote
in
Car
bon
Nit
roge
n
Am
phip
oda
(Gam
mar
idea
) C
ypho
cari
s fa
ueri
(8)
S
, F
4 0
1.24
3 0.
055
0.0
36
0.
083
0.05
8 4.
24
5.42
2
0.9
4
10.7
8 8
3.0
9
(0.4
00)
(0.0
23)
(0.0
04)
(0.0
05)
C. r
icha
rdi
(5)
S, F
3
40
0
.50
5
0.0
93
0.
036
0.1
52
0.
078
3.97
5
.18
1
7.6
0
10
.36
6
7.2
9
(0.1
74
) (0
.01
7)
(0.0
20
) (0
.030
)
Eus
irus
anl
artl
cus
(26
) F
0
0.04
7 0.
137
0.0
54
0.
279
0.06
4 2
.56
3.
03
nd
nd
(0.0
09
) (0
.02
7)
(0.0
26
) (0
.084
) n
d
l P
aran
dani
a bo
ecki
(6
) S
50
0
0.46
5 0
.04
1
0.02
3 0
.06
1
0.03
4 6.
13
8.64
2
9.1
2
16.9
3 10
7.05
(0
.11
7)
(0.0
16)
(0.0
18)
(0.0
21)
Am
phip
oda
(Hyp
erii
dea)
C
yllo
pus
luca
sii
(5)
F 0
0.19
7 (0
.059
) P
rim
no r
nacr
opa
(6)
F
0 0.
129
(0.0
07)
The
mis
to g
audi
chau
dii
(2)
W
0 0.
314
(0.0
31
) V
ibil
ia s
tebb
lngl
(2
) F
0
0.11
7 (0
.00
3)
Dec
apod
a C
enna
das
kem
pi
(3)
W
1000
1.
039
0.0
56
0
.00
8
0.10
1 0.
057
3.53
3.
85
nd
nd
nd
(0.1
11)
(0,0
10)
(0.0
05)
(0.0
26)
Pas
ipha
ea s
cotl
ae (
2)
S 1
00
5.
471
0.03
7 0
.02
1
0.04
9 0
.05
6
3.02
3.
16
10.2
7 5.
40
36.8
5 (1
.563
) (0
.004
) (0
.004
) (0
.006
)
Eup
haus
iace
a E
upha
usia
sup
erba
(7
) S
0 0.
780
0.1
41
0.
097
0.19
9 0.
133
3.68
4.
36
8.98
8
85
44.1
2 (0
.155
) (0
.027
) (0
.026
) (0
.069
) E
. tr
iaca
ntha
(2
) W
5
0
0.15
4 0
.10
1
0.0
62
0
.13
8
0.06
3 3
.90
4.
70
10.9
0 1
0.1
9
38
.35
(0
.00
7)
(0.0
25)
(0.0
21
) (0
.04
2)
Thy
sano
essa
mac
rura
(1
0)
W
50
0
.07
1
0.1
45
0.
058
0.2
76
0.
075
3.3
7
3.8
1
10
.89
7
.66
4
0.5
0
(0,0
11
) (0
.04
5)
(0.0
30
) (0
.08
4)
lsop
oda
Anu
ropu
s au
stra
lis
(3)
S,
F 10
0 1.
248
0.03
2 0.
007
0.05
7 0.
034
6.6
0
8.3
0
nd
nd
nd
(0.7
14)
(0.0
07)
(0.0
01)
(0.0
21)
Mys
idac
ea
Gna
thop
haus
ia g
igas
(3
) S
, W
1000
0.
456
0.0
49
0.
015
0.05
6 0
.04
0
3.47
4
.22
23
.04
6.79
7
1.9
9
(0.2
14)
(0.0
1 1)
(0
.009
) (0
.007
)
Ost
raco
da
Gig
anlo
cypr
is m
ulle
n (2
) S
50
0
1.22
0 (0
.04
4)

Torres et al.: Metabolism of Antarctic Crustacea 215
The decapods as a group are found at greater depths than the majority of the amphipods and euphausiids (Table 5) and they also are larger; both conditions result in a lower mass-specific metabolism. If rates nor- malized to 1 g are compared, the average value for the decapods (0.050) is similar to that of the gammarids (0.054), but lower than that of the euphausiids (0.090) and hyperiids (0.074).
Isopods, mysids, and ostracods
Each of these 3 orders is represented by 1 species. The giant ostracod, Gigantocypris mulleri, shows the lowest routine rate of the 3 and of the entire suite of Antarctic mesopelagic Crustacea shown in Tables 1 to 4: 0.009 p1 O2 mg-' WM h-' (Table 4). The highest rate of the 3 is exhibited by Gnathophausia gigas: 0.053 p1 O2 mg-' WM h-'. The rates of the 3 species are most similar to the decapods, which have a similar depth distribution, and to the deeper dwelling gam- marids (Table 5).
Overall trends
The relation of routine rate (y, p1 O2 mg-' WM h- ') to depth of occurrence (X, m) for the entire data set is described by the equation: y = 0.125x-0'72*0052 ( b & SE), r2 = 0.434, p < 0.05. There is also a sig- nificant decline of metabolism with depth in rates expressed as a function of dry mass (y = 0.461 X-' '35*0.037, r 2 = 0.477, p < 0.05) and ash-free dry mass ( y = 0 . 5 6 3 ~ - ~ ~ ' ~ ~ * ~ ~ ~ ~ ~ , r2 = 0.471, p < 0.05), al- though the slope in the latter 2 cases is only 78% that of the routine rate. If routine rates are normalized to 1 g to ameliorate the effects of increasing mass with depth (a in Table 5), the resulting line is described by the equation: y = 0 . 0 8 2 0 ~ - " ~ ' ~ * ~ ~ ~ ~ ~ , r 2 = 0.331, p < 0.05. Similarly, if normalized rates are expressed as dry mass (y = 0.300x-0073*0~029, r2 = 0.318, p < 0.05) or ash-free dry mass (y = 0.372 x -~ ."~* r2 = 0.307, p < 0.05) the decline is still significant with a slope 67 % of that for the routine rates. Thus, about 35% of the ob- served decline in rates may be ascribed to increased mass in deeper-living species; 20 to 30% may be as- signed to the increased water content of deeper species.
The b-value used to normalize masses to 1 g, 0.75, was chosen because it is the most widely accepted slope ( b ) in the equation describing the relationship of metabolism (y) and mass (M): y = &/lb, where a is a proportionality constant (cf. Burggren & Roberts 1991). However, the choice of b clearly influences the contribution of mass to the decline in metabolism with
depth. A b-value of 1.0 would erase any contribution of mass to the depth-related decline; a b-value of 0.67 would accentuate it. For purposes of comparing meta- bolism over the different taxonomic categories pre- sented here it was deemed most important to treat all species the same way, hence the use of the historically accepted figure of 0.75 for normalizing metabolism to a mass of 1 g. With our currently imperfect under- standing of the influence of mass on metabolism (cf. Heusner 1982, 1987), this approach was a more rea- sonable course of action than ignoring the influence of mass altogether, since it does increase with increasing depth.
Data on chemical composition are available for 13 of the species (Table 5; Torres et al. 1994) which allows their rates to be expressed in terms of body carbon and body nitrogen (cf. Ikeda 1988). If mass-normalized data for the 13 species are analysed in a series of regressions similar to those described above, on a car- bon-specific basis: y = 0.943 X-' 138*0035, r2 = 0.578, p < 0.05, or nitrogen-specific basis: y = 5.346 x - ~ , ~ ~ ~ * ~ 03',
r2 = 0.482, p < 0.05, the decline of metabolism with depth remains significant.
Protein level (y, mg protein g-l AFDW) declines with depth (X, m) in the suite of micronektonic crus- tacean species examined here according to the rela- tionship: y = x - ~ . ~ ~ ~ ' ~ . ~ ~ ~ , r2 = 0.506. p < 0.05 (Torres et al. 1994). Protein-specific metabolism is approxi- mately constant. The reduced metabolism in deeper- living species is thus partially explained through a re- duction in the total muscle mass of deeper-living species rather than a change in the character of the muscle itself. This result contrasts with a similar analysis in fishes (Torres et al. 1979) in which deeper- living species showed a reduction in protein-specific metabolism with depth.
DISCUSSION
Respiration and depth
The relation of depth and metabolic rate observed in the present study is of particular interest due to the nearly isothermal character of the water column. Temperature varies by approximately 2 'C in the upper 1000 m on an annual basis (-1.87 to 0.25"C; Gordon et al. 1982). Results from this study suggest that wet-mass-specific oxygen consumption rate de- clines significantly with depth such that the meta- bolism of a species living at 1000 m is about 30 % that of a species living at the surface. The decline of me- tabolism with depth remains statistically intact whether the respiratory data are expressed as a func- tion of dry mass, ash-free dry mass, carbon, or nitro-
216 Mar. Ecol. Prog. Se
gen. If all data are mass-normalized to 1 g and expressed in terms of ash-free dry mass (or carbon or nitrogen), a species living at 1000 m respires at a rate about 60 % that of a surface-dwelling species. The re- duced metabolism may be considered an adapted characteristic of deeper-living species (cf. Childress 1971, 1975, Torres et al. 1979, Torres & Somero 1988, Cowles et al. 1991).
In a similar study on Antarctic micronektonic Crus- tacea, Ikeda (1988) arrived at a similar conclusion regarding the magnitude of reduction in metabolism with depth in Antarctic species: deeper-living species show a metabolism about half that of species living in surface waters if size and water content are corrected for. However, the reduction in metabolism was attrib- uted to a reduced activity level in deeper-living species. This is not the case. The ratio of maximum to minimum rates, which may be considered a primitive metabolic scope, shows no significant difference between species living at 0 or 1000 m. A similar trend is observed in the ratio of maximum to routine rates. Deeper-living species are capable of modulating their activity level and their metabolic rates equivalently to those of surface dwellers. The respiratory rate itself is lower. Deep-living species are not surface-dwelling species that are less active; they are fundamentally dif- ferent in character, exhibiting higher water levels, lower protein and lipid levels (Childress & Nygaard 1973, 1974), lower metabolic rates (Childress 1975, Torres et al. 1979), lowered activities of intermediary metabolic enzymes (Childress & Somero 1979, Torres & Somero 1988) insensitivity to pressure (Somero 1992) and a variety of other specializations (reviewed in Somero 1991).
Regulation of oxygen consumption: Pc
Data on the critical oxygen partial pressure were obtained for 9 of the 21 species shown in Tables 1 to 4. Values fell between 29 and 52 mm Hg 02, well below the lowest PO2 values found in the water column of the Scotia-Weddell Sea region (ca 100 mm Hg; Gordon et al. 1982). The Pc-values obtained for Antarctic Crus- tacea are in the same range as those obtained for pelagic Crustacea of the Gulf of Mexico (20 to 40 mm Hg; Donnelly & Torres 1988) and those off Hawaii (23 to 35 mm Hg; Cowles et al. 1991) but much higher than those from the California borderland (4.5 to 20.5 mm Hg; Childress 1975), which has a severe oxygen mini- mum layer. It thus appears that the low Pc-values observed in oxygen minimum layer species are a spe- cific adaptation to that type of oxygen profile. Low Pc- values are not a general characteristic of mesopelagic crustacean species.
Effects of season
Three species showed a significant drop in meta- bolism in the winter months: Euphausia superba, Cyl- lopus lucasii, and Vibilia stebbingi. In each of the species the drop was accompanied by a change in its chemical composition that would suggest starvation (Torres et al. 1994). In the case of E. superba and C. lucasii large increases in water level were noted in individuals collected in winter, accompanied by signif- icant (p < 0.05, ANOVA) declines in protein level (E. superba) and in both protein and lipid (C. lucasii). V. stebbingi showed a large decline in protein level from fall to winter but the sample size in fall was too small (n = 1) for statistical comparison with winter data.
Each of the 3 species exhibiting a lower winter meta- bolic rate depend directly (Euphausia superba) or indi- rectly (the amphipods) on primary production for part of their diet. The hyperiid amphipods Cyllopus lucasii and Vibilia stebbingi are ectocommensals on salps (cf. Madin & Harbison 1977). In our study area during the winter months, salps were very rare (Lancraft et al. 1991); consequently, both amphipod species were deprived of their preferred host. Vibilia spp. feeds pri- marily on particulate food collected by salps (Madin & Harbison 1977) and is thus indirectly dependent on the primary production harvested by its host salp for its nutrition. In addition, the host salp provides a free ride for the amphipods, allowing them to eliminate much of the energy costs entailed in maintaining vertical posi- tion in the water column. The seasonal drop in salp populations thus hits the hyperiids with a 2-fold energy cost: less food plus the need to provide the energy for their own locomotion. The increased energy costs cou- pled with lowered food availability results in a deple- tion of body reserves and the lowered metabolic rate that often accompanies starvation (cf. Ikeda & Dixon 1982).
The remaining species either show no significant change in oxygen consumption with season (Cypho- caris nchardi, Parandania boecki, Pasiphaea scotiae) or data are insufficient to test for seasonal effects. Those species that are primarily carnivorous, which would include all the deeper-living species, would pre- sumably be less severely impacted by the restricted primary production typical of the winter months.
The lowered winter metabolic rate in Euphausia superba is unequivocal and is present throughout the wide range of masss tested in this study (Fig. 1 ) . Even in the smallest sizes of E, superha a lowered metabolic rate is evident. Ikeda (1981) reports respiratory values of 0.969 0.208 p1 O2 mg-' DW h-' for furcilia IV-V taken during the austral summer-fall in the Scotia- Weddell Sea region. Our winter values for furcilia IV-V (size classes 1 and 2) are approximately half

Torres et al.: Metabolism of Antarc t~c Crustacea 217
(0.541 + 0.112, X + SD) those reported by Ikeda (1981). The phenomenon of a lowered winter metabolic rate in E. superba was first reported by Kawaguchi et al. (1986) in E. superba captured under coastal fast ice in Lutzow-Holm Bay. It has s.ubsequently been reported for krill captured in the vicinity of Palmer Peninsula (Quetin & ROSS 1991) and now for a wide size range of krill captured in the Scotia-Weddell Sea region.
The lower rate of Euphasia superba can be purely a function of starvation, which is certainly in evidence for the suite of krill examined in this study, or it can be a form of dormancy elicited by the physical conditions of the austral winter. Ikeda & Dixon (1984) report an increase in metabolism in krill with an increase in ingestion rate, but the magnitude of the effect is insuf- ficient to explain the rate reduction observed in the winter krill. However, Ikeda & Dixon (1982) report rates for starved krill that are identical with our winter rates. Preliminary data on RNA-DNA ratio (summer: 6.19 + 1.18; winter: 1.45 + 0.382; X + SD; Torres & Somero unpubl. data) and activity of the metabolic enzyme citrate synthase (summer: 1.56 + 0.37 pm01 substrate converted to product g-l WM min-l; winter: 0.274 + 0.221; X SD) show profound reductions in protein synthetic capacity and general metabolic activity in winter knll. Starvation is sufficient to pro- duce the magnitude of rate reduction observed in winter M1, but other physiological mechanisms may be responsible as well.
Comparison with other systems
Six studies have now addressed the metabolism of micronektonic Crustacea in widely disparate regions of the world ocean. Two of the studies took place in the sub-Arctic transitional waters of the California border- land (Childress 1975, Quetin et al. 1980), one in the subtropical waters of the Gulf of Mexico (Donnelly & Torres 1988), 1 in the subtropical waters of the Pacific central gyre near Hawaii (Cowles et al. 1991), and 2 in the polar waters of the Antarctic (Ikeda 1988, this paper). The taxonomic composition and life habits of the micronektonic Crustacea examined differ consid- erably between studies, mirroring the composition of the local fauna. However, a few generalizations can be made. Representation by the decapods increases with increasing sea-surface temperature at the study sites. Decapods comprised 13 % of the species examined in the Antarctic (this paper) and 93 % of those in the Gulf of Mexico. In the Pacific, decapods comprise 43 to 58 % of the species examined in the California borderland and 71 % of those examined off Hawaii. Representa- tion by the amphipods decreases with increasing sea- surface temperature with 50 % of the data set from the
Antarctic comprised of hyperiids and gammarids; they are not represented at all in the Gulf of Mexico and vary from 5 to 10% in data from the Pacific. Mysids, ostracods, and isopods comprise from 0% of the data set in the Gulf of Mexico to 30% in Hawaiian waters, with the remainder falling between 16 and 25%. The last major group, the euphausiids, vary from 4 to 7 % in all data sets outside the Antarctic, where they com- prise 19 % of the species. The fraction of those species that perform a diel vertical migration represented in each data set scales roughly with sea-surface tempera- ture, with 13 % of the Antarctic species showing a diel migration and 100% of those in the Gulf of Mexico migrating towards the surface on a diel basis. The remainder fall between 21 (California borderland) and 41 % (Hawaii). Deep-living (2500 m MDO) non- migrating species are most numerous in the 3 Pacific studies (58 to 65 % of the species), least numerous in the Gulf of Mexico (Ox), and intermediate in the Antarctic (25 %). Data from all 6 studies, with rates nor- malized to a mass of 1 g using a b-value of 0.75 and to a temperature of 0.5"C using a Qlo of 2.0, are pre- sented in Fig. 2.
All of the 6 data sets show a trend of declining metabolism with increasing species' depth of occur- rence in the mass- and temperature-corrected data (Fig. 2) . In 2 data sets, the curve for the mass- and temperature-corrected data is not significant (p > 0.05, ANOVA: Quetin et al. 1980, Donnelly & Torres 1988). In Donnelly & Torres (1988), the data set is comprised entirely of species that migrate strongly over inter- mediate depths in the water column. The species all exhibit a conventional response to temperature (Qlo = 2.2 for crustaceans examined collectively), inhabit a considerable depth range (600 to 1000 m), and possess shallow to intermediate MDOs (70 to 410 m; 67 % of species 5 200 m). The species composi- tion of the Gulf micronektonic Crustacea, the predom- inance of vertical migration as a foraging strategy, and the species' response to temperature result in a meta- bolic decline with depth largely due to temperature. When metabolic rates are normalized to OS°C, the decline is no longer statistically significant. Within the Gulf of Mexico, deep-living non-migrating species found at depths of 600 to 1000 m in the Pacific or Antarctic (e.g. Acanthephyra acutifrons, Gnatho- phausia gracilis, G. gigas, Gigantocypris agassizii) are found predonlinantly below 1000 m (Hopkins et al. 1989, Hopkins unpubl. data). Much of the observed decline in metabolism with depth in the data sets from the Pacific and Antarctic is due to the low metabolism exhibited in the deep-living, non-migrating species groups. In the Gulf, the lower half of the upper 1000 m is occupied largely by deeper-living, strongly migrat- ing species.

218 Mar. Ecol. Prog Ser. 113: 207-219, 1994
I from a 4.5-fold difference in metabolic
I CALIFORNIA BORDERLAND 1
/ HAWAII
LU (childrk 1975) .4 - y = 0.183~.0.302
ANTARCTIC
2 ---.L (Torres et a!J
/ = 0 082~-~-l l3
z - - 0.1 - .08
CALIFORNIA BORDERLAND (Quetin ef aL 1980) y = O.OMX-0 '35
0.01 , I I - 0.01 1 10 t o o 1000
DEPTH (m)
rate at the surface between the lowest and highest curve to a 1.8-fold differ- ence at 1000 m. The highly similar rates in the lower mesopelagic zone (500 to 1000 m, Fig. 2) , the similarity in ocean temperatures at those depths, and the fact that similar or identical species are ubiquitous at those depths suggest that metabolism of micronektonic Crustacea is essentially the same be- tween 500 and 1000 m thoughout much of the world ocean.
Selective pressures determining the metabolic character of micronektonic Crustacea appear to operate most strongly in the well-illuminated upper
Fig. 2. Respiration versus depth in crustaceans from the Antarctic, California layers of the water Data from borderland, Gulf of Mexico, and central Pacif~c near Hawaii. All values corrected the present study showing a meiabolic to a weight of 1 g using a b-value of 0.75 and to a temperature of 0.5"C using decline in species from a nearly iso-
a Qlo of 2.0 thermal water column, and the com- parison between systems discussed
Variability in data sets from the same ocean system is above, strongly support the contention that the meta- best illustrated with the pair of studies from the Cali- bolic decline observed in deeper-living Crustacea and fornia borderland (Childress 1975, Quetin et al. 1980) fishes (Torres et al. 1979, Torres & Somero 1988) is the and from the Antarctic (Ikeda 1988, this paper). Differ- result of a relaxation of selective pressures relating to vi- ent suites of species and different techniques were sual predation near the surface (cf. Childress et al. 1990, used by the investigators in each pair of studies. The Cowles et al. 1991). The absence of refugia in the data set of Quetin et al. (1980) when mass- and tem- pelagic environment dictates a need for a well devel- perature-corrected does not show a significant decline oped swimming ability in species dwelling in or migrat- with depth at the 0.05 level (p = 0.13) and differs from ing to near surface waters. Deeper-living species may Childress (1975) in having a lower intercept and lesser enjoy the luxury of energy-conserving lower metabolic slope (Fig. 2). The data set of Quetin et al. (1980) is a rates in the darkness typical of the lower mesopelagic subset of that of Childress (1975) with less representa- zone. tion by deep-living non-migrating species. The differ- Species dwelling in the Antarctic system are ences between the 2 studies illustrate the range of vari- afforded a seasonal relaxation in visual predation by ability to be expected within a system resulting from the long nights, or, at higher latitudes, the 24 h dark- the suite of species examined and the techniques ness of the Antarctic winter. In a similar manner to employed. Neither the slopes nor the intercepts are deep-living mesopelagic species, the lowered winter significantly different in the curves of Ikeda (1988) and metabolism observed in the present study in 3 epi- the present study (p > 0.05 Student's t ) , although pelagic species is best accommodated in an environ- Ikeda's curve lies below ours in Fig. 2 . ment where predation pressure is minimized by a
Two conclusions may be drawn by comparing the 6 cloak of darkness. curves in Fig. 2. The first is that the data do not support a case for metabolic temperature compensation among the micronektonic Crustacea in the sense of Scholander Acknowledgements. This paper is dedicated to Jose Torres
et al. (1953). The mass- and temperature-corrected (1920-1992)~ philosopher and scholar The research was sup-
curves generated for Antarctic species lie either well be- ported by NSF DPP 8420652, DPP 8819533, and OPP 9220493 to J.J.T. and T.L.H., INT 8903589 and DPP 9000608 to J.J.T.,
low or directly on top of those for lower latitude species. and pp 8419894 to D.G.A. We thank G. Sornero and S. Kaupp Absence of cold adaptation was also observed by for their time and expertise in teaching us the assays for LDH, Co\vles et al. (19911 in comwarina s ~ e c i e s from Hawaii CS, and RNNDNA. We thank the captains and crews of the RV
d .
and california ~h~ second conclusion that may 'Melville', 'Polar Duke', and the USCGC 'Glacier' for thelr sup- port. Kendra Daly has been an invaluable source of support
be drawn is that most of the between 'ystems both on board ship and during preparation. Many occurs in the top 200 m of the water column. Conver- thanks to our other coIleaques in the AMERIEZ proqram for . .
gence of the curves at greater depths results in a change sharing data and lending sipport at sea.

Torres et al.: Metabolism of Antarct~c Crustacea 219
LITERATURE CITED
Alldredge, A. L.. Robison, B. H , Fleminger, A , Torres, J J., King, J M , Hamner, M'. M. (1984) Direct sampling and in situ observation of a persistent copepod aggregation in the mesopelagic zone of the Santa Barbara Basin. Mar Biol 80: 75-81
Burggren, W.. Roberts. J L (1991). Respirat~on and meta- bolism. In: Prosser, C. L. (ed.) Environmental and metabolic a n ~ m a l physiology. Wiley-Liss, New York, p. 353-436
Childress, J. J (1971). Respiratory rate and depth of occur- rence of mdwate r animals Limnol. Oceanogr. 16: 104-106
Childress, J . J. (1975). The respiratory rates of midwater crus- taceans as a function of depth of occurrence and relation to the oxygen minimum layer off southern California. Comp. Biochem. Phyiol. 50A: 787-799
Chlldress, J. J. , Barnes, A. T., Quetin, L. B., Robison, B. H. (1978). Thermally protecting cod-ends for recovery of living deep-sea anmals . Deep Sea Res. 25: 419-422
Chddress, J. J . , Cowles, D. L., Favuzzi, J. A., Mickel, T J . (1990). Metabolic rates of ben thc deep-sea decapod crus- taceans decline %nth increasing depth primarily due to the dechne in temperature. Deep Sea Res. 37: 929-949
Childress. J. J. , Nygaard, M. H. (1973). The chemical composl- tion of midwater fishes as a function of depth of occurrence off Southern California. Deep Sea Res. 20. 1093-1109
Childress, J. J., Nygaard, M. H. (1974) Chemical composit~on and buoyancy of midwater crustaceans as a function of depth of occurrence off southern Cahfornla. Mar. Biol. 27. 225-238
Chddress, J. J., Somero, G. N. (1979). Depth-related enzymc activities In muscle, brain, and heart of deep-l~ving pelagic manne teleosts. Mar. Biol. 52: 273-283
Clark, L. C. (1956). Monitor and control of blood and tissue oxygen tensions. Trans. Am. Soc. Art. lnt. Orgs. 2. 41-48
Cowles, D. L., Childress, J. J. , Wells, M. E. (1991). Metabohc rates of rmdwater crustaceans as a function of depth of occurrence off the Hawaiian Islands: food availability as a selective factor? Mar. Biol. 110: 75-83
Donnelly, J. , Torres, J. J. (1988). Oxygen consumption of rmd- water fishes and crustaceans from the eastern Gulf of Mexico Mar. Biol. 97: 483-494
Donnelly, J. , Torres, J. J. , Hopkins, T. L., Lancraft, T. M. (1990). Proximate composition of Antarctic mesopelagic fishes Mar. Biol. 106: 13-23
Everson, 1. (1984). Manne zooplankton. In: Laws, R. M. (ed.) Antarctic ecology, Vol 2. Academic Press, London, p. 463-490
Gordon, A. L., Molinelll, E. J.. Baker, T. N. (1982). Southern Ocean atlas. Columbia University Press, New York
Heusner, A. A. (1982). Energy metabolism and body size. I. Is the 0.75 mass exponent of Kleiber's equahon a statistical artifact? Respir. Physiol. 48: 1-12
Heusner, A A. (1987). What does the power function reveal about structure and function in an~mals of different slze? A. Rev. Physiol. 49: 121-133
Hopkins, T. L., Gartner, J. V., Flock, M E. (1989). The caridean shnmp (Decapoda: Natantia) assemblage in the mesopelagic zone of the eastern Gulf of Mexico. Bull. mar. Sci. 45: 1-14
Hopkins, T. L., Lancraft, T M., Torres, J. J., Donnelly, J. (1993). Commuruty structure and t rophc ecology of zoo- plankton in the Scotia Sea marginal ice zone In wlnter (1988). Deep Sea Res. 40: 81-105
Ikeda, T. (1981). Metabolic activity of larval stages of Ant- arctic krill. Antarct. J. U.S 16(5): 161-162
Ikeda, T. (1988). Metabohsm and chemical composition of
Thls article was submitted to the editor
crustaceans from the Antarctic mesopelagic zone. Deep Sea Res 35: 1991-2002
Ikeda, T., Dmon, P (1982). Body shnnkage as a possible over- wintenng mechanism of the Antarctic knll, Euphausia superba Dana. J. exp mar. Biol Ecol 62- 143-151
Ikeda, T., Dixon, P. (1984) The influence of feeding on the metabolic activity of Antarctic knll (Euphausia superba Dana). Polar Biol. 3. 1-9
Iwasaki, N., Nemoto, T (1987). Distribution and community structure of pelagic shnmps in the Southern Ocean between 150" E and 115" E. Polar Biol. 8. 121-128
Kawaguchi, K , Ishikawa, S. , Matsuda, 0. (1986). The over- wintering strategy of Antarctic krill (Euphausia superba Dana) under the coastal fast ice off the Ongul Islands in Lutzow-Holm Bay, Antartica. Mem, natn Inst. polar Res. (spec. iss.) 44: 67-85
Lancraft, T. M., Hopkins, T. L., Torres, J. J., Donnelly, J . (1991). Oceanic rnicronektonic/macrozooplanktonic com- munity structure and feeding in ice covered Antarctic waters during the winter. Polar Biol. 11: 157-167
Lancraft, T M,, Torres, J. J., Hopluns, T. L. (1989). Micro- nekton and macrozooplankton in the open waters near Antarctic ice edge zones (AMERIEZ 1983 and 1986). Polar Biol. 9. 225-233
Madin, L. P., Harbison, G. R. (1977). The associations of Amphipoda Hyperiidae with gelatinous zooplankton. I . Associations with Salpidae. Deep Sea Res. 24: 449-463
Nagata, K. (1986). Amphipod crustaceans from surface waters of the Southern Ocean during 1983-1984 summer. Mem. natn. Inst. polar Res. (spec. iss.) 40. 259-276
Quetin, L B , Ross, R. M. (1991). Behamoral and physiological charactenstlcs of the Antarc t~c k r d , Euphausia superba. Am. Zool. 31: 49-64
Quetin, L. B. Ross, R. M., Uchio, K. (1980). Metabohc charac- teristics of rnidwater zooplankton: ammonia excretion, 0 : N rahos, and the effect of starvation. Mar. Biol. 59: 201-209
Scholander, P. F., Flagg, W., Walter, V., Irving, L. (1953). C h a t i c adaptation in arctic and tropical poikilotherms. Physiol. Zool. 26. 67-92
Smith, W. O., Nelson, D. M. (1990). Phytoplankton growth and new production in the Weddell Sea marginal ice zone dunng austral spring and autumn. Lmnol. Oceanogr. 35: 809-821
Smith, W. 0 , Sakshaug, E. (1990) Polar phytoplankton. In: Smith, W. 0. (ed.) Polar oceanography. Academic Press, New York, p. 477-526
Snedecor, G . W., Cochran, W. G. (1967). Statistical methods. Iowa State University Press, Ames
Somero, G. N. (1991). Hydrostatic pressure and adapta t~on to the deep sea. In: Prosser, C L. (ed . ) Environmental and metabolic animal physiology Wiley-Liss, New York, p. 167-204
Torres, J. J., Belman, B. W., Chddress, J. J. (1979). Oxygen consunlption rates of mdwate r fishes as a function of depth of occurrence. Deep Sea Res. 26: 185-197
Torres, J J., Donnelly, J. , Hopkins, T. L., Lancraft, T M., Aarset, A. V., Alnley, D. G. (1994). Prox~mate compositon and overwintering strategies of Antarctic micronektonic Crustacea. Mar. Ecol. Prog. Ser. 113: 221-232
Torres, J J., Somero, G . N. (1988). Metabolism, enzymic activities, and cold adaptation in Antarctic mesopelagic fishes. Mar. Biol. 98: 169-180
Zwalley, H. H., Cormso, J . C. , Parkinson, C. L., Campbell, W. J., Carsey, F. D., Gloerson, P. (1983). Antarchc sea ice. 1973-1976: satellite passive microwave observations. NASA spec. publ. 459. National Aeronautics and Space Administration, Washington, DC
Manuscnpt first received: July 26, 1993 Revised version accepted: July 18, 1994