metabolic profiling of intra- and extracranial carotid
TRANSCRIPT
Accepted Manuscript
Metabolic profiling of intra- and extracranial carotid artery atherosclerosis
Dina Vojinovic, Sven J. van der Lee, Cornelia M. van Duijn, Meike W. Vernooij,Maryam Kavousi, Najaf Amin, Ayşe Demirkan, M. Arfan Ikram, Aad van der Lugt,Daniel Bos
PII: S0021-9150(18)30129-1
DOI: 10.1016/j.atherosclerosis.2018.03.015
Reference: ATH 15423
To appear in: Atherosclerosis
Received Date: 24 November 2017
Revised Date: 7 February 2018
Accepted Date: 7 March 2018
Please cite this article as: Vojinovic D, van der Lee SJ, van Duijn CM, Vernooij MW, Kavousi M, AminN, Demirkan Ayş, Ikram MA, van der Lugt A, Bos D, Metabolic profiling of intra- and extracranial carotidartery atherosclerosis, Atherosclerosis (2018), doi: 10.1016/j.atherosclerosis.2018.03.015.
This is a PDF file of an unedited manuscript that has been accepted for publication. As a service toour customers we are providing this early version of the manuscript. The manuscript will undergocopyediting, typesetting, and review of the resulting proof before it is published in its final form. Pleasenote that during the production process errors may be discovered which could affect the content, and alllegal disclaimers that apply to the journal pertain.
MANUSCRIP
T
ACCEPTED
ACCEPTED MANUSCRIPT
1
Metabolic profiling of intra- and extracranial carotid artery atherosclerosis
Dina Vojinovica*, Sven J. van der Leea*, Cornelia M. van Duijna, Meike W. Vernooija,b, Maryam
Kavousia, Najaf Amina, Ayşe Demirkana,c, M. Arfan Ikrama,b,d, Aad van der Lugtb, Daniel Bosa,b #
a Department of Epidemiology, Erasmus University Medical Center, Rotterdam, the Netherlands
b Department of Radiology and Nuclear medicine, Erasmus University Medical Center, Rotterdam, the
Netherlands
c Department of Human Genetics, Leiden University Medical Center, Leiden, the Netherlands
d Department of Neurology, Erasmus University Medical Center, Rotterdam, the Netherlands
* These authors contributed equally to this work.
# Corresponding author:
Department of Radiology and Nuclear Medicine,
Department of Epidemiology, Erasmus University Medical Center
P.O. Box 2040, 3000 CA, Rotterdam, the Netherlands, internal postal address NA-2818
Visiting address: Wytemaweg 80, 3015 CN, Rotterdam, the Netherlands, room NA-2824K
E-mail [email protected] (D. Bos)
MANUSCRIP
T
ACCEPTED
ACCEPTED MANUSCRIPT
2
Abstract
Background and aims: Increasing evidence shows that intracranial carotid artery atherosclerosis may
develop under the influence of a differential metabolic risk factor profile than atherosclerosis in the
extracranial part of the carotid artery. To further elucidate these differences, we investigated associations
of a wide range of circulating metabolites with intracranial and extracranial carotid artery atherosclerosis.
Methods: From the population-based Rotterdam Study, blood samples from 1,111 participants were used
to determine a wide range of metabolites by proton nuclear magnetic resonance (NMR). Moreover, these
participants underwent non-contrast computed tomography of the neck and head to quantify the amount
of extra- and intracranial carotid artery calcification (ECAC and ICAC), as a proxy of atherosclerosis. We
assessed associations of the metabolites with ICAC and ECAC and compared the metabolic association
patterns of the two.
Results: We found that one standard deviation (SD) increase in concentration of 3-hydroxybutyrate, a
ketone body, was significantly associated with a 0.11 SD increase in (p=1.8×10⁻⁴) ICAC volume. When
we compared the metabolic association pattern of ICAC with that of ECAC, we observed differences in
glycolysis-related metabolite measures, lipoprotein subfractions, and amino acids. Interestingly,
glycoprotein acetyls were associated with calcification in both studied vessel beds. These associations
were strongest in men.
Conclusions: We found that higher circulating level of 3-hydroxybutyrate was associated with increase in
ICAC. Furthermore, we found differences in metabolic association patterns of ICAC and ECAC,
providing further evidence for location-specific differences in the etiology of atherosclerosis.
Keywords: metabolomics, atherosclerosis, carotid artery
MANUSCRIP
T
ACCEPTED
ACCEPTED MANUSCRIPT
3
Introduction
Carotid artery atherosclerosis is established as the single most important cause of stroke worldwide.1-4
Importantly, increasing evidence suggests that the specific location of carotid atherosclerosis, i.e.
extracranial versus intracranial, harbors unique, differential information with regard to the risk of
subsequent stroke.3, 4 In addition, it was also found that the contribution of traditional cardiovascular risk
factors to intracranial carotid artery atherosclerosis is different from that to extracranial carotid artery
atherosclerosis.5-7 In particular, diabetes mellitus and insulin resistance, i.e. expressions of disrupted
glucose and insulin metabolism, seem to play a more prominent role in the development of intracranial
carotid artery atherosclerosis.6, 8, 9 This apparent location-specific susceptibility to metabolic disturbances
warrants further in-depth investigation of the metabolic underpinnings of carotid artery atherosclerosis.
Interestingly, methods to perform such an in-depth investigation of large spectra of active metabolites in
relation to disease have only recently become available.10, 11 With the use of nuclear magnetic resonance
(NMR), metabolites can now be inexpensively and reproducibly quantified on a large-scale, which
enables metabolomics studies in large population-based cohorts. Successful examples include metabolic
profiling of type 2 diabetes,12, 13 and cardiovascular events.14-17
Applying a similar approach to carotid artery atherosclerosis may expose important metabolites
contributing to the disease. To date, several inflammatory markers have been associated with different
stages and manifestation of carotid artery atherosclerosis, such as interleukin-6 and tumor necrosis factor-
α.18, 19 Ultimately, this knowledge may provide opportunities for the development of specific therapeutic
and preventive strategies.
Hence, the aim of this study was to investigate associations of a broad range of metabolites with
intracranial and extracranial carotid artery calcification (ICAC and ECAC), as a proxy of atherosclerosis,
and to compare the metabolic association profile of ICAC with that of ECAC.
Materials and methods
MANUSCRIP
T
ACCEPTED
ACCEPTED MANUSCRIPT
4
Study population
Our study population consisted of participants from the Rotterdam Study, a prospective population-based
cohort study among individuals aged 45 years and over, who are living in the well-defined Ommoord
district in Rotterdam, the Netherlands.20 The study started in 1990, with 7,983 participants (first
Rotterdam Study cohort, RS-I), and was extended in 2000/2001 (RS-II, 3,011 participants) and 2006/2008
(RS-III, 3,932 participants).20 All participants were invited for extensive re-examinations every 3-4 years.
At each visit, blood was drawn after overnight fasting. The Rotterdam Study has been approved by the
Medical Ethics Committee of the Erasmus MC and by the Ministry of Health, Welfare and Sport of the
Netherlands, implementing the Wet Bevolkingsonderzoek: ERGO (Population Studies Act: Rotterdam
Study).20 All participants provided written informed consent to participate in the study and to obtain
information from their treating physicians.
Population for analysis
Metabolites were available for two independent datasets of the Rotterdam Study. The first set
encompassed all individuals from the RS-I cohort that participated in the fourth examination round at the
study center (N = 2,975). Of these, 730 underwent a computed tomography (CT) scan to visualize
calcification in the carotid arteries. The second dataset consisted of 768 participants from the RS-I, RS-II
and RS-III cohorts of whom 381 also underwent a CT scan. This dataset was the subset of samples
previously included in the Biobank-based Integrative Omics Studies Consortium (BIOS Consortium).20, 21
The CT scan was performed on average 4 months (interquartile range (IQR) 2-4 months) after metabolite
measuring for the first Rotterdam Study dataset, and 6 years (IQR 5.9-6.2 years) before metabolite
measuring for the second Rotterdam Study dataset.
Metabolite quantification
The metabolites were quantified from EDTA plasma samples using high-throughput proton Nuclear
Magnetic Resonance (NMR) metabolomics (Nightingale Health, Helsinki, Finland). This method
MANUSCRIP
T
ACCEPTED
ACCEPTED MANUSCRIPT
5
provides simultaneous quantification of metabolic measures, i.e. routine lipids, lipoprotein subclass
profiling with lipid concentrations within 14 subclasses, fatty acid composition, and various low-
molecular-weight metabolites including amino acids, ketone bodies and gluconeogenesis-related
metabolites in molar concentration units. The lipoprotein subclasses include very low-density lipoprotein
(VLDL), intermediate-density lipoprotein (IDL), low-density lipoprotein (LDL) and high-density
lipoprotein (HDL). In these subclasses, the concentration is measured as well as the subfraction of lipids,
triglycerides, cholesterol esters, free cholesterol, and phospholipids. Details of the experimentation and
applications of this NMR metabolomics platform have been described previously.22, 23 For this study we
analyzed in total 166 non-derived metabolites that were measured across both cohorts.
Assessment of atherosclerosis
A 16-slice (n = 785) or 64-slice (n = 1,739) multidetector CT scanner (Somatom Sensation 16 or 64;
Siemens, Forchheim, Germany) was used to perform non-enhanced scanning of intracranial and
extracranial carotid arteries to visualize calcification as a proxy of atherosclerosis. Detailed information
regarding the protocol and imaging settings is provided elsewhere.4 ICAC was semi-automatically
quantified from the horizontal segment of the petrous internal carotid artery to the top of the internal
carotid artery.8 Details of this quantification method were described previously.4 Briefly, regions of
interest were drawn in the course of the intracranial internal carotid arteries in consecutive CT sections.
Next, calcification volumes were calculated by multiplying the number of pixels in excess of 130
Hounsfield units by the pixel size and the increment.8 Calcification volumes in the extracranial internal
carotid arteries were quantified using dedicated commercially available software (Syngo Calcium
Scoring; Siemens).4 All calcification volumes are expressed in cubic millimeters.
Other measurements
Information on cardiovascular risk factors was obtained by means of interview, physical examination or
blood sampling. Hypertension was defined as a systolic blood pressure ≥140 mmHg, diastolic blood
MANUSCRIP
T
ACCEPTED
ACCEPTED MANUSCRIPT
6
pressure ≥90 mmHg, or use of medication for the treatment of hypertension.24 Diabetes was defined as
fasting plasma glucose levels above 7 mmol/L or use of medication indicated for the treatment of
diabetes.24 Hypercholesterolemia was defined as a total cholesterol ≥6.2 mmol/L or use of lipid-lowering
medication.24 BMI was calculated as weight in kilograms divided by square of height in meters. A history
of cardiovascular disease was defined as previous myocardial infarction, percutaneous transluminal
coronary angioplasty, coronary artery bypass graft or stroke.8, 24
Statistical analysis
The distributions of metabolic measures were visually inspected for non-normality and were, if necessary,
natural logarithmic transformed to obtain approximately normal distributions (Supplementary Table 1).
The metabolites were scaled to standard deviation (SD) units to enable direct comparisons of effect
estimates across the different measures. Because ICAC and ECAC volumes were non-normally
distributed, we used natural logarithmic transformed values. To deal with calcium volumes of zero we
added 1.0 mm3 to the non-transformed values. Subsequently, we scaled these new values to SD units to
unify reporting and interpretation of the results. To assess the relation of metabolites with ICAC and
ECAC per dataset, we performed linear regression analysis while adjusting for age, gender, and lipid-
lowering medication (Model 1). The associations were further adjusted for hypertension, diabetes,
hypercholesterolemia, smoking, and BMI (Model 2). Finally, we additionally adjusted for history of
cardiovascular disease (Model 3). The summary statistic results of the two datasets were meta-analyzed
using inverse variance-weighted fixed-effect meta-analysis. Additionally, all analyses were performed in
males and females separately.
As metabolic measures are highly correlated (median absolute correlation coefficient = 0.24, IQR = 0.11-
0.50), we used the method of Li and Ji25 to correct for multiple testing. The method calculates the number
of independent variables (and thus tests) in correlated measures. The 166 metabolites corresponded to 33
independent variables. Bonferroni correction was applied for the number of independent variables tested
(p value threshold for significance: 0.05 / 33 = 1.5 × 10⁻³). All analyses were performed with R (R Core
MANUSCRIP
T
ACCEPTED
ACCEPTED MANUSCRIPT
7
Team (2013). R: A language and environment for statistical computing. R Foundation for Statistical
Computing, Vienna, Austria (http://www.R-project.org/)).
Results
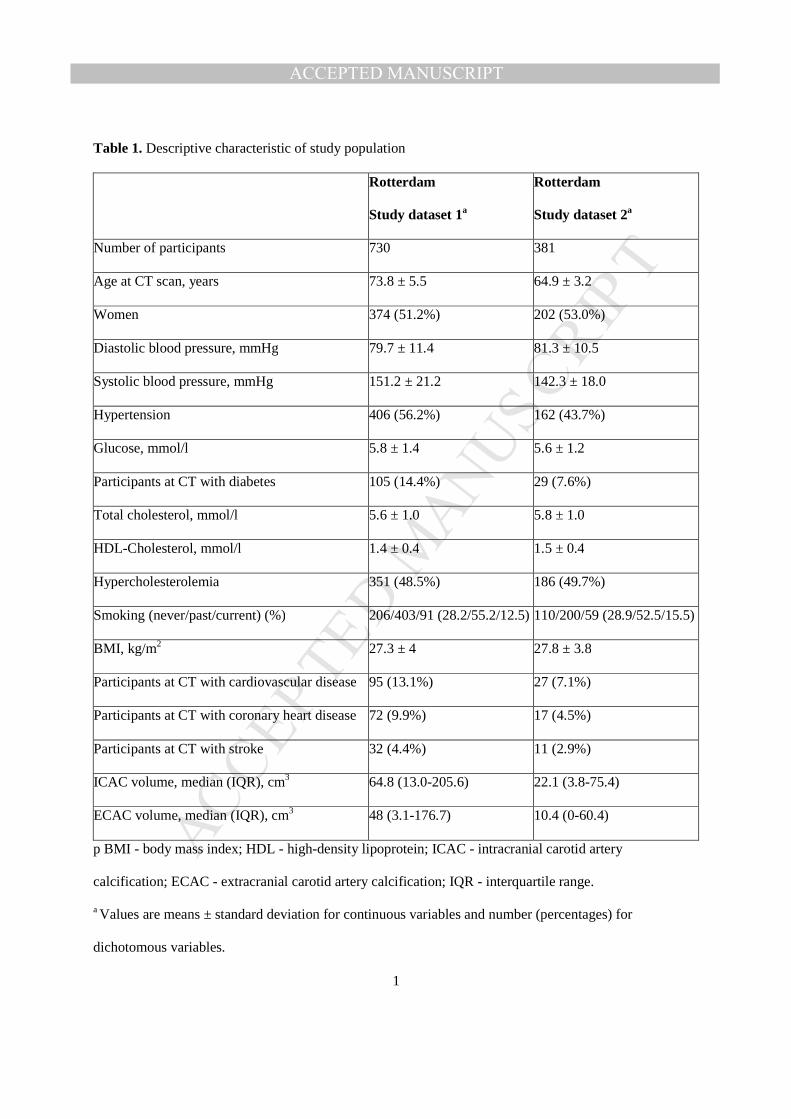
The characteristics of the study population are shown in Table 1 and the summary statistics of metabolites
are shown in Supplementary Table 1. Participants from the first dataset of Rotterdam Study (N=730,
51.2% women, mean age 73.8 ± 5.5 years) were older than participants from the second dataset of
Rotterdam Study (N=381, 53% women, mean age 64.9 ± 3.2 years), resulting in differences in age-related
clinical characteristics and average volume of calcifications (Table 1). However, the prevalence of ICAC
was comparable being 83.0% and 80.6 % in the first and second group respectively. The prevalence of
ECAC was 79.9% in the first and 65.6% in the second dataset.
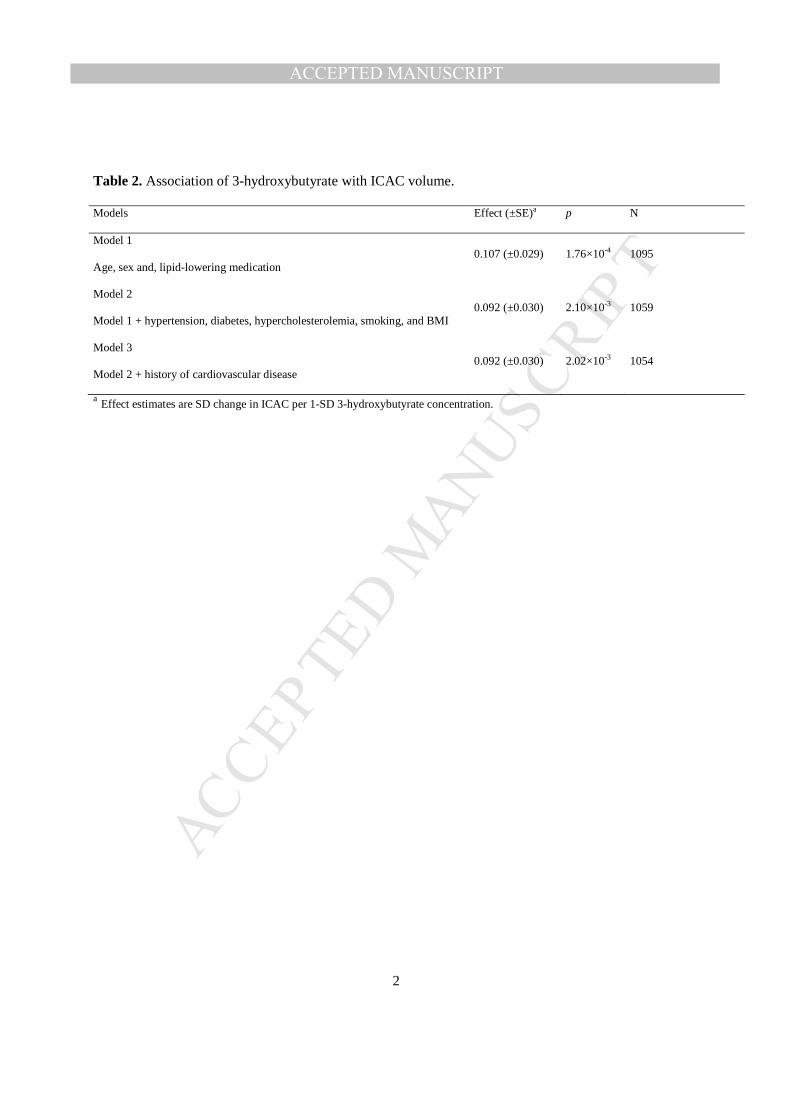
We found a significant association of 3-hydroxybutyrate, a glycolysis-related metabolite, with ICAC (one
standard deviation (SD) increase in the concentration of 3-hydroxybutyrate was related to a 0.11 SD
increase in ICAC; p=1.8×10⁻⁴, Table 2). The effect estimates were consistent across the two datasets (first
Rotterdam Study dataset: effect=0.10, p=6.5×10⁻³; second Rotterdam study dataset; effect: 0.13,
p=9.06×10⁻³). Further adjustments for traditional cardiovascular risk factors or history of cardiovascular
disease did not influence the effect estimate (Table 2). We found no statistically significant association of
any of the metabolites with ECAC (Supplementary Table 2).
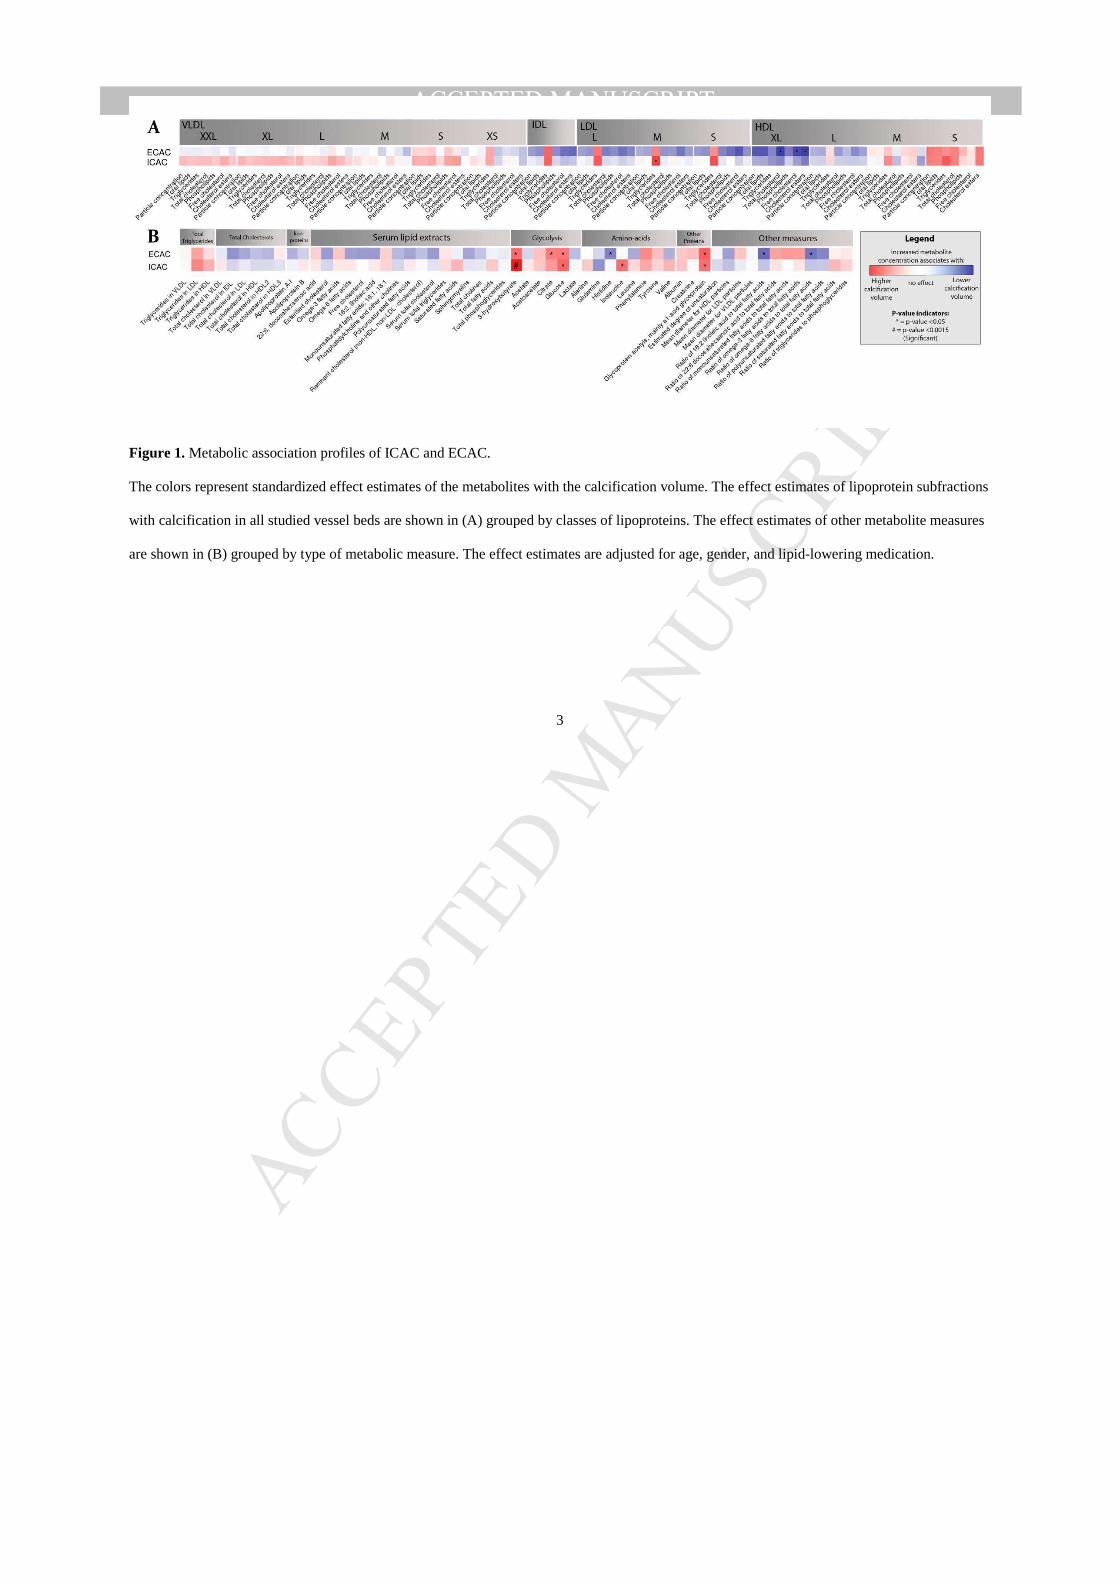
When comparing the metabolic association pattern between ICAC and ECAC we found specific
differences (Fig. 1, Supplementary Table 2). Among the glycolysis-related metabolic measures, 3-
hydroxybutyrate which was significantly associated with ICAC, showed nominally significant association
with ECAC (effect=0.07, p=0.015). Glucose was nominally significant associated with both ICAC
(effect=0.07, p=0.012), and ECAC (effect=0.06, p=0.026), whereas citrate was nominally associated with
ECAC (effect=0.062, p=0.032) (Supplementary Table 2). Interestingly, among lipoprotein subfractions,
only triglycerides in medium-sized LDL were nominally associated with ICAC (effect=0.06, p=0.03, Fig.
1A, Supplementary Table 2), whereas total and free cholesterol and cholesterol esters in extra-large HDL
MANUSCRIP
T
ACCEPTED
ACCEPTED MANUSCRIPT
8
showed nominally significant association with ECAC (Fig. 1A, Supplementary Table 2). Among the
amino-acids, isoleucine was nominally associated with ICAC, and histidine was nominally associated
with ECAC. Glycoprotein acetyls were associated with calcification volume in both studied vessel beds.
When we stratified the analysis by sex the association of 3-hydroxybutyrate with ICAC was nominally
significant in both men (effect=0.12, p=2.8×10⁻³) and women (effect=0.08, p=0.036) (Supplementary
Fig.1 and 2, Supplementary Table 3 and 4). Interestingly, the association of glycoprotein acetyls with
ICAC and ECAC was mainly driven by men (Supplementary Fig. 1 and 2). However, after further
adjustments for traditional cardiovascular risk factors or history of cardiovascular disease, glycoprotein
acetyls in men were not associated with ICAC and ECAC (p>0.05, Supplementary Table 3). Other
metabolites that were significantly associated with ECAC in men were: the ratio of 18:2 linoleic acid to
total fatty acids (effect=-0.17, p=4.6×10⁻⁵) and the ratio of omega-6 fatty acids to total fatty acids
(effect=-0.15, p=3.4×10⁻⁴). These associations were not modified by the additional adjustments made in
model 2 and 3 (Supplementary Table 3). No statistically significant associations were observed of
metabolites with ECAC in women (Supplementary Table 4).
Discussion
In this population-based study, we found that glycolysis-related metabolite measures were associated with
a larger volume of ICAC. In particular, higher levels of 3-hydroxybutyrate substantially contributed to
larger ICAC volumes. When comparing the metabolic association profile of ICAC with that of ECAC, we
found specific differences in glycolysis-related metabolite measures, lipoprotein subfractions, and amino
acids.
To our knowledge, this is the first study investigating associations of metabolomics with ICAC and
ECAC. The most intriguing finding was the association of 3-hydroxybutyrate (also called beta-
hydroxybutyric acid) with ICAC. The ketone 3-hydroxybutyrate is the most abundant of the three known
ketone bodies (acetoacetate, 3-hydroxybutyrate, and acetone) that is produced by the liver during fasting
and represents an alternative energy source for the brain.26 In addition, fasting-induced 3-hydroxybutyrate
MANUSCRIP
T
ACCEPTED
ACCEPTED MANUSCRIPT
9
has been found to enhance expression of the glucose transporter Glut1 in brain endothelial cells, which
plays an important role in glucose transport across the blood-brain barrier.27 In general, ketone bodies are
considered to exert beneficial effects on brain functioning.28 In this light, our finding that higher
concentrations of 3-hydroxybutyrate relate to larger volumes of ICAC seems to contrast these beneficial
effects, especially because ICAC is a risk factor for (subclinical) stroke, cognitive decline, and
dementia.29, 30 Yet, a potential mechanism underlying this association may be found in the property of 3-
hydroxybutyrate to form polymers known as Poly-(R)-3-hydroxybutyrates (PHB)s. These short-chain
PHBs reside in the lipid core of lipoprotein(a) (Lp(a)), a lipoprotein with profound atherogenic effects and
also causally related to coronary heart disease.31-34 Another explanation for the relation of 3-
hydroxybutyrate with ICAC may be impaired glucose tolerance. Impaired glucose tolerance is the (pre-)
clinical state of diabetes mellitus type 2 (DM2) and is associated with an elevated risk of and a poor
prognosis after cardiovascular events.35, 36 3-hydroxybutyrate levels were found to be increased in
individuals with impaired glucose tolerance and in patients with DM2, in whom it predicted worsening of
hyperglycemia and incident DM2 in the next 5 years.37 These data could hypothetically place 3-
hydroxybutyrate in the pathway that leads from an impaired glucose tolerance to increased ICAC and
eventually cardiovascular events. Another explanation may be that higher levels of 3-hydroxybutyrate
compensate for defective transport of 3-hydroxybutyrate across the blood-brain barrier due to intracranial
arteriosclerosis, i.e. reverse causation. Finally, a partial common genetic background might explain the
relation between 3-hydroxybutyrate and ICAC.
We also compared the metabolic association patterns of ICAC with that of ECAC. The association
between glycoprotein acetyls was observed with both ICAC and ECAC, and glycoprotein acetyls
associated with calcifications in men. Attenuation of these associations in model 2, suggests that
glycoprotein acetyls might in part reflect pathology related to cardiovascular risk. Levels of this protein
are strongly associated with smoking and physical activity and glycoprotein acetyl concentration has been
shown to be a strong predictor of 10-year mortality.38, 39 The protein is a marker of acute-phase reactions
MANUSCRIP
T
ACCEPTED
ACCEPTED MANUSCRIPT
10
and may be implicated in this way in depression,40 diabetes,41 cardiovascular disease42, and cancer.43
Furthermore, we observed specific differences that further underline the location-specific properties of
atherosclerosis.5, 44, 45 In addition to differences in glycolysis-related metabolic measures between ICAC
and ECAC which are discussed above, another interesting difference we found was that higher
concentrations of HDL subfractions were associated with lower volumes of ECAC, but not with ICAC.
The strength of our study includes the large sample with standardized assessments of metabolic measures
and arterial calcification in intracranial and extracranial carotid artery, enabling comparisons of the
metabolic association patterns of calcification in these two vessel beds. The metabolomics platform that
we used contains a large proportion of lipoprotein or other lipid measures which provides an excellent
opportunity to study atherosclerosis.15, 22, 23, 46 However, it should be acknowledged that many other
metabolites can be measured using more detailed techniques,47 which may also be of importance to
atherosclerosis. There are also other limitations of our study that should be noted. First, even though
calcification is a validated marker of atherosclerosis, non-calcified atherosclerotic disease was not taken
into account. Especially, these non-calcified components of the atherosclerotic plaque may also be
influenced by the studied metabolites.48 Another limitation of the current study is that metabolites and CT
scan measures have not been taken at the same time. However, the results were concordant in the two
datasets despite the time difference in the metabolites and CT scan measures. Finally, although we
adjusted our analyses for various known potential confounders, residual confounding by unknown factors
remains possible. We urge future replication efforts of our findings in independent datasets.
Conclusions
We found a prominent association between 3-hydroxybutyrate and the amount of ICAC. Investigation of
the underlying biological mechanisms for the identified association should be the subject of future
biological studies. When comparing the metabolic association profile of ICAC with that of ECAC, we
found specific differences in glycolysis-related metabolite measures, lipoprotein subfractions, and amino
MANUSCRIP
T
ACCEPTED
ACCEPTED MANUSCRIPT
11
acids, further corroborating the evidence for the existence of location-specific differences in the etiology
of carotid artery atherosclerosis.
Conflict of interest
The authors declared they do not have anything to disclose regarding conflict of interest with respect to
this manuscript.
Financial support
The Rotterdam Study is supported by the Erasmus MC University Medical Center and Erasmus
University Rotterdam; The Netherlands Organisation for Scientific Research (NWO); The Netherlands
Organisation for Health Research and Development (ZonMw); the Research Institute for Diseases in the
Elderly (RIDE); The Netherlands Genomics Initiative (NGI); the Ministry of Education, Culture and
Science; the Ministry of Health, Welfare and Sports; the European Commission (DG XII); and the
Municipality of Rotterdam. Metabolomics measurements were funded by Biobanking and Biomolecular
Resources Research Infrastructure (BBMRI)–NL (184.021.007) and the JNPD under the project
PERADES (grant number 733051021, Defining Genetic, Polygenic and Environmental Risk for
Alzheimer’s Disease using multiple powerful cohorts, focused Epigenetics and Stem cell metabolomics).
This work has been performed as part of the CoSTREAM project (www.costream.eu) and has received
funding from the European Union's Horizon 2020 research and innovation programme under grant
agreement No 667375. Ayse Demirkan, Dina Vojinovic, and Cornelia van Duijn have used exchange
grants from Personalized pREvention of Chronic DIseases consortium (PRECeDI) (H2020-MSCA-RISE-
2014). Ayşe Demirkan was supported by VENI grant (2015) from ZonMw. Maryam Kavousi is supported
by the NWO VENI grant (VENI, 91616079).
Author contributions
MANUSCRIP
T
ACCEPTED
ACCEPTED MANUSCRIPT
12
Conceived the study and drafted the manuscript: DV, SJL, DB. Acquired data: CMD, MWV, MAI, AL,
DB. Analyzed data and/or involved in interpretation of data: DV, SJL, MK, NA, AD, DB. Revised the
manuscript critically for important intellectual content: DV, SJL, CMD, MWV, MK, NA, AD, MAI, AL,
DB.
Acknowledgements
The contribution of inhabitants, general practitioners, and pharmacists of the Ommoord district to the
Rotterdam Study is gratefully acknowledged.
References
[1] Gorelick, PB, Wong, KS, Bae, HJ, et al., Large artery intracranial occlusive disease: a large
worldwide burden but a relatively neglected frontier, Stroke, 2008;39:2396-2399.
[2] Arenillas, JF, Intracranial atherosclerosis: current concepts, Stroke, 2011;42:S20-23.
[3] Qureshi, AI and Caplan, LR, Intracranial atherosclerosis, Lancet, 2014;383:984-998.
[4] Bos, D, Portegies, ML, van der Lugt, A, et al., Intracranial carotid artery atherosclerosis and the
risk of stroke in whites: the Rotterdam Study, JAMA Neurol, 2014;71:405-411.
[5] Bos, D, Ikram, MA, Isaacs, A, et al., Genetic loci for coronary calcification and serum lipids
relate to aortic and carotid calcification, Circ Cardiovasc Genet, 2013;6:47-53.
[6] Lopez-Cancio, E, Galan, A, Dorado, L, et al., Biological signatures of asymptomatic extra- and
intracranial atherosclerosis: the Barcelona-AsIA (Asymptomatic Intracranial Atherosclerosis) study,
Stroke, 2012;43:2712-2719.
[7] Allison, MA, Criqui, MH and Wright, CM, Patterns and risk factors for systemic calcified
atherosclerosis, Arterioscler Thromb Vasc Biol, 2004;24:331-336.
[8] Bos, D, van der Rijk, MJ, Geeraedts, TE, et al., Intracranial carotid artery atherosclerosis:
prevalence and risk factors in the general population, Stroke, 2012;43:1878-1884.
MANUSCRIP
T
ACCEPTED
ACCEPTED MANUSCRIPT
13
[9] Mazighi, M, Labreuche, J, Gongora-Rivera, F, et al., Autopsy prevalence of intracranial
atherosclerosis in patients with fatal stroke, Stroke, 2008;39:1142-1147.
[10] Quehenberger, O and Dennis, EA, The human plasma lipidome, N Engl J Med, 2011;365:1812-
1823.
[11] Inouye, M, Kettunen, J, Soininen, P, et al., Metabonomic, transcriptomic, and genomic variation
of a population cohort, Mol Syst Biol, 2010;6:441.
[12] Wang, TJ, Larson, MG, Vasan, RS, et al., Metabolite profiles and the risk of developing diabetes,
Nat Med, 2011;17:448-453.
[13] Mahendran, Y, Cederberg, H, Vangipurapu, J, et al., Glycerol and fatty acids in serum predict the
development of hyperglycemia and type 2 diabetes in Finnish men, Diabetes Care, 2013;36:3732-3738.
[14] Shah, SH, Kraus, WE and Newgard, CB, Metabolomic profiling for the identification of novel
biomarkers and mechanisms related to common cardiovascular diseases: form and function, Circulation,
2012;126:1110-1120.
[15] Wurtz, P, Raiko, JR, Magnussen, CG, et al., High-throughput quantification of circulating
metabolites improves prediction of subclinical atherosclerosis, Eur Heart J, 2012;33:2307-2316.
[16] Stegemann, C, Pechlaner, R, Willeit, P, et al., Lipidomics profiling and risk of cardiovascular
disease in the prospective population-based Bruneck study, Circulation, 2014;129:1821-1831.
[17] Roberts, LD and Gerszten, RE, Toward new biomarkers of cardiometabolic diseases, Cell Metab,
2013;18:43-50.
[18] Ammirati, E and Fogacci, F, Clinical relevance of biomarkers for the identification of patients
with carotid atherosclerotic plaque: Potential role and limitations of cysteine protease legumain,
Atherosclerosis, 2017;257:248-249.
[19] Ammirati, E, Moroni, F, Norata, GD, et al., Markers of inflammation associated with plaque
progression and instability in patients with carotid atherosclerosis, Mediators Inflamm,
2015;2015:718329.
MANUSCRIP
T
ACCEPTED
ACCEPTED MANUSCRIPT
14
[20] Hofman, A, Brusselle, GG, Darwish Murad, S, et al., The Rotterdam Study: 2016 objectives and
design update, Eur J Epidemiol, 2015;30:661-708.
[21] Huan, T, Esko, T, Peters, MJ, et al., A meta-analysis of gene expression signatures of blood
pressure and hypertension, PLoS Genet, 2015;11:e1005035.
[22] Soininen, P, Kangas, AJ, Wurtz, P, et al., High-throughput serum NMR metabonomics for cost-
effective holistic studies on systemic metabolism, Analyst, 2009;134:1781-1785.
[23] Soininen, P, Kangas, AJ, Wurtz, P, et al., Quantitative serum nuclear magnetic resonance
metabolomics in cardiovascular epidemiology and genetics, Circ Cardiovasc Genet, 2015;8:192-206.
[24] Odink, AE, van der Lugt, A, Hofman, A, et al., Risk factors for coronary, aortic arch and carotid
calcification; The Rotterdam Study, J Hum Hypertens, 2010;24:86-92.
[25] Li, J and Ji, L, Adjusting multiple testing in multilocus analyses using the eigenvalues of a
correlation matrix, Heredity, 2005;95:221-227.
[26] Owen, OE, Morgan, AP, Kemp, HG, et al., Brain metabolism during fasting, J Clin Invest,
1967;46:1589-1595.
[27] Tanegashima, K, Sato-Miyata, Y, Funakoshi, M, et al., Epigenetic regulation of the glucose
transporter gene Slc2a1 by -hydroxybutyrate underlies preferential glucose supply to the brain of fasted
mice, Genes Cells, 2017;22:71-83.
[28] Rahman, M, Muhammad, S, Khan, MA, et al., The beta-hydroxybutyrate receptor HCA2
activates a neuroprotective subset of macrophages, Nat Commun, 2014;5:3944.
[29] Bos, D, Portegies, MLP, van der Lugt, A, et al., Intracranial Carotid Artery Atherosclerosis and
the Risk of Stroke in Whites The Rotterdam Study, Jama Neurology, 2014;71:405-411.
[30] Bos, D, Vernooij, MW, de Bruijn, RFAG, et al., Atherosclerotic calcification is related to a
higher risk of dementia and cognitive decline, Alzheimers Dement, 2015;11:639-647.
[31] Kettunen, J, Demirkan, A, Wurtz, P, et al., Genome-wide study for circulating metabolites
identifies 62 loci and reveals novel systemic effects of LPA, Nat Commun, 2016;7:11122.
MANUSCRIP
T
ACCEPTED
ACCEPTED MANUSCRIPT
15
[32] Tregouet, DA, Konig, IR, Erdmann, J, et al., Genome-wide haplotype association study identifies
the SLC22A3-LPAL2-LPA gene cluster as a risk locus for coronary artery disease, Nat Genet,
2009;41:283-285.
[33] Schunkert, H, Konig, IR, Kathiresan, S, et al., Large-scale association analysis identifies 13 new
susceptibility loci for coronary artery disease, Nat Genet, 2011;43:333-U153.
[34] Reusch, RN, Poly-(R)-3-hydroxybutyrates (PHB) are atherogenic components of lipoprotein
Lp(a), Med Hypotheses, 2015;85:1041-1043.
[35] Barr, ELM, Zimmet, PZ, Welborn, TA, et al., Risk of cardiovascular and all-cause mortality in
individuals with diabetes mellitus, impaired fasting glucose, and impaired glucose tolerance - The
Australian diabetes, obesity, and lifestyle study (AusDiab), Circulation, 2007;116:151-157.
[36] Kurihara, O, Takano, M, Yamamoto, M, et al., Impact of Prediabetic Status on Coronary
Atherosclerosis A multivessel angioscopic study, Diabetes Care, 2013;36:729-733.
[37] Mahendran, Y, Vangipurapu, J, Cederberg, H, et al., Association of Ketone Body Levels With
Hyperglycemia and Type 2 Diabetes in 9,398 Finnish Men, Diabetes, 2013;62:3618-3626.
[38] Fischer, K, Kettunen, J, Wurtz, P, et al., Biomarker profiling by nuclear magnetic resonance
spectroscopy for the prediction of all-cause mortality: an observational study of 17,345 persons, PLoS
Med, 2014;11:e1001606.
[39] Singh-Manoux, A, Shipley, MJ, Bell, JA, et al., Association between inflammatory biomarkers
and all-cause, cardiovascular and cancer-related mortality, CMAJ, 2016.
[40] Harley, J, Roberts, R, Joyce, P, et al., Orosomucoid influences the response to antidepressants in
major depressive disorder, J Psychopharmacol, 2010;24:531-535.
[41] El-Beblawy, NMS, Andrawes, NG, Ismail, EAR, et al., Serum and Urinary Orosomucoid in
Young Patients With Type 1 Diabetes: A Link Between Inflammation, Microvascular Complications, and
Subclinical Atherosclerosis, Clin Appl Thromb-Hem, 2016;22:718-726.
MANUSCRIP
T
ACCEPTED
ACCEPTED MANUSCRIPT
16
[42] Carriere, I, Dupuy, AM, Lacroux, A, et al., Biomarkers of inflammation and malnutrition
associated with early death in healthy elderly people, Journal of the American Geriatrics Society,
2008;56:840-846.
[43] Bruno, R, Olivares, R, Berille, J, et al., alpha-1-acid glycoprotein as an independent predictor for
treatment effects and a prognostic factor of survival in patients with non-small cell lung cancer treated
with docetaxel, Clin Cancer Res, 2003;9:1077-1082.
[44] Bos, D, Ikram, MA, Elias-Smale, SE, et al., Calcification in Major Vessel Beds Relates to
Vascular Brain Disease, Arterioscl Throm Vas, 2011;31:2331-2337.
[45] Bos, D, Leening, MJ, Kavousi, M, et al., Comparison of Atherosclerotic Calcification in Major
Vessel Beds on the Risk of All-Cause and Cause-Specific Mortality: The Rotterdam Study, Circ
Cardiovasc Imaging, 2015;8.
[46] Wurtz, P, Havulinna, AS, Soininen, P, et al., Metabolite profiling and cardiovascular event risk: a
prospective study of 3 population-based cohorts, Circulation, 2015;131:774-785.
[47] Wishart, DS, Jewison, T, Guo, AC, et al., HMDB 3.0--The Human Metabolome Database in
2013, Nucleic Acids Res, 2013;41:D801-807.
[48] Stary, HC, Chandler, AB, Dinsmore, RE, et al., A definition of advanced types of atherosclerotic
lesions and a histological classification of atherosclerosis. A report from the Committee on Vascular
Lesions of the Council on Arteriosclerosis, American Heart Association, Arterioscler Thromb Vasc Biol,
1995;15:1512-1531.
MANUSCRIP
T
ACCEPTED
ACCEPTED MANUSCRIPT
1
Table 1. Descriptive characteristic of study population
Rotterdam
Study dataset 1a
Rotterdam
Study dataset 2a
Number of participants 730 381
Age at CT scan, years 73.8 ± 5.5 64.9 ± 3.2
Women 374 (51.2%) 202 (53.0%)
Diastolic blood pressure, mmHg 79.7 ± 11.4 81.3 ± 10.5
Systolic blood pressure, mmHg 151.2 ± 21.2 142.3 ± 18.0
Hypertension 406 (56.2%) 162 (43.7%)
Glucose, mmol/l 5.8 ± 1.4 5.6 ± 1.2
Participants at CT with diabetes 105 (14.4%) 29 (7.6%)
Total cholesterol, mmol/l 5.6 ± 1.0 5.8 ± 1.0
HDL-Cholesterol, mmol/l 1.4 ± 0.4 1.5 ± 0.4
Hypercholesterolemia 351 (48.5%) 186 (49.7%)
Smoking (never/past/current) (%) 206/403/91 (28.2/55.2/12.5) 110/200/59 (28.9/52.5/15.5)
BMI, kg/m2 27.3 ± 4 27.8 ± 3.8
Participants at CT with cardiovascular disease 95 (13.1%) 27 (7.1%)
Participants at CT with coronary heart disease 72 (9.9%) 17 (4.5%)
Participants at CT with stroke 32 (4.4%) 11 (2.9%)
ICAC volume, median (IQR), cm3 64.8 (13.0-205.6) 22.1 (3.8-75.4)
ECAC volume, median (IQR), cm3 48 (3.1-176.7) 10.4 (0-60.4)
p BMI - body mass index; HDL - high-density lipoprotein; ICAC - intracranial carotid artery
calcification; ECAC - extracranial carotid artery calcification; IQR - interquartile range.
a Values are means ± standard deviation for continuous variables and number (percentages) for
dichotomous variables.
MANUSCRIP
T
ACCEPTED
ACCEPTED MANUSCRIPT
2
Table 2. Association of 3-hydroxybutyrate with ICAC volume.
Models Effect (±SE)a p N
Model 1
Age, sex and, lipid-lowering medication 0.107 (±0.029) 1.76×10⁻⁴ 1095
Model 2
Model 1 + hypertension, diabetes, hypercholesterolemia, smoking, and BMI 0.092 (±0.030) 2.10×10⁻³ 1059
Model 3
Model 2 + history of cardiovascular disease 0.092 (±0.030) 2.02×10⁻³ 1054
a Effect estimates are SD change in ICAC per 1-SD 3-hydroxybutyrate concentration.
MANUSCRIP
T
ACCEPTED
ACCEPTED MANUSCRIPT
3
Figure 1. Metabolic association profiles of ICAC and ECAC.
The colors represent standardized effect estimates of the metabolites with the calcification volume. The effect estimates of lipoprotein subfractions
with calcification in all studied vessel beds are shown in (A) grouped by classes of lipoproteins. The effect estimates of other metabolite measures
are shown in (B) grouped by type of metabolic measure. The effect estimates are adjusted for age, gender, and lipid-lowering medication.
MANUSCRIP
T
ACCEPTED
ACCEPTED MANUSCRIPTHighlights
• Increasing evidence demonstrates differences between the risk factor profile for intracranial
atherosclerosis and that of extracranial atherosclerosis.
• Increases in concentrations of 3-hydroxybutyrate, a ketone body, related to larger amounts of
intracranial carotid artery calcification.
• Comparison of the metabolic association pattern of intracranial carotid artery calcification
with that of extracranial carotid artery calcification revealed differences in glycolysis-related
metabolite measures, lipoprotein subfractions, and amino acids.
• Glycoprotein acetyls were associated with calcification in both studied vessel beds.