metabolic profiling of adiponectin levels in...
TRANSCRIPT
1
The recognition that adipose tissue is an endocrine organ raised new prospects for discovering adipose-derived
products that could be valuable drug targets for the treatment and prevention of cardiometabolic diseases. In this context, adiponectin, a 30 kDa protein largely produced by mature adipocytes, has been attracting widespread attention because of insulin-sensitizing, anti-inflammatory, antiatherogenic, and cardiomyocyte-protective properties demonstrated in animal models.1
See Clinical PerspectiveHowever, human studies have yielded a far more com-
plicated picture. Unlike most other adipokines, circulating
adiponectin concentration is higher with lower adiposity.2 In prospective observational studies in humans using multivari-able regression, higher circulating adiponectin is associated with lower risk of type 2 diabetes mellitus,3 hepatic dysfunc-tion,4 and metabolic syndrome5 but higher mortality in patients with kidney disease, heart failure, previous cardiovascular dis-ease, or general elderly cohorts6–9; this different direction of effect between risk of incident disease and mortality among high-risk groups has been called the adiponectin paradox.10
Given the complex metabolic derangements that might participate in and compensatory changes that might occur in response to human diseases, the association between adiponectin concentration and cardiometabolic biomarkers and disease end
Background—Adiponectin, a circulating adipocyte-derived protein, has insulin-sensitizing, anti-inflammatory, antiatherogenic, and cardiomyocyte-protective properties in animal models. However, the systemic effects of adiponectin in humans are unknown. Our aims were to define the metabolic profile associated with higher blood adiponectin concentration and investigate whether variation in adiponectin concentration affects the systemic metabolic profile.
Methods and Results—We applied multivariable regression in ≤5909 adults and Mendelian randomization (using cis-acting genetic variants in the vicinity of the adiponectin gene as instrumental variables) for analyzing the causal effect of adiponectin in the metabolic profile of ≤37 545 adults. Participants were largely European from 6 longitudinal studies and 1 genome-wide association consortium. In the multivariable regression analyses, higher circulating adiponectin was associated with higher high-density lipoprotein lipids and lower very-low-density lipoprotein lipids, glucose levels, branched-chain amino acids, and inflammatory markers. However, these findings were not supported by Mendelian randomization analyses for most metabolites. Findings were consistent between sexes and after excluding high-risk groups (defined by age and occurrence of previous cardiovascular event) and 1 study with admixed population.
Conclusions—Our findings indicate that blood adiponectin concentration is more likely to be an epiphenomenon in the context of metabolic disease than a key determinant. (Circ Cardiovasc Genet. 2017;10:e001837. DOI: 10.1161/CIRCGENETICS. 117.001837.)
Key Words: adiponectin ◼ cardiovascular disease ◼ insulin ◼ Mendelian Randomization Analysis ◼ metabolism ◼ metabolomics
Circ Cardiovasc Genet is available at http://circgenetics.ahajournals.org DOI: 10.1161/CIRCGENETICS.117.001837
Received January 16, 2017; accepted September 13, 2017.From the Post-Graduate Program in Epidemiology, Federal University of Pelotas, Brazil (M.C.B., A.J.D.B., B.L.H., D.F.F., I.O.O.); MRC Integrative
Epidemiology Unit (M.C.B., D.L.S.F., T.R.G., D.A.L.) and Population Health Sciences, Bristol Medical School (M.C.B., D.L.S.F., T.R.G., Y.B.-S., D.A.L.), University of Bristol, United Kingdom; Farr Institute of Health Informatics (J.P.C., A.D.H.), Department of Epidemiology and Public Health (M. Kivimaki, M. Kumari), Department of Women’s Cancer, Institute for Women’s Health, Faculty of Population Health Sciences (U.M., A.G.-M., E.F.), and Institute of Cardiovascular Science (A.D.H.), University College London, United Kingdom; Institute for Social and Economic Research, University of Essex, United Kingdom (M. Kumari); and Department of Physiology and Pharmacology, Institute of Biology, Federal University of Pelotas, Brazil (I.O.O.).
*Drs Lawlor and Hingorani contributed equally as joint senior authors.The Data Supplement is available at http://circgenetics.ahajournals.org/lookup/suppl/doi:10.1161/CIRCGENETICS.117.001837/-/DC1.Correspondence to Maria Carolina Borges, PhD, University of Bristol, Oakfield House, Oakfield Grove, Bristol BS8 2BN, United Kingdom. E-mail
[email protected]© 2017 The Authors. Circulation: Cardiovascular Genetics is published on behalf of the American Heart Association, Inc., by Wolters Kluwer Health,
Inc. This is an open access article under the terms of the Creative Commons Attribution License, which permits use, distribution, and reproduction in any medium, provided that the original work is properly cited.
Metabolic Profiling of Adiponectin Levels in AdultsMendelian Randomization Analysis
Maria Carolina Borges, PhD; Aluísio J.D. Barros, MD, PhD; Diana L. Santos Ferreira, PhD; Juan Pablo Casas, MD, PhD; Bernardo Lessa Horta, MD, PhD; Mika Kivimaki, PhD;
Meena Kumari, PhD; Usha Menon, MD; Tom R. Gaunt, PhD; Yoav Ben-Shlomo, PhD; Deise F. Freitas, MD; Isabel O. Oliveira, PhD; Aleksandra Gentry-Maharaj, PhD;
Evangelia Fourkala, PhD; Debbie A. Lawlor, MD, PhD*; Aroon D. Hingorani, MD, PhD*
Original Article
by guest on June 29, 2018http://circgenetics.ahajournals.org/
Dow
nloaded from
by guest on June 29, 2018http://circgenetics.ahajournals.org/
Dow
nloaded from
by guest on June 29, 2018http://circgenetics.ahajournals.org/
Dow
nloaded from
by guest on June 29, 2018http://circgenetics.ahajournals.org/
Dow
nloaded from
by guest on June 29, 2018http://circgenetics.ahajournals.org/
Dow
nloaded from
by guest on June 29, 2018http://circgenetics.ahajournals.org/
Dow
nloaded from
by guest on June 29, 2018http://circgenetics.ahajournals.org/
Dow
nloaded from
by guest on June 29, 2018http://circgenetics.ahajournals.org/
Dow
nloaded from
by guest on June 29, 2018http://circgenetics.ahajournals.org/
Dow
nloaded from
by guest on June 29, 2018http://circgenetics.ahajournals.org/
Dow
nloaded from
by guest on June 29, 2018http://circgenetics.ahajournals.org/
Dow
nloaded from
by guest on June 29, 2018http://circgenetics.ahajournals.org/
Dow
nloaded from
by guest on June 29, 2018http://circgenetics.ahajournals.org/
Dow
nloaded from
by guest on June 29, 2018http://circgenetics.ahajournals.org/
Dow
nloaded from
by guest on June 29, 2018http://circgenetics.ahajournals.org/
Dow
nloaded from
by guest on June 29, 2018http://circgenetics.ahajournals.org/
Dow
nloaded from
by guest on June 29, 2018http://circgenetics.ahajournals.org/
Dow
nloaded from
by guest on June 29, 2018http://circgenetics.ahajournals.org/
Dow
nloaded from
by guest on June 29, 2018http://circgenetics.ahajournals.org/
Dow
nloaded from
by guest on June 29, 2018http://circgenetics.ahajournals.org/
Dow
nloaded from
by guest on June 29, 2018http://circgenetics.ahajournals.org/
Dow
nloaded from
by guest on June 29, 2018http://circgenetics.ahajournals.org/
Dow
nloaded from
by guest on June 29, 2018http://circgenetics.ahajournals.org/
Dow
nloaded from
by guest on June 29, 2018http://circgenetics.ahajournals.org/
Dow
nloaded from
by guest on June 29, 2018http://circgenetics.ahajournals.org/
Dow
nloaded from
2 Borges et al Adiponectin and Metabolic Profile
points might be explained by reverse causality (where disease status could alter adiponectin concentration) or residual con-founding (where adiponectin could be a marker of another causal factor, such as adiposity or insulin resistance).11 Classical multi-variable regression studies cannot distinguish causal from non-causal associations, and randomized controlled trials specifically targeting adiponectin are not possible in the absence of a specific therapeutic targeting adiponectin concentration or function.
Mendelian randomization uses genetic variants (mostly single-nucleotide polymorphisms [SNPs]) that are robustly related to the risk factor of interest as tools to assess its role in causing disease.12 The random allocation of parental alleles at meiosis should theoretically reduce confounding in genetic association studies, and this has been shown to be the case13; the unidirectional flow of biological information from genetic variant to phenotypes avoids reverse causality. Mendelian ran-domization has been used in clinical research to investigate potential etiologic mechanisms, such as the causal effects of low-density lipoprotein cholesterol (LDL-C),14 systolic blood pressure,15 and CRP (C-reactive protein)16 on coronary heart disease, validate and prioritize novel drug targets, such as IL-6 (interleukin-6) receptor,17 and increase understanding of cur-rent therapies, for example, statins.18
Previous Mendelian randomization studies indicate that cir-culating adiponectin is a consequence of low insulin sensitivity,19 but whether adiponectin concentration is also a cause of insulin sensitivity is uncertain.19–21 Using Mendelian randomization in a study of 63 746 coronary heart disease cases and 130 681 con-trols, we have recently shown that adiponectin may not be caus-ally related to coronary heart disease.22 Although multivariable analyses show that higher adiponectin concentration is associ-ated with lower glycated hemoglobin, insulin, triglycerides (TG), and higher high-density lipoprotein cholesterol (HDL-C), using Mendelian randomization, we found little evidence that these were causal.22 Whether adiponectin is associated with systemic metabolic profile, and, if it is, what aspects of these associations are causal is unknown. A broader interrogation of the metabolic effects of adiponectin through high-throughput profiling of metabolic status could provide valuable insights into whether adiponectin is a noncausal biomarker or causally impor-tant in the pathophysiology of some human diseases.23
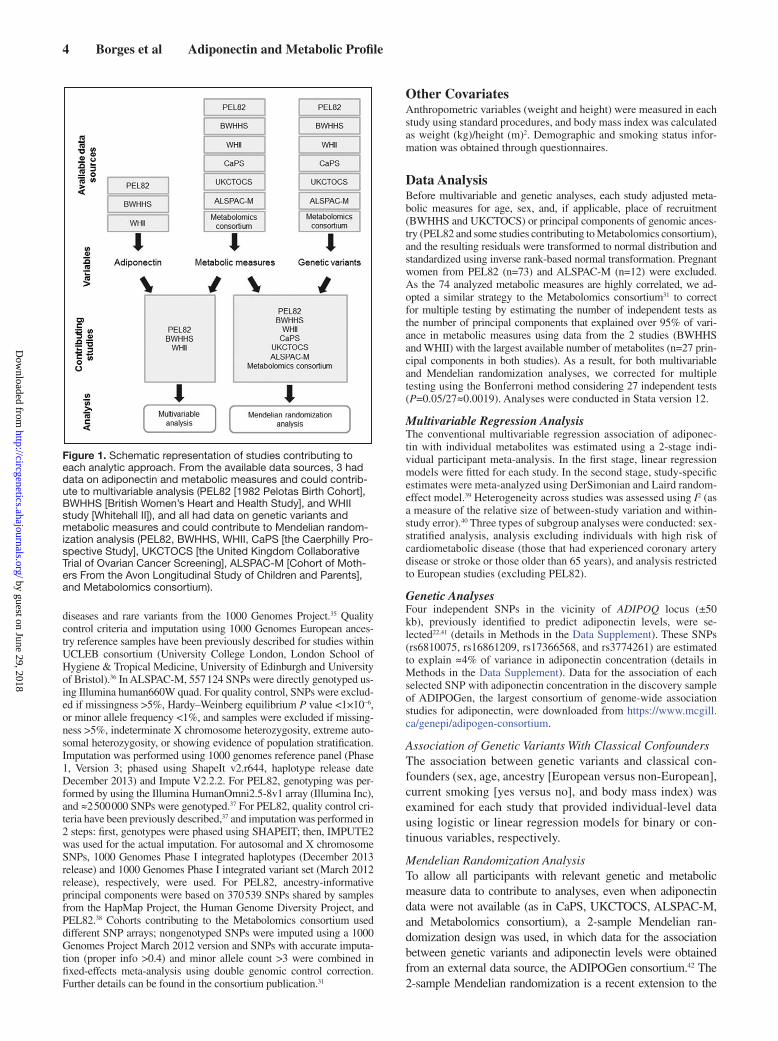
We combined genotype, adiponectin, and metabolomics profile data from 6 longitudinal studies and 1 genome-wide association consortium with the aim of (1) defining the met-abolic signature of blood adiponectin concentration and (2) investigating whether variation in adiponectin concentration is causally related to the systemic metabolic profile.
MethodsStudy PopulationsThe metabolic profile associated with blood adiponectin concentration was examined from 7 data sources: PEL82 (the 1982 Pelotas Birth Cohort), including adults aged 30 years old born in the city of Pelotas, Brazil, in 198224,25; BWHHS (the British Women’s Heart and Health Study), including UK women aged 60 to 79 years old at recruitment in 200026; WHII study (the Whitehall II), including UK government workers aged 45 to 69 years at phase 5 clinical assessment in 1997 to 199927; the CaPS (Caerphilly Prospective Study), including men aged 52 to 72 years at phase III in 1989 to 199328; a case–control study nest-ed in UKCTOCS (the United Kingdom Collaborative Trial of Ovarian
Cancer Screening), including UK postmenopausal women aged 50 to 74 years at recruitment in 2001 to 200529; the ALSPAC-M (Cohort of Mothers From the Avon Longitudinal Study of Children and Parents), including UK women aged 34 to 63 years old at clinical assessment in 2009 to 201130; and a metabolomics genome-wide association con-sortium (hereafter referred to as Metabolomics consortium), including European adults with mean age of 45 years old from 14 cohorts.31 Individual-level data were available to investigators from PEL82, BWHHS, WHII, CaPS, UKCTOCS, and ALSPAC-M. Individual-level study data cannot be made available to other researchers for purposes of reproducing the results or replicating the procedure. Summary-level data are publicly available from the Metabolomics consortium (URL: http://www.computationalmedicine.fi/data/NMR_GWAS/).
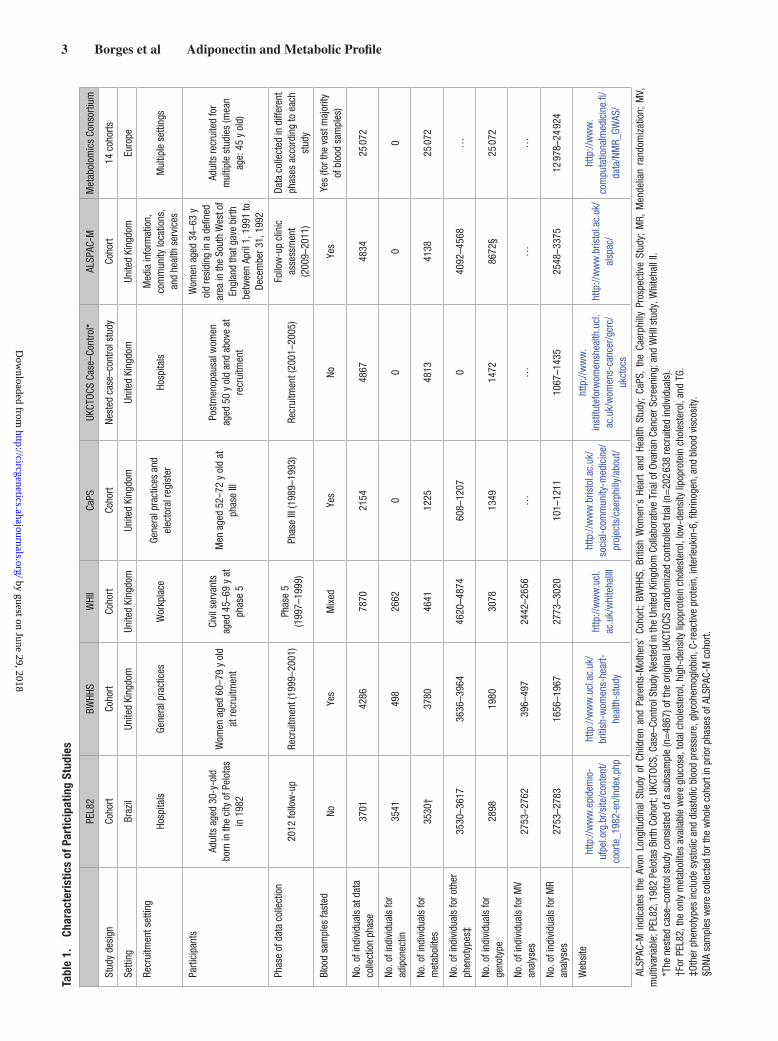
All study participants provided written informed consent, and study protocols were approved by the local ethics committees (ethi-cal approval for ALSPAC was also obtained from the ALSPAC Ethics and Law Committee). Studies’ characteristics are summarized in Table 1. We examined (possibly causal) associations of adiponectin with systemic metabolic profiles using 2 approaches—conventional multivariable regression and Mendelian randomization analyses. Studies must have both adiponectin and measures of some of the out-comes (but do not need genetic data) to contribute to multivariable regression analyses and must have relevant genetic variants and out-comes (but do not need adiponectin concentration data) to contribute to Mendelian randomization analyses. Figure 1 shows how the differ-ent data sources contributed to the 2 approaches.
Metabolite QuantificationA high-throughput serum nuclear magnetic resonance (NMR) spec-troscopy platform was used to quantify ≤150 metabolic measures and 83 derived measures (ratios) in each study. The experimental proto-cols, including sample preparation and NMR spectroscopy methods, have been described in detail elsewhere32,33 and are described brief-ly in Methods in the Data Supplement. Sixty-six of 150 metabolic measures were selected for this study aimed at broadly representing the systemic metabolite profile, as previously reported by Würtz et al,34 including lipoprotein traits (lipid content, particle size, and Apo [apolipoproteins]), fatty acids, amino acids, glycolysis-related metabolites, ketone bodies, fluid balance (albumin and creatinine), and inflammatory markers (glycoprotein acetyls). The remaining 84 metabolic measures from the NMR platform are related to other lipid fractions (esterified and free cholesterol, total cholesterol, TG, and phospholipids) and particle concentration from 14 lipoprotein sub-classes. As these 84 metabolic measures are highly correlated with ≥1 of the 66 selected metabolic measures, they were not included in the main analysis (as they would not bring additional information) and were presented in the Data Supplement. Eight additional measures, not obtained from the NMR platform, were included: CRP, IL-6, fi-brinogen, blood viscosity, insulin, glycated hemoglobin, and systolic blood pressure and diastolic blood pressure. PEL82 did not have data on metabolic measures from NMR platform and contributed data to analyses of conventional lipid risk factors (total cholesterol, HDL-C, LDL-C, and TG) and some of the additional measures described (CRP, glycated hemoglobin, systolic blood pressure, and diastolic blood pressure). Adiponectin was assayed using an ELISA in PEL82, BWHHS, and WHII. Data on adiponectin level were not available from CaPS, UKCTOCS, ALSPAC-M, and the Metabolomics con-sortium. Blood samples used for adiponectin, NMR metabolites, and other blood-based outcomes assays were taken after overnight or minimum 6-hour fast in BWHHS, CaPS, and ALSPAC-M and on nonfasting samples in PEL82 and UKCTOCS. In WHII, participants attending the morning clinic were asked to fast overnight and those attending in the afternoon were asked to have a light, fat-free break-fast before 08:00 hours. The vast majority of samples contributing to the Metabolomics consortium were fasting samples.
GenotypingBWHHS, CaPS, WHII, and UKCTOCS participants were genotyped us-ing Metabochip, a platform comprising 200 000 SNPs, which cover the loci identified by genome-wide association studies in cardiometabolic
by guest on June 29, 2018http://circgenetics.ahajournals.org/
Dow
nloaded from
3 Borges et al Adiponectin and Metabolic ProfileTa
ble
1.
Char
acte
rist
ics
of P
artic
ipat
ing
Stud
ies
PE
L82
BWHH
SW
HII
CaPS
UKCT
OCS
Case
–Con
trol*
ALSP
AC-M
Met
abol
omic
s Co
nsor
tium
Stud
y de
sign
Coho
rtCo
hort
Coho
rtCo
hort
Nest
ed c
ase–
cont
rol s
tudy
Coho
rt14
coh
orts
Setti
ngBr
azil
Unite
d Ki
ngdo
mUn
ited
King
dom
Unite
d Ki
ngdo
mUn
ited
King
dom
Unite
d Ki
ngdo
mEu
rope
Recr
uitm
ent s
ettin
gHo
spita
lsGe
nera
l pra
ctic
esW
orkp
lace
Gene
ral p
ract
ices
and
el
ecto
ral r
egis
ter
Hosp
itals
Med
ia in
form
atio
n,
com
mun
ity lo
catio
ns,
and
heal
th s
ervi
ces
Mul
tiple
set
tings
Parti
cipa
nts
Adul
ts a
ged
30-y
-old
bo
rn in
the
city
of P
elot
as
in 1
982
Wom
en a
ged
60–7
9 y
old
at re
crui
tmen
t
Civi
l ser
vant
s ag
ed 4
5–69
y a
t ph
ase
5
Men
age
d 52
–72
y ol
d at
ph
ase
III
Post
men
opau
sal w
omen
ag
ed 5
0 y
old
and
abov
e at
re
crui
tmen
t
Wom
en a
ged
34–6
3 y
old
resi
ding
in a
defi
ned
area
in th
e So
uth
Wes
t of
Engl
and
that
gav
e bi
rth
betw
een
April
1, 1
991
to
Dece
mbe
r 31,
199
2
Adul
ts re
crui
ted
for
mul
tiple
stu
dies
(mea
n ag
e: 4
5 y
old)
Phas
e of
dat
a co
llect
ion
2012
follo
w-u
pRe
crui
tmen
t (19
99–2
001)
Phas
e 5
(1
997–
1999
)Ph
ase
III (1
989–
1993
)Re
crui
tmen
t (20
01–2
005)
Follo
w-u
p cl
inic
as
sess
men
t (2
009–
2011
)
Data
col
lect
ed in
diff
eren
t ph
ases
acc
ordi
ng to
eac
h st
udy
Bloo
d sa
mpl
es fa
sted
NoYe
sM
ixed
Yes
NoYe
sYe
s (fo
r the
vas
t maj
ority
of
blo
od s
ampl
es)
No. o
f ind
ivid
uals
at d
ata
colle
ctio
n ph
ase
3701
4286
7870
2154
4867
4834
25 0
72
No. o
f ind
ivid
uals
for
adip
onec
tin35
4149
826
620
00
0
No. o
f ind
ivid
uals
for
met
abol
ites
3530
†37
8046
4112
2548
1341
3825
072
No. o
f ind
ivid
uals
for o
ther
ph
enot
ypes
‡35
30–3
617
3636
–396
446
20–4
874
608–
1207
040
92–4
568
…
No. o
f ind
ivid
uals
for
geno
type
2898
1980
3078
1349
1472
8672
§25
072
No. o
f ind
ivid
uals
for M
V an
alys
es27
53–2
762
396–
497
2442
–265
6…
……
…
No. o
f ind
ivid
uals
for M
R an
alys
es27
53–2
783
1656
–196
727
73–3
020
101–
1211
1067
–143
525
48–3
375
12 9
78–2
4 92
4
Web
site
http
://w
ww
.epi
dem
io-
ufpe
l.org
.br/s
ite/c
onte
nt/
coor
te_1
982-
en/in
dex.
php
http
://w
ww
.ucl
.ac.
uk/
briti
sh-w
omen
s-he
art-
heal
th-s
tudy
http
://w
ww
.ucl
.ac
.uk/
whi
teha
llII
http
://w
ww
.bris
tol.a
c.uk
/so
cial
-com
mun
ity-m
edic
ine/
proj
ects
/cae
rphi
lly/a
bout
/
http
://w
ww
.in
stitu
tefo
rwom
ensh
ealth
.ucl
.ac
.uk/
wom
ens-
canc
er/g
crc/
ukct
ocs
http
://w
ww
.bris
tol.a
c.uk
/al
spac
/
http
://w
ww
.co
mpu
tatio
nalm
edic
ine.
fi/da
ta/N
MR_
GWAS
/
ALSP
AC-M
ind
icat
es t
he A
von
Long
itudi
nal
Stud
y of
Chi
ldre
n an
d Pa
rent
s-M
othe
rs’
Coho
rt; B
WHH
S, B
ritis
h W
omen
’s H
eart
and
Heal
th S
tudy
; Ca
PS,
the
Caer
phill
y Pr
ospe
ctiv
e St
udy;
MR,
Men
delia
n ra
ndom
izat
ion;
MV,
m
ultiv
aria
ble;
PEL
82, 1
982
Pelo
tas
Birth
Coh
ort;
UKCT
OCS,
Cas
e–Co
ntro
l Stu
dy N
este
d in
the
Unite
d Ki
ngdo
m C
olla
bora
tive
Tria
l of O
varia
n Ca
ncer
Scr
eeni
ng; a
nd W
HII s
tudy
, Whi
teha
ll II.
*The
nes
ted
case
–con
trol s
tudy
con
sist
ed o
f a s
ubsa
mpl
e (n
=48
67) o
f the
orig
inal
UKC
TOCS
rand
omiz
ed c
ontro
lled
trial
(n=
202
638
recr
uite
d in
divi
dual
s).
†For
PEL
82, t
he o
nly
met
abol
ites
avai
labl
e w
ere
gluc
ose,
tota
l cho
lest
erol
, hig
h-de
nsity
lipo
prot
ein
chol
este
rol,
low
-den
sity
lipo
prot
ein
chol
este
rol,
and
TG.
‡Oth
er p
heno
type
s in
clud
e sy
stol
ic a
nd d
iast
olic
blo
od p
ress
ure,
gly
cohe
mog
lobi
n, C
-rea
ctiv
e pr
otei
n, in
terle
ukin
-6, fi
brin
ogen
, and
blo
od v
isco
sity
.§D
NA s
ampl
es w
ere
colle
cted
for t
he w
hole
coh
ort i
n pr
ior p
hase
s of
ALS
PAC-
M c
ohor
t.
by guest on June 29, 2018http://circgenetics.ahajournals.org/
Dow
nloaded from
4 Borges et al Adiponectin and Metabolic Profile
diseases and rare variants from the 1000 Genomes Project.35 Quality control criteria and imputation using 1000 Genomes European ances-try reference samples have been previously described for studies within UCLEB consortium (University College London, London School of Hygiene & Tropical Medicine, University of Edinburgh and University of Bristol).36 In ALSPAC-M, 557 124 SNPs were directly genotyped us-ing Illumina human660W quad. For quality control, SNPs were exclud-ed if missingness >5%, Hardy–Weinberg equilibrium P value <1×10⁻⁶, or minor allele frequency <1%, and samples were excluded if missing-ness >5%, indeterminate X chromosome heterozygosity, extreme auto-somal heterozygosity, or showing evidence of population stratification. Imputation was performed using 1000 genomes reference panel (Phase 1, Version 3; phased using ShapeIt v2.r644, haplotype release date December 2013) and Impute V2.2.2. For PEL82, genotyping was per-formed by using the Illumina HumanOmni2.5-8v1 array (Illumina Inc), and ≈2 500 000 SNPs were genotyped.37 For PEL82, quality control cri-teria have been previously described,37 and imputation was performed in 2 steps: first, genotypes were phased using SHAPEIT; then, IMPUTE2 was used for the actual imputation. For autosomal and X chromosome SNPs, 1000 Genomes Phase I integrated haplotypes (December 2013 release) and 1000 Genomes Phase I integrated variant set (March 2012 release), respectively, were used. For PEL82, ancestry-informative principal components were based on 370 539 SNPs shared by samples from the HapMap Project, the Human Genome Diversity Project, and PEL82.38 Cohorts contributing to the Metabolomics consortium used different SNP arrays; nongenotyped SNPs were imputed using a 1000 Genomes Project March 2012 version and SNPs with accurate imputa-tion (proper info >0.4) and minor allele count >3 were combined in fixed-effects meta-analysis using double genomic control correction. Further details can be found in the consortium publication.31
Other CovariatesAnthropometric variables (weight and height) were measured in each study using standard procedures, and body mass index was calculated as weight (kg)/height (m)2. Demographic and smoking status infor-mation was obtained through questionnaires.
Data AnalysisBefore multivariable and genetic analyses, each study adjusted meta-bolic measures for age, sex, and, if applicable, place of recruitment (BWHHS and UKCTOCS) or principal components of genomic ances-try (PEL82 and some studies contributing to Metabolomics consortium), and the resulting residuals were transformed to normal distribution and standardized using inverse rank-based normal transformation. Pregnant women from PEL82 (n=73) and ALSPAC-M (n=12) were excluded. As the 74 analyzed metabolic measures are highly correlated, we ad-opted a similar strategy to the Metabolomics consortium31 to correct for multiple testing by estimating the number of independent tests as the number of principal components that explained over 95% of vari-ance in metabolic measures using data from the 2 studies (BWHHS and WHII) with the largest available number of metabolites (n=27 prin-cipal components in both studies). As a result, for both multivariable and Mendelian randomization analyses, we corrected for multiple testing using the Bonferroni method considering 27 independent tests (P=0.05/27≈0.0019). Analyses were conducted in Stata version 12.
Multivariable Regression AnalysisThe conventional multivariable regression association of adiponec-tin with individual metabolites was estimated using a 2-stage indi-vidual participant meta-analysis. In the first stage, linear regression models were fitted for each study. In the second stage, study-specific estimates were meta-analyzed using DerSimonian and Laird random-effect model.39 Heterogeneity across studies was assessed using I2 (as a measure of the relative size of between-study variation and within-study error).40 Three types of subgroup analyses were conducted: sex-stratified analysis, analysis excluding individuals with high risk of cardiometabolic disease (those that had experienced coronary artery disease or stroke or those older than 65 years), and analysis restricted to European studies (excluding PEL82).
Genetic AnalysesFour independent SNPs in the vicinity of ADIPOQ locus (±50 kb), previously identified to predict adiponectin levels, were se-lected22,41 (details in Methods in the Data Supplement). These SNPs (rs6810075, rs16861209, rs17366568, and rs3774261) are estimated to explain ≈4% of variance in adiponectin concentration (details in Methods in the Data Supplement). Data for the association of each selected SNP with adiponectin concentration in the discovery sample of ADIPOGen, the largest consortium of genome-wide association studies for adiponectin, were downloaded from https://www.mcgill.ca/genepi/adipogen-consortium.
Association of Genetic Variants With Classical ConfoundersThe association between genetic variants and classical con-founders (sex, age, ancestry [European versus non-European], current smoking [yes versus no], and body mass index) was examined for each study that provided individual-level data using logistic or linear regression models for binary or con-tinuous variables, respectively.
Mendelian Randomization AnalysisTo allow all participants with relevant genetic and metabolic measure data to contribute to analyses, even when adiponectin data were not available (as in CaPS, UKCTOCS, ALSPAC-M, and Metabolomics consortium), a 2-sample Mendelian ran-domization design was used, in which data for the association between genetic variants and adiponectin levels were obtained from an external data source, the ADIPOGen consortium.42 The 2-sample Mendelian randomization is a recent extension to the
Figure 1. Schematic representation of studies contributing to each analytic approach. From the available data sources, 3 had data on adiponectin and metabolic measures and could contrib-ute to multivariable analysis (PEL82 [1982 Pelotas Birth Cohort], BWHHS [British Women’s Heart and Health Study], and WHII study [Whitehall II]), and all had data on genetic variants and metabolic measures and could contribute to Mendelian random-ization analysis (PEL82, BWHHS, WHII, CaPS [the Caerphilly Pro-spective Study], UKCTOCS [the United Kingdom Collaborative Trial of Ovarian Cancer Screening], ALSPAC-M [Cohort of Moth-ers From the Avon Longitudinal Study of Children and Parents], and Metabolomics consortium).
by guest on June 29, 2018http://circgenetics.ahajournals.org/
Dow
nloaded from
5 Borges et al Adiponectin and Metabolic Profile
more conventional 1-sample Mendelian randomization and, when samples are independent, has the additional advantage of avoiding bias because of genetic variants correlating with con-founders by chance (statistical overfitting).43 The 2-sample Men-delian randomization estimates and respective SEs were obtained by combining SNP-specific Wald ratios, as described by Burgess et al44 and detailed in Methods in the Data Supplement. Study-specific Mendelian randomization estimates were meta-analyzed using DerSimonian and Laird random-effect model.39 Heteroge-neity across studies was assessed using I2.40 Subgroup analyses were conducted considering individual-level (sex and risk of car-diometabolic disease) and study-level characteristics (European versus non-European studies). The Metabolomics consortium did not contribute to subgroup analysis of individual-level charac-teristics as only summary data were available.
Comparison Between Multivariable and Mendelian Randomization AnalysesResults from conventional multivariable and Mendelian randomiza-tion analyses for each metabolic measure were compared using the Z test (details in the Methods in the Data Supplement) and by estimat-ing the correlation between multivariable and Mendelian randomiza-tion estimates across all metabolic measures. Power calculations for multivariable and Mendelian randomization analysis are available in Table I in the Data Supplement.
ResultsThe study included a median sample size of 3008 adults in the multivariable analysis (range: 2470–5909) and a median sample size of 29 146 adults in the Mendelian randomization analysis (range: 4647–37 545). Total sample size for each metabolite in multivariable and Mendelian randomization
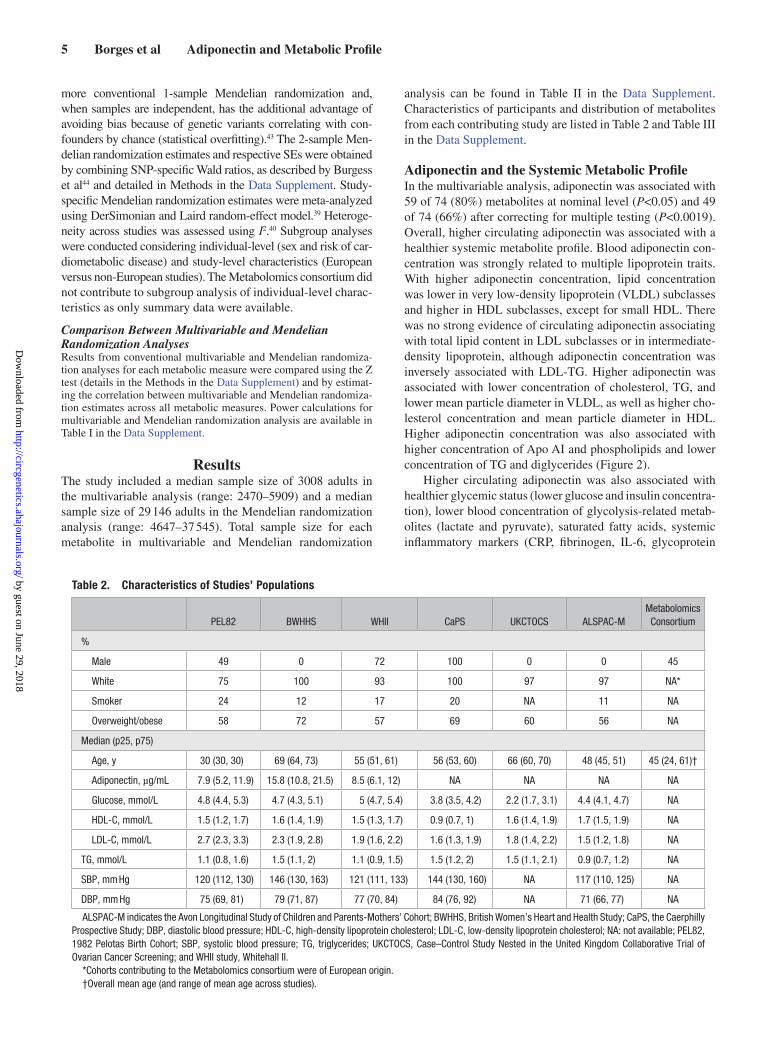
analysis can be found in Table II in the Data Supplement. Characteristics of participants and distribution of metabolites from each contributing study are listed in Table 2 and Table III in the Data Supplement.
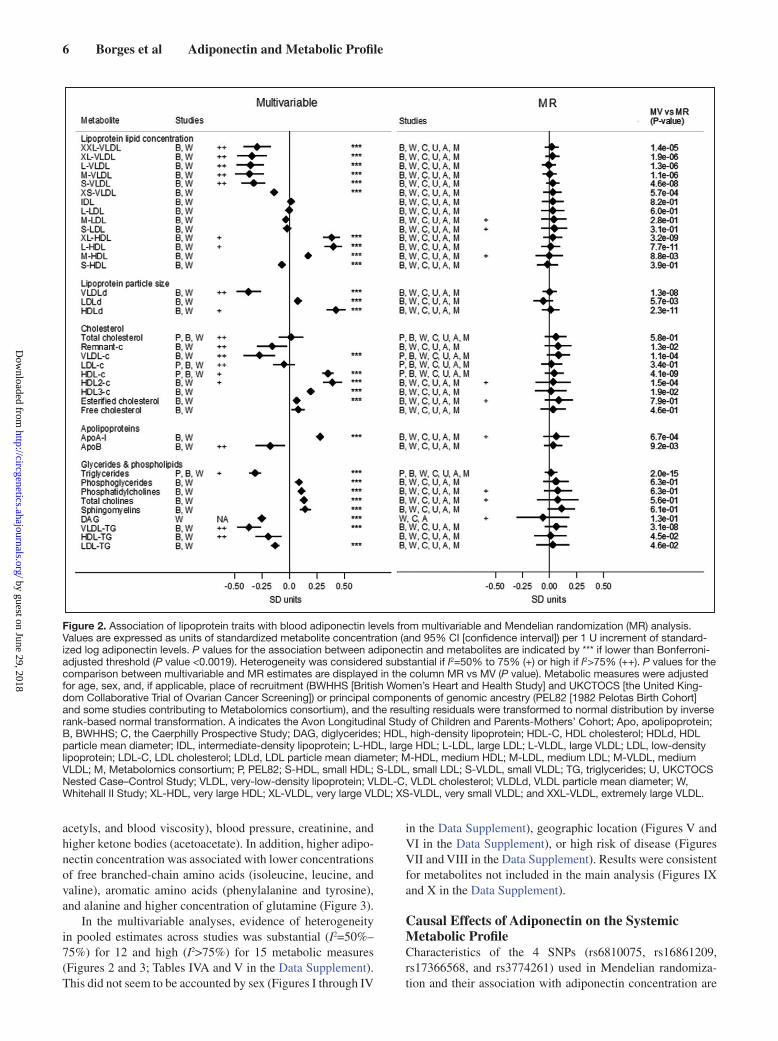
Adiponectin and the Systemic Metabolic ProfileIn the multivariable analysis, adiponectin was associated with 59 of 74 (80%) metabolites at nominal level (P<0.05) and 49 of 74 (66%) after correcting for multiple testing (P<0.0019). Overall, higher circulating adiponectin was associated with a healthier systemic metabolite profile. Blood adiponectin con-centration was strongly related to multiple lipoprotein traits. With higher adiponectin concentration, lipid concentration was lower in very low-density lipoprotein (VLDL) subclasses and higher in HDL subclasses, except for small HDL. There was no strong evidence of circulating adiponectin associating with total lipid content in LDL subclasses or in intermediate-density lipoprotein, although adiponectin concentration was inversely associated with LDL-TG. Higher adiponectin was associated with lower concentration of cholesterol, TG, and lower mean particle diameter in VLDL, as well as higher cho-lesterol concentration and mean particle diameter in HDL. Higher adiponectin concentration was also associated with higher concentration of Apo AI and phospholipids and lower concentration of TG and diglycerides (Figure 2).
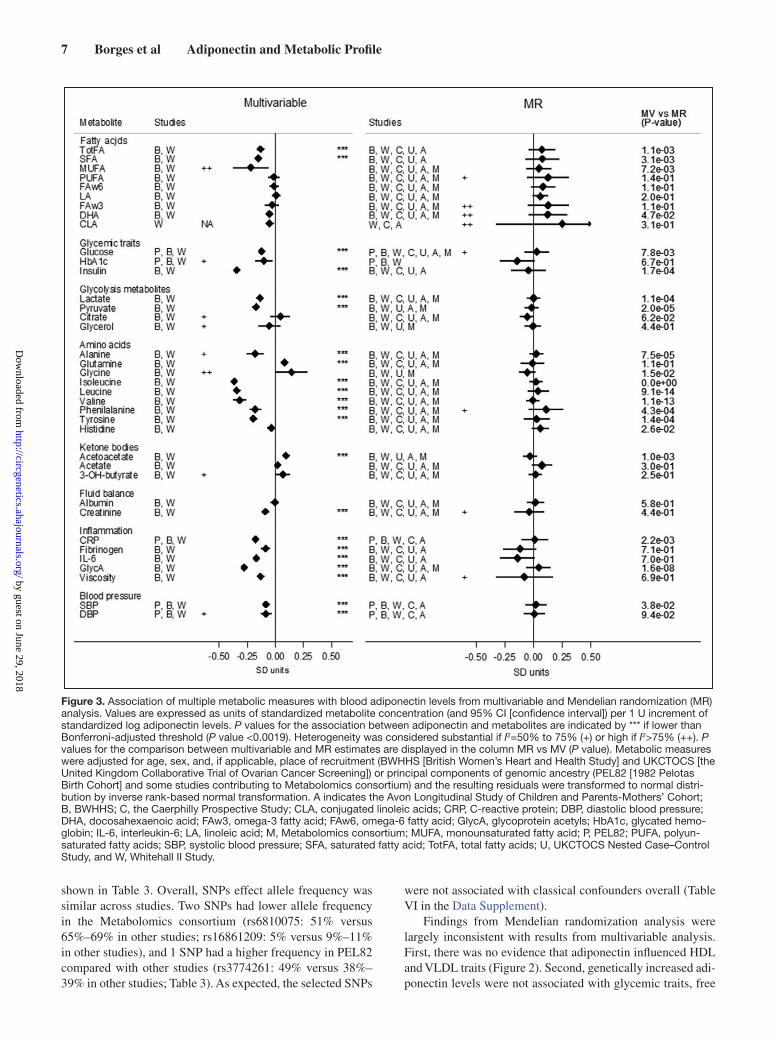
Higher circulating adiponectin was also associated with healthier glycemic status (lower glucose and insulin concentra-tion), lower blood concentration of glycolysis-related metab-olites (lactate and pyruvate), saturated fatty acids, systemic inflammatory markers (CRP, fibrinogen, IL-6, glycoprotein
Table 2. Characteristics of Studies’ Populations
PEL82 BWHHS WHII CaPS UKCTOCS ALSPAC-MMetabolomics Consortium
%
Male 49 0 72 100 0 0 45
White 75 100 93 100 97 97 NA*
Smoker 24 12 17 20 NA 11 NA
Overweight/obese 58 72 57 69 60 56 NA
Median (p25, p75)
Age, y 30 (30, 30) 69 (64, 73) 55 (51, 61) 56 (53, 60) 66 (60, 70) 48 (45, 51) 45 (24, 61)†
Adiponectin, µg/mL 7.9 (5.2, 11.9) 15.8 (10.8, 21.5) 8.5 (6.1, 12) NA NA NA NA
Glucose, mmol/L 4.8 (4.4, 5.3) 4.7 (4.3, 5.1) 5 (4.7, 5.4) 3.8 (3.5, 4.2) 2.2 (1.7, 3.1) 4.4 (4.1, 4.7) NA
HDL-C, mmol/L 1.5 (1.2, 1.7) 1.6 (1.4, 1.9) 1.5 (1.3, 1.7) 0.9 (0.7, 1) 1.6 (1.4, 1.9) 1.7 (1.5, 1.9) NA
LDL-C, mmol/L 2.7 (2.3, 3.3) 2.3 (1.9, 2.8) 1.9 (1.6, 2.2) 1.6 (1.3, 1.9) 1.8 (1.4, 2.2) 1.5 (1.2, 1.8) NA
TG, mmol/L 1.1 (0.8, 1.6) 1.5 (1.1, 2) 1.1 (0.9, 1.5) 1.5 (1.2, 2) 1.5 (1.1, 2.1) 0.9 (0.7, 1.2) NA
SBP, mm Hg 120 (112, 130) 146 (130, 163) 121 (111, 133) 144 (130, 160) NA 117 (110, 125) NA
DBP, mm Hg 75 (69, 81) 79 (71, 87) 77 (70, 84) 84 (76, 92) NA 71 (66, 77) NA
ALSPAC-M indicates the Avon Longitudinal Study of Children and Parents-Mothers’ Cohort; BWHHS, British Women’s Heart and Health Study; CaPS, the Caerphilly Prospective Study; DBP, diastolic blood pressure; HDL-C, high-density lipoprotein cholesterol; LDL-C, low-density lipoprotein cholesterol; NA: not available; PEL82, 1982 Pelotas Birth Cohort; SBP, systolic blood pressure; TG, triglycerides; UKCTOCS, Case–Control Study Nested in the United Kingdom Collaborative Trial of Ovarian Cancer Screening; and WHII study, Whitehall II.
*Cohorts contributing to the Metabolomics consortium were of European origin.†Overall mean age (and range of mean age across studies).
by guest on June 29, 2018http://circgenetics.ahajournals.org/
Dow
nloaded from
6 Borges et al Adiponectin and Metabolic Profile
acetyls, and blood viscosity), blood pressure, creatinine, and higher ketone bodies (acetoacetate). In addition, higher adipo-nectin concentration was associated with lower concentrations of free branched-chain amino acids (isoleucine, leucine, and valine), aromatic amino acids (phenylalanine and tyrosine), and alanine and higher concentration of glutamine (Figure 3).
In the multivariable analyses, evidence of heterogeneity in pooled estimates across studies was substantial (I2=50%–75%) for 12 and high (I2>75%) for 15 metabolic measures (Figures 2 and 3; Tables IVA and V in the Data Supplement). This did not seem to be accounted by sex (Figures I through IV
in the Data Supplement), geographic location (Figures V and VI in the Data Supplement), or high risk of disease (Figures VII and VIII in the Data Supplement). Results were consistent for metabolites not included in the main analysis (Figures IX and X in the Data Supplement).
Causal Effects of Adiponectin on the Systemic Metabolic ProfileCharacteristics of the 4 SNPs (rs6810075, rs16861209, rs17366568, and rs3774261) used in Mendelian randomiza-tion and their association with adiponectin concentration are
Figure 2. Association of lipoprotein traits with blood adiponectin levels from multivariable and Mendelian randomization (MR) analysis. Values are expressed as units of standardized metabolite concentration (and 95% CI [confidence interval]) per 1 U increment of standard-ized log adiponectin levels. P values for the association between adiponectin and metabolites are indicated by *** if lower than Bonferroni-adjusted threshold (P value <0.0019). Heterogeneity was considered substantial if I2=50% to 75% (+) or high if I2>75% (++). P values for the comparison between multivariable and MR estimates are displayed in the column MR vs MV (P value). Metabolic measures were adjusted for age, sex, and, if applicable, place of recruitment (BWHHS [British Women’s Heart and Health Study] and UKCTOCS [the United King-dom Collaborative Trial of Ovarian Cancer Screening]) or principal components of genomic ancestry (PEL82 [1982 Pelotas Birth Cohort] and some studies contributing to Metabolomics consortium), and the resulting residuals were transformed to normal distribution by inverse rank-based normal transformation. A indicates the Avon Longitudinal Study of Children and Parents-Mothers’ Cohort; Apo, apolipoprotein; B, BWHHS; C, the Caerphilly Prospective Study; DAG, diglycerides; HDL, high-density lipoprotein; HDL-C, HDL cholesterol; HDLd, HDL particle mean diameter; IDL, intermediate-density lipoprotein; L-HDL, large HDL; L-LDL, large LDL; L-VLDL, large VLDL; LDL, low-density lipoprotein; LDL-C, LDL cholesterol; LDLd, LDL particle mean diameter; M-HDL, medium HDL; M-LDL, medium LDL; M-VLDL, medium VLDL; M, Metabolomics consortium; P, PEL82; S-HDL, small HDL; S-LDL, small LDL; S-VLDL, small VLDL; TG, triglycerides; U, UKCTOCS Nested Case–Control Study; VLDL, very-low-density lipoprotein; VLDL-C, VLDL cholesterol; VLDLd, VLDL particle mean diameter; W, Whitehall II Study; XL-HDL, very large HDL; XL-VLDL, very large VLDL; XS-VLDL, very small VLDL; and XXL-VLDL, extremely large VLDL.
by guest on June 29, 2018http://circgenetics.ahajournals.org/
Dow
nloaded from
7 Borges et al Adiponectin and Metabolic Profile
shown in Table 3. Overall, SNPs effect allele frequency was similar across studies. Two SNPs had lower allele frequency in the Metabolomics consortium (rs6810075: 51% versus 65%–69% in other studies; rs16861209: 5% versus 9%–11% in other studies), and 1 SNP had a higher frequency in PEL82 compared with other studies (rs3774261: 49% versus 38%–39% in other studies; Table 3). As expected, the selected SNPs
were not associated with classical confounders overall (Table VI in the Data Supplement).
Findings from Mendelian randomization analysis were largely inconsistent with results from multivariable analysis. First, there was no evidence that adiponectin influenced HDL and VLDL traits (Figure 2). Second, genetically increased adi-ponectin levels were not associated with glycemic traits, free
Figure 3. Association of multiple metabolic measures with blood adiponectin levels from multivariable and Mendelian randomization (MR) analysis. Values are expressed as units of standardized metabolite concentration (and 95% CI [confidence interval]) per 1 U increment of standardized log adiponectin levels. P values for the association between adiponectin and metabolites are indicated by *** if lower than Bonferroni-adjusted threshold (P value <0.0019). Heterogeneity was considered substantial if I2=50% to 75% (+) or high if I2>75% (++). P values for the comparison between multivariable and MR estimates are displayed in the column MR vs MV (P value). Metabolic measures were adjusted for age, sex, and, if applicable, place of recruitment (BWHHS [British Women’s Heart and Health Study] and UKCTOCS [the United Kingdom Collaborative Trial of Ovarian Cancer Screening]) or principal components of genomic ancestry (PEL82 [1982 Pelotas Birth Cohort] and some studies contributing to Metabolomics consortium) and the resulting residuals were transformed to normal distri-bution by inverse rank-based normal transformation. A indicates the Avon Longitudinal Study of Children and Parents-Mothers’ Cohort; B, BWHHS; C, the Caerphilly Prospective Study; CLA, conjugated linoleic acids; CRP, C-reactive protein; DBP, diastolic blood pressure; DHA, docosahexaenoic acid; FAw3, omega-3 fatty acid; FAw6, omega-6 fatty acid; GlycA, glycoprotein acetyls; HbA1c, glycated hemo-globin; IL-6, interleukin-6; LA, linoleic acid; M, Metabolomics consortium; MUFA, monounsaturated fatty acid; P, PEL82; PUFA, polyun-saturated fatty acids; SBP, systolic blood pressure; SFA, saturated fatty acid; TotFA, total fatty acids; U, UKCTOCS Nested Case–Control Study, and W, Whitehall II Study.
by guest on June 29, 2018http://circgenetics.ahajournals.org/
Dow
nloaded from

8 Borges et al Adiponectin and Metabolic Profile
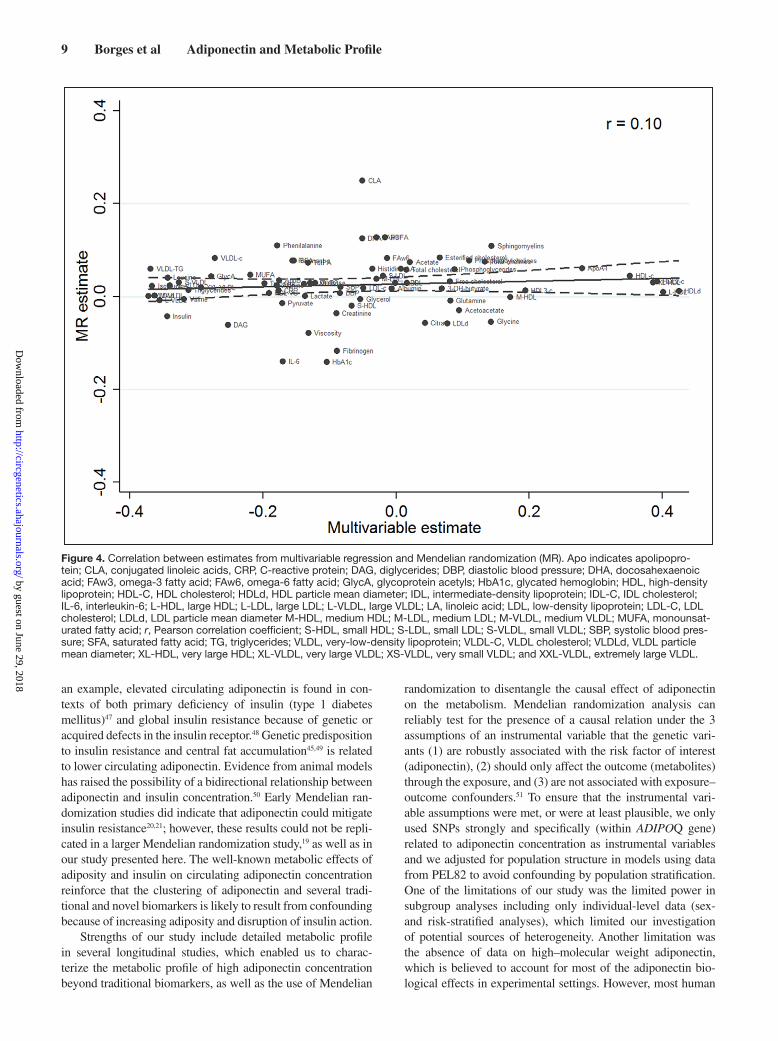
amino acids, and glycolysis-related metabolites (Figure 3). Results were less conclusive for some inflammatory mark-ers (IL-6 and fibrinogen; Figure 3). Third, there was strong statistical evidence that associations from multivariable and Mendelian randomization analyses were inconsistent with each other (Figures 2 and 3), and the overall correlation between multivariable and Mendelian randomization esti-mates was low (r=0.10; Figure 4). Finally, in the Mendelian randomization analysis, adiponectin was not associated with any of the metabolic measures at either P <0.05 or P <0.0019.
In the Mendelian randomization analyses, evidence of het-erogeneity in pooled estimates across studies was substantial (I2=50%–75%) for 14 and high (I2>75%) for 3 metabolic mea-sures, suggesting lower heterogeneity in models from genetic analysis than from the multivariable analyses (Figures 2 and 3; Tables IVB and V in the Data Supplement). This did not seem to be driven by sex differences (Figures I through IV in the Data Supplement), geographic location/ethnicity (Figures V and VI in the Data Supplement), or high risk of disease (Figures VII and VIII in the Data Supplement). Results were consistent with no association between adiponectin and metabolites not included in the main analysis (Figures IX and X in the Data Supplement).
DiscussionIn ≤5909 adults, we found using multivariable regression analyses that circulating adiponectin was associated with a pattern of systemic metabolites levels associated with good health. Higher blood adiponectin concentration was associated with higher HDL lipids and lower VLDL lipids, glycemia, and branched-chain amino acids levels. However, when we used genetic variants in the vicinity of adiponectin-encoding gene to test the causal effect of adiponectin on systemic metabolic profiles among ≤37 545 adults, we found little evidence that the associations were causal.
Genetic association studies indicate that genetic variants associated with circulating adiponectin (in loci other than ADIPOQ) are also associated with cardiometabolic outcomes, such as type 2 diabetes mellitus42 and coronary heart disease41; however, this is likely to be reflecting a pleiotropic effect of these variants. Our findings and previous Mendelian random-ization studies19,22 suggest that the association between circulat-ing adiponectin and metabolic biomarkers and cardiometabolic diseases is likely to be explained by shared factors (confound-ing) rather than by a direct role of adiponectin on metabolism and downstream cardiometabolic disease. These results are in contrast to findings from animal models pointing to insulin-sensitizing and antiatherogenic actions of adiponectin.1
Circulating adiponectin is known to be substantially reduced among obese individuals, particularly in the presence of central fat accumulation.45 A recent Mendelian randomiza-tion study examining the causal metabolic effects of body mass index demonstrated that lower body mass index was related to favorable lipoprotein subclass profile and lower concentra-tion of branched-chain amino acids, inflammatory markers, and insulin,34 which is remarkably similar to our results from the conventional multivariable analysis. In addition, numer-ous studies have shown that adiponectin production is sup-pressed by insulin action in humans, which seems to be at least partly attributed to regulation at the transcriptional level.46 As
Table 3. Characteristics of SNPs Selected for Mendelian Randomization Analysis
SNP
rs6810075 rs16861209 rs17366568 rs3774261
Chr 3 3 3 3
Position* 186548565 186563114 186570453 186571559
Closest gene ADIPOQ ADIPOQ ADIPOQ-AS1, ADIPOQ
ADIPOQ-AS1, ADIPOQ
EA T A G A
NEA C C A G
ADIPOGen consortium
EAF† 0.63 0.07 0.90 0.39
β 0.11 0.31 0.25 0.11
SE 0.01 0.02 0.01 0.01
PEL82
EAF 0.65 0.11 0.92 0.49
β 0.13 0.33 0.22 0.08
SE 0.03 0.04 0.05 0.03
R2 0.008 0.021 0.005 0.002
BWHHS
EAF 0.67 0.09 0.89 0.38
β 0.32 0.30 1.04 0.30
SE 0.10 0.14 0.24 0.08
R2 0.022 0.020 0.051 0.044
WHII
EAF 0.68 0.10 0.89 0.38
β 0.16 0.36 0.56 0.14
SE 0.04 0.05 0.08 0.03
R2 0.008 0.027 0.025 0.010
CaPS§
EAF 0.69 0.10 0.89 0.39
UKCTOCS§
EAF 0.69 0.10 0.89 0.38
ALSPAC-M§
EAF 0.66 0.09 0.93 0.38
Metabolomics consortium§
EAF 0.51 0.05 0.88 0.36
β (and SE) refers to mean difference in standardized log adiponectin per additional SNP effect allele. ALSPAC-M indicates the Avon Longitudinal Study of Children and Parents-Mothers’ Cohort; BWHHS, British Women’s Heart and Health Study; CaPS, the Caerphilly Prospective Study; Chr, chromosome; EA, effect allele; EAF, effect allele frequency; NEA, noneffect allele; PEL82, 1982 Pelotas Birth Cohort; SNP, single-nucleotide polymorphism; UKCTOCS, case–control study nested in the United Kingdom Collaborative Trial of Ovarian Cancer Screening; and WHII study, Whitehall II.
*Genome Reference Consortium Human Build 37.§For CaPS, UKCTOCS, ALSPAC-M, and the Metabolomics consortium, data
on adiponectin levels were not available.†Extracted from Dastani et al (2012).42
by guest on June 29, 2018http://circgenetics.ahajournals.org/
Dow
nloaded from
9 Borges et al Adiponectin and Metabolic Profile
an example, elevated circulating adiponectin is found in con-texts of both primary deficiency of insulin (type 1 diabetes mellitus)47 and global insulin resistance because of genetic or acquired defects in the insulin receptor.48 Genetic predisposition to insulin resistance and central fat accumulation45,49 is related to lower circulating adiponectin. Evidence from animal models has raised the possibility of a bidirectional relationship between adiponectin and insulin concentration.50 Early Mendelian ran-domization studies did indicate that adiponectin could mitigate insulin resistance20,21; however, these results could not be repli-cated in a larger Mendelian randomization study,19 as well as in our study presented here. The well-known metabolic effects of adiposity and insulin on circulating adiponectin concentration reinforce that the clustering of adiponectin and several tradi-tional and novel biomarkers is likely to result from confounding because of increasing adiposity and disruption of insulin action.
Strengths of our study include detailed metabolic profile in several longitudinal studies, which enabled us to charac-terize the metabolic profile of high adiponectin concentration beyond traditional biomarkers, as well as the use of Mendelian
randomization to disentangle the causal effect of adiponectin on the metabolism. Mendelian randomization analysis can reliably test for the presence of a causal relation under the 3 assumptions of an instrumental variable that the genetic vari-ants (1) are robustly associated with the risk factor of interest (adiponectin), (2) should only affect the outcome (metabolites) through the exposure, and (3) are not associated with exposure–outcome confounders.51 To ensure that the instrumental vari-able assumptions were met, or were at least plausible, we only used SNPs strongly and specifically (within ADIPOQ gene) related to adiponectin concentration as instrumental variables and we adjusted for population structure in models using data from PEL82 to avoid confounding by population stratification. One of the limitations of our study was the limited power in subgroup analyses including only individual-level data (sex- and risk-stratified analyses), which limited our investigation of potential sources of heterogeneity. Another limitation was the absence of data on high–molecular weight adiponectin, which is believed to account for most of the adiponectin bio-logical effects in experimental settings. However, most human
Figure 4. Correlation between estimates from multivariable regression and Mendelian randomization (MR). Apo indicates apolipopro-tein; CLA, conjugated linoleic acids, CRP, C-reactive protein; DAG, diglycerides; DBP, diastolic blood pressure; DHA, docosahexaenoic acid; FAw3, omega-3 fatty acid; FAw6, omega-6 fatty acid; GlycA, glycoprotein acetyls; HbA1c, glycated hemoglobin; HDL, high-density lipoprotein; HDL-C, HDL cholesterol; HDLd, HDL particle mean diameter; IDL, intermediate-density lipoprotein; IDL-C, IDL cholesterol; IL-6, interleukin-6; L-HDL, large HDL; L-LDL, large LDL; L-VLDL, large VLDL; LA, linoleic acid; LDL, low-density lipoprotein; LDL-C, LDL cholesterol; LDLd, LDL particle mean diameter M-HDL, medium HDL; M-LDL, medium LDL; M-VLDL, medium VLDL; MUFA, monounsat-urated fatty acid; r, Pearson correlation coefficient; S-HDL, small HDL; S-LDL, small LDL; S-VLDL, small VLDL; SBP, systolic blood pres-sure; SFA, saturated fatty acid; TG, triglycerides; VLDL, very-low-density lipoprotein; VLDL-C, VLDL cholesterol; VLDLd, VLDL particle mean diameter; XL-HDL, very large HDL; XL-VLDL, very large VLDL; XS-VLDL, very small VLDL; and XXL-VLDL, extremely large VLDL.
by guest on June 29, 2018http://circgenetics.ahajournals.org/
Dow
nloaded from
10 Borges et al Adiponectin and Metabolic Profile
(and many animal model) studies have not used high–molecu-lar weight adiponectin, and we found the same multivariable observational associations as in previous studies. Also, it should be emphasized that SNPs in ADIPOQ gene are associated with both total and high–molecular weight adiponectin,52–54 includ-ing SNPs we used in our analysis (eg, rs3774261)52 or others in high linkage disequilibrium with these (eg, rs16861209 is highly correlated with rs17300539 − R2 >0.8).53,54
Overall, our findings suggest that low circulating adipo-nectin is likely to reflect adipocyte dysfunction and that altered total blood adiponectin concentration is an epiphenomenon in the context of metabolic disease, rather than a key determinant. Therefore, interventions targeting manipulation of adiponec-tin concentration are unlikely to result in therapeutic benefits for tackling cardiometabolic diseases. Our results highlight the potential of Mendelian randomization analysis and high-through-put metabolomics profiling to yield important insights to advance our understanding in the pathophysiology of common complex diseases and to inform which targets are best bets for taking for-ward into drug development, given that drug target validation is a key obstacle underlying the unsustainably high rate of drug development failure. Although our and other studies suggest that adiponectin is not a valuable target for developing drugs aimed at preventing cardiometabolic diseases, it may nonetheless be a valuable biomarker for predicting these diseases given the wide-ranging associations shown here. The associations we have found would need to be replicated in additional independent studies before testing their ability to predict disease outcomes.
AcknowledgmentsWe acknowledge Andy Ryan for his contribution to data collection from UKCTOCS (the United Kingdom Collaborative Trial of Ovarian Cancer Screening). Summary genome-wide association data on adipo-nectin have been contributed by ADIPOGen Consortium and have been downloaded from https://www.mcgill.ca/genepi/adipogen-consortium. Summary genome-wide association data on metabolic measures have been contributed by Kettunen et al31 and have been downloaded from http://www.computationalmedicine.fi/data#NMR_GWAS.
Sources of FundingDrs Borges, Ferreira, Lawlor, and Gaunt work in the MRC Integrative Epidemiology Unit at the University of Bristol that receives funding from the UK Medical Research Council (MC_UU_12013/5 and MC_UU_12013/8). Dr Borges is supported by MRC Skills Development Fellowship (MR/P014054/1). Dr Lawlor is a UK National Institute of Health Research Senior Investigator (NF-SI-0611-10196). Dr Kivimaki is supported by the UK Medical Research Council (K013351). PEL82 (the 1982 Pelotas Birth Cohort) is conducted by Postgraduate Program in Epidemiology at Universidade Federal de Pelotas with the collabo-ration of the Brazilian Public Health Association (ABRASCO). From 2004 to 2013, the Wellcome Trust supported PEL82. The International Development Research Center, World Health Organization, Overseas Development Administration, European Union, National Support Program for Centers of Excellence (PRONEX), the Brazilian National Research Council (CNPq), and the Brazilian Ministry of Health sup-ported previous phases of the study. The UCL-LSHTM-Edinburgh-Bristol (UCLEB) consortium, which is supported by the British Heart Foundation Program Grant RG/10/12/28456, consists of 12 studies: NPHS II (Northwick Park Heart Study II), BRHS (British Regional Heart Study), WHII study (Whitehall II), ELSA (English Longitudinal Study of Ageing), MRC NSHD (Medical Research Council National Survey of Health and Development), 1958BC (1958 Birth cohort), CaPS (Caerphilly Prospective Study), BWHHS (British Women’s Heart and Health Study), EAS (Edinburgh Artery Study), EHDPS
(Edinburgh Heart Disease Prevention Study), ET2DS (Edinburgh Type 2 Diabetes Study), and AAAT (Asymptomatic Atherosclerosis Aspirin Trial). BWHHS is supported by funding from the British Heart Foundation and the Department of Health Policy Research Programme (England). EAS is funded by the British Heart Foundation (Programme Grant RG/98002), with Metabochip genotyping funded by a project grant from the Chief Scientist Office of Scotland (Project Grant CZB/4/672). The WHII study is supported by grants from the Medical Research Council (K013351), British Heart Foundation (RG/07/008/23674), Stroke Association, the US National Heart Lung and Blood Institute (5RO1 HL036310), the US National Institute on Aging (5RO1AG13196), the US Agency for Healthcare Research and Quality (HS06516), and the John D. and Catherine T. MacArthur Foundation Research Networks on Successful Midlife Development and Socio-economic Status and Health. CaPS was funded by the Medical Research Council and undertaken by the former MRC Epidemiology Unit (South Wales). The CaPS DNA bank was established with funding from an MRC project grant. The CaPS data archive is maintained by the University of Bristol. MRC Integrative Epidemiology Unit, Bristol, is supported by MRC grants (MR_UU_12013/1, MR_UU_12013/5 and MR_UU_12013/8). UKCTOCS (the United Kingdom Collaborative Trial of Ovarian Cancer Screening) was funded by the Medical Research Council (G9901012 and G0801228), Cancer Research UK (C1479/A2884), and the Department of Health, with additional sup-port from The Eve Appeal. Phenotypic data for this case–control data set were supported by the National Institute for Health Research, Biomedical Research Centre at University College London Hospital. ALSPAC-M (Cohort of Mothers From the Avon Longitudinal Study of Children and Parents) phenotypic data were collected with funding from the British Heart Foundation (SP/07/008/24066), Wellcome Trust (WT092830M), and UK Research Councils (UKRC) via the MRC (G1001357); genetic data collection was funded by the Wellcome Trust (WT088806). In addition, the ALSPAC full study receives core sup-port from the University of Bristol, UK Medical Research Council and the Wellcome Trust (102215/2/13/2) and the University of Bristol. The ALSPAC team is extremely grateful to all the families who took part in this study, the midwives for their help in recruiting them, and the whole ALSPAC team, which includes interviewers, computer and laboratory technicians, clerical workers, research scientists, volun-teers, managers, receptionists, and nurses.
DisclosuresDr Menon has stock ownership in and research funding from Abcodia Pvt Ltd. The other authors report no conflicts.
References 1. Turer AT, Scherer PE. Adiponectin: mechanistic insights and clini-
cal implications. Diabetologia. 2012;55:2319–2326. doi: 10.1007/s00125-012-2598-x.
2. Arita Y, Kihara S, Ouchi N, Takahashi M, Maeda K, Miyagawa J, et al. Paradoxical decrease of an adipose-specific protein, adiponectin, in obe-sity. Biochem Biophys Res Commun. 1999;257:79–83.
3. Li S, Shin HJ, Ding EL, van Dam RM. Adiponectin levels and risk of type 2 diabetes: a systematic review and meta-analysis. JAMA. 2009;302:179–188. doi: 10.1001/jama.2009.976.
4. Polyzos SA, Toulis KA, Goulis DG, Zavos C, Kountouras J. Serum total adiponectin in nonalcoholic fatty liver disease: a systematic re-view and meta-analysis. Metabolism. 2011;60:313–326. doi: 10.1016/j.metabol.2010.09.003.
5. Matsuzawa Y, Funahashi T, Kihara S, Shimomura I. Adiponectin and metabolic syndrome. Arterioscler Thromb Vasc Biol. 2004;24:29–33. doi: 10.1161/01.ATV.0000099786.99623.EF.
6. Wannamethee SG, Welsh P, Whincup PH, Sawar N, Thomas MC, Gud-narsson V, et al. High adiponectin and increased risk of cardiovascular dis-ease and mortality in asymptomatic older men: does NT-proBNP help to explain this association? Eur J Cardiovasc Prev Rehabil. 2011;18:65–71. doi: 10.1097/HJR.0b013e32833b09d9.
7. Sook Lee E, Park SS, Kim E, Sook Yoon Y, Ahn HY, Park CY, et al. Association between adiponectin levels and coronary heart disease and mortality: a systematic review and meta-analysis. Int J Epidemiol. 2013;42:1029–1039. doi: 10.1093/ije/dyt087.
by guest on June 29, 2018http://circgenetics.ahajournals.org/
Dow
nloaded from
11 Borges et al Adiponectin and Metabolic Profile
8. Menon V, Li L, Wang X, Greene T, Balakrishnan V, Madero M, et al. Adi-ponectin and mortality in patients with chronic kidney disease. J Am Soc Nephrol. 2006;17:2599–2606. doi: 10.1681/ASN.2006040331.
9. Beatty AL, Zhang MH, Ku IA, Na B, Schiller NB, Whooley MA. Adiponec-tin is associated with increased mortality and heart failure in patients with stable ischemic heart disease: data from the Heart and Soul Study. Athero-sclerosis. 2012;220:587–592. doi: 10.1016/j.atherosclerosis.2011.11.038.
10. Sattar N, Nelson SM. Adiponectin, diabetes, and coronary heart dis-ease in older persons: unraveling the paradox. J Clin Endocrinol Metab. 2008;93:3299–3301. doi: 10.1210/jc.2008-1435.
11. Cook JR, Semple RK. Hypoadiponectinemia–cause or consequence of hu-man “insulin resistance”? J Clin Endocrinol Metab. 2010;95:1544–1554. doi: 10.1210/jc.2009-2286.
12. Lawlor DA, Harbord RM, Sterne JA, Timpson N, Davey Smith G. Men-delian randomization: using genes as instruments for making causal in-ferences in epidemiology. Stat Med. 2008;27:1133–1163. doi: 10.1002/sim.3034.
13. Smith GD, Lawlor DA, Harbord R, Timpson N, Day I, Ebrahim S. Clus-tered environments and randomized genes: a fundamental distinction be-tween conventional and genetic epidemiology. PLoS Med. 2007;4:e352. doi: 10.1371/journal.pmed.0040352.
14. Holmes MV, Asselbergs FW, Palmer TM, Drenos F, Lanktree MB, Nelson CP, et al; UCLEB Consortium. Mendelian randomization of blood lipids for coronary heart disease. Eur Heart J. 2015;36:539–550. doi: 10.1093/eurheartj/eht571.
15. Ference BA, Julius S, Mahajan N, Levy PD, Williams KA Sr, Flack JM. Clinical effect of naturally random allocation to lower systolic blood pres-sure beginning before the development of hypertension. Hypertension. 2014;63:1182–1188. doi: 10.1161/HYPERTENSIONAHA.113.02734.
16. Wensley F, Gao P, Burgess S, Kaptoge S, Di Angelantonio E, Shah T, et al; C Reactive Protein Coronary Heart Disease Genetics Collaboration (CCGC). Association between C reactive protein and coronary heart dis-ease: Mendelian randomisation analysis based on individual participant data. BMJ. 2011;342:d548. doi: 10.1136/bmj.d548.
17. Sarwar N, Butterworth AS, Freitag DF, Gregson J, Willeit P, Gorman DN, et al; IL6R Genetics Consortium Emerging Risk Factors Collaboration. Interleukin-6 receptor pathways in coronary heart disease: a collaborative meta-analysis of 82 studies. Lancet. 2012;379:1205–1213. doi: 10.1016/S0140-6736(11)61931-4.
18. Swerdlow DI, Preiss D, Kuchenbaecker KB, Holmes MV, Engmann JE, Shah T, et al; DIAGRAM Consortium; MAGIC Consortium; InterAct Consortium. HMG-coenzyme A reductase inhibition, type 2 diabetes, and bodyweight: evidence from genetic analysis and randomised trials. Lan-cet. 2015;385:351–361. doi: 10.1016/S0140-6736(14)61183-1.
19. Yaghootkar H, Lamina C, Scott RA, Dastani Z, Hivert MF, Warren LL, et al; GENESIS Consortium; RISC Consortium. Mendelian randomization studies do not support a causal role for reduced circulating adiponectin levels in insulin resistance and type 2 diabetes. Diabetes. 2013;62:3589–3598. doi: 10.2337/db13-0128.
20. Mente A, Meyre D, Lanktree MB, Heydarpour M, Davis AD, Miller R, et al.; SHARE Investigators; SHARE-AP Investigators. Causal relation-ship between adiponectin and metabolic traits: a Mendelian randomiza-tion study in a multiethnic population. PLoS One. 2013;8:e66808. doi: 10.1371/journal.pone.0066808.
21. Gao H, Fall T, van Dam RM, Flyvbjerg A, Zethelius B, Ingelsson E, et al. Evidence of a causal relationship between adiponectin levels and insulin sensitivity: a Mendelian randomization study. Diabetes. 2013;62:1338–1344. doi: 10.2337/db12-0935.
22. Borges MC, Lawlor DA, de Oliveira C, White J, Horta BL, Barros AJ. Role of adiponectin in coronary heart disease risk: a Mendelian Randomization Study. Circ Res. 2016;119:491–499. doi: 10.1161/CIRCRESAHA.116.308716.
23. Würtz P, Mäkinen VP, Soininen P, Kangas AJ, Tukiainen T, Kettunen J, et al. Metabolic signatures of insulin resistance in 7,098 young adults. Diabetes. 2012;61:1372–1380. doi: 10.2337/db11-1355.
24. Horta BL, Gigante DP, Gonçalves H, dos Santos Motta J, Loret de Mola C, Oliveira IO, et al. Cohort profile update: The 1982 Pelotas (Brazil) Birth Cohort Study. Int J Epidemiol. 2015;44:441, 441a–441, 441e. doi: 10.1093/ije/dyv017.
25. Victora CG, Barros FC. Cohort profile: the 1982 Pelotas (Brazil) birth cohort study. Int J Epidemiol. 2006;35:237–242. doi: 10.1093/ije/dyi290.
26. Lawlor DA, Ebrahim S, Davey Smith G; British Women’s Heart and Health Study. Socioeconomic position in childhood and adulthood and insulin re-sistance: cross sectional survey using data from British women’s heart and health study. BMJ. 2002;325:805. doi: 10.1136/bmj.326.7387.488.
27. Marmot M, Brunner E. Cohort Profile: the Whitehall II study. Int J Epide-miol. 2005;34:251–256. doi: 10.1093/ije/dyh372.
28. Patterson CC, Blankenberg S, Ben-Shlomo Y, Heslop L, Bayer A, Lowe G, et al. Which biomarkers are predictive specifically for cardiovascular or for non-cardiovascular mortality in men? Evidence from the Caer-philly Prospective Study (CaPS). Int J Cardiol. 2015;201:113–118. doi: 10.1016/j.ijcard.2015.07.106.
29. Menon U, Gentry-Maharaj A, Ryan A, Sharma A, Burnell M, Hallett R, et al. Recruitment to multicentre trials–lessons from UKCTOCS: descriptive study. BMJ. 2008;337:a2079.
30. Fraser A, Macdonald-Wallis C, Tilling K, Boyd A, Golding J, Davey Smith G, et al. Cohort Profile: the Avon Longitudinal Study of Parents and Children: ALSPAC mothers cohort. Int J Epidemiol. 2013;42:97–110. doi: 10.1093/ije/dys066.
31. Kettunen J, Demirkan A, Würtz P, Draisma HH, Haller T, Rawal R, et al. Genome-wide study for circulating metabolites identifies 62 loci and reveals novel systemic effects of LPA. Nat Commun. 2016;7:11122. doi: 10.1038/ncomms11122.
32. Soininen P, Kangas AJ, Würtz P, Tukiainen T, Tynkkynen T, Laatikainen R, et al. High-throughput serum NMR metabonomics for cost-effective holistic studies on systemic metabolism. Analyst. 2009;134:1781–1785. doi: 10.1039/b910205a.
33. Soininen P, Kangas AJ, Würtz P, Suna T, Ala-Korpela M. Quantitative serum nuclear magnetic resonance metabolomics in cardiovascular epi-demiology and genetics. Circ Cardiovasc Genet. 2015;8:192–206. doi: 10.1161/CIRCGENETICS.114.000216.
34. Würtz P, Wang Q, Kangas AJ, Richmond RC, Skarp J, Tiainen M, et al. Metabolic signatures of adiposity in young adults: Mendelian randomiza-tion analysis and effects of weight change. PLoS Med. 2014;11:e1001765. doi: 10.1371/journal.pmed.1001765.
35. Voight BF, Kang HM, Ding J, Palmer CD, Sidore C, Chines PS, et al. The metabochip, a custom genotyping array for genetic studies of metabolic, cardiovascular, and anthropometric traits. PLoS Genet. 2012;8:e1002793. doi: 10.1371/journal.pgen.1002793.
36. Shah T, Engmann J, Dale C, Shah S, White J, Giambartolomei C, et al; UCLEB Consortium. Population genomics of cardiometabolic traits: de-sign of the University College London-London School of Hygiene and Tropical Medicine-Edinburgh-Bristol (UCLEB) Consortium. PLoS One. 2013;8:e71345. doi: 10.1371/journal.pone.0071345.
37. Borges MC, Hartwig FP, Oliveira IO, Horta BL. Is there a causal role for homocysteine concentration in blood pressure? A Mendelian ran-domization study. Am J Clin Nutr. 2016;103:39–49. doi: 10.3945/ajcn.115.116038.
38. Lima-Costa MF, Rodrigues LC, Barreto ML, Gouveia M, Horta BL, Mambrini J, et al; Epigen-Brazil group. Genomic ancestry and ethnoracial self-classification based on 5,871 community-dwelling Brazilians (The Epigen Initiative). Sci Rep. 2015;5:9812. doi: 10.1038/srep09812.
39. DerSimonian R, Laird N. Meta-analysis in clinical trials. Control Clin Tri-als. 1986;7:177–188.
40. Higgins JP, Thompson SG. Quantifying heterogeneity in a meta-analysis. Stat Med. 2002;21:1539–1558. doi: 10.1002/sim.1186.
41. Dastani Z, Johnson T, Kronenberg F, Nelson CP, Assimes TL, März W, et al; CARDIoGRAM Consortium; ADIPOGen Consortium. The shared allelic architecture of adiponectin levels and coronary ar-tery disease. Atherosclerosis. 2013;229:145–148. doi: 10.1016/j.atherosclerosis.2013.03.034.
42. Dastani Z, Hivert MF, Timpson N, Perry JR, Yuan X, Scott RA, et al; DIAGRAM+ Consortium; MAGIC Consortium; GLGC Investigators; MuTHER Consortium; DIAGRAM Consortium; GIANT Consortium; Global B Pgen Consortium; Procardis Consortium; MAGIC investigators; GLGC Consortium. Novel loci for adiponectin levels and their influence on type 2 diabetes and metabolic traits: a multi-ethnic meta-analysis of 45,891 individuals. PLoS Genet. 2012;8:e1002607. doi: 10.1371/journal.pgen.1002607.
43. Lawlor DA. Commentary: On Gao C et al. Mendelian randomization study of adiposity-related traits and risk of breast, ovarian, prostate, lung and colorectal cancer. Int J Epidemiol. 2016;45:908–915. doi: 10.1093/ije/dyw127.
44. Burgess S, Butterworth A, Thompson SG. Mendelian randomization anal-ysis with multiple genetic variants using summarized data. Genet Epide-miol. 2013;37:658–665. doi: 10.1002/gepi.21758.
45. Borges MC, Oliveira IO, Freitas DF, Horta BL, Ong KK, Gigante DP, Bar-ros AJ. Obesity-induced hypoadiponectinaemia: the opposite influences of central and peripheral fat compartments [published online ahead of print March 27, 2017]. Int J Epidemiol. doi: 10.1093/ije/dyx022.
by guest on June 29, 2018http://circgenetics.ahajournals.org/
Dow
nloaded from
12 Borges et al Adiponectin and Metabolic Profile
46. Kern PA, Di Gregorio GB, Lu T, Rassouli N, Ranganathan G. Adipo-nectin expression from human adipose tissue: relation to obesity, insu-lin resistance, and tumor necrosis factor-alpha expression. Diabetes. 2003;52:1779–1785. https://www.ncbi.nlm.nih.gov/pubmed/12829646. Accessed November 9, 2017.
47. Imagawa A, Funahashi T, Nakamura T, Moriwaki M, Tanaka S, Nishizawa H, et al. Elevated serum concentration of adipose-derived factor, adiponec-tin, in patients with type 1 diabetes. Diabetes Care. 2002;25:1665–1666.
48. Semple RK, Cochran EK, Soos MA, Burling KA, Savage DB, Gorden P, et al. Plasma adiponectin as a marker of insulin receptor dysfunction: clin-ical utility in severe insulin resistance. Diabetes Care. 2008;31:977–979. doi: 10.2337/dc07-2194.
49. Yaghootkar H, Scott RA, White CC, Zhang W, Speliotes E, Munroe PB, et al. Genetic evidence for a normal-weight “metabolically obese” phenotype linking insulin resistance, hypertension, coronary artery dis-ease, and type 2 diabetes. Diabetes. 2014;63:4369–4377. doi: 10.2337/db14-0318.
50. Kubota N, Terauchi Y, Kubota T, Kumagai H, Itoh S, Satoh H, et al. Pioglitazone ameliorates insulin resistance and diabetes by both
adiponectin-dependent and -independent pathways. J Biol Chem. 2006;281:8748–8755. doi: 10.1074/jbc.M505649200.
51. Swerdlow DI, Kuchenbaecker KB, Shah S, Sofat R, Holmes MV, White J, et al. Selecting instruments for Mendelian randomization in the wake of genome-wide association studies. Int J Epidemiol. 2016;45:1600–1616. doi: 10.1093/ije/dyw088.
52. Qi L, Menzaghi C, Salvemini L, De Bonis C, Trischitta V, Hu FB. Novel locus FER is associated with serum HMW adiponectin levels. Diabetes. 2011;60:2197–2201. doi: 10.2337/db10-1645.
53. Menzaghi C, De Cosmo S, Copetti M, Salvemini L, De Bonis C, Man-giacotti D, et al. Relationship between ADIPOQ gene, circulating high molecular weight adiponectin and albuminuria in individuals with nor-mal kidney function: evidence from a family-based study. Diabetologia. 2011;54:812–818. doi: 10.1007/s00125-010-2037-9.
54. Menzaghi C, Salvemini L, Paroni G, De Bonis C, Mangiacotti D, Fini G, et al. Circulating high molecular weight adiponectin isoform is heritable and shares a common genetic background with insulin resistance in nondi-abetic White Caucasians from Italy: evidence from a family-based study. J Intern Med. 2010;267:287–294. doi: 10.1111/j.1365-2796.2009.02141.x.
CLINICAL PERSPECTIVEAdiponectin, a protein produced by adipose cells, has insulin-sensitizing, anti-inflammatory, antiatherogenic, and cardio-myocyte-protective properties in animal models. In prospective studies in humans, higher circulating adiponectin is asso-ciated with lower risk of type 2 diabetes mellitus, hepatic dysfunction, and metabolic syndrome. However, it is not clear whether adiponectin is protective against these metabolic disorders or whether these associations are just reflecting reverse causality (where disease status could alter adiponectin concentration) or residual confounding (where adiponectin could be a marker of another causal factor, such as adiposity or insulin resistance). We used Mendelian randomization to clarify whether circulating adiponectin is causally related to the metabolic profile of ≤37 545 adults. Four common genetic vari-ants nearby the gene encoding adiponectin (ADIPOQ) were used as instruments to test the effect of circulating adiponectin on 74 metabolic measures selected to broadly represent the systemic metabolite profile, including lipoprotein subclasses, fatty acids, glycemic traits, free amino acids, inflammatory markers, and blood pressure. Overall, our findings do not sup-port a direct role of circulating adiponectin on the systemic metabolic profile in humans and indicate that the clustering of adiponectin and several traditional and novel biomarkers is likely to result from confounding or reverse causality. Therefore, interventions targeting manipulation of adiponectin concentration are unlikely to result in therapeutic benefits for tackling metabolic diseases. by guest on June 29, 2018
http://circgenetics.ahajournals.org/D
ownloaded from
Fourkala, Debbie A. Lawlor and Aroon D. HingoraniBen-Shlomo, Deise F. Freitas, Isabel O. Oliveira, Aleksandra Gentry-Maharaj, Evangelia
Bernardo Lessa Horta, Mika Kivimaki, Meena Kumari, Usha Menon, Tom R. Gaunt, Yoav Maria Carolina Borges, Aluísio J.D. Barros, Diana L. Santos Ferreira, Juan Pablo Casas,
Metabolic Profiling of Adiponectin Levels in Adults: Mendelian Randomization Analysis
Print ISSN: 1942-325X. Online ISSN: 1942-3268 Copyright © 2017 American Heart Association, Inc. All rights reserved.
Dallas, TX 75231is published by the American Heart Association, 7272 Greenville Avenue,Circulation: Cardiovascular Genetics
doi: 10.1161/CIRCGENETICS.117.0018372017;10:Circ Cardiovasc Genet.
Free via Open Access http://circgenetics.ahajournals.org/content/10/6/e001837
World Wide Web at: The online version of this article, along with updated information and services, is located on the
http://circgenetics.ahajournals.org/content/suppl/2017/12/12/CIRCGENETICS.117.001837.DC1Data Supplement (unedited) at:
http://circgenetics.ahajournals.org//subscriptions/
is online at: Circulation: Cardiovascular Genetics Information about subscribing to Subscriptions:
http://www.lww.com/reprints Information about reprints can be found online at: Reprints:
document. Permissions and Rights Question and Answer information about this process is available in the
requested is located, click Request Permissions in the middle column of the Web page under Services. FurtherCenter, not the Editorial Office. Once the online version of the published article for which permission is being
can be obtained via RightsLink, a service of the Copyright ClearanceCirculation: Cardiovascular Geneticsin Requests for permissions to reproduce figures, tables, or portions of articles originally publishedPermissions:
by guest on June 29, 2018http://circgenetics.ahajournals.org/
Dow
nloaded from

SUPPLEMENTAL MATERIAL

SUPPLEMENTARY METHODS
Nuclear magnetic resonance (NMR) spectroscopy platform
Over 150 quantified metabolomic measures were obtained per sample of
EDTA-plasma, using a 1D proton (1H) NMR spectroscopy-based platform described
previously (1-4). Briefly, the serum samples were stored in a freezer at -80oC. The
frozen samples were first slowly thawed in a refrigerator (+4oC) overnight prior to
metabolomics profiling. 260 µL plasma and 260 µL sodium phosphate buffer (75 mM
Na2HPO4, 0.08% sodium 3-(trimethylsilyl)propionate-2,2,3,3-d4, 0.04% sodium azide
in 80%/20% H20/D2O, pH 7.4) were mixed and transferred to NMR tubes using an 8-
channel, Varispan Janus liquid handling robot (PerkinElmer). NMR spectra were
acquired using a Bruker Avance III HD 500MHz spectrometer with a room temperature
5mm, inverse triple resonance TXI probe and a Bruker Avance III HD 600MHz
spectrometer equipped with a nitrogen-cooled triple resonance probe (CryoProbe
Prodigy TCI). Both spectrometers were equipped with SampleJet auto-samplers with
cooled (6°C) sample storage. Spectra were acquired using standardized parameters
using three NMR experiments or ‘molecular windows’ to characterize lipoproteins, low
molecular weight metabolites and lipids. Lipid spectra were acquired after a
standardised lipid extraction procedure performed on each sample using a VIAFLO 96
channel electronic pipette (Integra Biosciences). Data pre-processing and
quantification were as previously described (1-4). The NMR spectra were analysed for
absolute quantification using regression models (5). The 14 lipoprotein subclass sizes
were defined as follows: very low density lipoprotein (VLDL) is subdivided into six
subclasses, the largest being extremely large VLDL with particle diameters from 75 nm
upwards and a possible contribution of chylomicrons, and five remaining VLDL
subclasses (average particle diameters of 64.0 nm, 53.6 nm, 44.5 nm, 36.8 nm, and
31.3 nm); Intermediate density lipoprotein (IDL) (28.6 nm), three low density lipoprotein
(LDL) subclasses (25.5 nm, 23.0 nm, and 18.7 nm), and four high density lipoprotein
(HDL) subclasses (14.3 nm, 12.1 nm, 10.9 nm, and 8.7 nm). The mean sizes for VLDL,
LDL and HDL particles were calculated by weighting the corresponding subclass
diameters with their particle concentrations (4). There is a high analytical consistency,
in epidemiological settings, between metabolic measures quantified by the NMR
metabolomics platform and the concentrations obtained from routine clinical chemistry
(6), and other analytical methods, such as gas chromatography (6, 7) and enzymatic

method (6), with correlations >0.9. In addition, the consistency of biomarker
associations with disease incidence for metabolic traits quantified by NMR and two
widely used mass spectroscopy platforms has been demonstrated (6, 7).
Selection of genetic variants
The SNPs used for the Mendelian randomization analysis were selected from
145 SNPs with good evidence (p < 5*10-8) for association with blood adiponectin
concentration in the European ancestry GWAS meta-analysis from the ADIPOGen
consortium (8). ADIPOGen participating studies tested for the additive genetic
association of SNPs with natural log transformed adiponectin levels, while adjusting
for age, sex, BMI, principal components of population stratification and study site
(where appropriate), and for family structure in cohorts with family members.
Independent SNPs within the ADIPOQ locus (± 50 kb) have been previously selected
by Dastani et al (2013) (9) by linkage disequilibrium (LD) prunning of the genome-wide
significant SNPs, retaining SNPs that explained most variance in adiponectin
concentration in each LD block (LD threshold: R2 < 0.05 in HapMap CEU population
(Utah residents with Northern and Western European ancestry)).
The discovery sample from ADIPOGen GWAS was largely independent from
the sample used to estimate the association between SNP and metabolites in our
study. We estimated that, depending on the metabolite, between zero and 26% of
participants included in the analysis of SNP-metabolites association would have been
included in the discovery ADIPOGen GWAS.
Mendelian randomization analyses
The two-sample Mendelian randomization estimates and respective standard
errors were obtained by meta-analyzing SNP-specific Wald ratios (i.e. ratio between
SNP-outcome and SNP-exposure association) with the following formulas:
�̂� = ∑ 𝑋𝑘𝑌𝑘
𝐾𝑘=1 𝜎𝑦𝑘
−2
∑ 𝑋𝑘2𝜎𝑦𝑘
−2 𝐾𝑘=1
𝑆𝐸�̂� = √1
∑ 𝑋𝑘2𝜎𝑦𝑘
−2 𝐾𝑘=1
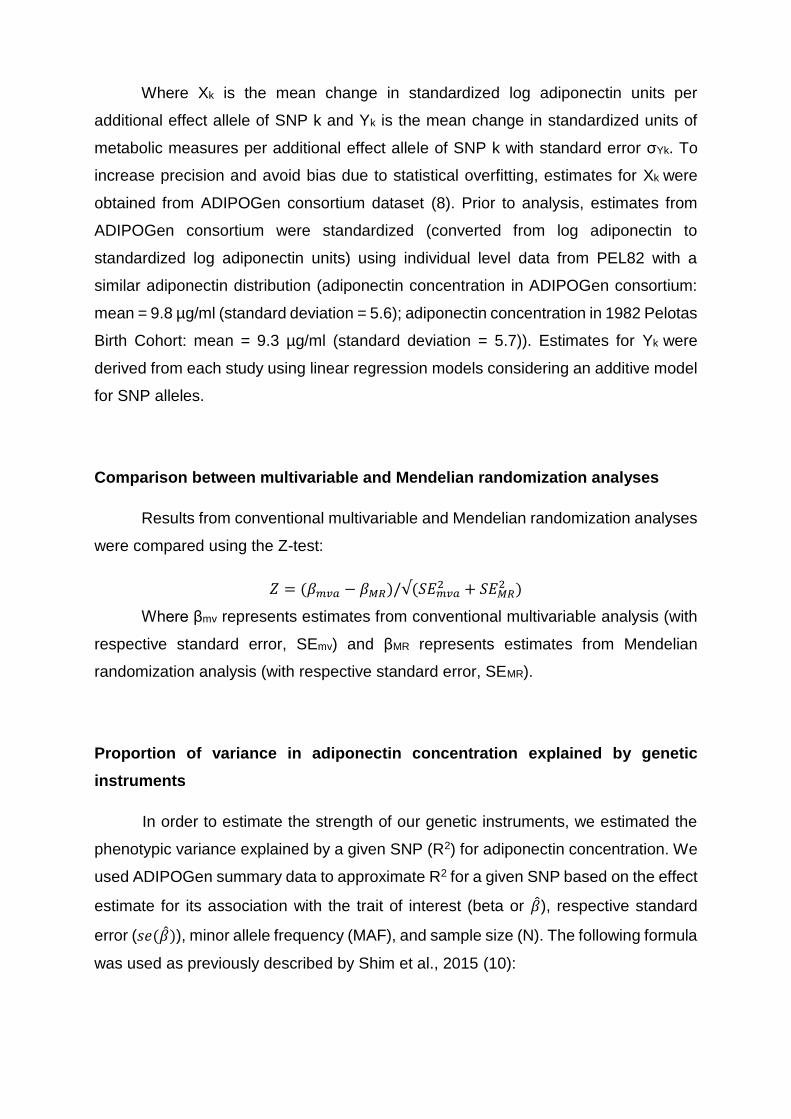
Where Xk is the mean change in standardized log adiponectin units per
additional effect allele of SNP k and Yk is the mean change in standardized units of
metabolic measures per additional effect allele of SNP k with standard error σYk. To
increase precision and avoid bias due to statistical overfitting, estimates for Xk were
obtained from ADIPOGen consortium dataset (8). Prior to analysis, estimates from
ADIPOGen consortium were standardized (converted from log adiponectin to
standardized log adiponectin units) using individual level data from PEL82 with a
similar adiponectin distribution (adiponectin concentration in ADIPOGen consortium:
mean = 9.8 µg/ml (standard deviation = 5.6); adiponectin concentration in 1982 Pelotas
Birth Cohort: mean = 9.3 µg/ml (standard deviation = 5.7)). Estimates for Yk were
derived from each study using linear regression models considering an additive model
for SNP alleles.
Comparison between multivariable and Mendelian randomization analyses
Results from conventional multivariable and Mendelian randomization analyses
were compared using the Z-test:
𝑍 = (𝛽𝑚𝑣𝑎 − 𝛽𝑀𝑅)/√(𝑆𝐸𝑚𝑣𝑎2 + 𝑆𝐸𝑀𝑅
2 )
Where βmv represents estimates from conventional multivariable analysis (with
respective standard error, SEmv) and βMR represents estimates from Mendelian
randomization analysis (with respective standard error, SEMR).
Proportion of variance in adiponectin concentration explained by genetic
instruments
In order to estimate the strength of our genetic instruments, we estimated the
phenotypic variance explained by a given SNP (R2) for adiponectin concentration. We
used ADIPOGen summary data to approximate R2 for a given SNP based on the effect
estimate for its association with the trait of interest (beta or �̂�), respective standard
error (𝑠𝑒(�̂�)), minor allele frequency (MAF), and sample size (N). The following formula
was used as previously described by Shim et al., 2015 (10):

𝑅2 ≅ 2�̂�2𝑀𝐴𝐹(1 − 𝑀𝐴𝐹)
2�̂�2𝑀𝐴𝐹(1 − 𝑀𝐴𝐹) + (𝑠𝑒(�̂�))22𝑁𝑀𝐴𝐹(1 − 𝑀𝐴𝐹)
The phenotypic variance explained by the composite genetic instrument
(combining all SNPs) was estimated by the sum of SNP-specific R2 as shown below:
SNPs used as instrumental variables for adiponectin concentration in Mendelian
randomization analysis and association with adiponectin concentration
rs ID Chr EA NEA EAF R2 N
rs6810075 3 T C 0.63 0.0066 29140
rs16861209 3 A C 0.01 0.0125 29199
rs17366568 3 G A 0.91 0.0125 24865
rs3774261 3 A G 0.60 0.0080 29081
Combined instrument N/A N/A N/A N/A 0.0396 N/A
Chr: chromosome; EA: effect allele (trait-increasing allele); NEA: non-effect allele; R2: proportion of
phenotypic variance explained by SNP; Beta: increase in standardized log adiponectin concentration
per EA; SE: standard error; N: sample size; N/A: not applicable.
References
1. Soininen P, Kangas AJ, Wurtz P, Tukiainen T, Tynkkynen T, Laatikainen R, et al. High-throughput serum NMR metabonomics for cost-effective holistic studies on systemic metabolism. Analyst. 2009;134(9):1781-5. 2. Inouye M, Kettunen J, Soininen P, Silander K, Ripatti S, Kumpula LS, et al. Metabonomic, transcriptomic, and genomic variation of a population cohort. Mol Syst Biol. 2010;6:441. 3. Soininen P, Kangas AJ, Wurtz P, Suna T, Ala-Korpela M. Quantitative serum nuclear magnetic resonance metabolomics in cardiovascular epidemiology and genetics. Circ Cardiovasc Genet. 2015;8(1):192-206. 4. Kujala UM, Makinen VP, Heinonen I, Soininen P, Kangas AJ, Leskinen TH, et al. Long-term leisure-time physical activity and serum metabolome. Circulation. 2013;127(3):340-8. 5. Vehtari A, Makinen VP, Soininen P, Ingman P, Makela SM, Savolainen MJ, et al. A novel Bayesian approach to quantify clinical variables and to determine their spectroscopic counterparts in 1H NMR metabonomic data. BMC Bioinformatics. 2007;8 Suppl 2:S8. 6. Würtz P, Kangas A, Soininen P, Lawlor D, Davey Smith G, Ala-Korpela M. Quantitative serum NMR metabolomics in large-scale epidemiology: a primer on -omic technology. American Journal of Epidemiology. 2017. 7. Wurtz P, Havulinna AS, Soininen P, Tynkkynen T, Prieto-Merino D, Tillin T, et al. Metabolite profiling and cardiovascular event risk: a prospective study of 3 population-based cohorts. Circulation. 2015;131(9):774-85.

8. Dastani Z, Hivert MF, Timpson N, Perry JR, Yuan X, Scott RA, et al. Novel loci for adiponectin levels and their influence on type 2 diabetes and metabolic traits: a multi-ethnic meta-analysis of 45,891 individuals. PLoS Genet. 2012;8(3):e1002607. 9. Dastani Z, Johnson T, Kronenberg F, Nelson CP, Assimes TL, März W, et al. The shared allelic architecture of adiponectin levels and coronary artery disease. Atherosclerosis. 2013;229(1):145-8. 10. Shim H, Chasman DI, Smith JD, Mora S, Ridker PM, Nickerson DA, et al. A multivariate genome-wide association analysis of 10 LDL subfractions, and their response to statin treatment, in 1868 Caucasians. PLoS One. 2015;10(4):e0120758.
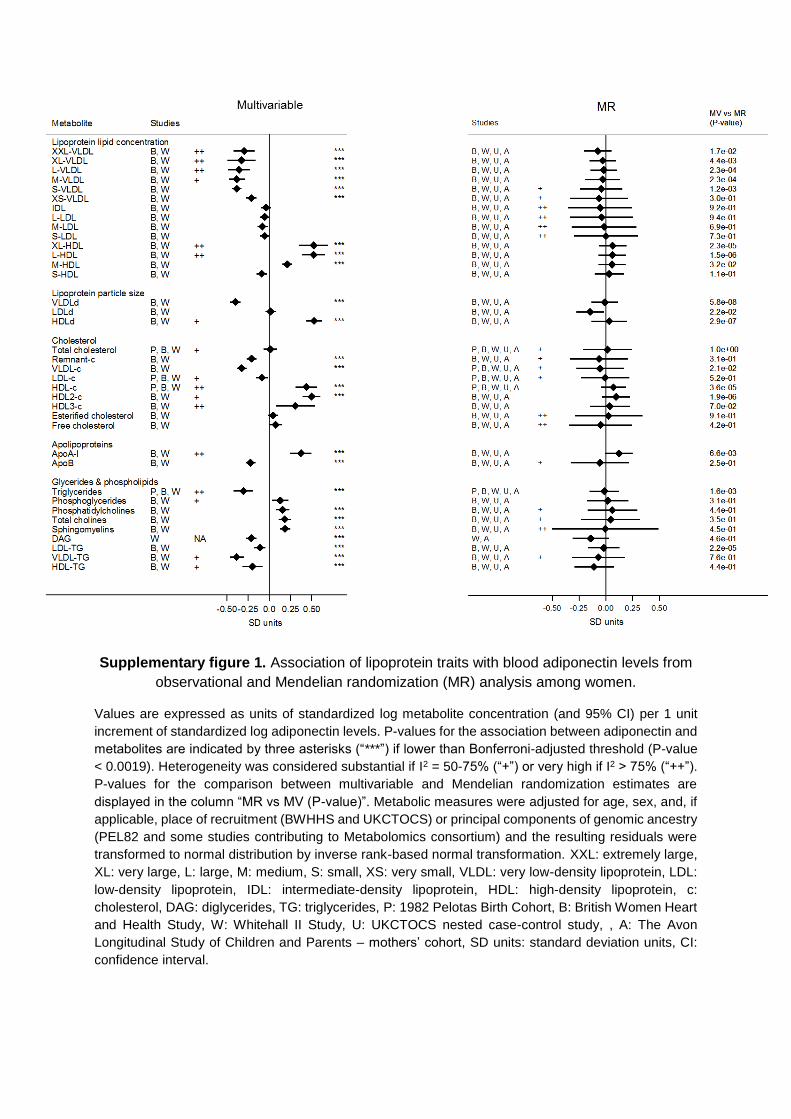
Supplementary figure 1. Association of lipoprotein traits with blood adiponectin levels from
observational and Mendelian randomization (MR) analysis among women.
Values are expressed as units of standardized log metabolite concentration (and 95% CI) per 1 unit
increment of standardized log adiponectin levels. P-values for the association between adiponectin and
metabolites are indicated by three asterisks (“***”) if lower than Bonferroni-adjusted threshold (P-value
< 0.0019). Heterogeneity was considered substantial if I2 = 50-75% (“+”) or very high if I2 > 75% (“++”).
P-values for the comparison between multivariable and Mendelian randomization estimates are
displayed in the column “MR vs MV (P-value)”. Metabolic measures were adjusted for age, sex, and, if
applicable, place of recruitment (BWHHS and UKCTOCS) or principal components of genomic ancestry
(PEL82 and some studies contributing to Metabolomics consortium) and the resulting residuals were
transformed to normal distribution by inverse rank-based normal transformation. XXL: extremely large,
XL: very large, L: large, M: medium, S: small, XS: very small, VLDL: very low-density lipoprotein, LDL:
low-density lipoprotein, IDL: intermediate-density lipoprotein, HDL: high-density lipoprotein, c:
cholesterol, DAG: diglycerides, TG: triglycerides, P: 1982 Pelotas Birth Cohort, B: British Women Heart
and Health Study, W: Whitehall II Study, U: UKCTOCS nested case-control study, , A: The Avon
Longitudinal Study of Children and Parents – mothers’ cohort, SD units: standard deviation units, CI:
confidence interval.

Supplementary figure 2. Association of multiple metabolic measures with blood adiponectin
levels from observational and Mendelian randomization analysis among women.
Values are expressed as units of standardized log metabolite concentration (and 95% CI) per 1 unit increment of
standardized log adiponectin levels. P-values for the association between adiponectin and metabolites are indicated
by three asterisks (“***”) if lower than Bonferroni-adjusted threshold (P-value < 0.0019). Heterogeneity was
considered substantial if I2 = 50-75% (“+”) or very high if I2 > 75% (“++”). P-values for the comparison between
multivariable and Mendelian randomization estimates are displayed in the column “MR vs MV (P-value)”. Metabolic
measures were adjusted for age, sex, and, if applicable, place of recruitment (BWHHS and UKCTOCS) or principal
components of genomic ancestry (PEL82 and some studies contributing to Metabolomics consortium) and the
resulting residuals were transformed to normal distribution by inverse rank-based normal transformation. TotFA:
total fatty acids, SFA: saturated fatty acid, MUFA: monounsaturated fatty acid, PUFA: polyunsaturated fatty acids,
FAw6: omega-6 fatty acid, LA: linoleic acid, FAw3: omega-3 fatty acid, DHA: docosaexaenoic acid, CLA: conjugated
linoleic acids, HbA1c: glycated haemoglobin, CRP: c-reactive protein, IL-6: interleukin-6, GlycA: glycoprotein
acetyls, SBP: systolic blood pressure, DBP: diastolic blood pressure, P: 1982 Pelotas Birth Cohort, B: British
Women Heart and Health Study, W: Whitehall II Study, U: UKCTOCS nested case-control study, A: The Avon
Longitudinal Study of Children and Parents – mothers’ cohort, SD units: standard deviation units, CI: confidence
interval.
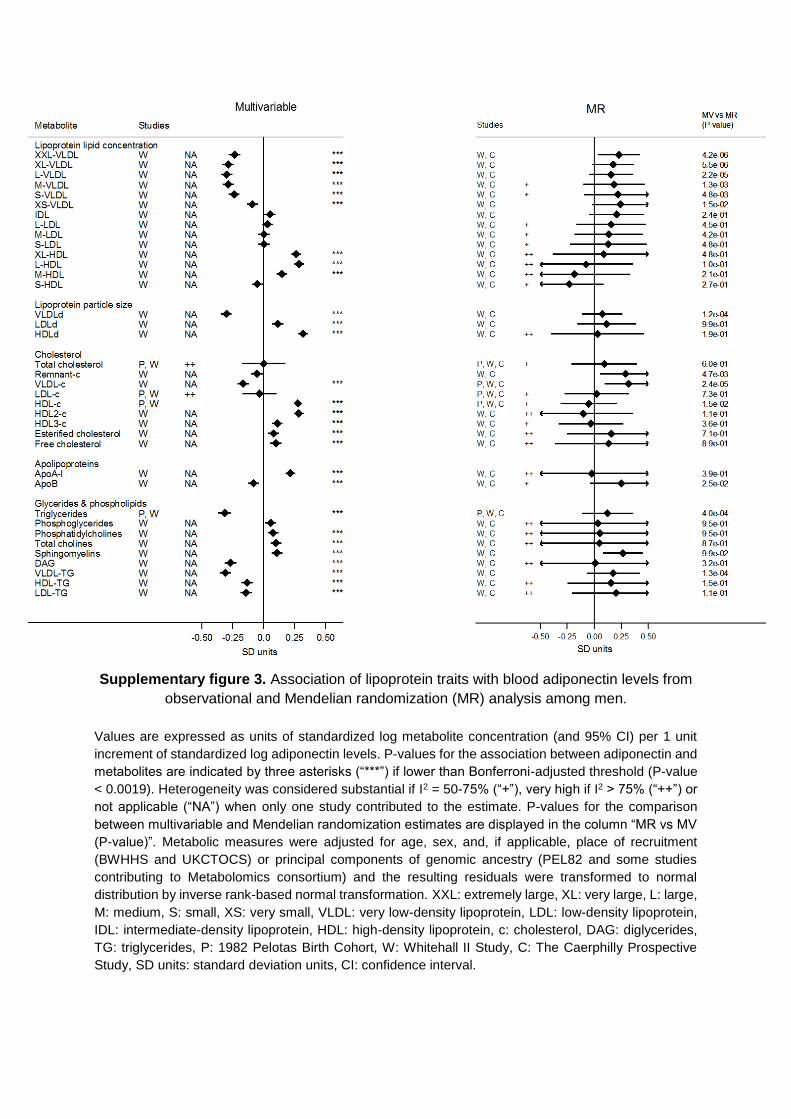
Supplementary figure 3. Association of lipoprotein traits with blood adiponectin levels from
observational and Mendelian randomization (MR) analysis among men.
Values are expressed as units of standardized log metabolite concentration (and 95% CI) per 1 unit
increment of standardized log adiponectin levels. P-values for the association between adiponectin and
metabolites are indicated by three asterisks (“***”) if lower than Bonferroni-adjusted threshold (P-value
< 0.0019). Heterogeneity was considered substantial if I2 = 50-75% (“+”), very high if I2 > 75% (“++”) or
not applicable (“NA”) when only one study contributed to the estimate. P-values for the comparison
between multivariable and Mendelian randomization estimates are displayed in the column “MR vs MV
(P-value)”. Metabolic measures were adjusted for age, sex, and, if applicable, place of recruitment
(BWHHS and UKCTOCS) or principal components of genomic ancestry (PEL82 and some studies
contributing to Metabolomics consortium) and the resulting residuals were transformed to normal
distribution by inverse rank-based normal transformation. XXL: extremely large, XL: very large, L: large,
M: medium, S: small, XS: very small, VLDL: very low-density lipoprotein, LDL: low-density lipoprotein,
IDL: intermediate-density lipoprotein, HDL: high-density lipoprotein, c: cholesterol, DAG: diglycerides,
TG: triglycerides, P: 1982 Pelotas Birth Cohort, W: Whitehall II Study, C: The Caerphilly Prospective
Study, SD units: standard deviation units, CI: confidence interval.

Supplementary figure 4. Association of multiple metabolic measures with blood adiponectin
levels from observational and Mendelian randomization analysis among men.
Values are expressed as units of standardized log metabolite concentration (and 95% CI) per 1 unit
increment of standardized log adiponectin levels. P-values for the association between adiponectin and
metabolites are indicated by three asterisks (“***”) if lower than Bonferroni-adjusted threshold (P-value
< 0.0019). Heterogeneity was considered substantial if I2 = 50-75% (“+”) or very high if I2 > 75% (“++”)
or not applicable (“NA”) when only one study contributed to the estimate. P-values for the comparison
between multivariable and Mendelian randomization estimates are displayed in the column “MR vs MV
(P-value)”. Metabolic measures were adjusted for age, sex, and, if applicable, place of recruitment
(BWHHS and UKCTOCS) or principal components of genomic ancestry (PEL82 and some studies
contributing to Metabolomics consortium) and the resulting residuals were transformed to normal
distribution by inverse rank-based normal transformation. TotFA: total fatty acids, SFA: saturated fatty
acid, MUFA: monounsaturated fatty acid, PUFA: polyunsaturated fatty acids, FAw6: omega-6 fatty acid,
LA: linoleic acid, FAw3: omega-3 fatty acid, DHA: docosaexaenoic acid, CLA: conjugated linoleic acids,
HbA1c: glycated haemoglobin, CRP: c-reactive protein, IL-6: interleukin-6, GlycA: glycoprotein acetyls,
SBP: systolic blood pressure, DBP: diastolic blood pressure, P: 1982 Pelotas Birth Cohort, W: Whitehall
II Study, C: The Caerphilly Prospective Study, SD units: standard deviation units, CI: confidence interval.
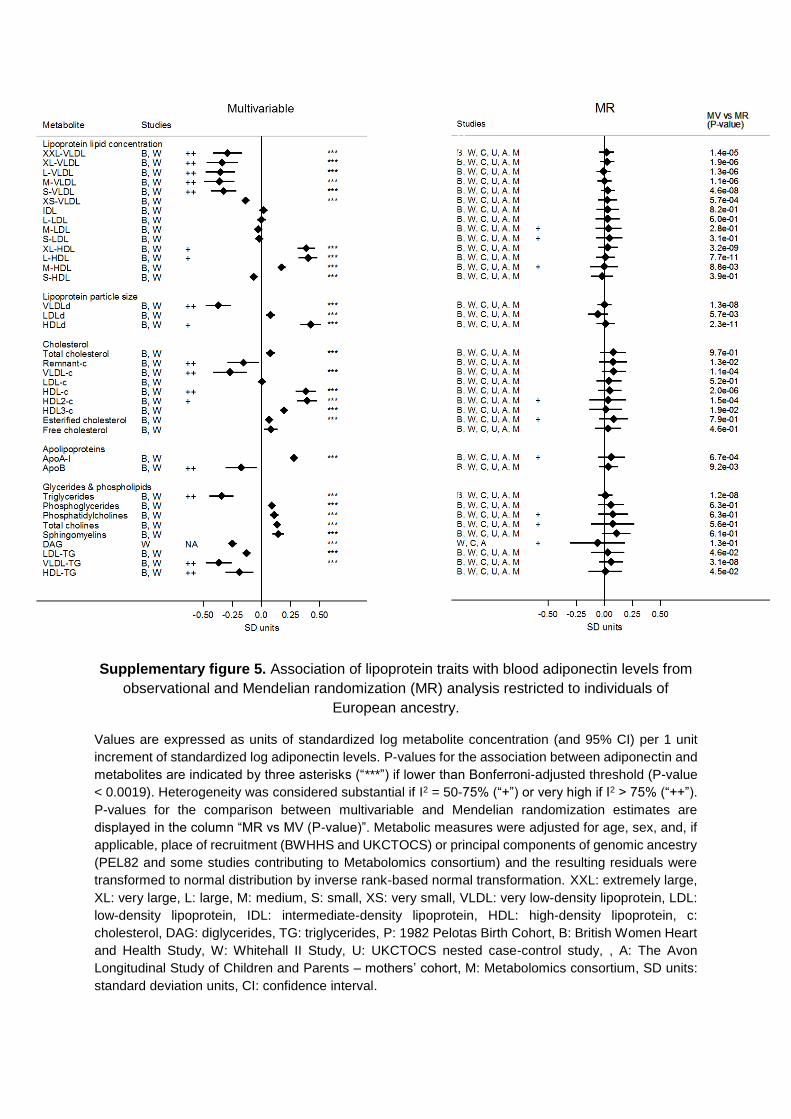
Supplementary figure 5. Association of lipoprotein traits with blood adiponectin levels from
observational and Mendelian randomization (MR) analysis restricted to individuals of
European ancestry.
Values are expressed as units of standardized log metabolite concentration (and 95% CI) per 1 unit
increment of standardized log adiponectin levels. P-values for the association between adiponectin and
metabolites are indicated by three asterisks (“***”) if lower than Bonferroni-adjusted threshold (P-value
< 0.0019). Heterogeneity was considered substantial if I2 = 50-75% (“+”) or very high if I2 > 75% (“++”).
P-values for the comparison between multivariable and Mendelian randomization estimates are
displayed in the column “MR vs MV (P-value)”. Metabolic measures were adjusted for age, sex, and, if
applicable, place of recruitment (BWHHS and UKCTOCS) or principal components of genomic ancestry
(PEL82 and some studies contributing to Metabolomics consortium) and the resulting residuals were
transformed to normal distribution by inverse rank-based normal transformation. XXL: extremely large,
XL: very large, L: large, M: medium, S: small, XS: very small, VLDL: very low-density lipoprotein, LDL:
low-density lipoprotein, IDL: intermediate-density lipoprotein, HDL: high-density lipoprotein, c:
cholesterol, DAG: diglycerides, TG: triglycerides, P: 1982 Pelotas Birth Cohort, B: British Women Heart
and Health Study, W: Whitehall II Study, U: UKCTOCS nested case-control study, , A: The Avon
Longitudinal Study of Children and Parents – mothers’ cohort, M: Metabolomics consortium, SD units:
standard deviation units, CI: confidence interval.

Supplementary figure 6. Association of multiple metabolic measures with blood adiponectin
levels from observational and Mendelian randomization analysis restricted to individuals of
European ancestry.
Values are expressed as units of standardized log metabolite concentration (and 95% CI) per 1 unit increment of
standardized log adiponectin levels. P-values for the association between adiponectin and metabolites are indicated
by three asterisks (“***”) if lower than Bonferroni-adjusted threshold (P-value < 0.0019). Heterogeneity was
considered substantial if I2 = 50-75% (“+”) or very high if I2 > 75% (“++”). P-values for the comparison between
multivariable and Mendelian randomization estimates are displayed in the column “MR vs MV (P-value)”. Metabolic
measures were adjusted for age, sex, and, if applicable, place of recruitment (BWHHS and UKCTOCS) or principal
components of genomic ancestry (PEL82 and some studies contributing to Metabolomics consortium) and the
resulting residuals were transformed to normal distribution by inverse rank-based normal transformation. TotFA:
total fatty acids, SFA: saturated fatty acid, MUFA: monounsaturated fatty acid, PUFA: polyunsaturated fatty acids,
FAw6: omega-6 fatty acid, LA: linoleic acid, FAw3: omega-3 fatty acid, DHA: docosaexaenoic acid, CLA: conjugated
linoleic acids, HbA1c: glycated haemoglobin, CRP: c-reactive protein, IL-6: interleukin-6, GlycA: glycoprotein
acetyls, SBP: systolic blood pressure, DBP: diastolic blood pressure, P: 1982 Pelotas Birth Cohort, B: British
Women Heart and Health Study, W: Whitehall II Study, U: UKCTOCS nested case-control study, A: The Avon
Longitudinal Study of Children and Parents – mothers’ cohort, M: Metabolomics consortium, SD units: standard
deviation units, CI: confidence interval.
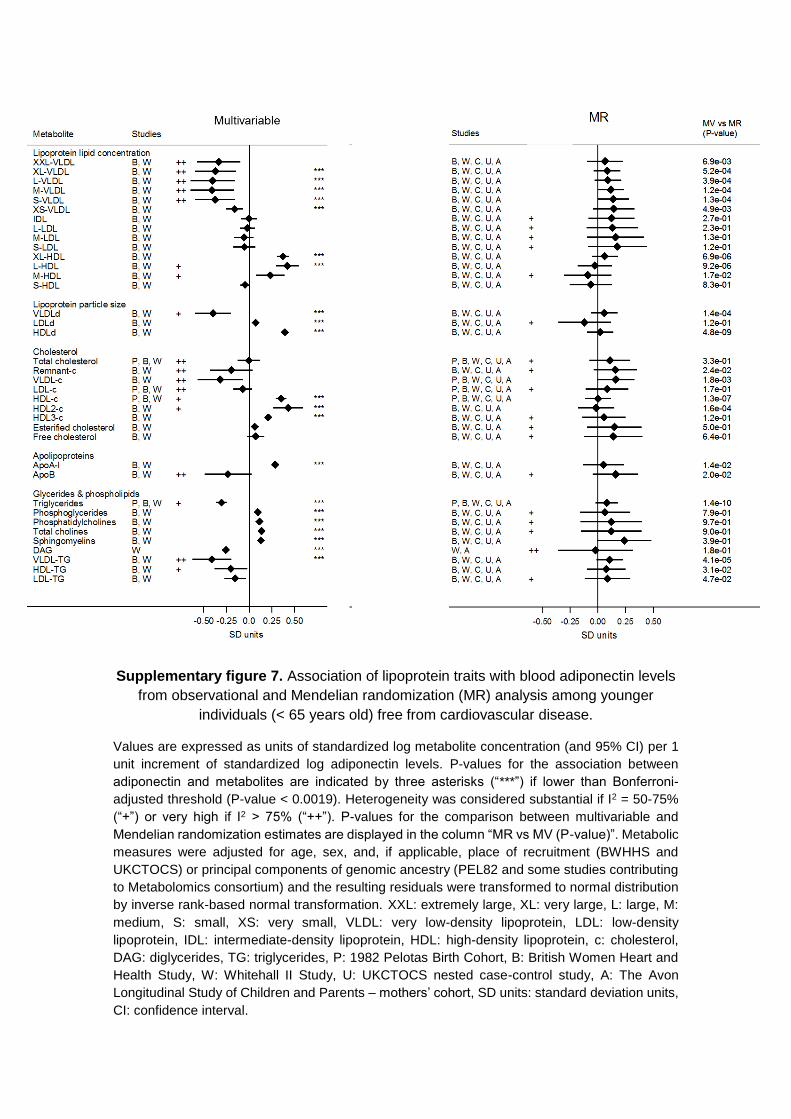
Supplementary figure 7. Association of lipoprotein traits with blood adiponectin levels
from observational and Mendelian randomization (MR) analysis among younger
individuals (< 65 years old) free from cardiovascular disease.
Values are expressed as units of standardized log metabolite concentration (and 95% CI) per 1
unit increment of standardized log adiponectin levels. P-values for the association between
adiponectin and metabolites are indicated by three asterisks (“***”) if lower than Bonferroni-
adjusted threshold (P-value < 0.0019). Heterogeneity was considered substantial if I2 = 50-75%
(“+”) or very high if I2 > 75% (“++”). P-values for the comparison between multivariable and
Mendelian randomization estimates are displayed in the column “MR vs MV (P-value)”. Metabolic
measures were adjusted for age, sex, and, if applicable, place of recruitment (BWHHS and
UKCTOCS) or principal components of genomic ancestry (PEL82 and some studies contributing
to Metabolomics consortium) and the resulting residuals were transformed to normal distribution
by inverse rank-based normal transformation. XXL: extremely large, XL: very large, L: large, M:
medium, S: small, XS: very small, VLDL: very low-density lipoprotein, LDL: low-density
lipoprotein, IDL: intermediate-density lipoprotein, HDL: high-density lipoprotein, c: cholesterol,
DAG: diglycerides, TG: triglycerides, P: 1982 Pelotas Birth Cohort, B: British Women Heart and
Health Study, W: Whitehall II Study, U: UKCTOCS nested case-control study, A: The Avon
Longitudinal Study of Children and Parents – mothers’ cohort, SD units: standard deviation units,
CI: confidence interval.
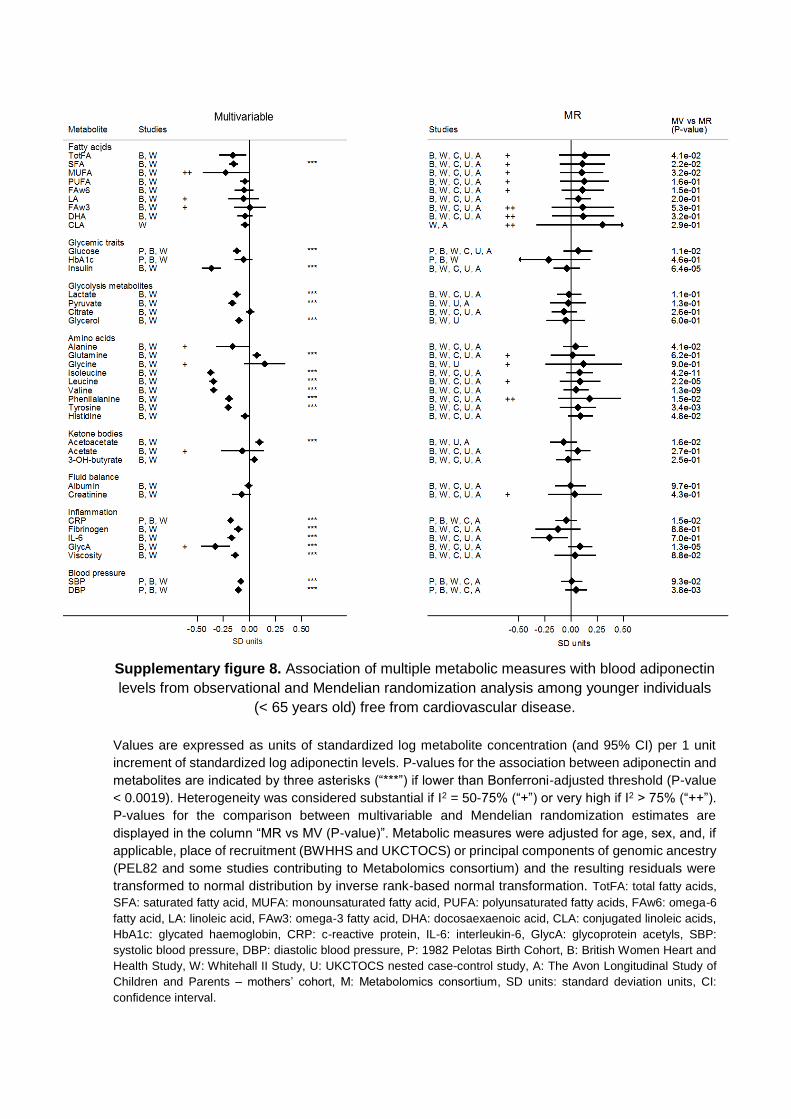
Supplementary figure 8. Association of multiple metabolic measures with blood adiponectin
levels from observational and Mendelian randomization analysis among younger individuals
(< 65 years old) free from cardiovascular disease.
Values are expressed as units of standardized log metabolite concentration (and 95% CI) per 1 unit
increment of standardized log adiponectin levels. P-values for the association between adiponectin and
metabolites are indicated by three asterisks (“***”) if lower than Bonferroni-adjusted threshold (P-value
< 0.0019). Heterogeneity was considered substantial if I2 = 50-75% (“+”) or very high if I2 > 75% (“++”).
P-values for the comparison between multivariable and Mendelian randomization estimates are
displayed in the column “MR vs MV (P-value)”. Metabolic measures were adjusted for age, sex, and, if
applicable, place of recruitment (BWHHS and UKCTOCS) or principal components of genomic ancestry
(PEL82 and some studies contributing to Metabolomics consortium) and the resulting residuals were
transformed to normal distribution by inverse rank-based normal transformation. TotFA: total fatty acids,
SFA: saturated fatty acid, MUFA: monounsaturated fatty acid, PUFA: polyunsaturated fatty acids, FAw6: omega-6
fatty acid, LA: linoleic acid, FAw3: omega-3 fatty acid, DHA: docosaexaenoic acid, CLA: conjugated linoleic acids,
HbA1c: glycated haemoglobin, CRP: c-reactive protein, IL-6: interleukin-6, GlycA: glycoprotein acetyls, SBP:
systolic blood pressure, DBP: diastolic blood pressure, P: 1982 Pelotas Birth Cohort, B: British Women Heart and
Health Study, W: Whitehall II Study, U: UKCTOCS nested case-control study, A: The Avon Longitudinal Study of
Children and Parents – mothers’ cohort, M: Metabolomics consortium, SD units: standard deviation units, CI:
confidence interval.
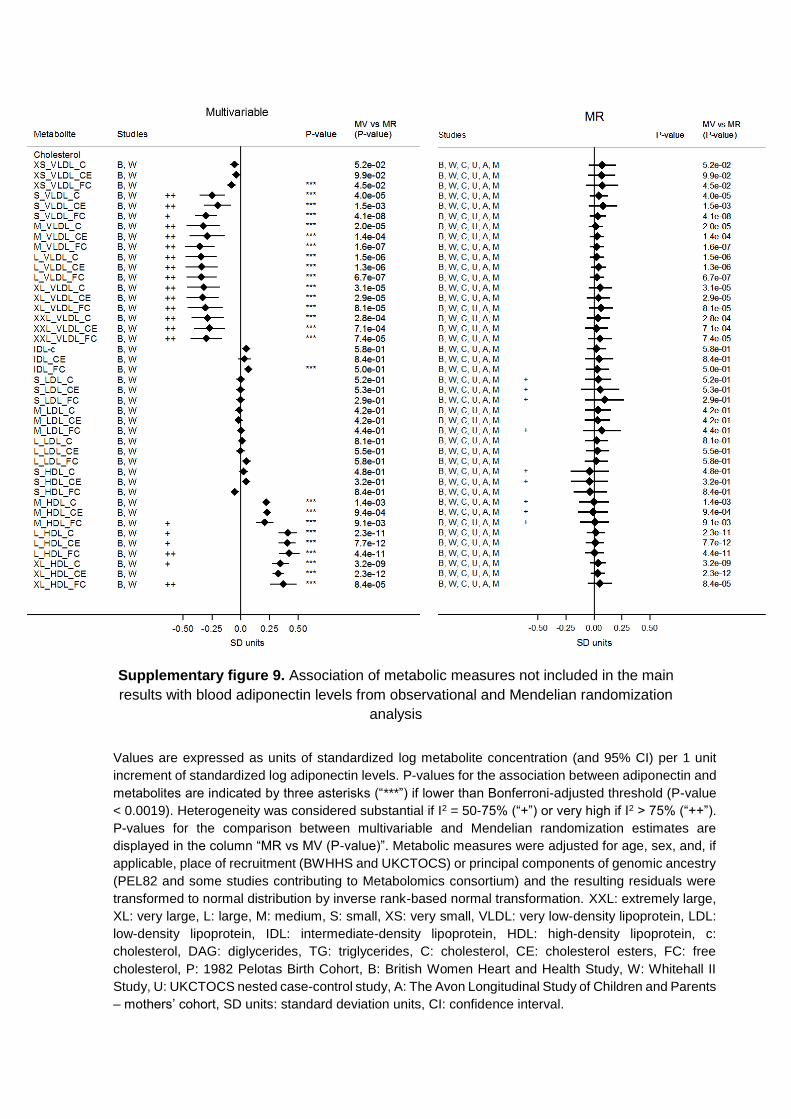
Supplementary figure 9. Association of metabolic measures not included in the main
results with blood adiponectin levels from observational and Mendelian randomization
analysis
Values are expressed as units of standardized log metabolite concentration (and 95% CI) per 1 unit
increment of standardized log adiponectin levels. P-values for the association between adiponectin and
metabolites are indicated by three asterisks (“***”) if lower than Bonferroni-adjusted threshold (P-value
< 0.0019). Heterogeneity was considered substantial if I2 = 50-75% (“+”) or very high if I2 > 75% (“++”).
P-values for the comparison between multivariable and Mendelian randomization estimates are
displayed in the column “MR vs MV (P-value)”. Metabolic measures were adjusted for age, sex, and, if
applicable, place of recruitment (BWHHS and UKCTOCS) or principal components of genomic ancestry
(PEL82 and some studies contributing to Metabolomics consortium) and the resulting residuals were
transformed to normal distribution by inverse rank-based normal transformation. XXL: extremely large,
XL: very large, L: large, M: medium, S: small, XS: very small, VLDL: very low-density lipoprotein, LDL:
low-density lipoprotein, IDL: intermediate-density lipoprotein, HDL: high-density lipoprotein, c:
cholesterol, DAG: diglycerides, TG: triglycerides, C: cholesterol, CE: cholesterol esters, FC: free
cholesterol, P: 1982 Pelotas Birth Cohort, B: British Women Heart and Health Study, W: Whitehall II
Study, U: UKCTOCS nested case-control study, A: The Avon Longitudinal Study of Children and Parents
– mothers’ cohort, SD units: standard deviation units, CI: confidence interval.

Supplementary figure 10. Association of metabolic measures not included in the main
results with blood adiponectin levels from observational and Mendelian randomization
analysis
Values are expressed as units of standardized log metabolite concentration (and 95% CI) per 1 unit
increment of standardized log adiponectin levels. P-values for the association between adiponectin and
metabolites are indicated by three asterisks (“***”) if lower than Bonferroni-adjusted threshold (P-value
< 0.0019). Heterogeneity was considered substantial if I2 = 50-75% (“+”) or very high if I2 > 75% (“++”).
P-values for the comparison between multivariable and Mendelian randomization estimates are
displayed in the column “MR vs MV (P-value)”. Metabolic measures were adjusted for age, sex, and, if
applicable, place of recruitment (BWHHS and UKCTOCS) or principal components of genomic ancestry
(PEL82 and some studies contributing to Metabolomics consortium) and the resulting residuals were
transformed to normal distribution by inverse rank-based normal transformation. XXL: extremely large,
XL: very large, L: large, M: medium, S: small, XS: very small, VLDL: very low-density lipoprotein, LDL:
low-density lipoprotein, IDL: intermediate-density lipoprotein, HDL: high-density lipoprotein, c:
cholesterol, DAG: diglycerides, TG: triglycerides, PL: phospholipids, P: 1982 Pelotas Birth Cohort, B:
British Women Heart and Health Study, W: Whitehall II Study, U: UKCTOCS nested case-control study,
A: The Avon Longitudinal Study of Children and Parents – mothers’ cohort, SD units: standard deviation
units, CI: confidence interval.
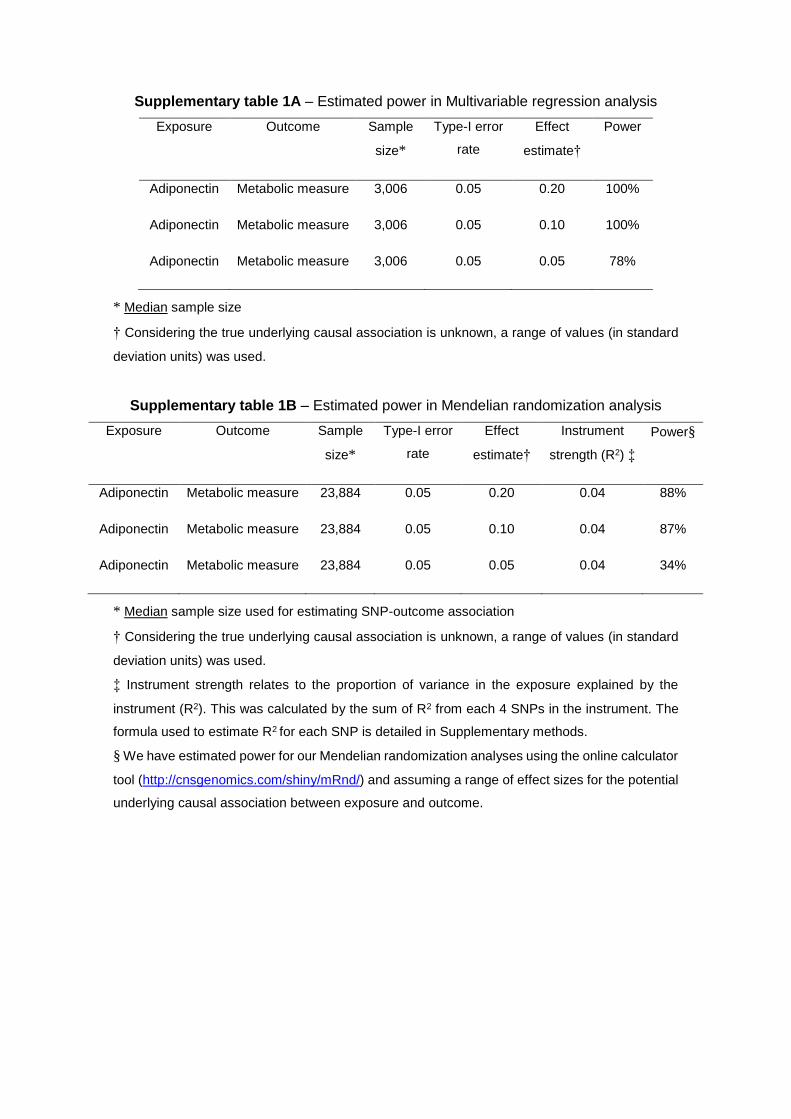
Supplementary table 1A – Estimated power in Multivariable regression analysis
Exposure Outcome Sample
size*
Type-I error
rate
Effect
estimate†
Power
Adiponectin Metabolic measure 3,006 0.05 0.20 100%
Adiponectin Metabolic measure 3,006 0.05 0.10 100%
Adiponectin Metabolic measure 3,006 0.05 0.05 78%
* Median sample size
† Considering the true underlying causal association is unknown, a range of values (in standard
deviation units) was used.
Supplementary table 1B – Estimated power in Mendelian randomization analysis
Exposure Outcome Sample
size*
Type-I error
rate
Effect
estimate†
Instrument
strength (R2) ‡
Power§
Adiponectin Metabolic measure 23,884 0.05 0.20 0.04 88%
Adiponectin Metabolic measure 23,884 0.05 0.10 0.04 87%
Adiponectin Metabolic measure 23,884 0.05 0.05 0.04 34%
* Median sample size used for estimating SNP-outcome association
† Considering the true underlying causal association is unknown, a range of values (in standard
deviation units) was used.
‡ Instrument strength relates to the proportion of variance in the exposure explained by the
instrument (R2). This was calculated by the sum of R2 from each 4 SNPs in the instrument. The
formula used to estimate R2 for each SNP is detailed in Supplementary methods.
§ We have estimated power for our Mendelian randomization analyses using the online calculator
tool (http://cnsgenomics.com/shiny/mRnd/) and assuming a range of effect sizes for the potential
underlying causal association between exposure and outcome.

Supplementary table 2 – Total sample size per metabolite of multivariable and Mendelian
randomization analysis
Metabolic measure Group N (multivariable analysis) N (Mendelian randomization analysis)
Acetoacetate Ketone bodies 3008 28225
Acetate Ketone bodies 3008 34923
Alanine Amino acids 3006 34969
Albumin Fluid balance 3007 29139
ApoA-I Apolipoproteins 3008 28326
ApoB Apolipoproteins 3008 30868
3-OH-butyrate Ketone bodies 3003 34295
Citrate Glycolysis metabolites 3003 34937
CLA Fatty acids 2498 5549
Creatinine Fluid balance 2939 34756
CRP Inflammation 5826 11039
DAG Glycerides & phospholipids 2470 6521
DBP Blood pressure 5909 11821
DHA Fatty acids 2958 23497
Esterified cholesterol Cholesterol 2960 23498
FAw3 Fatty acids 2959 22985
FAw6 Fatty acids 2958 23504
Fibrinogen Inflammation 3029 5675
Free cholesterol Cholesterol 2959 23497
Glucose Glycemic traits 5720 37545
Glutamine Amino acids 3006 34570
Glycerol Glycolysis metabolites 2975 26391
Glycine Amino acids 2954 24919
GlycA Inflammation 3009 29446
HbA1c Glycemic traits 3239 4647
HDL2-c Cholesterol 3008 10183
HDL3-c Cholesterol 3008 10183
HDL-c Cholesterol 5762 30202
HDLd Lipoprotein particle size 3008 29452
HDL-TG Glycerides & phospholipids 3008 10183
Histidine Amino acids 2976 29387
IDL Lipoprotein lipid concentration 3008 29452
IL-6 Inflammation 3106 5585
Isoleucine Amino acids 3008 34947
Insulin Glycemic traits 3155 8148
LA Fatty acids 2958 23524
Lactate Glycolysis metabolites 3009 35047
LDL-c Cholesterol 5762 34492
LDLd Lipoprotein particle size 3008 29452
LDL-TG Glycerides & phospholipids 3008 10183
Leucine Amino acids 3009 34905
L-HDL Lipoprotein lipid concentration 3009 29458
L-LDL Lipoprotein lipid concentration 3009 29458
L-VLDL Lipoprotein lipid concentration 3009 29146
M-HDL Lipoprotein lipid concentration 3009 29458
M-LDL Lipoprotein lipid concentration 3009 29458
MUFA Fatty acids 2958 23522
M-VLDL Lipoprotein lipid concentration 3009 29458
Phosphatidylcholines Glycerides & phospholipids 2960 23502
Phenilalanine Amino acids 3004 32833
PUFA Fatty acids 2958 10003
Pyruvate Glycolysis metabolites 3003 31327
Remnant-c Cholesterol 3008 10183
SBP Blood pressure 5909 11822
Total cholesterol Cholesterol 5762 30763
Triglycerides Glycerides & phospholipids 5762 34478
SFA Fatty acids 2957 9988
S-HDL Lipoprotein lipid concentration 3009 29458
S-LDL Lipoprotein lipid concentration 3009 29458
Sphingomyelins Glycerides & phospholipids 2959 20854
S-VLDL Lipoprotein lipid concentration 3009 29458
Total cholines Glycerides & phospholipids 2960 10007
TotFA Fatty acids 2959 23503
Phosphoglycerides Glycerides & phospholipids 2960 23521
Tyrosine Amino acids 2994 35078
Valine Amino acids 3009 35069
Viscosity Inflammation 3094 4807
VLDL-c Cholesterol 3008 10183
VLDLd Lipoprotein particle size 3008 29452
VLDL-TG Glycerides & phospholipids 3008 10183
XL-HDL Lipoprotein lipid concentration 3009 29458
XL-VLDL Lipoprotein lipid concentration 3009 29458
XS-VLDL Lipoprotein lipid concentration 3009 29458
XXL-VLDL Lipoprotein lipid concentration 3009 29146
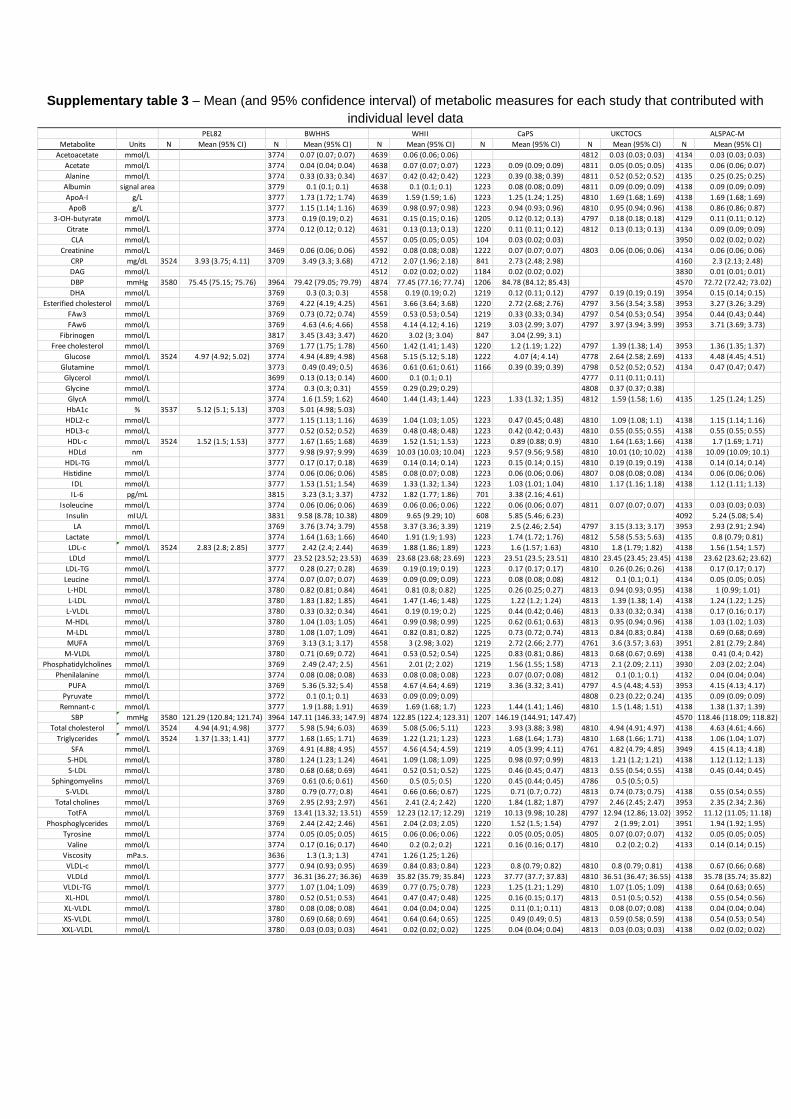
Supplementary table 3 – Mean (and 95% confidence interval) of metabolic measures for each study that contributed with
individual level data
Metabolite Units N Mean (95% CI) N Mean (95% CI) N Mean (95% CI) N Mean (95% CI) N Mean (95% CI) N Mean (95% CI)
Acetoacetate mmol/L 3774 0.07 (0.07; 0.07) 4639 0.06 (0.06; 0.06) 4812 0.03 (0.03; 0.03) 4134 0.03 (0.03; 0.03)
Acetate mmol/L 3774 0.04 (0.04; 0.04) 4638 0.07 (0.07; 0.07) 1223 0.09 (0.09; 0.09) 4811 0.05 (0.05; 0.05) 4135 0.06 (0.06; 0.07)
Alanine mmol/L 3774 0.33 (0.33; 0.34) 4637 0.42 (0.42; 0.42) 1223 0.39 (0.38; 0.39) 4811 0.52 (0.52; 0.52) 4135 0.25 (0.25; 0.25)
Albumin signal area 3779 0.1 (0.1; 0.1) 4638 0.1 (0.1; 0.1) 1223 0.08 (0.08; 0.09) 4811 0.09 (0.09; 0.09) 4138 0.09 (0.09; 0.09)
ApoA-I g/L 3777 1.73 (1.72; 1.74) 4639 1.59 (1.59; 1.6) 1223 1.25 (1.24; 1.25) 4810 1.69 (1.68; 1.69) 4138 1.69 (1.68; 1.69)
ApoB g/L 3777 1.15 (1.14; 1.16) 4639 0.98 (0.97; 0.98) 1223 0.94 (0.93; 0.96) 4810 0.95 (0.94; 0.96) 4138 0.86 (0.86; 0.87)
3-OH-butyrate mmol/L 3773 0.19 (0.19; 0.2) 4631 0.15 (0.15; 0.16) 1205 0.12 (0.12; 0.13) 4797 0.18 (0.18; 0.18) 4129 0.11 (0.11; 0.12)
Citrate mmol/L 3774 0.12 (0.12; 0.12) 4631 0.13 (0.13; 0.13) 1220 0.11 (0.11; 0.12) 4812 0.13 (0.13; 0.13) 4134 0.09 (0.09; 0.09)
CLA mmol/L 4557 0.05 (0.05; 0.05) 104 0.03 (0.02; 0.03) 3950 0.02 (0.02; 0.02)
Creatinine mmol/L 3469 0.06 (0.06; 0.06) 4592 0.08 (0.08; 0.08) 1222 0.07 (0.07; 0.07) 4803 0.06 (0.06; 0.06) 4134 0.06 (0.06; 0.06)
CRP mg/dL 3524 3.93 (3.75; 4.11) 3709 3.49 (3.3; 3.68) 4712 2.07 (1.96; 2.18) 841 2.73 (2.48; 2.98) 4160 2.3 (2.13; 2.48)
DAG mmol/L 4512 0.02 (0.02; 0.02) 1184 0.02 (0.02; 0.02) 3830 0.01 (0.01; 0.01)
DBP mmHg 3580 75.45 (75.15; 75.76) 3964 79.42 (79.05; 79.79) 4874 77.45 (77.16; 77.74) 1206 84.78 (84.12; 85.43) 4570 72.72 (72.42; 73.02)
DHA mmol/L 3769 0.3 (0.3; 0.3) 4558 0.19 (0.19; 0.2) 1219 0.12 (0.11; 0.12) 4797 0.19 (0.19; 0.19) 3954 0.15 (0.14; 0.15)
Esterified cholesterol mmol/L 3769 4.22 (4.19; 4.25) 4561 3.66 (3.64; 3.68) 1220 2.72 (2.68; 2.76) 4797 3.56 (3.54; 3.58) 3953 3.27 (3.26; 3.29)
FAw3 mmol/L 3769 0.73 (0.72; 0.74) 4559 0.53 (0.53; 0.54) 1219 0.33 (0.33; 0.34) 4797 0.54 (0.53; 0.54) 3954 0.44 (0.43; 0.44)
FAw6 mmol/L 3769 4.63 (4.6; 4.66) 4558 4.14 (4.12; 4.16) 1219 3.03 (2.99; 3.07) 4797 3.97 (3.94; 3.99) 3953 3.71 (3.69; 3.73)
Fibrinogen mmol/L 3817 3.45 (3.43; 3.47) 4620 3.02 (3; 3.04) 847 3.04 (2.99; 3.1)
Free cholesterol mmol/L 3769 1.77 (1.75; 1.78) 4560 1.42 (1.41; 1.43) 1220 1.2 (1.19; 1.22) 4797 1.39 (1.38; 1.4) 3953 1.36 (1.35; 1.37)
Glucose mmol/L 3524 4.97 (4.92; 5.02) 3774 4.94 (4.89; 4.98) 4568 5.15 (5.12; 5.18) 1222 4.07 (4; 4.14) 4778 2.64 (2.58; 2.69) 4133 4.48 (4.45; 4.51)
Glutamine mmol/L 3773 0.49 (0.49; 0.5) 4636 0.61 (0.61; 0.61) 1166 0.39 (0.39; 0.39) 4798 0.52 (0.52; 0.52) 4134 0.47 (0.47; 0.47)
Glycerol mmol/L 3699 0.13 (0.13; 0.14) 4600 0.1 (0.1; 0.1) 4777 0.11 (0.11; 0.11)
Glycine mmol/L 3774 0.3 (0.3; 0.31) 4559 0.29 (0.29; 0.29) 4808 0.37 (0.37; 0.38)
GlycA mmol/L 3774 1.6 (1.59; 1.62) 4640 1.44 (1.43; 1.44) 1223 1.33 (1.32; 1.35) 4812 1.59 (1.58; 1.6) 4135 1.25 (1.24; 1.25)
HbA1c % 3537 5.12 (5.1; 5.13) 3703 5.01 (4.98; 5.03)
HDL2-c mmol/L 3777 1.15 (1.13; 1.16) 4639 1.04 (1.03; 1.05) 1223 0.47 (0.45; 0.48) 4810 1.09 (1.08; 1.1) 4138 1.15 (1.14; 1.16)
HDL3-c mmol/L 3777 0.52 (0.52; 0.52) 4639 0.48 (0.48; 0.48) 1223 0.42 (0.42; 0.43) 4810 0.55 (0.55; 0.55) 4138 0.55 (0.55; 0.55)
HDL-c mmol/L 3524 1.52 (1.5; 1.53) 3777 1.67 (1.65; 1.68) 4639 1.52 (1.51; 1.53) 1223 0.89 (0.88; 0.9) 4810 1.64 (1.63; 1.66) 4138 1.7 (1.69; 1.71)
HDLd nm 3777 9.98 (9.97; 9.99) 4639 10.03 (10.03; 10.04) 1223 9.57 (9.56; 9.58) 4810 10.01 (10; 10.02) 4138 10.09 (10.09; 10.1)
HDL-TG mmol/L 3777 0.17 (0.17; 0.18) 4639 0.14 (0.14; 0.14) 1223 0.15 (0.14; 0.15) 4810 0.19 (0.19; 0.19) 4138 0.14 (0.14; 0.14)
Histidine mmol/L 3774 0.06 (0.06; 0.06) 4585 0.08 (0.07; 0.08) 1223 0.06 (0.06; 0.06) 4807 0.08 (0.08; 0.08) 4134 0.06 (0.06; 0.06)
IDL mmol/L 3777 1.53 (1.51; 1.54) 4639 1.33 (1.32; 1.34) 1223 1.03 (1.01; 1.04) 4810 1.17 (1.16; 1.18) 4138 1.12 (1.11; 1.13)
IL-6 pg/mL 3815 3.23 (3.1; 3.37) 4732 1.82 (1.77; 1.86) 701 3.38 (2.16; 4.61)
Isoleucine mmol/L 3774 0.06 (0.06; 0.06) 4639 0.06 (0.06; 0.06) 1222 0.06 (0.06; 0.07) 4811 0.07 (0.07; 0.07) 4133 0.03 (0.03; 0.03)
Insulin mIU/L 3831 9.58 (8.78; 10.38) 4809 9.65 (9.29; 10) 608 5.85 (5.46; 6.23) 4092 5.24 (5.08; 5.4)
LA mmol/L 3769 3.76 (3.74; 3.79) 4558 3.37 (3.36; 3.39) 1219 2.5 (2.46; 2.54) 4797 3.15 (3.13; 3.17) 3953 2.93 (2.91; 2.94)
Lactate mmol/L 3774 1.64 (1.63; 1.66) 4640 1.91 (1.9; 1.93) 1223 1.74 (1.72; 1.76) 4812 5.58 (5.53; 5.63) 4135 0.8 (0.79; 0.81)
LDL-c mmol/L 3524 2.83 (2.8; 2.85) 3777 2.42 (2.4; 2.44) 4639 1.88 (1.86; 1.89) 1223 1.6 (1.57; 1.63) 4810 1.8 (1.79; 1.82) 4138 1.56 (1.54; 1.57)
LDLd mmol/L 3777 23.52 (23.52; 23.53) 4639 23.68 (23.68; 23.69) 1223 23.51 (23.5; 23.51) 4810 23.45 (23.45; 23.45) 4138 23.62 (23.62; 23.62)
LDL-TG mmol/L 3777 0.28 (0.27; 0.28) 4639 0.19 (0.19; 0.19) 1223 0.17 (0.17; 0.17) 4810 0.26 (0.26; 0.26) 4138 0.17 (0.17; 0.17)
Leucine mmol/L 3774 0.07 (0.07; 0.07) 4639 0.09 (0.09; 0.09) 1223 0.08 (0.08; 0.08) 4812 0.1 (0.1; 0.1) 4134 0.05 (0.05; 0.05)
L-HDL mmol/L 3780 0.82 (0.81; 0.84) 4641 0.81 (0.8; 0.82) 1225 0.26 (0.25; 0.27) 4813 0.94 (0.93; 0.95) 4138 1 (0.99; 1.01)
L-LDL mmol/L 3780 1.83 (1.82; 1.85) 4641 1.47 (1.46; 1.48) 1225 1.22 (1.2; 1.24) 4813 1.39 (1.38; 1.4) 4138 1.24 (1.22; 1.25)
L-VLDL mmol/L 3780 0.33 (0.32; 0.34) 4641 0.19 (0.19; 0.2) 1225 0.44 (0.42; 0.46) 4813 0.33 (0.32; 0.34) 4138 0.17 (0.16; 0.17)
M-HDL mmol/L 3780 1.04 (1.03; 1.05) 4641 0.99 (0.98; 0.99) 1225 0.62 (0.61; 0.63) 4813 0.95 (0.94; 0.96) 4138 1.03 (1.02; 1.03)
M-LDL mmol/L 3780 1.08 (1.07; 1.09) 4641 0.82 (0.81; 0.82) 1225 0.73 (0.72; 0.74) 4813 0.84 (0.83; 0.84) 4138 0.69 (0.68; 0.69)
MUFA mmol/L 3769 3.13 (3.1; 3.17) 4558 3 (2.98; 3.02) 1219 2.72 (2.66; 2.77) 4761 3.6 (3.57; 3.63) 3951 2.81 (2.79; 2.84)
M-VLDL mmol/L 3780 0.71 (0.69; 0.72) 4641 0.53 (0.52; 0.54) 1225 0.83 (0.81; 0.86) 4813 0.68 (0.67; 0.69) 4138 0.41 (0.4; 0.42)
Phosphatidylcholines mmol/L 3769 2.49 (2.47; 2.5) 4561 2.01 (2; 2.02) 1219 1.56 (1.55; 1.58) 4713 2.1 (2.09; 2.11) 3930 2.03 (2.02; 2.04)
Phenilalanine mmol/L 3774 0.08 (0.08; 0.08) 4633 0.08 (0.08; 0.08) 1223 0.07 (0.07; 0.08) 4812 0.1 (0.1; 0.1) 4132 0.04 (0.04; 0.04)
PUFA mmol/L 3769 5.36 (5.32; 5.4) 4558 4.67 (4.64; 4.69) 1219 3.36 (3.32; 3.41) 4797 4.5 (4.48; 4.53) 3953 4.15 (4.13; 4.17)
Pyruvate mmol/L 3772 0.1 (0.1; 0.1) 4633 0.09 (0.09; 0.09) 4808 0.23 (0.22; 0.24) 4135 0.09 (0.09; 0.09)
Remnant-c mmol/L 3777 1.9 (1.88; 1.91) 4639 1.69 (1.68; 1.7) 1223 1.44 (1.41; 1.46) 4810 1.5 (1.48; 1.51) 4138 1.38 (1.37; 1.39)
SBP mmHg 3580 121.29 (120.84; 121.74) 3964 147.11 (146.33; 147.9) 4874 122.85 (122.4; 123.31) 1207 146.19 (144.91; 147.47) 4570 118.46 (118.09; 118.82)
Total cholesterol mmol/L 3524 4.94 (4.91; 4.98) 3777 5.98 (5.94; 6.03) 4639 5.08 (5.06; 5.11) 1223 3.93 (3.88; 3.98) 4810 4.94 (4.91; 4.97) 4138 4.63 (4.61; 4.66)
Triglycerides mmol/L 3524 1.37 (1.33; 1.41) 3777 1.68 (1.65; 1.71) 4639 1.22 (1.21; 1.23) 1223 1.68 (1.64; 1.73) 4810 1.68 (1.66; 1.71) 4138 1.06 (1.04; 1.07)
SFA mmol/L 3769 4.91 (4.88; 4.95) 4557 4.56 (4.54; 4.59) 1219 4.05 (3.99; 4.11) 4761 4.82 (4.79; 4.85) 3949 4.15 (4.13; 4.18)
S-HDL mmol/L 3780 1.24 (1.23; 1.24) 4641 1.09 (1.08; 1.09) 1225 0.98 (0.97; 0.99) 4813 1.21 (1.2; 1.21) 4138 1.12 (1.12; 1.13)
S-LDL mmol/L 3780 0.68 (0.68; 0.69) 4641 0.52 (0.51; 0.52) 1225 0.46 (0.45; 0.47) 4813 0.55 (0.54; 0.55) 4138 0.45 (0.44; 0.45)
Sphingomyelins mmol/L 3769 0.61 (0.6; 0.61) 4560 0.5 (0.5; 0.5) 1220 0.45 (0.44; 0.45) 4786 0.5 (0.5; 0.5)
S-VLDL mmol/L 3780 0.79 (0.77; 0.8) 4641 0.66 (0.66; 0.67) 1225 0.71 (0.7; 0.72) 4813 0.74 (0.73; 0.75) 4138 0.55 (0.54; 0.55)
Total cholines mmol/L 3769 2.95 (2.93; 2.97) 4561 2.41 (2.4; 2.42) 1220 1.84 (1.82; 1.87) 4797 2.46 (2.45; 2.47) 3953 2.35 (2.34; 2.36)
TotFA mmol/L 3769 13.41 (13.32; 13.51) 4559 12.23 (12.17; 12.29) 1219 10.13 (9.98; 10.28) 4797 12.94 (12.86; 13.02) 3952 11.12 (11.05; 11.18)
Phosphoglycerides mmol/L 3769 2.44 (2.42; 2.46) 4561 2.04 (2.03; 2.05) 1220 1.52 (1.5; 1.54) 4797 2 (1.99; 2.01) 3951 1.94 (1.92; 1.95)
Tyrosine mmol/L 3774 0.05 (0.05; 0.05) 4615 0.06 (0.06; 0.06) 1222 0.05 (0.05; 0.05) 4805 0.07 (0.07; 0.07) 4132 0.05 (0.05; 0.05)
Valine mmol/L 3774 0.17 (0.16; 0.17) 4640 0.2 (0.2; 0.2) 1221 0.16 (0.16; 0.17) 4810 0.2 (0.2; 0.2) 4133 0.14 (0.14; 0.15)
Viscosity mPa.s. 3636 1.3 (1.3; 1.3) 4741 1.26 (1.25; 1.26)
VLDL-c mmol/L 3777 0.94 (0.93; 0.95) 4639 0.84 (0.83; 0.84) 1223 0.8 (0.79; 0.82) 4810 0.8 (0.79; 0.81) 4138 0.67 (0.66; 0.68)
VLDLd mmol/L 3777 36.31 (36.27; 36.36) 4639 35.82 (35.79; 35.84) 1223 37.77 (37.7; 37.83) 4810 36.51 (36.47; 36.55) 4138 35.78 (35.74; 35.82)
VLDL-TG mmol/L 3777 1.07 (1.04; 1.09) 4639 0.77 (0.75; 0.78) 1223 1.25 (1.21; 1.29) 4810 1.07 (1.05; 1.09) 4138 0.64 (0.63; 0.65)
XL-HDL mmol/L 3780 0.52 (0.51; 0.53) 4641 0.47 (0.47; 0.48) 1225 0.16 (0.15; 0.17) 4813 0.51 (0.5; 0.52) 4138 0.55 (0.54; 0.56)
XL-VLDL mmol/L 3780 0.08 (0.08; 0.08) 4641 0.04 (0.04; 0.04) 1225 0.11 (0.1; 0.11) 4813 0.08 (0.07; 0.08) 4138 0.04 (0.04; 0.04)
XS-VLDL mmol/L 3780 0.69 (0.68; 0.69) 4641 0.64 (0.64; 0.65) 1225 0.49 (0.49; 0.5) 4813 0.59 (0.58; 0.59) 4138 0.54 (0.53; 0.54)
XXL-VLDL mmol/L 3780 0.03 (0.03; 0.03) 4641 0.02 (0.02; 0.02) 1225 0.04 (0.04; 0.04) 4813 0.03 (0.03; 0.03) 4138 0.02 (0.02; 0.02)
ALSPAC-MPEL82 BWHHS WHII CaPS UKCTOCS
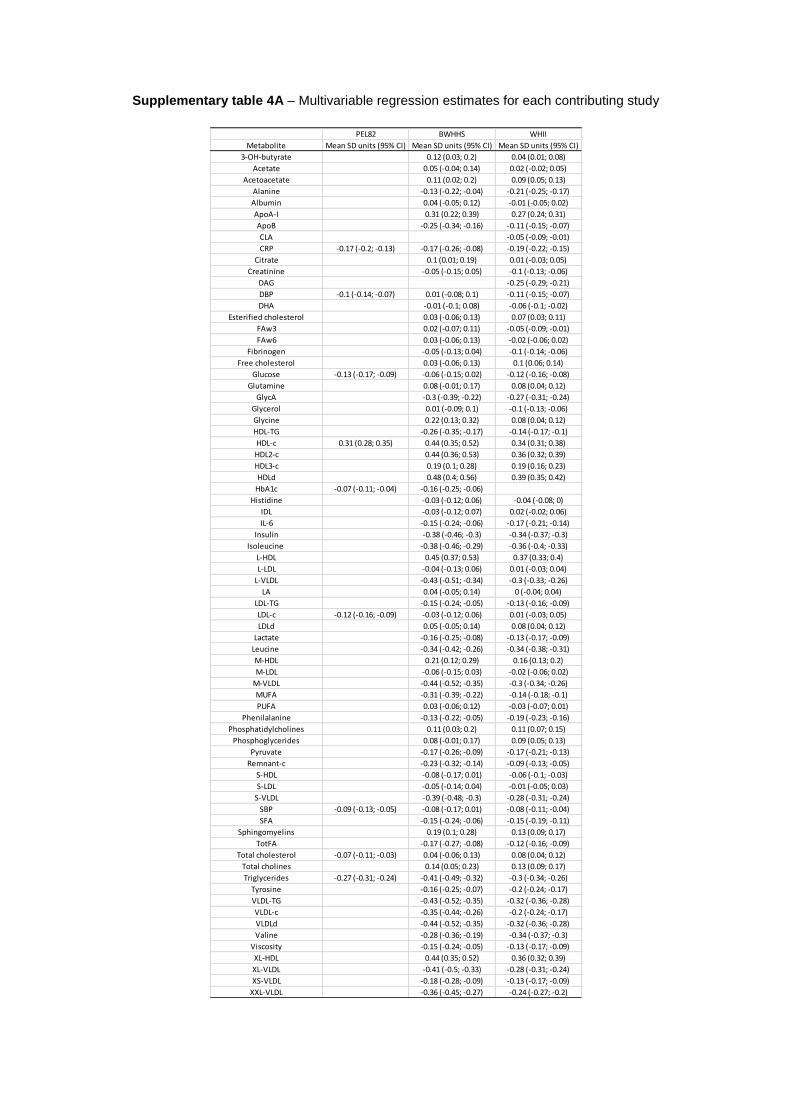
Supplementary table 4A – Multivariable regression estimates for each contributing study
PEL82 BWHHS WHII
Metabolite Mean SD units (95% CI) Mean SD units (95% CI) Mean SD units (95% CI)
3-OH-butyrate 0.12 (0.03; 0.2) 0.04 (0.01; 0.08)
Acetate 0.05 (-0.04; 0.14) 0.02 (-0.02; 0.05)
Acetoacetate 0.11 (0.02; 0.2) 0.09 (0.05; 0.13)
Alanine -0.13 (-0.22; -0.04) -0.21 (-0.25; -0.17)
Albumin 0.04 (-0.05; 0.12) -0.01 (-0.05; 0.02)
ApoA-I 0.31 (0.22; 0.39) 0.27 (0.24; 0.31)
ApoB -0.25 (-0.34; -0.16) -0.11 (-0.15; -0.07)
CLA -0.05 (-0.09; -0.01)
CRP -0.17 (-0.2; -0.13) -0.17 (-0.26; -0.08) -0.19 (-0.22; -0.15)
Citrate 0.1 (0.01; 0.19) 0.01 (-0.03; 0.05)
Creatinine -0.05 (-0.15; 0.05) -0.1 (-0.13; -0.06)
DAG -0.25 (-0.29; -0.21)
DBP -0.1 (-0.14; -0.07) 0.01 (-0.08; 0.1) -0.11 (-0.15; -0.07)
DHA -0.01 (-0.1; 0.08) -0.06 (-0.1; -0.02)
Esterified cholesterol 0.03 (-0.06; 0.13) 0.07 (0.03; 0.11)
FAw3 0.02 (-0.07; 0.11) -0.05 (-0.09; -0.01)
FAw6 0.03 (-0.06; 0.13) -0.02 (-0.06; 0.02)
Fibrinogen -0.05 (-0.13; 0.04) -0.1 (-0.14; -0.06)
Free cholesterol 0.03 (-0.06; 0.13) 0.1 (0.06; 0.14)
Glucose -0.13 (-0.17; -0.09) -0.06 (-0.15; 0.02) -0.12 (-0.16; -0.08)
Glutamine 0.08 (-0.01; 0.17) 0.08 (0.04; 0.12)
GlycA -0.3 (-0.39; -0.22) -0.27 (-0.31; -0.24)
Glycerol 0.01 (-0.09; 0.1) -0.1 (-0.13; -0.06)
Glycine 0.22 (0.13; 0.32) 0.08 (0.04; 0.12)
HDL-TG -0.26 (-0.35; -0.17) -0.14 (-0.17; -0.1)
HDL-c 0.31 (0.28; 0.35) 0.44 (0.35; 0.52) 0.34 (0.31; 0.38)
HDL2-c 0.44 (0.36; 0.53) 0.36 (0.32; 0.39)
HDL3-c 0.19 (0.1; 0.28) 0.19 (0.16; 0.23)
HDLd 0.48 (0.4; 0.56) 0.39 (0.35; 0.42)
HbA1c -0.07 (-0.11; -0.04) -0.16 (-0.25; -0.06)
Histidine -0.03 (-0.12; 0.06) -0.04 (-0.08; 0)
IDL -0.03 (-0.12; 0.07) 0.02 (-0.02; 0.06)
IL-6 -0.15 (-0.24; -0.06) -0.17 (-0.21; -0.14)
Insulin -0.38 (-0.46; -0.3) -0.34 (-0.37; -0.3)
Isoleucine -0.38 (-0.46; -0.29) -0.36 (-0.4; -0.33)
L-HDL 0.45 (0.37; 0.53) 0.37 (0.33; 0.4)
L-LDL -0.04 (-0.13; 0.06) 0.01 (-0.03; 0.04)
L-VLDL -0.43 (-0.51; -0.34) -0.3 (-0.33; -0.26)
LA 0.04 (-0.05; 0.14) 0 (-0.04; 0.04)
LDL-TG -0.15 (-0.24; -0.05) -0.13 (-0.16; -0.09)
LDL-c -0.12 (-0.16; -0.09) -0.03 (-0.12; 0.06) 0.01 (-0.03; 0.05)
LDLd 0.05 (-0.05; 0.14) 0.08 (0.04; 0.12)
Lactate -0.16 (-0.25; -0.08) -0.13 (-0.17; -0.09)
Leucine -0.34 (-0.42; -0.26) -0.34 (-0.38; -0.31)
M-HDL 0.21 (0.12; 0.29) 0.16 (0.13; 0.2)
M-LDL -0.06 (-0.15; 0.03) -0.02 (-0.06; 0.02)
M-VLDL -0.44 (-0.52; -0.35) -0.3 (-0.34; -0.26)
MUFA -0.31 (-0.39; -0.22) -0.14 (-0.18; -0.1)
PUFA 0.03 (-0.06; 0.12) -0.03 (-0.07; 0.01)
Phenilalanine -0.13 (-0.22; -0.05) -0.19 (-0.23; -0.16)
Phosphatidylcholines 0.11 (0.03; 0.2) 0.11 (0.07; 0.15)
Phosphoglycerides 0.08 (-0.01; 0.17) 0.09 (0.05; 0.13)
Pyruvate -0.17 (-0.26; -0.09) -0.17 (-0.21; -0.13)
Remnant-c -0.23 (-0.32; -0.14) -0.09 (-0.13; -0.05)
S-HDL -0.08 (-0.17; 0.01) -0.06 (-0.1; -0.03)
S-LDL -0.05 (-0.14; 0.04) -0.01 (-0.05; 0.03)
S-VLDL -0.39 (-0.48; -0.3) -0.28 (-0.31; -0.24)
SBP -0.09 (-0.13; -0.05) -0.08 (-0.17; 0.01) -0.08 (-0.11; -0.04)
SFA -0.15 (-0.24; -0.06) -0.15 (-0.19; -0.11)
Sphingomyelins 0.19 (0.1; 0.28) 0.13 (0.09; 0.17)
TotFA -0.17 (-0.27; -0.08) -0.12 (-0.16; -0.09)
Total cholesterol -0.07 (-0.11; -0.03) 0.04 (-0.06; 0.13) 0.08 (0.04; 0.12)
Total cholines 0.14 (0.05; 0.23) 0.13 (0.09; 0.17)
Triglycerides -0.27 (-0.31; -0.24) -0.41 (-0.49; -0.32) -0.3 (-0.34; -0.26)
Tyrosine -0.16 (-0.25; -0.07) -0.2 (-0.24; -0.17)
VLDL-TG -0.43 (-0.52; -0.35) -0.32 (-0.36; -0.28)
VLDL-c -0.35 (-0.44; -0.26) -0.2 (-0.24; -0.17)
VLDLd -0.44 (-0.52; -0.35) -0.32 (-0.36; -0.28)
Valine -0.28 (-0.36; -0.19) -0.34 (-0.37; -0.3)
Viscosity -0.15 (-0.24; -0.05) -0.13 (-0.17; -0.09)
XL-HDL 0.44 (0.35; 0.52) 0.36 (0.32; 0.39)
XL-VLDL -0.41 (-0.5; -0.33) -0.28 (-0.31; -0.24)
XS-VLDL -0.18 (-0.28; -0.09) -0.13 (-0.17; -0.09)
XXL-VLDL -0.36 (-0.45; -0.27) -0.24 (-0.27; -0.2)

Supplementary table 4B – Mendelian randomization estimates for each contributing study
PEL82 BWHHS WHII CaPS UKCTOCS ALSPAC-M Metabolomics consortium
Metabolite Mean SD units (95% CI) Mean SD units (95% CI) Mean SD units (95% CI) Mean SD units (95% CI) Mean SD units (95% CI) Mean SD units (95% CI) Mean SD units (95% CI)
3-OH-butyrate 0.07 (-0.19; 0.33) -0.02 (-0.22; 0.18) 0.13 (-0.18; 0.44) -0.01 (-0.29; 0.27) -0.04 (-0.22; 0.15) 0.02 (-0.05; 0.1)
Acetate 0.24 (-0.01; 0.5) 0.12 (-0.08; 0.32) -0.14 (-0.45; 0.17) 0.29 (0.01; 0.56) 0.01 (-0.17; 0.2) 0.03 (-0.04; 0.1)
Acetoacetate 0.11 (-0.15; 0.37) -0.13 (-0.33; 0.07) -0.22 (-0.51; 0.07) 0 (-0.18; 0.19) -0.02 (-0.1; 0.06)
Alanine -0.03 (-0.29; 0.23) 0.06 (-0.14; 0.26) 0.08 (-0.24; 0.39) -0.04 (-0.33; 0.25) 0.07 (-0.11; 0.26) 0.02 (-0.06; 0.09)
Albumin -0.02 (-0.27; 0.24) -0.02 (-0.22; 0.18) -0.2 (-0.51; 0.11) 0.23 (-0.06; 0.52) 0.12 (-0.06; 0.3) 0 (-0.09; 0.08)
ApoA-I 0.27 (0.01; 0.53) 0.17 (-0.03; 0.37) -0.31 (-0.62; 0) 0.16 (-0.13; 0.45) 0.06 (-0.12; 0.24) 0 (-0.09; 0.08)
ApoB 0.02 (-0.24; 0.28) 0.15 (-0.05; 0.35) 0.08 (-0.23; 0.4) 0.29 (-0.01; 0.59) -0.07 (-0.26; 0.11) -0.01 (-0.09; 0.07)
CLA 0.34 (0.14; 0.54) 1.22 (0.19; 2.25) -0.27 (-0.46; -0.08)
CRP 0.03 (-0.16; 0.21) 0.26 (-0.01; 0.53) -0.12 (-0.32; 0.07) 0.08 (-0.3; 0.46) -0.04 (-0.23; 0.14)
Citrate -0.1 (-0.37; 0.17) -0.07 (-0.27; 0.14) -0.25 (-0.56; 0.06) -0.19 (-0.48; 0.1) 0.02 (-0.17; 0.21) -0.05 (-0.12; 0.03)
Creatinine -0.25 (-0.54; 0.04) 0.21 (0.01; 0.42) -0.3 (-0.61; 0.01) 0.17 (-0.14; 0.47) -0.11 (-0.29; 0.08) -0.03 (-0.1; 0.05)
DAG 0.16 (-0.04; 0.37) -0.28 (-0.6; 0.04) -0.12 (-0.32; 0.07)
DBP 0.06 (-0.12; 0.24) -0.18 (-0.43; 0.08) 0.02 (-0.18; 0.22) 0.12 (-0.19; 0.44) 0 (-0.18; 0.18)
DHA 0.33 (0.07; 0.59) 0.32 (0.12; 0.52) -0.19 (-0.5; 0.13) 0.37 (0.09; 0.65) -0.04 (-0.23; 0.15) -0.01 (-0.11; 0.09)
Esterified cholesterol 0.16 (-0.1; 0.42) 0.16 (-0.05; 0.36) -0.06 (-0.38; 0.25) 0.44 (0.14; 0.74) -0.11 (-0.3; 0.07) 0.04 (-0.05; 0.14)
FAw3 0.36 (0.1; 0.62) 0.26 (0.06; 0.46) -0.14 (-0.45; 0.18) 0.47 (0.18; 0.75) -0.14 (-0.32; 0.05) 0.01 (-0.09; 0.11)
FAw6 0.19 (-0.07; 0.46) 0.17 (-0.03; 0.37) -0.13 (-0.45; 0.18) 0.36 (0.06; 0.65) -0.04 (-0.23; 0.15) 0.04 (-0.06; 0.14)
Fibrinogen -0.14 (-0.4; 0.12) -0.05 (-0.25; 0.15) -0.3 (-0.67; 0.08)
Free cholesterol 0.13 (-0.14; 0.39) 0.15 (-0.06; 0.35) -0.13 (-0.44; 0.18) 0.29 (-0.01; 0.59) -0.15 (-0.34; 0.04) 0.01 (-0.09; 0.11)
Glucose 0.15 (-0.04; 0.33) 0.04 (-0.22; 0.3) 0.03 (-0.16; 0.22) -0.21 (-0.52; 0.1) -0.09 (-0.41; 0.23) 0.23 (0.05; 0.41) -0.06 (-0.13; 0.01)
Glutamine 0.05 (-0.21; 0.31) -0.28 (-0.48; -0.08) 0.11 (-0.21; 0.43) -0.01 (-0.3; 0.29) 0.07 (-0.12; 0.25) 0.03 (-0.05; 0.1)
GlycA 0 (-0.26; 0.26) 0.18 (-0.02; 0.38) 0.04 (-0.28; 0.35) 0.22 (-0.06; 0.5) 0.05 (-0.13; 0.23) -0.07 (-0.15; 0.01)
Glycerol -0.07 (-0.34; 0.19) -0.01 (-0.21; 0.2) -0.02 (-0.32; 0.28) 0 (-0.08; 0.08)
Glycine -0.17 (-0.43; 0.08) -0.11 (-0.31; 0.1) -0.13 (-0.42; 0.16) -0.03 (-0.11; 0.06)
HDL-TG -0.2 (-0.46; 0.06) 0.2 (0; 0.4) -0.02 (-0.33; 0.29) 0.14 (-0.15; 0.44) -0.09 (-0.28; 0.1)
HDL-c 0 (-0.18; 0.19) 0.23 (-0.03; 0.49) 0.1 (-0.1; 0.31) -0.35 (-0.66; -0.04) 0.03 (-0.26; 0.32) 0.05 (-0.13; 0.23) 0.07 (-0.01; 0.15)
HDL2-c 0.26 (0; 0.52) 0.1 (-0.1; 0.31) -0.35 (-0.67; -0.04) 0 (-0.29; 0.29) 0.06 (-0.12; 0.25)
HDL3-c -0.01 (-0.28; 0.25) 0.06 (-0.14; 0.26) -0.21 (-0.52; 0.11) 0.31 (0.02; 0.6) -0.08 (-0.27; 0.1)
HDLd 0.22 (-0.05; 0.48) 0.1 (-0.1; 0.31) -0.2 (-0.51; 0.11) -0.06 (-0.34; 0.22) 0.06 (-0.13; 0.24) -0.03 (-0.11; 0.05)
HbA1c -0.1 (-0.29; 0.08) -0.22 (-0.49; 0.04)
Histidine 0.19 (-0.06; 0.45) -0.04 (-0.24; 0.17) 0.33 (0.02; 0.64) 0.12 (-0.16; 0.4) 0.06 (-0.13; 0.25) 0.03 (-0.06; 0.11)
IDL 0.05 (-0.21; 0.31) 0.1 (-0.1; 0.3) 0.05 (-0.26; 0.36) 0.35 (0.04; 0.65) -0.11 (-0.3; 0.07) -0.02 (-0.1; 0.06)
IL-6 -0.18 (-0.44; 0.09) -0.06 (-0.26; 0.14) -0.38 (-0.8; 0.03)
Insulin -0.21 (-0.47; 0.05) -0.01 (-0.2; 0.18) 0.34 (-0.1; 0.78) -0.08 (-0.27; 0.11)
Isoleucine -0.03 (-0.29; 0.23) 0.14 (-0.05; 0.34) 0.11 (-0.2; 0.43) -0.07 (-0.36; 0.22) 0.04 (-0.15; 0.22) 0.01 (-0.07; 0.08)
L-HDL 0.17 (-0.09; 0.43) 0.07 (-0.13; 0.28) -0.31 (-0.62; 0) -0.01 (-0.29; 0.27) 0.05 (-0.13; 0.24) -0.01 (-0.09; 0.07)
L-LDL 0.02 (-0.24; 0.29) 0.1 (-0.1; 0.31) -0.03 (-0.34; 0.29) 0.38 (0.08; 0.68) -0.12 (-0.31; 0.06) -0.01 (-0.09; 0.07)
L-VLDL -0.02 (-0.28; 0.24) 0.12 (-0.08; 0.32) 0.03 (-0.29; 0.34) 0.07 (-0.22; 0.35) 0.03 (-0.16; 0.21) -0.04 (-0.12; 0.04)
LA 0.14 (-0.12; 0.41) 0.15 (-0.05; 0.35) -0.1 (-0.42; 0.21) 0.26 (-0.04; 0.56) -0.01 (-0.2; 0.18) 0.04 (-0.06; 0.14)
LDL-TG -0.06 (-0.33; 0.21) 0.15 (-0.05; 0.35) -0.06 (-0.38; 0.25) 0.29 (-0.01; 0.59) -0.12 (-0.31; 0.06)
LDL-c -0.1 (-0.29; 0.08) 0.07 (-0.2; 0.33) 0.09 (-0.11; 0.29) 0 (-0.32; 0.31) 0.41 (0.1; 0.71) -0.12 (-0.31; 0.06) 0 (-0.08; 0.08)
LDLd -0.19 (-0.45; 0.07) -0.06 (-0.26; 0.15) 0.27 (-0.04; 0.59) -0.22 (-0.51; 0.07) -0.08 (-0.26; 0.1) -0.04 (-0.13; 0.04)
Lactate -0.03 (-0.29; 0.23) 0.02 (-0.19; 0.22) 0.14 (-0.17; 0.45) -0.02 (-0.31; 0.27) -0.07 (-0.26; 0.11) 0.01 (-0.07; 0.08)
Leucine -0.05 (-0.31; 0.21) 0.21 (0.01; 0.41) 0.28 (-0.03; 0.59) -0.1 (-0.39; 0.18) -0.01 (-0.19; 0.18) 0 (-0.07; 0.07)
M-HDL 0.19 (-0.07; 0.44) 0.09 (-0.11; 0.29) -0.46 (-0.77; -0.15) -0.08 (-0.38; 0.23) 0.03 (-0.16; 0.21) 0.04 (-0.04; 0.12)
M-LDL 0.02 (-0.24; 0.29) 0.1 (-0.1; 0.3) -0.05 (-0.36; 0.27) 0.43 (0.12; 0.73) -0.12 (-0.3; 0.07) 0 (-0.08; 0.08)
M-VLDL -0.07 (-0.33; 0.19) 0.16 (-0.05; 0.36) 0.02 (-0.29; 0.33) 0.13 (-0.17; 0.42) 0.04 (-0.15; 0.22) -0.03 (-0.12; 0.05)
MUFA -0.11 (-0.37; 0.15) 0.2 (0; 0.41) -0.04 (-0.35; 0.27) 0.28 (-0.01; 0.58) -0.1 (-0.29; 0.09) 0.06 (-0.04; 0.16)
PUFA 0.24 (-0.02; 0.51) 0.22 (0.02; 0.42) -0.15 (-0.46; 0.16) 0.39 (0.09; 0.69) -0.05 (-0.24; 0.13)
Phenilalanine 0.08 (-0.19; 0.34) 0.07 (-0.13; 0.27) 0.7 (0.39; 1.01) 0 (-0.28; 0.28) -0.03 (-0.22; 0.16) 0.03 (-0.05; 0.1)
Phosphatidylcholines 0.2 (-0.06; 0.47) 0.2 (0; 0.41) -0.29 (-0.61; 0.02) 0.3 (0; 0.6) -0.06 (-0.25; 0.13) 0.08 (-0.02; 0.18)
Phosphoglycerides 0.15 (-0.11; 0.42) 0.18 (-0.03; 0.38) -0.31 (-0.62; 0) 0.19 (-0.11; 0.48) -0.06 (-0.25; 0.14) 0.1 (0; 0.2)
Pyruvate -0.11 (-0.37; 0.16) 0.09 (-0.11; 0.29) 0.1 (-0.2; 0.41) -0.07 (-0.25; 0.11) -0.02 (-0.1; 0.06)
Remnant-c 0.02 (-0.24; 0.28) 0.15 (-0.05; 0.35) 0.14 (-0.17; 0.46) 0.28 (-0.03; 0.58) -0.08 (-0.26; 0.11)
S-HDL -0.01 (-0.27; 0.25) 0.02 (-0.18; 0.22) -0.41 (-0.72; -0.1) 0.1 (-0.2; 0.4) -0.04 (-0.23; 0.14) 0.03 (-0.05; 0.11)
S-LDL 0.06 (-0.21; 0.32) 0.12 (-0.08; 0.32) -0.07 (-0.38; 0.24) 0.43 (0.13; 0.73) -0.11 (-0.29; 0.08) -0.01 (-0.09; 0.07)
S-VLDL -0.11 (-0.37; 0.15) 0.18 (-0.03; 0.38) 0.04 (-0.27; 0.35) 0.2 (-0.1; 0.49) 0.01 (-0.17; 0.2) 0.01 (-0.07; 0.09)
SBP 0.09 (-0.09; 0.28) 0.06 (-0.2; 0.32) 0 (-0.2; 0.19) -0.22 (-0.53; 0.1) 0.03 (-0.15; 0.21)
SFA 0.1 (-0.16; 0.37) 0.19 (-0.01; 0.39) -0.04 (-0.35; 0.27) 0.29 (-0.01; 0.59) -0.11 (-0.3; 0.08)
Sphingomyelins 0.22 (-0.04; 0.49) 0.09 (-0.12; 0.29) 0.15 (-0.16; 0.46) 0.32 (0.02; 0.62) -0.02 (-0.11; 0.08)
TotFA 0.07 (-0.19; 0.33) 0.22 (0.02; 0.43) -0.09 (-0.4; 0.22) 0.34 (0.04; 0.64) -0.11 (-0.3; 0.08) 0.06 (-0.04; 0.16)
Total cholesterol -0.04 (-0.23; 0.14) 0.16 (-0.1; 0.42) 0.16 (-0.04; 0.36) -0.03 (-0.34; 0.29) 0.4 (0.1; 0.7) -0.1 (-0.28; 0.09) 0.03 (-0.05; 0.12)
Total cholines 0.22 (-0.04; 0.48) 0.16 (-0.05; 0.36) -0.27 (-0.59; 0.04) 0.34 (0.05; 0.63) -0.08 (-0.27; 0.11)
Triglycerides 0.04 (-0.14; 0.23) -0.07 (-0.33; 0.19) 0.15 (-0.05; 0.36) 0.01 (-0.3; 0.32) 0.15 (-0.14; 0.44) -0.01 (-0.19; 0.17) -0.01 (-0.09; 0.07)
Tyrosine -0.2 (-0.47; 0.07) 0.06 (-0.14; 0.26) 0.38 (0.07; 0.69) -0.12 (-0.41; 0.17) -0.02 (-0.21; 0.17) 0.07 (-0.01; 0.14)
VLDL-TG -0.04 (-0.3; 0.22) 0.14 (-0.07; 0.34) 0.03 (-0.28; 0.34) 0.1 (-0.18; 0.39) 0.04 (-0.14; 0.22)
VLDL-c -0.03 (-0.29; 0.23) 0.19 (-0.02; 0.39) 0.18 (-0.14; 0.49) 0.21 (-0.09; 0.5) -0.03 (-0.22; 0.15)
VLDLd -0.08 (-0.33; 0.18) 0.04 (-0.16; 0.24) -0.02 (-0.34; 0.29) -0.04 (-0.32; 0.24) 0.09 (-0.1; 0.27) -0.01 (-0.09; 0.07)
Valine -0.15 (-0.41; 0.11) 0.11 (-0.08; 0.31) 0.14 (-0.18; 0.45) -0.16 (-0.45; 0.14) 0.03 (-0.15; 0.22) -0.02 (-0.09; 0.06)
Viscosity -0.23 (-0.5; 0.05) 0.03 (-0.16; 0.23)
XL-HDL 0.19 (-0.08; 0.45) 0.17 (-0.03; 0.37) -0.17 (-0.48; 0.14) 0.04 (-0.25; 0.33) 0.06 (-0.12; 0.24) -0.03 (-0.12; 0.05)
XL-VLDL -0.05 (-0.31; 0.22) 0.12 (-0.08; 0.32) 0.1 (-0.22; 0.41) 0.01 (-0.27; 0.28) 0.03 (-0.15; 0.21) 0.01 (-0.07; 0.09)
XS-VLDL -0.03 (-0.29; 0.23) 0.13 (-0.07; 0.33) 0.08 (-0.23; 0.39) 0.31 (0.01; 0.62) -0.07 (-0.25; 0.11) -0.01 (-0.09; 0.07)
XXL-VLDL -0.07 (-0.33; 0.2) 0.14 (-0.06; 0.34) 0.13 (-0.18; 0.44) -0.07 (-0.35; 0.22) 0 (-0.18; 0.19) 0.01 (-0.07; 0.09)

Supplementary table 5 – Heterogeneity estimates (I2) for meta-analysis of study-specific
multivariable (MV) and Mendelian randomization (MR) estimates
NA: not applicable (estimates from only one study available). XXL: extremely large, XL: very large, L: large, M: medium,
S: small, XS: very small, VLDL: very low-density lipoprotein, LDL: low-density lipoprotein, IDL: intermediate-density
lipoprotein, HDL: high-density lipoprotein, c: cholesterol, DAG: diglycerides, TG: triglycerides, TotFA: total fatty acids,
SFA: saturated fatty acid, MUFA: monounsaturated fatty acid, PUFA: polyunsaturated fatty acids, FAw6: omega-6 fatty
acid, LA: linoleic acid, FAw3: omega-3 fatty acid, DHA: docosaexaenoic acid, CLA: conjugated linoleic acids, HbA1c:
glycated haemoglobin, CRP: c-reactive protein, IL-6: interleukin-6, GlycA: glycoprotein acetyls, SBP: systolic blood
pressure, DBP: diastolic blood pressure.
MV MR MV MR MV MR MV MR MV MR
XXL-VLDL 85 0 82 7 NA 0 85 0 78 34
XL-VLDL 88 0 91 0 NA 0 88 0 79 0
L-VLDL 86 0 84 0 NA 11 86 0 82 0
M-VLDL 88 0 68 35 NA 52 88 0 83 0
S-VLDL 81 0 0 52 NA 63 81 0 79 19
XS-VLDL 0 23 0 73 NA 49 0 23 23 48
IDL 0 36 0 78 NA 44 0 36 23 57
L-LDL 0 43 0 78 NA 64 0 43 20 65
M-LDL 0 51 0 79 NA 63 0 51 32 71
S-LDL 0 53 0 78 NA 71 0 53 40 73
XL-HDL 66 26 88 0 NA 84 66 26 19 0
L-HDL 72 22 83 0 NA 81 72 22 59 28
M-HDL 0 57 0 0 NA 86 0 57 62 58
S-HDL 0 36 0 8 NA 63 0 36 4 50
VLDLd 83 0 26 0 NA 0 83 0 73 0
LDLd 0 25 0 0 NA 50 0 25 0 66
HDLd 75 18 64 32 NA 80 75 18 0 0
Total cholesterol 94 44 71 73 96 73 0 49 92 63
Remnant-c 87 23 0 73 NA 36 87 23 76 52
VLDL-c 89 4 0 61 NA 26 89 4 81 38
LDL-c 91 45 61 71 94 73 0 47 89 66
HDL-c 75 33 90 0 0 68 76 42 73 16
HDL2-c 74 57 70 0 NA 83 74 57 72 34
HDL3-c 0 45 93 43 NA 60 0 45 0 52
Esterified cholesterol 0 56 0 80 NA 77 0 56 0 68
Free cholesterol 43 46 31 77 NA 85 43 46 27 73
ApoA-I 0 55 79 0 NA 88 0 55 0 46
ApoB 86 20 0 73 NA 56 86 20 81 56
Triglycerides 73 0 91 39 48 50 80 0 70 0
Phosphoglycerides 0 48 58 48 NA 91 0 48 0 62
Phosphatidylcholines 0 58 41 62 NA 92 0 58 0 75
Total cholines 0 67 29 73 NA 90 0 67 0 74
Sphingomyelins 30 43 0 85 NA 0 30 43 0 45
DAG NA 70 NA 0 NA 86 NA 70 NA 84
HDL-TG 0 47 75 44 NA 76 82 0 79 0
VLDL-TG 84 49 60 22 NA 36 84 49 68 40
LDL-TG 82 0 19 68 NA 78 0 47 42 56
TotFA 0 48 5 72 NA 86 0 48 42 68
SFA 0 45 0 65 NA 76 0 45 0 61
MUFA 91 43 91 61 NA 77 91 43 77 55
PUFA 32 64 45 79 NA 89 32 64 0 66
FAw6 10 42 35 77 NA 86 10 42 22 54
LA 0 0 16 70 NA 83 0 0 53 3
FAw3 47 79 13 82 NA 84 47 79 60 80
DHA 0 76 0 64 NA 89 0 76 16 80
CLA NA 92 NA 0 NA 46 NA 92 NA 93
Glucose 0 54 46 0 57 49 21 51 34 39
HbA1c 62 0 11 0 NA NA NA NA 21 38
Insulin 0 38 0 0 NA 53 0 38 37 0
Lactate 0 0 0 0 NA 0 0 0 0 0
Pyruvate 0 0 0 24 NA NA 0 0 0 27
Citrate 69 0 0 29 NA 0 69 0 0 0
Glycerol 74 0 83 0 NA NA 74 0 0 0
Alanine 65 0 62 0 NA 0 65 0 58 0
Glutamine 0 43 0 0 NA 75 0 43 0 58
Glycine 87 0 71 0 NA NA 87 0 69 55
Isoleucine 0 0 0 0 NA 0 0 0 0 9
Leucine 0 34 0 0 NA 0 0 34 0 52
Valine 45 0 87 0 NA 0 45 0 0 0
Phenilalanine 32 72 30 0 NA 91 32 72 0 79
Tyrosine 0 48 40 0 NA 54 0 48 0 42
Histidine 0 10 0 0 NA 84 0 10 0 0
Acetoacetate 0 0 0 14 NA NA 0 0 0 0
Acetate 0 31 0 35 NA 64 0 31 74 0
3-OH-butyrate 54 0 0 0 NA 0 54 0 0 0
Albumin 0 11 0 0 NA 0 0 11 0 26
Creatinine 0 61 0 49 NA 85 0 61 22 71
CRP 0 28 81 13 41 0 0 45 0 0
Fibrinogen 16 0 87 0 NA 60 16 0 0 17
IL-6 0 3 69 0 NA 57 0 3 0 0
GlycA 0 43 0 0 NA 39 0 43 58 0
Viscosity 0 56 0 0 NA NA 0 56 0 0
SBP 0 0 28 11 44 0 0 0 0 0
DBP 68 0 72 36 0 0 83 0 0 0
Overall Females Males European studies only Low risk individuals onlyMetabolite

Supplementary table 6. P-values for the association of demographic and lifestyle
variables with SNPs selected for Mendelian randomization analysis for each
participating study
PEL82 BWHHS WHII CaPS UKCTOCS
case-control*
ALSPAC-M
P-value
Sex (male vs female)
rs6810075 0.15 — 0.67 — — —
rs16861209 0.12 — 0.45 — — —
rs17366568 0.36 — 0.84 — — —
rs3774261 0.35 — 0.63 — — —
Age (years) rs6810075 0.78 0.75 0.28 0.36 0.59 0.001
rs16861209 0.56 0.58 0.27 0.01 0.57 0.83
rs17366568 0.22 0.83 0.47 0.56 0.58 0.93
rs3774261 0.68 0.03 0.96 0.87 0.43 0.15
European (yes vs no) rs6810075 0.06 0.50 0.48 — 0.70 0.41
rs16861209 0.75 — 0.12 — 0.16 0.35
rs17366568 0.45 0.61 — — 0.62 0.19
rs3774261 0.44 0.95 — — 0.85 —
Smoking (yes vs no) rs6810075 0.64 0.22 0.77 0.48 — 0.11
rs16861209 0.57 0.37 0.87 0.48 — 0.24
rs17366568 0.45 0.62 0.44 0.77 — 0.90
rs3774261 0.52 0.08 0.90 0.37 — 0.92
Body mass index (kg/m2)
rs6810075 0.63 0.49 0.49 0.21 0.05 0.45
rs16861209 0.39 0.41 0.59 0.65 0.20 0.72
rs17366568 0.47 0.73 0.87 0.11 0.66 0.32
rs3774261 0.48 0.65 0.41 0.44 0.78 0.04
ALSPAC-M: The Avon Longitudinal Study of Children and Parents – mothers’ cohort;
BWHHS: British Women’s Heart and Health Study; CaPS: The Caerphilly Prospective
Study; PEL82: 1982 Pelotas Birth Cohort; UKCTOCS: case-control study nested in The
United Kingdom Collaborative Trial of Ovarian Cancer Screening; WHII: Whitehall-II
Study.