metabolic - global food system analysis
TRANSCRIPT
THE GLOBALFOOD SYSTEM:AN ANALYSISJANUARY 2016
2
METABOLIC
Meteorenweg 280M
1035 RN Amsterdam
The Netherlands
+31 20369077
COMMISSIONED BY
GRAPHIC DESIGN
CONTACT DETAILS
RESEARCH TEAM AND TEXT CONTRIBUTORS
AUTHORS
WWF Netherlands
Eva Gladek, Matthew Fraser, Gerard Roemers, Oscar Sabag Muñoz, Erin Kennedy, Peter Hirsch
Cassie Bjorck, Matthew Fraser
Eva Gladek, Matthew Fraser, Gerard Roemers, Oscar Sabag Muñoz, Peter Hirsch, Erin Kennedy, Floor van Bovene, Fatema Baheranwala, Marie Lakey, Prodhi Manisha, Madeline Donald, Shazade Jameson, Joris Bouwens, Henrik Sontag, Ilonka Marselis, Tirion Keatinge, Emily Speyer, Emily Huang
WWF-NL PRODUCTION TEAM Sarah Doornbos, Monique Grooten, Natasja Oerlemans, Claar van den Berg, Donné van Engelen
WWF NETWORK CONTRIBUTORS AND
REVIEWERS
Oettli Damian, WWF Switzerland; Martina Fleckenstein, WWF Germany; Bart Geenen, WWF Netherlands; Nina Haase, WWF Market Transformation Initiative; Eva Hernandez, WWF Spain; Richard Holland, Market Transformation Initiative; Stella Höynälänmaa, WWF Finland; Reinier Hille Ris Lamberis, WWF Netherlands; Andrea Kohl, WWF European Policy Office; Aurore Lermant, WWF France; Matthias Meissner, WWF Germany; Ennio Merlini, WWF Italy; Sandra Mulder, WWF Netherlands; Richard Perkins, WWF United Kingdom; Achilleas Plitharas, WWF Greece; Anna Richert, WWF Sweden; Anke Schulmeister, WWF European Policy Office; Charles Snoeck, WWF Belgium; Arjette Stevens, WWF Netherlands; Wagner Walter, WWF Switzerland; Jan Warnback, WWF Sweden; Duncan Williamson, WWF United Kingdom

THE GLOBAL FOOD SYSTEM: AN ANALYSIS 3
INDEXExecutive SummaryIntroductionReader’s Guide
01 CURRENT STATE 02 TRENDS & BEHAVIOUR03 IMPACTS04 STRUCTURAL CAUSES05 TOWARDS A SUSTAINABLE AND RESILIENT FOOD SYSTEM
BibliographyGlossary
4811
146286124138
158171
4
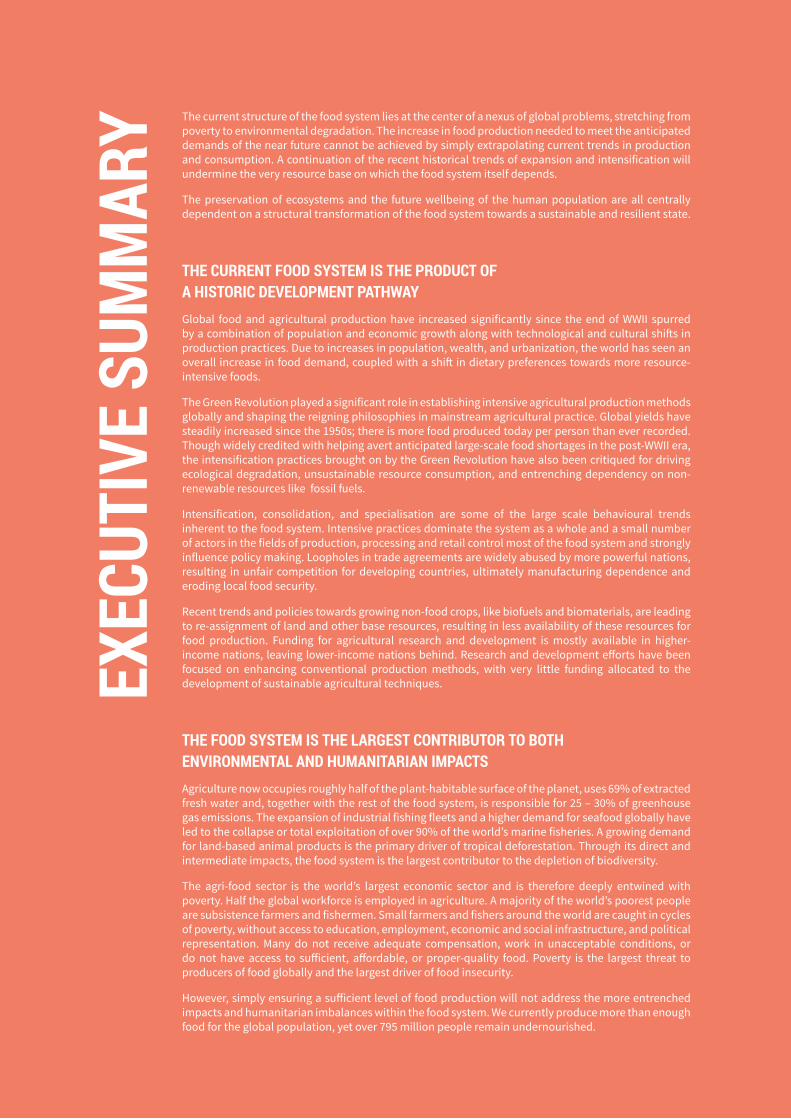
The current structure of the food system lies at the center of a nexus of global problems, stretching from poverty to environmental degradation. The increase in food production needed to meet the anticipated demands of the near future cannot be achieved by simply extrapolating current trends in production and consumption. A continuation of the recent historical trends of expansion and intensification will undermine the very resource base on which the food system itself depends.
The preservation of ecosystems and the future wellbeing of the human population are all centrally dependent on a structural transformation of the food system towards a sustainable and resilient state.
THE CURRENT FOOD SYSTEM IS THE PRODUCT OF A HISTORIC DEVELOPMENT PATHWAYGlobal food and agricultural production have increased significantly since the end of WWII spurred by a combination of population and economic growth along with technological and cultural shifts in production practices. Due to increases in population, wealth, and urbanization, the world has seen an overall increase in food demand, coupled with a shift in dietary preferences towards more resource-intensive foods.
The Green Revolution played a significant role in establishing intensive agricultural production methods globally and shaping the reigning philosophies in mainstream agricultural practice. Global yields have steadily increased since the 1950s; there is more food produced today per person than ever recorded. Though widely credited with helping avert anticipated large-scale food shortages in the post-WWII era, the intensification practices brought on by the Green Revolution have also been critiqued for driving ecological degradation, unsustainable resource consumption, and entrenching dependency on non-renewable resources like fossil fuels.
Intensification, consolidation, and specialisation are some of the large scale behavioural trends inherent to the food system. Intensive practices dominate the system as a whole and a small number of actors in the fields of production, processing and retail control most of the food system and strongly influence policy making. Loopholes in trade agreements are widely abused by more powerful nations, resulting in unfair competition for developing countries, ultimately manufacturing dependence and eroding local food security.
Recent trends and policies towards growing non-food crops, like biofuels and biomaterials, are leading to re-assignment of land and other base resources, resulting in less availability of these resources for food production. Funding for agricultural research and development is mostly available in higher-income nations, leaving lower-income nations behind. Research and development efforts have been focused on enhancing conventional production methods, with very little funding allocated to the development of sustainable agricultural techniques.
THE FOOD SYSTEM IS THE LARGEST CONTRIBUTOR TO BOTH ENVIRONMENTAL AND HUMANITARIAN IMPACTSAgriculture now occupies roughly half of the plant-habitable surface of the planet, uses 69% of extracted fresh water and, together with the rest of the food system, is responsible for 25 – 30% of greenhouse gas emissions. The expansion of industrial fishing fleets and a higher demand for seafood globally have led to the collapse or total exploitation of over 90% of the world’s marine fisheries. A growing demand for land-based animal products is the primary driver of tropical deforestation. Through its direct and intermediate impacts, the food system is the largest contributor to the depletion of biodiversity.
The agri-food sector is the world’s largest economic sector and is therefore deeply entwined with poverty. Half the global workforce is employed in agriculture. A majority of the world’s poorest people are subsistence farmers and fishermen. Small farmers and fishers around the world are caught in cycles of poverty, without access to education, employment, economic and social infrastructure, and political representation. Many do not receive adequate compensation, work in unacceptable conditions, or do not have access to sufficient, affordable, or proper-quality food. Poverty is the largest threat to producers of food globally and the largest driver of food insecurity.
However, simply ensuring a sufficient level of food production will not address the more entrenched impacts and humanitarian imbalances within the food system. We currently produce more than enough food for the global population, yet over 795 million people remain undernourished.
EXEC
UTIV
E SU
MM
ARY
THE GLOBAL FOOD SYSTEM: AN ANALYSIS 5
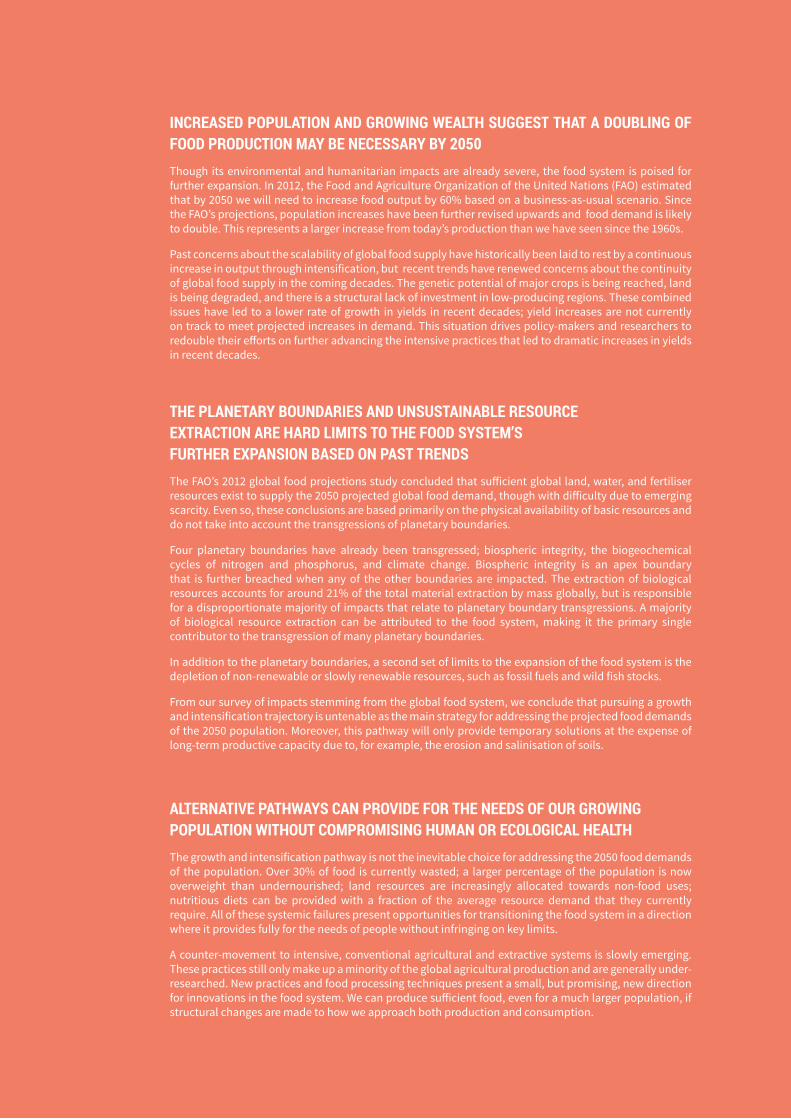
INCREASED POPULATION AND GROWING WEALTH SUGGEST THAT A DOUBLING OF FOOD PRODUCTION MAY BE NECESSARY BY 2050Though its environmental and humanitarian impacts are already severe, the food system is poised for further expansion. In 2012, the Food and Agriculture Organization of the United Nations (FAO) estimated that by 2050 we will need to increase food output by 60% based on a business-as-usual scenario. Since the FAO’s projections, population increases have been further revised upwards and food demand is likely to double. This represents a larger increase from today’s production than we have seen since the 1960s.
Past concerns about the scalability of global food supply have historically been laid to rest by a continuous increase in output through intensification, but recent trends have renewed concerns about the continuity of global food supply in the coming decades. The genetic potential of major crops is being reached, land is being degraded, and there is a structural lack of investment in low-producing regions. These combined issues have led to a lower rate of growth in yields in recent decades; yield increases are not currently on track to meet projected increases in demand. This situation drives policy-makers and researchers to redouble their efforts on further advancing the intensive practices that led to dramatic increases in yields in recent decades.
THE PLANETARY BOUNDARIES AND UNSUSTAINABLE RESOURCE EXTRACTION ARE HARD LIMITS TO THE FOOD SYSTEM’S FURTHER EXPANSION BASED ON PAST TRENDSThe FAO’s 2012 global food projections study concluded that sufficient global land, water, and fertiliser resources exist to supply the 2050 projected global food demand, though with difficulty due to emerging scarcity. Even so, these conclusions are based primarily on the physical availability of basic resources and do not take into account the transgressions of planetary boundaries.
Four planetary boundaries have already been transgressed; biospheric integrity, the biogeochemical cycles of nitrogen and phosphorus, and climate change. Biospheric integrity is an apex boundary that is further breached when any of the other boundaries are impacted. The extraction of biological resources accounts for around 21% of the total material extraction by mass globally, but is responsible for a disproportionate majority of impacts that relate to planetary boundary transgressions. A majority of biological resource extraction can be attributed to the food system, making it the primary single contributor to the transgression of many planetary boundaries.
In addition to the planetary boundaries, a second set of limits to the expansion of the food system is the depletion of non-renewable or slowly renewable resources, such as fossil fuels and wild fish stocks.
From our survey of impacts stemming from the global food system, we conclude that pursuing a growth and intensification trajectory is untenable as the main strategy for addressing the projected food demands of the 2050 population. Moreover, this pathway will only provide temporary solutions at the expense of long-term productive capacity due to, for example, the erosion and salinisation of soils.
ALTERNATIVE PATHWAYS CAN PROVIDE FOR THE NEEDS OF OUR GROWING POPULATION WITHOUT COMPROMISING HUMAN OR ECOLOGICAL HEALTHThe growth and intensification pathway is not the inevitable choice for addressing the 2050 food demands of the population. Over 30% of food is currently wasted; a larger percentage of the population is now overweight than undernourished; land resources are increasingly allocated towards non-food uses; nutritious diets can be provided with a fraction of the average resource demand that they currently require. All of these systemic failures present opportunities for transitioning the food system in a direction where it provides fully for the needs of people without infringing on key limits.
A counter-movement to intensive, conventional agricultural and extractive systems is slowly emerging. These practices still only make up a minority of the global agricultural production and are generally under-researched. New practices and food processing techniques present a small, but promising, new direction for innovations in the food system. We can produce sufficient food, even for a much larger population, if structural changes are made to how we approach both production and consumption.

6
To successfully move towards a sustainable and resilient food system, we must consider the systemic nature of the system’s behaviours and impacts. Severe, irreversible and non-linear impacts that may lead to the crossing of key systemic tipping points should be avoided at highest cost. These include impacts in areas of preservation of global biodiversity, mitigation of climate change, management of soils and essential non-renewable resources, the preservation of culture and heritage, and the preservation of human health. If we do not address and change the central root causes that lead to multiple impacts, impacts will continue to occur. To ensure that solutions are comprehensive and adaptive, we need to hard-wire systems thinking into the food policy. By accounting for systemic effects, we can come to understand feedback loops and adverse effects early on and adapt policy accordingly.
Making food policy decisions for the global food system requires stronger and more cooperative international governance. Many impacts in the food system today can be traced back to a structural limitation of governance and enforcement.
WE NEED TO ADDRESS FOUR MAIN CHALLENGES SIMULTANEOUSLY IN ORDER TO TRANSITION TO A SUSTAINABLE AND RESILIENT FOOD SYSTEM
Challenge 1: Adaptive and Resilient Food SystemAn adaptive and resilient food system is one that will be able to respond to changing circumstances and new challenges as they emerge. This is one of the most important systemic criteria for a sustainable food system, since we cannot predict all of the conditions or changes that will emerge in the future.
Adaptive capacity and resilience must be built into both biophysical aspects of the system (through the preservation of biodiversity, maintenance of healthy soil systems, maintenance of buffering capacity in water bodies, etc.) and socioeconomic aspects of the system (knowledge transfer, development or organizational capacity, elimination of poverty cycles, etc.).
Challenge 2: Nutritious Food For AllThe most basic and fundamental challenge that the food system must address is to ensure the supply of adequate nutrition for the world’s population. Ideally, it should achieve the objective set out by the World Food Summit in Rome, which states that food security is addressed when, “all people, at all times, have physical and economic access to sufficient, safe, and nutritious food to meet their dietary needs and food preferences for an active and healthy life.”
Some of the priority objectives for addressing this challenge should, at minimum, include: reducing overall food demand (e.g., through reducing food waste); progressively shifting to lower-impact, less-resource-intensive food sources; ensuring that scarce resources (land, water) are allocated to food production as a priority over non-food uses; improving economic access to food; and improving farmer productivity in the developing world.

THE GLOBAL FOOD SYSTEM: AN ANALYSIS 7
Challenge 3: Within Planetary BoundariesA sustainable food system should remain within planetary boundaries in all of the key biophysical impact areas across the entire life cycle of food production, consumption, and disposal. Though we should continuously strive for full net zero impact within the food system, there are some areas, such as preservation of biodiversity, which should be prioritized over others. In general, severe and irreversible impacts to complex ecological and cultural systems, and the depletion of non-renewable natural resources caused by the food system, should be addressed with the highest urgency.
Many of the approaches that are necessary to address Challenges 1 and 2 are also essential for bringing the operations of the food system within the scope of the planetary boundaries. Notably, reducing food demand and shifting to lower-impact sources of food are critical prerequisites for bringing down the overall resource throughput of the system. In addition, this challenge requires at least the following measures: reducing the impact of existing agricultural and extractive practices (e.g, applying conservation measures, moving to lower-impact fishing techniques); Placing limits on system expansion and intensification, particularly when addressing the global yield gap (e.g., reducing arable land expansion, and if necessary directing it towards marginal lands); and investing in the development of new sustainable agricultural techniques (e.g., organic cultivars, agro-ecological practices).
Challenge 4: Supporting Livelihoods and Wellbeing.The food system should structurally support the livelihoods and well-being of people working within it. It should be possible to fully nourish and support oneself and earn a reasonable living wage in exchange for average work hours within the food system.
Ensuring that the food system supports livelihoods and wellbeing is more than an end in itself; it is also essential for addressing the other three challenges. Without secure livelihoods, smallholder farmers and fishermen will continue to struggle in building the necessary capacity and resource base to transition to sustainable models of production. A resilient system cannot be built upon an unstable foundation. Therefore, addressing the systemic structures that perpetuate poverty is critical to the success of achieving a sustainable and resilient food system.

8
The global food system is in need of dramatic transformation. The pathway we are currently on is leading to an impasse: the increases in food production needed to meet the anticipated demands of a much larger and wealthier human population cannot be achieved by simply extrapolating current trends in production and consumption.
Can we achieve a food system that works within the planet’s biophysical boundaries, inclusively supports human livelihoods, and ensures food security for a growing and changing population? This has become one of the central questions in humanity’s broader quest to shape a sustainable future.
THE DILEMMAIn the 8 – 10,000 years since we began practicing agriculture (Harlan & MacNeish, 1994), only a small fraction of the 200,000 years that modern humans are estimated to have existed (Harpending & Eswaran, 2005), food production has altered our environment more dramatically than any other socioeconomic activity. Agriculture now occupies roughly half of the plant-habitable surface of the planet (FAO, 2015b), uses 69% of extracted fresh water (Aquastat, 2014), and, together with the rest of the food chain, is responsible for between 25 - 30% of global greenhouse gas emissions (IPCC, 2013). The expansion of industrial fishing fleets and an increased global appetite for seafood have led to the collapse or total exploitation of 90% of the world’s marine fisheries (FAO, 2014b).
Likewise, a growing demand for land-based animal products is the primary driver of tropical deforestation (Convention on Biological Diversity, 2015) . Through its myriad direct and intermediate impacts, the food system is the single largest contributor to the depletion of our most precious non-renewable resource: global biodiversity (see section 3.1).
Though its environmental impacts are already severe, the food system, which we define as the complete set of people, institutions, activities, processes, and infrastructure involved in producing and consuming food for a given population, is poised for a necessary expansion.
In 2012, the Food and Agriculture Organization of the United Nations estimated that by 2050 we will need to increase food output by 60% based on a business-as-usual scenario. Since the FAO’s projections, population increases have been further revised upwards and the food demand is likely to need to double (United Nations, 2015). This represents a larger increase from today’s production levels than we have achieved through advances of the Green Revolution since the 1960s (Searchinger et al., 2013).
STRUCTURAL CHALLENGESSimply ensuring a sufficient level of food production, however, does not address some of the more entrenched impacts and humanitarian imbalances in the current food system. We currently produce more than enough food for the global population, yet despite this fact, over 795 million people remain food insecure.
On the other side of the spectrum, in 2014, the number of overweight people reached 1.9 billion, with over 600 million obese (World Health Organization (WHO), 2015). Due to a combination of poverty, lack of education, and evolving commercial practices in the food industry, there is an increasing emergence of “double burden” families that have members who are both overweight and malnourished(World Health Organization (WHO), 2015).
As the world’s largest economic sector, the agri-food system is also deeply entwined with the issue of global poverty. Half of the global workforce (1.3 billion people) are employed in agriculture, with an estimated 2.6 billion deriving their primary livelihoods from it (International Labour Organization (ILO), 2015). A majority of the world’s poorest people are subsistence farmers and fishermen, whose basic livelihoods continue to be threatened by structural poverty traps (Carter & Barrett, 2006).
It is clear that ensuring adequate food globally, though critical, is just one piece of a much more complex puzzle. The current structure of the global food system lies at the centre of a nexus of global problems stretching from poverty to environmental degradation.
INTRODUCTION
Creative Commons: McKay Savage
The food system is the single largest contributor to the depletion of global biodiversity.

THE GLOBAL FOOD SYSTEM: AN ANALYSIS 9
BREAKING THE PATTERNThe dilemma of the global food system is a deeply existential one. On the one hand, we have a moral imperative to ensure an uninterrupted food supply, on the other, doing so based on the expansion of current practices will have devastating consequences for our natural environment, undermining the very basis of the food system’s functioning. Most of the solutions proposed to resolve this dilemma focus on the expansion of arable lands and the increase of yields per hectare through the intensification of agricultural production. There is good reason to question whether or not this approach, which in many ways represents a continuation of existing trends, will result in a food system that sufficiently resolves the nexus of problems we face:
» Universal food security has not been achieved despite the fact that food production levels are sufficient to feed everyone globally; 10.8% of the global population remains food insecure despite a global surplus in caloric production of over 20% (Marx, 2015; authors’ estimates based on FAOSTAT data).
» The global nutrient cycles of nitrogen and phosphorous are broken, not only because of practices in agriculture, but to an equally large extent through the lack of collection of nutrients from municipal waste water systems (Vitousek et al., 1997).
» Production practices are evaluated based primarily on short-term increases in yields, rather than on their ability to sustain long-term productive output based on care for soils, appropriate labour systems, and the need for adaptation to the effects of climate change (Phelps, Carrasco, Webb, Koh, & Pascual, 2013).
» Despite clear indications that allocating arable land use to the production of first generation biofuels is not a good use of resources by almost any measure, policies remain in place to continue this trend (Bastos Lima & Gupta, 2014).
» Around one third of food globally is wasted, indicating large potential gains for reducing impact and saving scarce resources (Gustavsson, Cederberg, & Sonesson, 2011).
» The very structure of global food markets and trade continues to keep individuals trapped in poverty and threatens local food access in developing countries (Serpukhov, 2013).
As the food system has expanded over the past decades, many of these concerns have come into sharper focus rather than becoming resolved. This observation points to the fact that more effective and durable solutions to achieving a sustainable and resilient food future may lie in deeper parts of the system: in its very structure and the underlying incentives that lead to continued problematic outcomes.
NEW PATHWAYSFood is a daily necessity, a carrier of our cultural values, family traditions, and even personal ideologies. The very discussion of the challenge of the food system is often framed politically, as a battle between the needs of humans versus the needs of the environment. Discussions about organic agriculture or Genetically Modified Organisms (GMOs) are almost never merely about technological efficiency; they touch on several polarizing debates around people’s identities, ethics, and views of the world.
We need a multitude of strategies at different levels of the food systems functioning that go beyond individual convictions in order to address the urgent challenges at hand. To that end, it is essential to take an objective look at the data and look beyond the well-worn pathways of argumentation.
This report presents a baseline analysis of the global food system using methodologies taken from systems science. One of our primary objectives is to present a clear overview of the current performance of the global food system: its inputs, outputs, impacts, structure, and behaviour. With this factual basis, we hope to lay the foundation for further in-depth analysis, and inform a deeper and broader look at the potential systemic approaches for transitioning towards a truly sustainable, resilient food system.
The inevitability of an expansion of food production based on current business as usual models is far from a closed question; a coordinated effort between policy makers, knowledge institutes, producers, financial institutions, and consumers is needed to shape a new, coherent pathway forward.
10
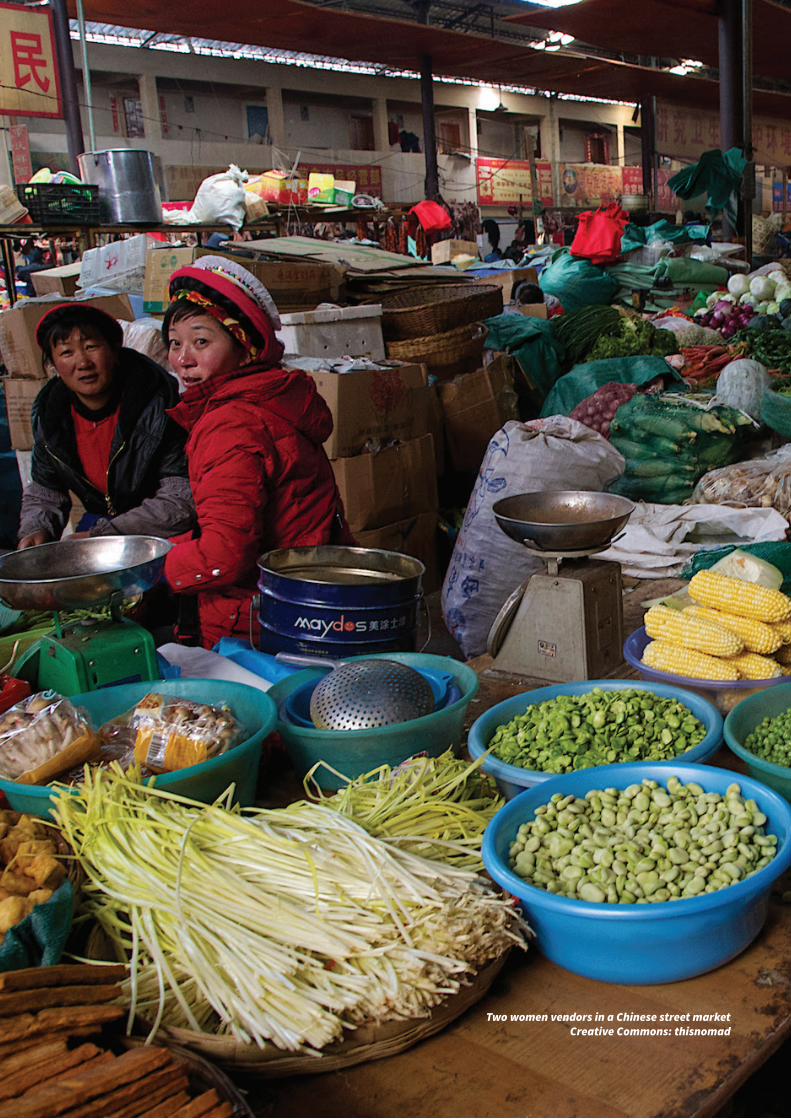
Two women vendors in a Chinese street marketCreative Commons: thisnomad
THE GLOBAL FOOD SYSTEM: AN ANALYSIS 11
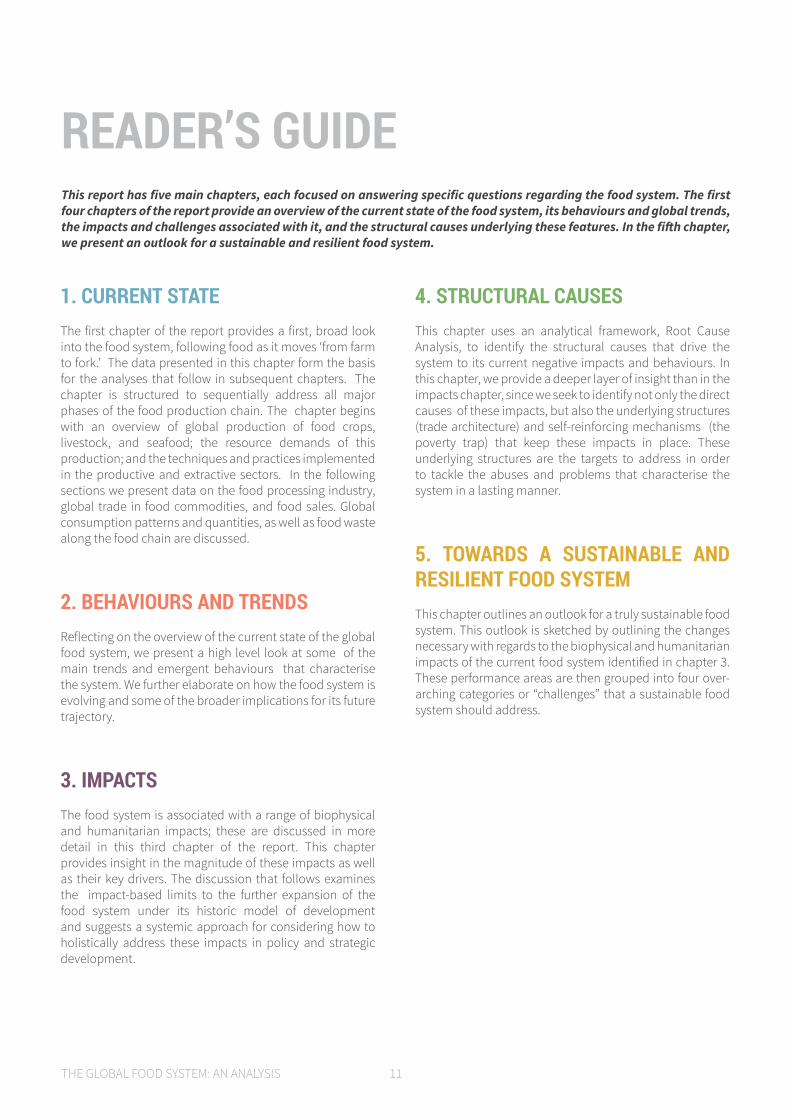
1. CURRENT STATEThe first chapter of the report provides a first, broad look into the food system, following food as it moves ‘from farm to fork.’ The data presented in this chapter form the basis for the analyses that follow in subsequent chapters. The chapter is structured to sequentially address all major phases of the food production chain. The chapter begins with an overview of global production of food crops, livestock, and seafood; the resource demands of this production; and the techniques and practices implemented in the productive and extractive sectors. In the following sections we present data on the food processing industry, global trade in food commodities, and food sales. Global consumption patterns and quantities, as well as food waste along the food chain are discussed.
2. BEHAVIOURS AND TRENDSReflecting on the overview of the current state of the global food system, we present a high level look at some of the main trends and emergent behaviours that characterise the system. We further elaborate on how the food system is evolving and some of the broader implications for its future trajectory.
3. IMPACTSThe food system is associated with a range of biophysical and humanitarian impacts; these are discussed in more detail in this third chapter of the report. This chapter provides insight in the magnitude of these impacts as well as their key drivers. The discussion that follows examines the impact-based limits to the further expansion of the food system under its historic model of development and suggests a systemic approach for considering how to holistically address these impacts in policy and strategic development.
4. STRUCTURAL CAUSESThis chapter uses an analytical framework, Root Cause Analysis, to identify the structural causes that drive the system to its current negative impacts and behaviours. In this chapter, we provide a deeper layer of insight than in the impacts chapter, since we seek to identify not only the direct causes of these impacts, but also the underlying structures (trade architecture) and self-reinforcing mechanisms (the poverty trap) that keep these impacts in place. These underlying structures are the targets to address in order to tackle the abuses and problems that characterise the system in a lasting manner.
5. TOWARDS A SUSTAINABLE AND RESILIENT FOOD SYSTEMThis chapter outlines an outlook for a truly sustainable food system. This outlook is sketched by outlining the changes necessary with regards to the biophysical and humanitarian impacts of the current food system identified in chapter 3. These performance areas are then grouped into four over-arching categories or “challenges” that a sustainable food system should address.
READER’S GUIDEThis report has five main chapters, each focused on answering specific questions regarding the food system. The first four chapters of the report provide an overview of the current state of the food system, its behaviours and global trends, the impacts and challenges associated with it, and the structural causes underlying these features. In the fifth chapter, we present an outlook for a sustainable and resilient food system.
12
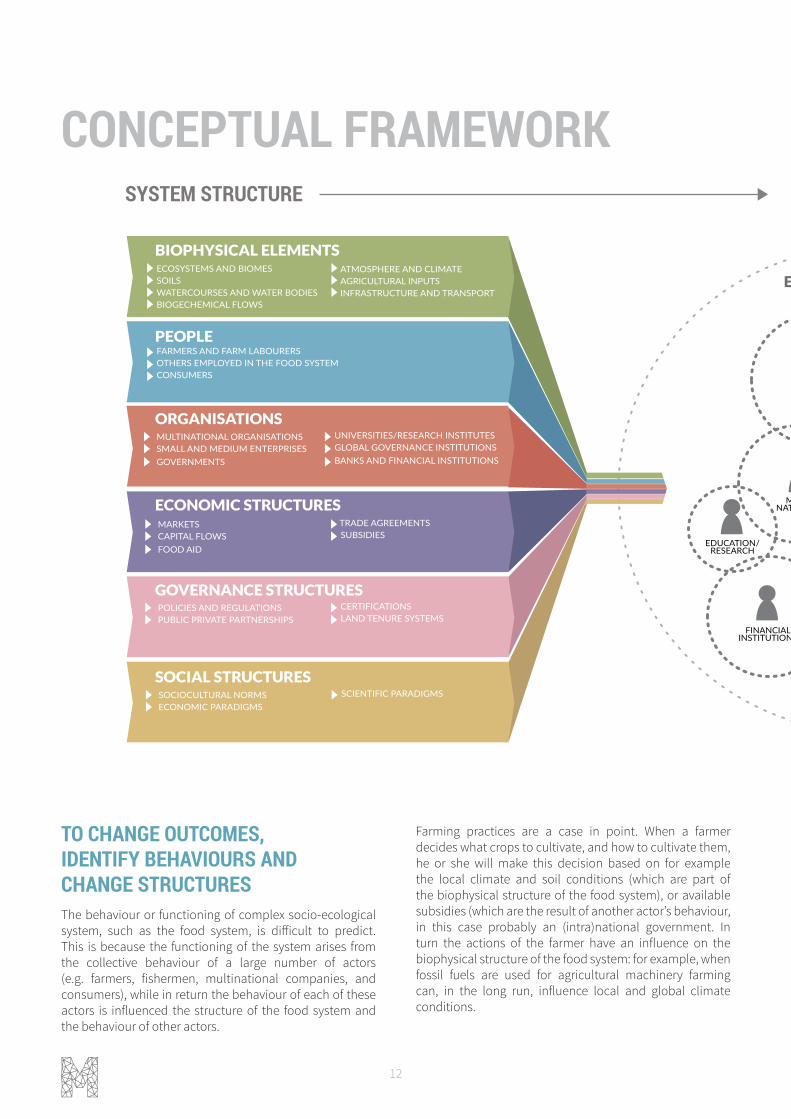
TO CHANGE OUTCOMES, IDENTIFY BEHAVIOURS AND CHANGE STRUCTURESThe behaviour or functioning of complex socio-ecological system, such as the food system, is difficult to predict. This is because the functioning of the system arises from the collective behaviour of a large number of actors (e.g. farmers, fishermen, multinational companies, and consumers), while in return the behaviour of each of these actors is influenced the structure of the food system and the behaviour of other actors.
PEOPLE
ECOSYSTEMS AND BIOMESSOILSWATERCOURSES AND WATER BODIESBIOGECHEMICAL FLOWS
ATMOSPHERE AND CLIMATEAGRICULTURAL INPUTSINFRASTRUCTURE AND TRANSPORT
FARMERS/FARM LABOURERS
GOVERNMENTS
MULTI-NATIONALS
SMEs
CONSUMERS
EDUCATION/RESEARCH
CIVIC ACTORS/NGOs
FINANCIALINSTITUTIONS
EMERGENT BEHAVIOUR
ORGANISATIONSMULTINATIONAL ORGANISATIONSSMALL AND MEDIUM ENTERPRISES
UNIVERSITIES/RESEARCH INSTITUTESGLOBAL GOVERNANCE INSTITUTIONS
GOVERNMENTS BANKS AND FINANCIAL INSTITUTIONS
ECONOMIC STRUCTURESMARKETSCAPITAL FLOWS
TRADE AGREEMENTSSUBSIDIES
FOOD AID
GOVERNANCE STRUCTURESPOLICIES AND REGULATIONSPUBLIC PRIVATE PARTNERSHIPS
CERTIFICATIONSLAND TENURE SYSTEMS
SOCIAL STRUCTURESSOCIOCULTURAL NORMSECONOMIC PARADIGMS
SCIENTIFIC PARADIGMS
FARMERS AND FARM LABOURERSOTHERS EMPLOYED IN THE FOOD SYSTEMCONSUMERS
BIOGEOCHEMICAL FLOWSBIOPHYSICAL INTEGRITY
CLIMATE CHANGEWATER USEEMISSIONS AND WASTE
ECONOMY AND FINANCEFOOD SECURITY, SAFETY, & NUTRITION
EQUITY AND FAIRNESSANIMAL WELFARE
BIOPHYSICAL ELEMENTS
HEALTH ANDWELLBEING IMPACTS
BIOPHYSICAL IMPACTS
SYSTEM STRUCTURE SYSTEM BEHAVIOUR SYSTEM STATE (IMPACTS)
Farming practices are a case in point. When a farmer decides what crops to cultivate, and how to cultivate them, he or she will make this decision based on for example the local climate and soil conditions (which are part of the biophysical structure of the food system), or available subsidies (which are the result of another actor’s behaviour, in this case probably an (intra)national government. In turn the actions of the farmer have an influence on the biophysical structure of the food system: for example, when fossil fuels are used for agricultural machinery farming can, in the long run, influence local and global climate conditions.
CONCEPTUAL FRAMEWORKSYSTEM STRUCTURE SYSTEM BEHAVIOUR

THE GLOBAL FOOD SYSTEM: AN ANALYSIS 13
PEOPLE
ECOSYSTEMS AND BIOMESSOILSWATERCOURSES AND WATER BODIESBIOGECHEMICAL FLOWS
ATMOSPHERE AND CLIMATEAGRICULTURAL INPUTSINFRASTRUCTURE AND TRANSPORT
FARMERS/FARM LABOURERS
GOVERNMENTS
MULTI-NATIONALS
SMEs
CONSUMERS
EDUCATION/RESEARCH
CIVIC ACTORS/NGOs
FINANCIALINSTITUTIONS
EMERGENT BEHAVIOUR
ORGANISATIONSMULTINATIONAL ORGANISATIONSSMALL AND MEDIUM ENTERPRISES
UNIVERSITIES/RESEARCH INSTITUTESGLOBAL GOVERNANCE INSTITUTIONS
GOVERNMENTS BANKS AND FINANCIAL INSTITUTIONS
ECONOMIC STRUCTURESMARKETSCAPITAL FLOWS
TRADE AGREEMENTSSUBSIDIES
FOOD AID
GOVERNANCE STRUCTURESPOLICIES AND REGULATIONSPUBLIC PRIVATE PARTNERSHIPS
CERTIFICATIONSLAND TENURE SYSTEMS
SOCIAL STRUCTURESSOCIOCULTURAL NORMSECONOMIC PARADIGMS
SCIENTIFIC PARADIGMS
FARMERS AND FARM LABOURERSOTHERS EMPLOYED IN THE FOOD SYSTEMCONSUMERS
BIOGEOCHEMICAL FLOWSBIOPHYSICAL INTEGRITY
CLIMATE CHANGEWATER USEEMISSIONS AND WASTE
ECONOMY AND FINANCEFOOD SECURITY, SAFETY, & NUTRITION
EQUITY AND FAIRNESSANIMAL WELFARE
BIOPHYSICAL ELEMENTS
HEALTH ANDWELLBEING IMPACTS
BIOPHYSICAL IMPACTS
SYSTEM STRUCTURE SYSTEM BEHAVIOUR SYSTEM STATE (IMPACTS)
Systems theory proposes that the structures of a system give rise to behaviours, which are in turn the drivers behind system impacts. The figure above illustrates some of the most important system structures in the food system: biophysical elements, the people and organisations in the system, and economic, governance, and social structures. Specific actors, such as farmers, or consumers, interact with these structures; from the collective action of all these actors, a certain state of the system emerges. The systems state can be observed by looking at certain biophysical or humanitarian impacts, such as biodiversity loss.
Figure 1. The conceptual framework used in this systems analysis. In this graphic, “emergent behaviour” is not intended to accurately depict the actual interactions between actors, nor how this behaviour affects actors outside of the food system. (Metabolic)
Ultimately, the state of the food system is the result of the behaviour of many different actors, who interact with many different parts of the systems structure. Therefore, researching the food system from the perspective of systems thinking, we focus precisely on these interrelationships. Our approach takes a holistic lens that understands the system as a dynamic whole, rather than looking at certain parts of the system in isolation. This way we avoid one-dimensional solutions, which may solve one problem while triggering another, and instead come up with a set of holistic strategies for a truly sustainable food system.
SYSTEM BEHAVIOUR SYSTEM STATE (IMPACTS)

14

THE GLOBAL FOOD SYSTEM: AN ANALYSIS 15
01
Longshen rice terrace, Wikimedia Commons Creative Commons: Severin Stalder
01 CURRENT STATE
0201
0304
05
16
The food system is both enormous and complex. The trend of globalization has intensified the level of interdependency between its actors and processes over the last half century, leading to an increasingly “global” system in the true sense of the word. The full scope of the food system stretches to include the vast majority of the human population (as either producers, traders, or consumers), the majority of all economic activities, and a large proportion of many categories of resource use. A wealth of data is collected annually on the performance of the global food system by intergovernmental organisations such as the Food and Agriculture Organization of the United Nations (FAO), national and local governments, non-governmental organisations (NGOs), and a variety of research and academic institutions. Statistics collected cover everything from agricultural yields and regional availability of tractors to trade balances and malnutrition rates. In this chapter, we explore the current state of the global food system through the lens of some of its core processes: production and extraction, processing, trade, retail, consumption, and waste. We present key statistics along each of the steps of this chain, which will serve as the basis for further interpretation and analysis in later parts of the report and in the follow up studies to this work. Understanding the basic nature of the resource flows and production practices in the food system is an essential prerequisite to gaining insight into the problems at hand.
KEY MESSAGES » Currently 30 major crops account for 90 to 95% of human food consumption (United Nations
Environmental Programme, 2007). Cereal production occupies the largest percentage of cultivated land, accounting for almost half of total cultivated area, followed by oil crops, which occupy almost one fifth.
» Of the 1.5 billion hectares of agricultural land worldwide, only a third is used for the production of food crops. The remainder is primarily dedicated to the production of livestock. Because 38% of global crops are used as feed for animals, only 20% of global agricultural land is utilized for the direct production of crops for human consumption (FAO, 2015b).
» Fish provide 4.3 billion people with around 15 percent of their animal protein intake (FAO, 2014b). The global fisheries and aquaculture sector produced over 176 million tonnes of seafood in 2011 (FAO, 2015b). Although the production of fish, seafood, and algae is still dominated by extractive wild capture fisheries, global aquaculture (aquatic farming) has more than doubled since the start of the millennium, and is positioned to become the primary contributor to seafood production in the near future.
» The production of food is dominated by East Asia, Latin America, and Europe; between them, these regions produce over half of the world’s food supply.
» Contrary to popular expectations originating from topics like “food miles” and import dependencies, the amount of international trade is relatively insignificant compared to total volumes of production (14% of total annual production), though some commodities, like coffee, are outliers in this regard.
» There is enormous variability in global agricultural production and wild extraction systems. The type of practice selected is one of the main determinants of resource demand and yield, and by extension, environmental impact.
1.0
INTR
ODUC
TION
THE GLOBAL FOOD SYSTEM: AN ANALYSIS 17
01 CURRENT STATE
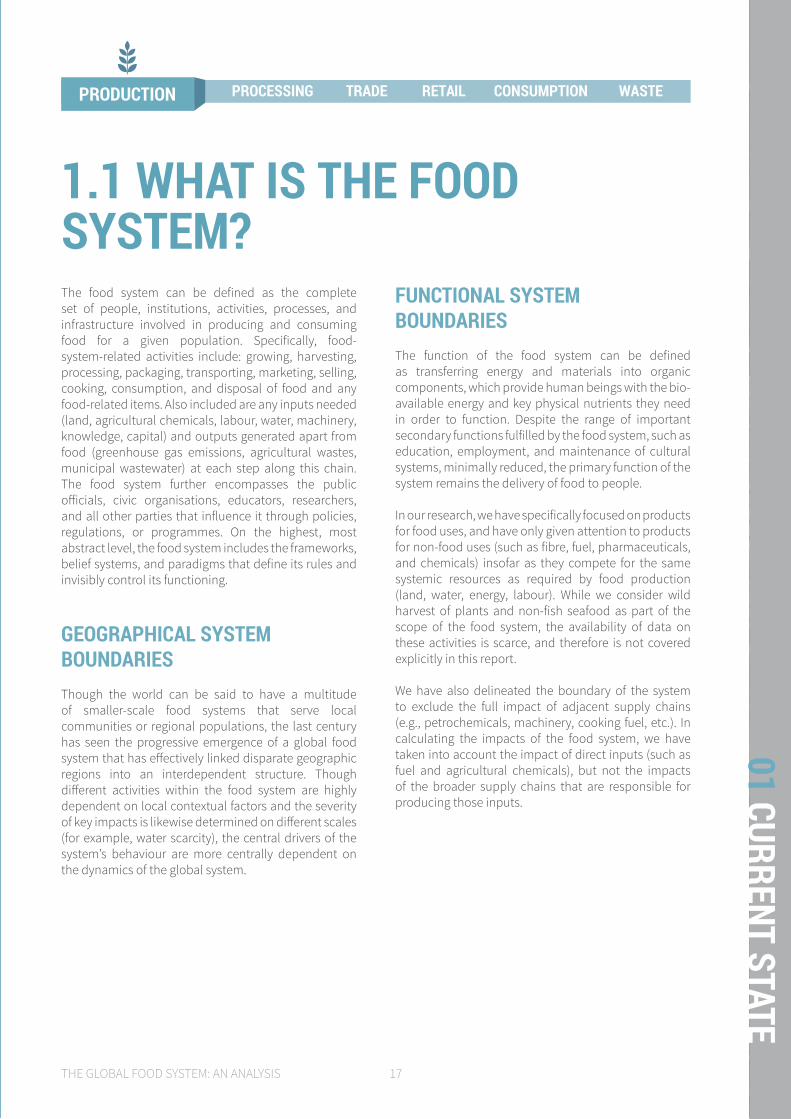
The food system can be defined as the complete set of people, institutions, activities, processes, and infrastructure involved in producing and consuming food for a given population. Specifically, food-system-related activities include: growing, harvesting, processing, packaging, transporting, marketing, selling, cooking, consumption, and disposal of food and any food-related items. Also included are any inputs needed (land, agricultural chemicals, labour, water, machinery, knowledge, capital) and outputs generated apart from food (greenhouse gas emissions, agricultural wastes, municipal wastewater) at each step along this chain. The food system further encompasses the public officials, civic organisations, educators, researchers, and all other parties that influence it through policies, regulations, or programmes. On the highest, most abstract level, the food system includes the frameworks, belief systems, and paradigms that define its rules and invisibly control its functioning.
GEOGRAPHICAL SYSTEM BOUNDARIESThough the world can be said to have a multitude of smaller-scale food systems that serve local communities or regional populations, the last century has seen the progressive emergence of a global food system that has effectively linked disparate geographic regions into an interdependent structure. Though different activities within the food system are highly dependent on local contextual factors and the severity of key impacts is likewise determined on different scales (for example, water scarcity), the central drivers of the system’s behaviour are more centrally dependent on the dynamics of the global system.
FUNCTIONAL SYSTEM BOUNDARIESThe function of the food system can be defined as transferring energy and materials into organic components, which provide human beings with the bio-available energy and key physical nutrients they need in order to function. Despite the range of important secondary functions fulfilled by the food system, such as education, employment, and maintenance of cultural systems, minimally reduced, the primary function of the system remains the delivery of food to people.
In our research, we have specifically focused on products for food uses, and have only given attention to products for non-food uses (such as fibre, fuel, pharmaceuticals, and chemicals) insofar as they compete for the same systemic resources as required by food production (land, water, energy, labour). While we consider wild harvest of plants and non-fish seafood as part of the scope of the food system, the availability of data on these activities is scarce, and therefore is not covered explicitly in this report.
We have also delineated the boundary of the system to exclude the full impact of adjacent supply chains (e.g., petrochemicals, machinery, cooking fuel, etc.). In calculating the impacts of the food system, we have taken into account the impact of direct inputs (such as fuel and agricultural chemicals), but not the impacts of the broader supply chains that are responsible for producing those inputs.
1.1 WHAT IS THE FOOD SYSTEM?
PRODUCTION PROCESSING TRADE RETAIL CONSUMPTION WASTE
18
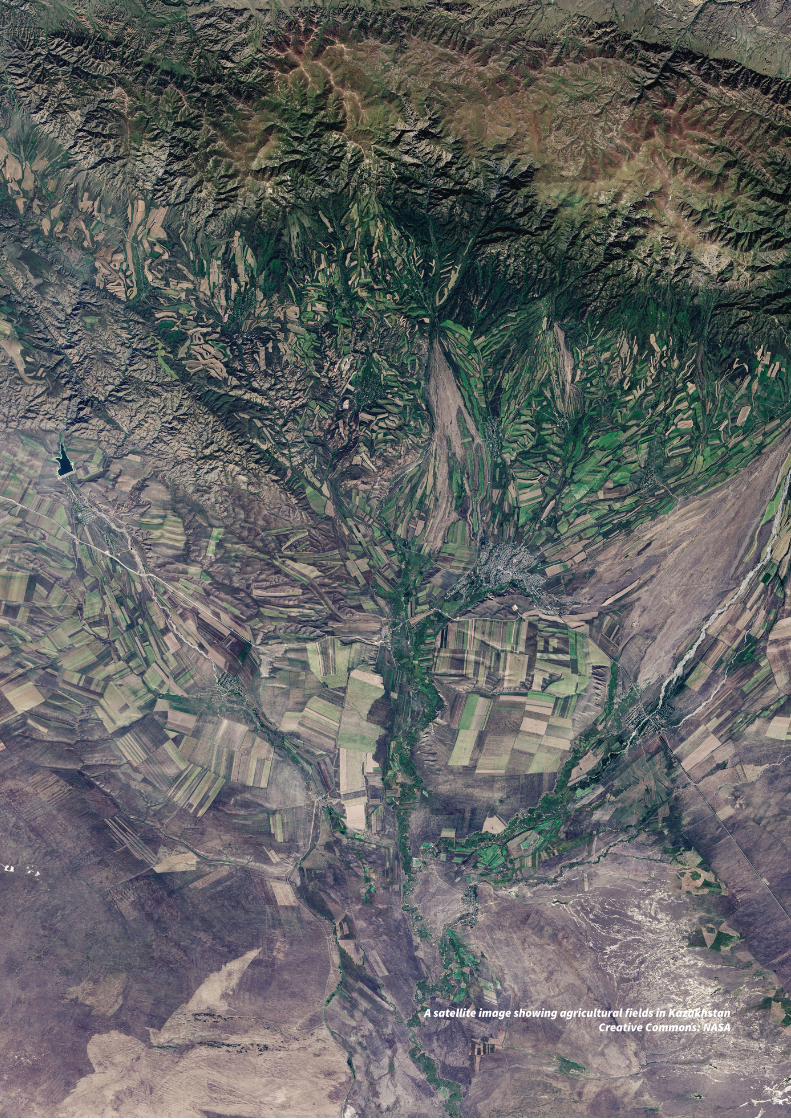
A satellite image showing agricultural fields in KazakhstanCreative Commons: NASA
THE GLOBAL FOOD SYSTEM: AN ANALYSIS 19
01 CURRENT STATE
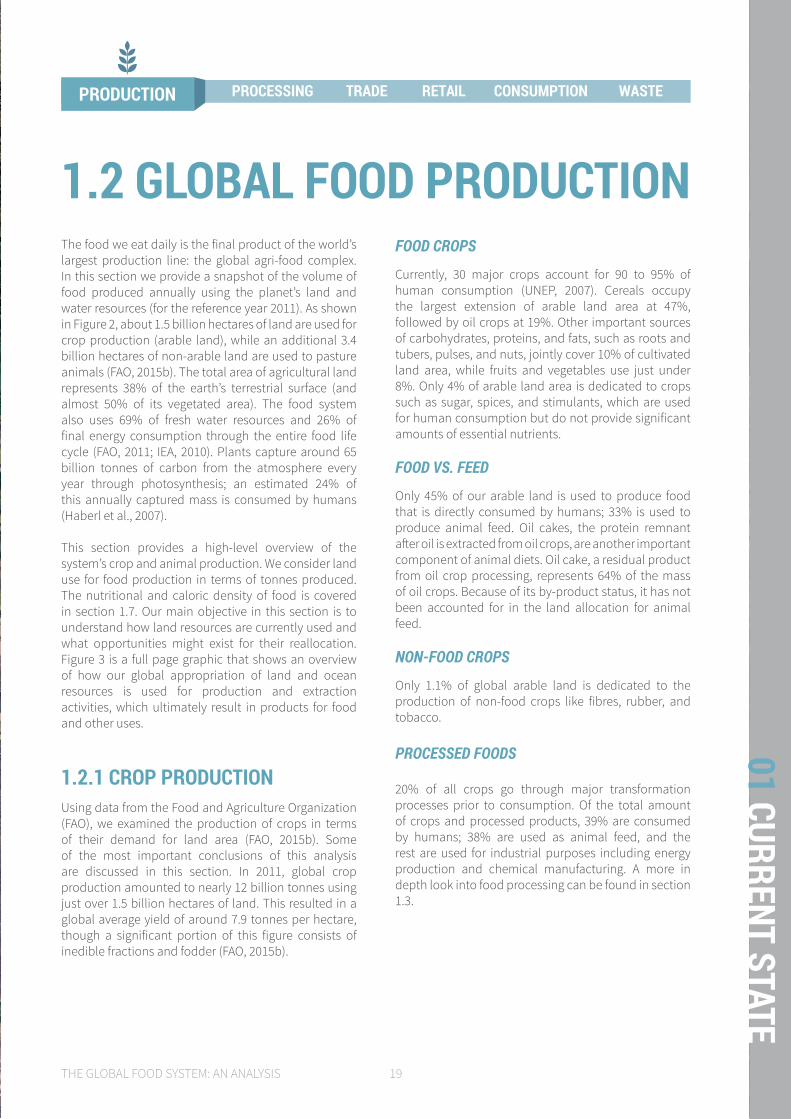
The food we eat daily is the final product of the world’s largest production line: the global agri-food complex. In this section we provide a snapshot of the volume of food produced annually using the planet’s land and water resources (for the reference year 2011). As shown in Figure 2, about 1.5 billion hectares of land are used for crop production (arable land), while an additional 3.4 billion hectares of non-arable land are used to pasture animals (FAO, 2015b). The total area of agricultural land represents 38% of the earth’s terrestrial surface (and almost 50% of its vegetated area). The food system also uses 69% of fresh water resources and 26% of final energy consumption through the entire food life cycle (FAO, 2011; IEA, 2010). Plants capture around 65 billion tonnes of carbon from the atmosphere every year through photosynthesis; an estimated 24% of this annually captured mass is consumed by humans (Haberl et al., 2007).
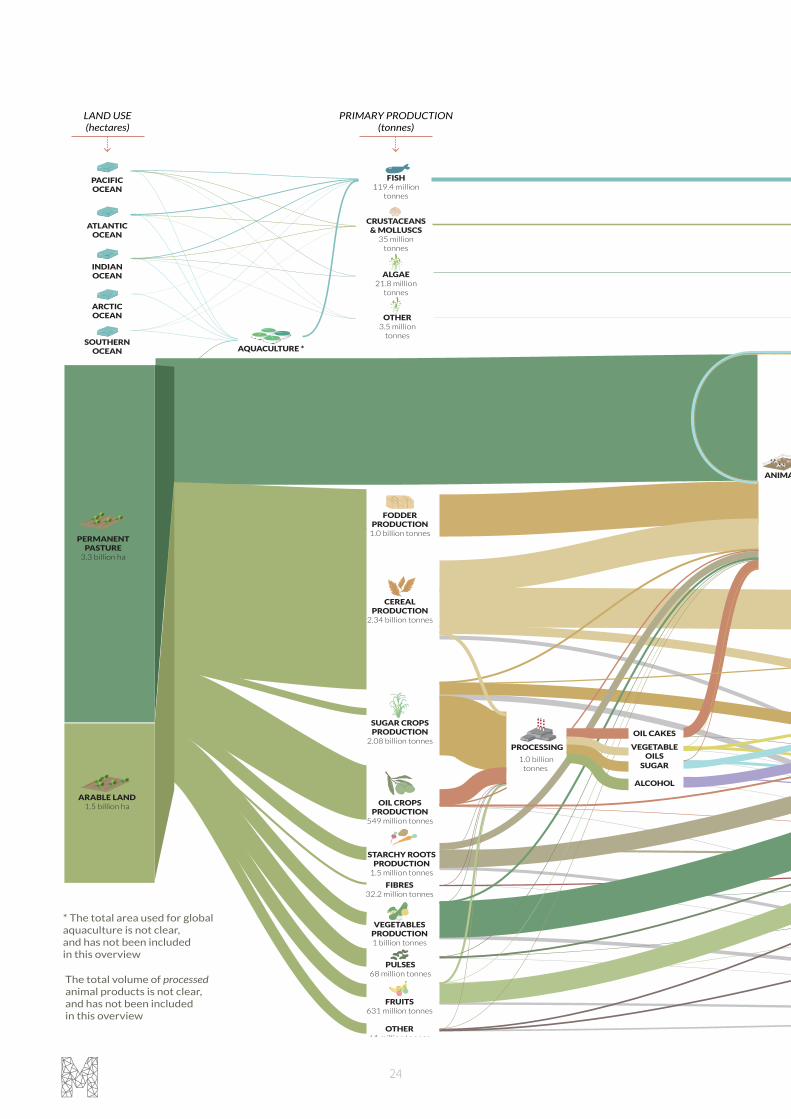
This section provides a high-level overview of the system’s crop and animal production. We consider land use for food production in terms of tonnes produced. The nutritional and caloric density of food is covered in section 1.7. Our main objective in this section is to understand how land resources are currently used and what opportunities might exist for their reallocation. Figure 3 is a full page graphic that shows an overview of how our global appropriation of land and ocean resources is used for production and extraction activities, which ultimately result in products for food and other uses.
1.2.1 CROP PRODUCTION Using data from the Food and Agriculture Organization (FAO), we examined the production of crops in terms of their demand for land area (FAO, 2015b). Some of the most important conclusions of this analysis are discussed in this section. In 2011, global crop production amounted to nearly 12 billion tonnes using just over 1.5 billion hectares of land. This resulted in a global average yield of around 7.9 tonnes per hectare, though a significant portion of this figure consists of inedible fractions and fodder (FAO, 2015b).
1.2 GLOBAL FOOD PRODUCTIONFOOD CROPS
Currently, 30 major crops account for 90 to 95% of human consumption (UNEP, 2007). Cereals occupy the largest extension of arable land area at 47%, followed by oil crops at 19%. Other important sources of carbohydrates, proteins, and fats, such as roots and tubers, pulses, and nuts, jointly cover 10% of cultivated land area, while fruits and vegetables use just under 8%. Only 4% of arable land area is dedicated to crops such as sugar, spices, and stimulants, which are used for human consumption but do not provide significant amounts of essential nutrients.
FOOD VS. FEED
Only 45% of our arable land is used to produce food that is directly consumed by humans; 33% is used to produce animal feed. Oil cakes, the protein remnant after oil is extracted from oil crops, are another important component of animal diets. Oil cake, a residual product from oil crop processing, represents 64% of the mass of oil crops. Because of its by-product status, it has not been accounted for in the land allocation for animal feed.
NON-FOOD CROPS
Only 1.1% of global arable land is dedicated to the production of non-food crops like fibres, rubber, and tobacco.
PROCESSED FOODS
20% of all crops go through major transformation processes prior to consumption. Of the total amount of crops and processed products, 39% are consumed by humans; 38% are used as animal feed, and the rest are used for industrial purposes including energy production and chemical manufacturing. A more in depth look into food processing can be found in section 1.3.
PRODUCTION PROCESSING TRADE RETAIL CONSUMPTION WASTE

20
NON-FOOD USES OF FOOD CROPS
Besides fibres, tobacco, and rubber, which are inedible and grown for industrial uses, a significant fraction of food crops is used for purposes other than human or animal consumption, occupying 12% of arable land globally. The majority of these are crops used for the production of biofuels. Other uses of these crops include the production of materials, like bioplastics, chemical substances with industrial uses, and medicines.
The largest sources of crop-derived raw materials for industrial processing are, sugar (47%) and cereal crops (36%). In terms of the total production of these crops, 15% of the sugar produced, 10% of cereal crops and 36% of vegetable oils produced are destined for industrial processing.
POST-HARVEST LOSSES
Just under five percent of crop output is lost before being consumed or processed, representing a total of 5% of arable land use. Roots and tubers suffer the highest percentage of losses (10%) followed by fruits (9%), vegetables (8%), and sugar crops (7%). Roots and tubers suffer most losses during the post-harvest and processing stages mainly since fresh roots and tubers are perishable and susceptible to damage or disease post-harvest, especially in places that lack proper storage facilities. In the case of fruits and vegetables, losses mostly result from damage due to handling or spoilage. In the case of sugar crops, most losses occur during distribution and industrial processing (Gustavsson et al., 2011).
TOTAL LAND AVAILABLE
ON EARTH(billion hectares)
FOOD (0.67 billion ha)
FEED (0.49 billion ha)
CROPS FOR INDUSTRY (0.18 billion ha)WASTED DUE TO LOSSES (0.08 billion ha)
PRODUCTION OF SEEDS (0.03 billion ha)
NON-FOOD CROPS (0.03 billion ha)
ARABLE LAND
(1.5 billion ha)
PASTURES(3.4 billion ha)
FORESTS(3.7 billion ha)
OTHER(6.2 billion ha)
Figure 2: A breakdown of how global land is divided into basic functional categories and how arable land is specifically divided into different functions.
(FAOSTAT, 2015)
PRODUCTION PROCESSING TRADE RETAIL CONSUMPTION WASTE
THE GLOBAL FOOD SYSTEM: AN ANALYSIS 21
01 CURRENT STATE
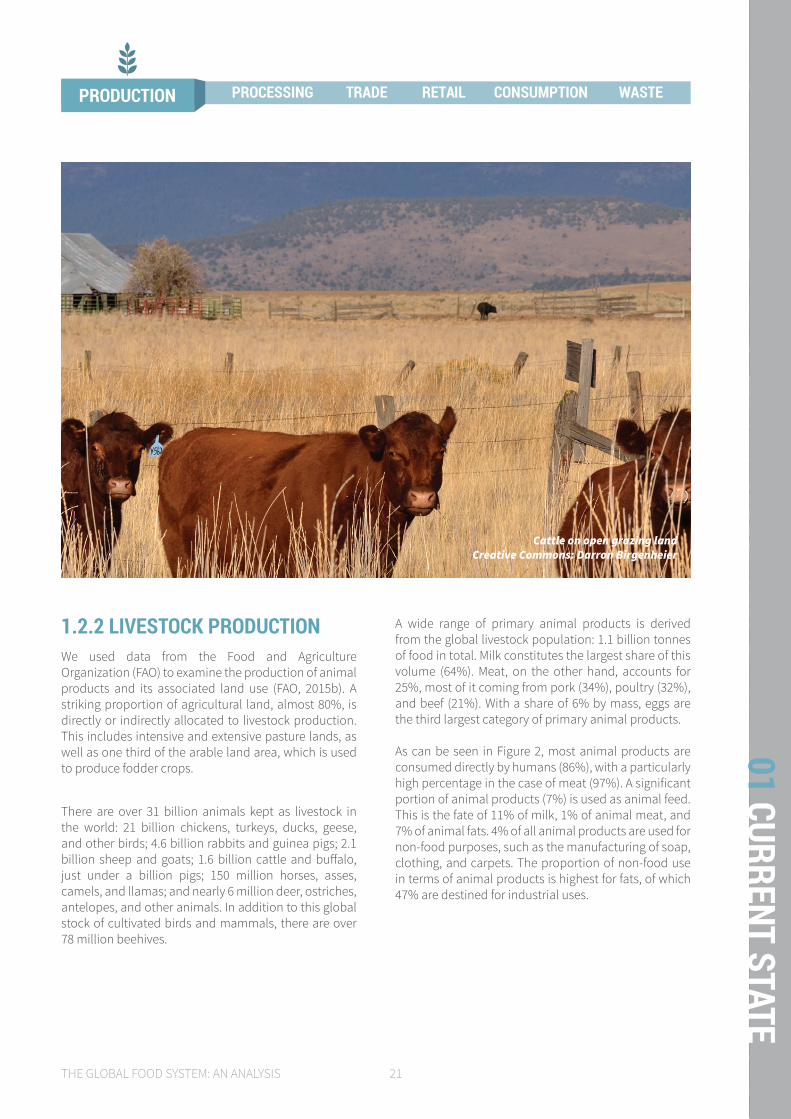
Cattle on open grazing landCreative Commons: Darron Birgenheier
1.2.2 LIVESTOCK PRODUCTIONWe used data from the Food and Agriculture Organization (FAO) to examine the production of animal products and its associated land use (FAO, 2015b). A striking proportion of agricultural land, almost 80%, is directly or indirectly allocated to livestock production. This includes intensive and extensive pasture lands, as well as one third of the arable land area, which is used to produce fodder crops.
There are over 31 billion animals kept as livestock in the world: 21 billion chickens, turkeys, ducks, geese, and other birds; 4.6 billion rabbits and guinea pigs; 2.1 billion sheep and goats; 1.6 billion cattle and buffalo, just under a billion pigs; 150 million horses, asses, camels, and llamas; and nearly 6 million deer, ostriches, antelopes, and other animals. In addition to this global stock of cultivated birds and mammals, there are over 78 million beehives.
A wide range of primary animal products is derived from the global livestock population: 1.1 billion tonnes of food in total. Milk constitutes the largest share of this volume (64%). Meat, on the other hand, accounts for 25%, most of it coming from pork (34%), poultry (32%), and beef (21%). With a share of 6% by mass, eggs are the third largest category of primary animal products.
As can be seen in Figure 2, most animal products are consumed directly by humans (86%), with a particularly high percentage in the case of meat (97%). A significant portion of animal products (7%) is used as animal feed. This is the fate of 11% of milk, 1% of animal meat, and 7% of animal fats. 4% of all animal products are used for non-food purposes, such as the manufacturing of soap, clothing, and carpets. The proportion of non-food use in terms of animal products is highest for fats, of which 47% are destined for industrial uses.
PRODUCTION PROCESSING TRADE RETAIL CONSUMPTION WASTE

22
1.2.3 FISHERIES AND AQUACULTURE PRODUCTIONFish provide 4.3 billion people with around 15 percent of their animal protein intake (FAO, 2014b). Fishing from wild populations is the remaining form of large-scale hunting within the food system. Aquaculture, by contrast, is a form of farming: the rearing of fish and other aquatic organisms within enclosures. As such, these sectors are highly distinct, though because they produce many common products and aquaculture relies in part on wild fish as feed, they are linked in economic terms.
The global fisheries and aquaculture sectors produced over 176 million tonnes of seafood in 2011. Most of this consisted of finfish (67.8%) with a smaller fraction attributable to crustaceans and mollusks (19.8%) and algae (12.4%).
Other forms of seafood constituted 13% by mass the total of animal products in 2011 (FAO, 2015a). It is important to note that the official figures from the FAO only reflect data on monitored fish stocks. Rough estimates indicate that unmonitored (IUU) fishing lands an additional 11 – 26 million tonnes of fish each year, representing 12 – 28.5% of global capture fisheries production (FAO 2014b). The global fisheries sector has and continues to be heavily influenced by subsidies that encourage overfishing, mostly in developed countries. This has led to the expansion of the global fishing fleet to a size 2 – 3 times larger than wild fisheries can sustainably support (Sumaila et. al, 2010, 2013; Nelleman et al, 2008). This continuous structural support of overfishing has led to the progressive decimation of global wild fish stocks since the 1950s (FAO, 2014b).
With 90% of wild fish stocks fully- or over-exploited (FAO, 2014b), the aquaculture sector has been expanding rapidly
Catfish ponds in LouisianaCreative Commons: US Department of Agriculture
PRODUCTION PROCESSING TRADE RETAIL CONSUMPTION WASTE

THE GLOBAL FOOD SYSTEM: AN ANALYSIS 23
01 CURRENT STATE
to keep pace with global seafood demand. Trends in aquaculture production continue showing growth while capture fisheries reached a peak in output in the 1990s and have since modestly declined. With an average annual growth rate of 6.2% between 2000-2012, global aquaculture has more than doubled since the start of the millennium, and is positioned to become the dominant form of seafood production in the near future (FAO, 2014b; Steffen et al., 2015).
Despite aquaculture’s rapid expansion, capture fisheries still dominated the sector in 2011, when over half of the total production of seafood took place via extractive production methods rather than aquaculture. This fraction remains particularly high for finfish, of which over two thirds are supplied by capture fisheries (FAO, 2015b).
FISHERIES
With more than a third of global catches in seafood and algae, the Atlantic Ocean provides the largest share of seafood for wild capture fisheries (FAO, 2015a). The Pacific and Indian Oceans come next, each contributing 17% of the total mass of captured seafood. Inland fisheries provided 17% of global captures, but this number obscures the fact that inland fisheries are almost entirely dedicated to finfish capture (94%) with a relatively minor fraction of crustacean, mollusk, and algae production. In fact, almost one fourth of the total mass of all annual finfish production can be attributed to inland captures whereas for other seafood and algae only a minor share (2.7% and 1.1% of total capture respectively) takes place in inland waters. Globally, the most important species, by tonnage caught, is the anchoveta or Peruvian anchovy (which is used almost exclusively for the production of animal and fish feed rather than for human consumption), followed by Alaskan pollock (FAO, 2014b, 2015b).
AQUACULTURE
Aquaculture is the practice of farming fish or other aquatic organisms in enclosures in rivers, lakes, at sea, or in tanks. It can be done in fresh, brackish, or saltwater. There are at least 567 species produced in aquaculture systems; besides finfish such as carp, other products include crustaceans, like shrimp and crab; mollusks like octopus, shellfish, and snails; other invertebrates, like sea cucumbers; amphibians and reptiles, like east Asian bullfrogs and crocodiles (FAO, 2014b). For some species, hatchery and nursery techniques have been developed, but many other production techniques still depend on wild seed and juveniles.
Although not as commonly discussed as animal production, aquatic plants, like the water caltrop and edible lotus, and algae, like the Japanese kelp and the micro-algae Spirulina, are also produced in aquaculture systems. These are commonly used as fish feed (Hasan & Chakrabarti, 2009), or for the extraction of food additives (Maqsood, Benjakul, & Shahidi, 2013). Overall, the most important aquaculture species produced by tonnage is the grass carp, while the whiteleg shrimp is the most significant in terms of economic value (FAO, 2014b).
Crustaceans, mollusks, and algae are already primarily produced through aquaculture. The total area of water and land surface dedicated to aquaculture production systems is not globally documented. Most production takes place in marine waters (36%) or brackish waters (35%) such as coastal zones or estuaries. The remainder of aquaculture production is located in fresh water bodies such as lakes and rivers. Freshwater aquaculture is dominated by the farming of finfish (88%) whereas the majority of production in brackish waters (83%) and marine waters (54%) is used for the production of crustaceans and mollusks (FAO, 2015b).
Aquaculture’s rapid growth initially led to several adverse environmental impacts, but these effects have since been reduced; for example, by slowing conversion of mangroves to shrimp ponds and through reduced reliance on wild-caught fish as feed (Paul & Vogl, 2011). However, given the growth of the aquaculture sector, its associated impacts are at risk of increasing. In addition to the ongoing demand for wild caught fish for feed production, many problems have been associated with poor management, lack of capacity and access to technical knowledge, and irresponsible practices (FAO, 2013).
FOOD VS. FEED
Although the majority of primary production from fisheries and aquaculture (81%) is directly consumed as food by humans, a significant portion is used as animal feed in aquaculture or livestock production (13% of the global total). The share of production dedicated to feed is particularly high for finfish, of which 19% of the mass ends up as feed. A majority of Peruvian anchovy, the most-landed species by mass, is destined for use as feed. Around 7% of fisheries production is used for non-food-related purposes. For example, 40% of algae is used for industrial purposes, such as the extraction of chemical substances and energy generation (OECD-FAO, 2015).
PRODUCTION PROCESSING TRADE RETAIL CONSUMPTION WASTE
24
Animals
FODDERPRODUCTION
1.0 billion tonnes
ANIMALS
FOOD
OTHER USES
CEREALPRODUCTION
2.34 billion tonnes
SUGAR CROPSPRODUCTION
2.08 billion tonnesOIL CAKES
SUGAR
ALCOHOL
VEGETABLEOILS
OIL CROPSPRODUCTION
549 million tonnes
STARCHY ROOTSPRODUCTION
1.5 million tonnes
WASTE
FIBRES32.2 million tonnes
PULSES68 million tonnes
FRUITS631 million tonnes
OTHER61 million tonnes
VEGETABLESPRODUCTION1 billion tonnes
FEED23 million
tonnes
FISH119.4 million
tonnes
CRUSTACEANS& MOLLUSCS
35 milliontonnes
ALGAE21.8 million
tonnes
OTHER3.5 million
tonnes
MEAT296 million
tonnes
MILK798 million
tonnes
EGGS70,4 million
tonnes
FATS 22,7 million
tonnes
OTHER 5 million
tonnes
PACIFICOCEAN
ATLANTICOCEAN
INDIANOCEAN
ARCTICOCEAN
SOUTHERNOCEAN AQUACULTURE *
PERMANENTPASTURE
3.3 billion ha
ARABLE LAND1.5 billion ha
4.69 milliontonnes
854 milliontonnes
500 milliontonnes
1.0 billiontonnes
PROCESSING
The total volume of processed animal products is not clear,and has not been included in this overview
* The total area used for global aquaculture is not clear, and has not been included in this overview
LIVESTOCK PRODUCTION (tonnes)
PRIMARY PRODUCTION(tonnes)
LAND USE (hectares)

THE GLOBAL FOOD SYSTEM: AN ANALYSIS 25
01 CURRENT STATE
Animals
FODDERPRODUCTION
1.0 billion tonnes
ANIMALS
FOOD
OTHER USES
CEREALPRODUCTION
2.34 billion tonnes
SUGAR CROPSPRODUCTION
2.08 billion tonnesOIL CAKES
SUGAR
ALCOHOL
VEGETABLEOILS
OIL CROPSPRODUCTION
549 million tonnes
STARCHY ROOTSPRODUCTION
1.5 million tonnes
WASTE
FIBRES32.2 million tonnes
PULSES68 million tonnes
FRUITS631 million tonnes
OTHER61 million tonnes
VEGETABLESPRODUCTION1 billion tonnes
FEED23 million
tonnes
FISH119.4 million
tonnes
CRUSTACEANS& MOLLUSCS
35 milliontonnes
ALGAE21.8 million
tonnes
OTHER3.5 million
tonnes
MEAT296 million
tonnes
MILK798 million
tonnes
EGGS70,4 million
tonnes
FATS 22,7 million
tonnes
OTHER 5 million
tonnes
PACIFICOCEAN
ATLANTICOCEAN
INDIANOCEAN
ARCTICOCEAN
SOUTHERNOCEAN AQUACULTURE *
PERMANENTPASTURE
3.3 billion ha
ARABLE LAND1.5 billion ha
4.69 milliontonnes
854 milliontonnes
500 milliontonnes
1.0 billiontonnes
PROCESSING
The total volume of processed animal products is not clear,and has not been included in this overview
* The total area used for global aquaculture is not clear, and has not been included in this overview
LIVESTOCK PRODUCTION (tonnes)
PRIMARY PRODUCTION(tonnes)
LAND USE (hectares) TOTAL GLOBAL FOOD PRODUCTION
Figure 3. This sankey diagram shows the allocation of land and oceanic resources into various types of crop, livestock, and seafood
production for the year 2011. The second column of the diagram shows the mass of production of each crop, indicating the large
variability in production per hectare for the different crop classes presented here. The diagram also shows the production of fisheries
products and livestock.(FAO, 2015b; FAO, 2006)

26
1.2.4 REGIONAL DIVISIONFood production is not evenly distributed around the world; there are large differences between regions regarding both the quantity and the type of food that is domestically produced. The specialization of regions with regards to food production is one of the drivers behind both inter-regional trade as well as different consumption patterns across the globe. In this section, we discuss the geography of food production in more detail. The results presented here are based upon an analysis of data on production quantities as assembled by the FAO (FAO, 2015b).
THE DISTRIBUTION OF FOOD PRODUCTION
As shown in Figure 4, the United States, China, India, Brazil, and Russia are the world’s most significant food-producing countries in terms of quantity; together they produce over half of the world’s food supply. On the other hand, countries in Africa, the Middle East, and Oceania are together responsible for a mere 10% of global production. East Asia is the world’s most productive region, accounting for 20% of global food production, followed by Latin America and Europe (including Russia and Turkey), which contribute 19% and 17%, respectively.
These numbers mean little on their own. It is more interesting to compare total domestic food production with the population of the regions in which that production is taking place. Although food availability is only a small piece of the puzzle when it comes to ensuring food security for a region’s population, it does provide a crude indication
of the extent to which domestic production is sufficient to guarantee food availability (FAO, IFAD, & WFP, 2015). Measuring food production on a per capita basis reveals a very different geography of production, as seen in Figure 5. While Oceania has an annual primary production of nearly 15 tonnes per person, which is over 8 times the world average, Sub-Saharan Africa’s production stands at barely 0.8 tonnes per person. The U.S. and Canada, Europe, and Latin America are all at above world average levels, while all five Asian and African regions are under the world average of 1.7 tonnes per person (FAO, 2015b).
REGIONAL SPECIALIZATION
Countries and regions have specialized in the production of certain food types for a number of reasons varying from the regional climate and soil conditions to historically determined path-dependencies, cultural preferences, and economic factors. The data presented in this section are all based on an analysis of the FAO’s 2011 production statistics.In the United States and Canada, fodder crops constitute almost 50% of primary production. Together with cereals and oil crops, these three food categories account for 80% of this region’s output.
In Latin America and the Caribbean, sugar and oil crops dominate agricultural production. The region is also the leader in the production of stimulants and takes second place, after East Asia, in the production of fruits.
Europe produces a large share of the world’s primary animal products. The region accounts for nearly a third of the world’s milk output, more than any other region, and
NO DATA
4 MILLION TONS
350 MILLION TONS
700 MILLION TONS
1 BILLION TONS
1.5 BILLION TONS
1.75 BILLION TONSNO DATA
4 MILLION TONS
350 MILLION TONS
700 MILLION TONS
1 BILLION TONS
1.5 BILLION TONS
1.75 BILLION TONS
Figure 4. Regional distribution of crops, livestock, and seafood production in total tonnes per country. (FAO, 2015b)
PRODUCTION PROCESSING TRADE RETAIL CONSUMPTION WASTE

THE GLOBAL FOOD SYSTEM: AN ANALYSIS 27
01 CURRENT STATE
a fifth of global meat production, second only to East Asia.
East Asia is a major and diversified food-producing region, leading in the production of vegetables (with more than half of the world’s output) as well as fruits, nuts, meat, eggs, honey, meat, fish, mollusks and crustaceans, and algae. Meat production is focused on swine and poultry and production of dairy is minimal.
The Middle East and North Africa, a region with low availability of arable land per capita, concentrates much of its production on vegetables; crops with high added value. However, it also has considerable production of cereal and fodder crops.
Sub-Saharan Africa is unique in relying on roots and tubers as its primary staple crops instead of cereals. This region produces only 5% of the world’s food supply, but it is the leader in production of roots and tubers; 30% of the global production of these crops occurs here. Secondly, Africa has very high production of pulses, nuts, and stimulants, taking second place in the production of all of these food categories.
Southeast Asia is second in fish and seafood production. Together with East Asia, these two regions account for 63% of all fish and seafood production. Southeast Asia’s crop production is concentrated on cereals and sugar crops. This region also has the highest production proportion of both oil crops and stimulants. The region of Central and South Asia dominates the production of spices, accounting for over half of the global total. This is also where animal products form the highest share
of regional production (14%) though in this region they consist almost entirely of dairy products.
Oceania has the highest per capita food production in the world, though fodder crops represent over 70% of the region’s primary output. Its share in total primary animal production (3%) is more than twice its share in global food production, indicating a high degree of specialization. Cereals have the lowest proportion of regional production here, at just 9%. Surprisingly, considering its access to coastal waters and fisheries, the region accounts for only 1% of the world’s fish and seafood production.
THE EFFICIENCY OF PRODUCTION
The efficiency with which crops and livestock are produced is one of the key factors in explaining regional differences in the quantity of food that is produced. In terms of production per arable land area, the most efficient region is Latin America, with a yield of almost 12 tonnes per hectare, or 1.5 times the world average. Sub-Saharan Africa, meanwhile, has a yield about three times smaller than the global average. Almost directly mirroring the pattern of global production per capita, the U.S. & Canada, Europe, and Oceania also all exhibit a greater yield than the world average, while Central and South Asia, Southeast Asia, the Middle East and North Africa, and Sub-Saharan Africa are all below it. The one major exception is East Asia, which has relatively limited per capita availability of arable land, but manages to achieve the second most efficient average yield in the world (FAO, 2015b).
NO DATA
0.03 MTONS PER CAP.
3.5 MTONS PER CAP.
7.0 MTONS PER CAP.
10 MTONS PER CAP.
14 MTONS PER CAP.
18 MTONS PER CAP.NO DATA
0.03 MTONS PER CAP.
3.5 MTONS PER CAP.
7.0 MTONS PER CAP.
10 MTONS PER CAP.
14 MTONS PER CAP.
18 MTONS PER CAP.
Figure 5. Regional distribution of crop, livestock, and seafood production in total volume per capita (FAO, 2015b)
PRODUCTION PROCESSING TRADE RETAIL CONSUMPTION WASTE

28
1.2.5 AGRICULTURAL INPUTSToday’s level of food production relies on vast, continuous supplies of agricultural inputs including water, land, fertiliser, pesticides, labour, and capital. Agriculture is particularly water-intensive relative to all other economic activities. The FAO estimates that agriculture was responsible for 69% of global fresh water withdrawals in 2007 (Aquastat, 2014). Contemporary production methods also require significant inputs of fertiliser and pesticides. The graphics on these pages depict the estimated annual demands of fresh water, fertilser, and pesticides by the agricultural sector.
WATERAgricultural production uses 7.4 trillion cubic meters of water annually based on estimates of the Water Footprint Network (Mekonnen & Hoekstra, 2011). Oil crops, on average globally, consume more water per tonne than cereal crops. Similarly, meat and animal products are very water-intensive. Beef, in particular, consumes more water per tonne than any major category of food with a global average of about 15,000 m3 per tonne (Mekonnen & Hoekstra, 2012). Spices and stimulants are also very water-intensive per tonne, but do not represent a large portion of agricultural water consumption due to their relatively low volume of production.
The outer ring of the large graph depicted in Figure 6, shows direct water consumption per food product category, while the inner ring shows indirect water consumption divided into two overarching categories: animal products and crops. One third of all crops produced are used as animal feed. The water used for the production of these crops is therefore allocated to the production of animals as embodied or indirect water consumption. Combining both the direct and indirect water consumption of animals, we see that animal products are responsible for almost 30% of agricultural water consumption, despite representing only 11% of global agricultural production in kilograms (FAO, 2015b). This demonstrates the variability in water resource intensity between crops and animal-based products.
While the graphic does not reveal water sources, understanding the water demands of different crops reveals their relative input intensity. Gaining more insight into the origin of the water used for crop production is critical to understanding the potential impacts associated with specific crops. Date palms and cotton, for example, receive a low proportion of their water from rainfall relative to other crops, relying on irrigation instead. Areas of India, Pakistan, and Bangladesh near the Ganges and Indus rivers, eastern China, and the Mississippi river have particularly high water footprints (Mekonnen & Hoekstra, 2012). The impacts associated with agricultural water use are discussed further in section 3.1.3.
Water consumption is not limited to agricultural production, but is a vital resource throughout the life cycle of food products, especially in food processing. It is therefore important to note that this graphic only depicts water consumption through the production phase of raw commodities.
FERTILIZERSThe global food system uses around 200 million tonnes of fertilisers annually, the vast majority of which are synthetic and derived from fossil fuels (FAO, 2015b). Figure 6 shows that, following the pattern of water consumption per crop, cereals also dominate fertiliser consumption at 71% of the global total. Fodder consumes the second highest amount of fertiliser at 15%. Nuts, which represent only 0.2% of global production mass, consume nearly 3% of global fertiliser. Fertiliser is applied on a per-hectare basis, making total fertiliser consumption per mass of food output highly dependent on crop yields. Sugar crops use 2% of global land, representing 21% of global production mass, yet account for only 0.7% of global fertiliser use (though it is important to note that these figures are distorted due to the fact that sugar harvests are measured pre-processing, which includes all of the harvested inedible, cellulosic fractions). Finally it is important to note that fertiliser use varies greatly across different production systems for the same type of crop, demonstrating the high impact variability between different agricultural practices (as further discussed in section 1.2.7).
PESTICIDES“Pesticide” is an umbrella term describing any form of chemical control of unwanted biological agents, including, but not limited to, rodents, insects, weeds, and pathogens. Pesticides, for the purposes of this report, refer to herbicides, fungicides, and insecticides. Herbicides control the growth of unwanted plants, often called weeds. Fungicides control the growth of fungal pathogens on plants. Insecticides are used to control the presence of insect pests, and are generally applied either as a seed dressing or topically in prevention or response to a pest incident (Eurostat, 2000). In our assessment, we do not include pesticides that are expressed in plant tissue, as is the case with certain Genetically Modified Organisms. Globally, the food system used an estimated 4.4 million tonnes of pesticides in 2011 (FAO, 2015b). Figure 6 shows that cereals and fruits consume the largest share of pesticides. Vegetables, stimulants, roots and tubers, and oil crops each consume around 9% of global pesticides. Although not evident from this graph, total pesticide consumption is the product of both application rates (kg of pesticide per hectare) and total hectares of each crop type. Cereals’ large share of total pesticide consumption is due to their share of total land use, while the large portion of pesticides used in the production of fruits can be attributed to their high pesticide demand per hectare (Eurostat, 2000).
PRODUCTION PROCESSING TRADE RETAIL CONSUMPTION WASTE

THE GLOBAL FOOD SYSTEM: AN ANALYSIS 29
01 CURRENT STATE
DIRECT WATER CONSUMPTION
PESTICIDES4.4 M TONS
FERTILIZERS200 M TONS
71.2%
14.6
%
4.6%
27%3%
27%
9%9%
9%
9%3%
2%
41.4%
3.3%
13.9%
3.0%1.5%
3.7%
6.6%
4.4%
2.9%
3.1%
3.1%
2.7%
12.3%
8.8%
WATER7.4 TRILLION M3
INDIRECT WATER CONSUMPTION
CEREA
LRO
OTSO
IL CR
OPS
PULS
ES
NU
TS
VEG
ETAB
LES
FRU
ITS
SUG
AR C
ROPS
STIMU
LANTS
SPICES
FIBERS, TOBACCO
& RU
BBER
FOD
DER
DAIRY
EGGS
MEAT
CROPS -
70.1
%
ANIM
AL P
RODUCTS
- 29.9%
CROPS
ANIMAL PRODUCTS
DIRECT WATER CONSUMPTION
PESTICIDES4.4 M TONS
FERTILIZERS200 M TONS
71.2%
14.6
%
4.6%
27%3%
27%
9%9%
9%
9%3%
2%
41.4%
3.3%
13.9%
3.0%1.5%
3.7%
6.6%
4.4%
2.9%
3.1%
3.1%
2.7%
12.3%
8.8%
WATER7.4 TRILLION M3
INDIRECT WATER CONSUMPTION
CEREA
LRO
OTSO
IL CR
OPS
PULS
ES
NU
TS
VEG
ETAB
LES
FRU
ITS
SUG
AR C
ROPS
STIMU
LANTS
SPICES
FIBERS, TOBACCO
& RUBBER
FOD
DER
DAIRY
EGGS
MEAT
CROPS -
70.1
%
ANIM
AL P
RODUCTS
- 29.9%
CROPS
ANIMAL PRODUCTS
DIRECT WATER CONSUMPTION
PESTICIDES4.4 M TONS
FERTILIZERS200 M TONS
71.2%
14.6
%
4.6%
27%3%
27%
9%9%
9%
9%3%
2%
41.4%
3.3%
13.9%
3.0%1.5%
3.7%
6.6%
4.4%
2.9%
3.1%
3.1%
2.7%
12.3%
8.8%
WATER7.4 TRILLION M3
INDIRECT WATER CONSUMPTION
CEREA
LRO
OTSO
IL CR
OPS
PULS
ES
NU
TS
VEG
ETAB
LES
FRU
ITS
SUG
AR C
ROPS
STIMU
LANTS
SPICES
FIBERS, TOBACCO
& RU
BBER
FOD
DER
DAIRY
EGGS
MEAT
CROPS -
70.1
%
ANIM
AL P
RODUCTS
- 29.9%
CROPS
ANIMAL PRODUCTS
Figure 6: Pesticide, fertilizer, and water inputs per major food type.(FAO, 2015b; Mekonnen & Hoekstra, 2011)
PESTICIDE, WATER, AND FERTILIZER USE PER FOOD CATEGORY
PRODUCTION PROCESSING TRADE RETAIL CONSUMPTION WASTE

30
1.2.6 LABOURThough it is difficult to accurately measure, more than 2 billion people are estimated to work within the global food system by the International Labour Organization (ILO, 2007). Of these individuals, roughly 1.3 billion, or 50% of the global workforce, is thought to work in agriculture (UNCTAD, 2013b). Of all farms, the overwhelming majority (95%) are family farms managing fewer than 5 hectares of land (FAO, 2014a). However the definition of “small-scale farms” varies depending on the geographical location, ranging from less than 1 hectare to 10. In Africa and Asia small scale farms predominate with an average size of 1.7 hectares (UNCTAD, 2013b). Farms below 10 hectares managed by pastoralists, forest keepers, and small farmers represent 80% of the total
farmland in Sub-Saharan Africa and Asia and IFAD estimates that they produce 80% of food consumed in these regions (IFAD, 2010).
Because most small-scale farmers live in poor, rural areas, children are often required to work on family farms to provide essential labour. According to the International Labour Organization, 60% of all child labourers globally work in agriculture, representing 0.5% of the world’s child population (ILO, 2015). It is important to note that not all participation of children in productive activities is considered child labour. There are appropriate activities that can benefit both children and their families that do not expose them to hazards or detract from their schooling. However, in most instances, child labour is directly
A woman manually works the field. Creative Commons: 2DU Kenya 86
PRODUCTION PROCESSING TRADE RETAIL CONSUMPTION WASTE
THE GLOBAL FOOD SYSTEM: AN ANALYSIS 31
01 CURRENT STATE
correlated with a lack of access to, or poor quality of education as well as structural poverty within the family and region (ILO, 2015).
The incidence of poverty among small and medium scale farmers is very high. The largest segments of the world’s poor are women, children, and men who live in rural environments, most of whom fall in this category (UNCTAD, 2013a). Poverty among farmers is not a problem limited to the developing world; across all regions globally, farmers are the lowest income earners in the food system. For example, nearly 30% of all U.S. farm workers had family incomes that placed them below the national poverty line (National Farm Worker Ministry, 2015).
In addition to farming, it is estimated that 58.3 million people were worked in the fisheries and aquaculture sectors in 2012, which is approximately 2% of the global workforce (FAO, 2014b). Taken together, Asian countries make up 97% of global fisheries activities. For aquaculture specifically, East Asia, including India, accounts for 92% globally, of which China represents 61% (FAO, 2014b). Fishermen (those not working in aquaculture) are numbered at approximately 28 million. Roughly 84% of fishermen work in Asia, with China being the most dominant labour market. For these people, fisheries are a vital means to provide income and livelihoods.
Just as subsistence farming is the dominant economic model for a majority of the world’s farmers (smallholders), subsistence fishing is common for most of the world’s fishermen. Forced and child labour is similarly prevalent in fishing and aquaculture as it is in farming, often for similar reasons, such as filling crucial labour gaps for families (FAO & ILO, 2011). While precise figures on child labour in fisheries and aquaculture are scarce, case specific evidence suggests that its rate of occurrence could be high (ILO, 2013). Forced labour in the fisheries and aquaculture sectors mostly involves migrants, temporary, or illegal crew members.
Next only to farmers, fisheries workers are the lowest income earners compared with others employed in the food system. While it is difficult to account for different poverty thresholds in each country, it is clear that most people employed in food production (farmers and fishers) are in close proximity to, or below, the poverty threshold.
The number of labourers in the food and drink manufacturing industry is significantly lower than in primary production. The ILO estimates that there are over 22 million people are employed globally in the food and drink manufacturing sector (ILO, 2007). In the U.S. alone the food processing industry provides 1.5 million people with employment (United States Bureau of Labour Statistics, 2011). Interestingly, individuals working in different steps of the food chain such as in transportation, wholesale, and processing tend to earn more than those in food production (for an example in the coffee chain, see Beshah, Kitaw, & Dejene, 2015).
PRODUCTION PROCESSING TRADE RETAIL CONSUMPTION WASTE

32
1.2.7 PRODUCTION PRACTICESThere is enormous variability in global agricultural production and wild extraction systems. The type of practice selected is one of the main determinants of resource demand and yield, and by extension, environmental impact. Getting fine-grained insight into why certain practices are more productive or less impactful than others, and how these features may vary across geographic regions, is essential to understanding what is happening in this critical part of the food system and informing appropriate policy decisions for how to steer it.
This section presents a high-level overview of the different production practices that are commonly used in crop cultivation, livestock production, and fisheries and aquaculture production. This information, once connected
with contextual geographic data and detailed studies on each type of practice, can inform the construction of scenarios for evaluating future pathways for the food system.
CROP PRODUCTION CATEGORIESThere is no generic classification system for crop production categories, though a number of farm classification schemes have been proposed and used for data surveying or mapping of agricultural areas. These farm classifications have often focused on geographic or economic parameters like local climate zones, presence or absence of irrigation, or degree of farm commercialization (Robinson et al., 2011).
Our primary interest in categorizing production typologies here, however, is to review the variety of techniques and production philosophies that can be implemented by any
PERENNIAL(PERMANENT CROPS)
ANNUAL
SOIL-BASED *
SOIL-LESS
* CROPS ONLY OR MIXED FARMING(CROPS & LIVESTOCK)
CONTINUOUSCROPPING
RATOONCROPPING
WATERMANAGEMENT
PHILOSOPHIES& APPROACH PRACTICES
MULTIPLECROPPING
(POLYCROPPING)
RELAYCROPPING
OVERLAPPINGCROPPING
INTERCROPPING
RELAYCROPPING
CONTINUOUSCROPPING
RAINFED
IRRIGATED
CONVENTIONAL
GENETICALLYMODIFIED
ORGANIC
INTEGRATED
PERMACULTURE
NO-TILL
CROPROTATION
RESIDUERETENTION
INTEGRATEDPEST MGMT.
COVERCROPPING
OVERLAPPINGCROPPING
INTERCROPPING
MONOCULTURE/MONOCROPPING
MONOCULTURE/MONOCROPPING
POLYCULTURE
POLYCULTURE
HI-TECHINDOOR
HYDROPONICS
AQUAPONICS
AEROPONICS
GREENHOUSE(PROTECTED SYSTEMS)
GROWINGPRACTICES
CROPTYPES
CROP PRODUCTION SYSTEMS, TECHNIQUES, AND PHILOSOPHIES
PRODUCTION PROCESSING TRADE RETAIL CONSUMPTION WASTE

THE GLOBAL FOOD SYSTEM: AN ANALYSIS 33
01 CURRENT STATE
crop-producing farmer in any geographical region, which have central influence over environmental impact and productivity. Figure 7 presents an overview of the different production techniques and practices under discussion. Reading the diagram from left to right allows the creation of a pathway that combines several types of crop production philosophies and practices. There are many layered combinations possible among the practices listed, with only certain categories that are incompatible with one another.
In recent decades, a distinction has been made between conventional agricultural techniques and variously called “sustainable” or “aspirational” agricultural practices. In practice, these are descriptive rather than rigorous terms due to the many possible combinations of techniques they can both encompass. For example, it is quite common to have large-scale organic monocultures, which may or may
not implement aspects of conservation agriculture (Goodman, 2000). Likewise, cropping systems can use a combination of Genetically Modified Organisms and typical conservation practices like crop rotation and no-till farming. Many combinations of practices, from what might seem like contradictory philosophies, are possible.
Perennial vs. Annual CropsOne of the first distinctions between cropping systems is made between perennial (also called permanent) and annual crops. Perennial plants, like fruit trees, berry bushes, and woody vines, live for many years and invest in intensive root and vascular structures before reaching productive maturity. Depending on the type of plant, reaching this stage can take from two years to over a decade. Properly managed perennial cropping systems can enhance soil quality and biodiversity, since these production systems are not annually disturbed
and re-planted. Annual crops on the other hand, grow from seed each year, going through a full annual life cycle of flowering, fruiting, and dying. The vast majority of agricultural crops are annual species, requiring a yearly cycle of replanting (cereals, most vegetables, oil crops, etc.).
Perennial crops have been shown to reduce energy use, erosion and nitrogen loss rates to less than 5% compared to annual crops (Gantzer, Anderson, Thompson, & Brown, 1990). However there are currently no domesticated perennial varieties for grains, legumes, or oilseeds, which make up 69% of the current production. The reason why perennial varieties were originally not domesticated by farmers is that wild annual varieties produced higher yields per hectare. Cultivating perennial crop types that are equally productive could theoretically be possible, but would require a long time using artificial selection (Cox, Glover, van Tassel, Cox, & De Haan, 2006). Active research is underway to develop perennial cereal varieties in many parts of the world (Batello et al., 2013).
There are however some disadvantages to growing perennials when compared with annual crops. Namely, their permanence has a number of consequences, such as a structural
PERENNIAL(PERMANENT CROPS)
ANNUAL
SOIL-BASED *
SOIL-LESS
* CROPS ONLY OR MIXED FARMING(CROPS & LIVESTOCK)
CONTINUOUSCROPPING
RATOONCROPPING
WATERMANAGEMENT
PHILOSOPHIES& APPROACH PRACTICES
MULTIPLECROPPING
(POLYCROPPING)
RELAYCROPPING
OVERLAPPINGCROPPING
INTERCROPPING
RELAYCROPPING
CONTINUOUSCROPPING
RAINFED
IRRIGATED
CONVENTIONAL
GENETICALLYMODIFIED
ORGANIC
INTEGRATED
PERMACULTURE
NO-TILL
CROPROTATION
RESIDUERETENTION
INTEGRATEDPEST MGMT.
COVERCROPPING
OVERLAPPINGCROPPING
INTERCROPPING
MONOCULTURE/MONOCROPPING
MONOCULTURE/MONOCROPPING
POLYCULTURE
POLYCULTURE
HI-TECHINDOOR
HYDROPONICS
AQUAPONICS
AEROPONICS
GREENHOUSE(PROTECTED SYSTEMS)
GROWINGPRACTICES
CROPTYPES
Figure 7: A classification of different production methods. This is a non-exhaustive list, but covers those which are
most common. (Metabolic)
PRODUCTION PROCESSING TRADE RETAIL CONSUMPTION WASTE
34
water demand that can be difficult to adapt to local rainfall and weather patterns, and the inability to be rotated which increases risk of pest damage.
GROWING PRACTICES
Soil-Based vs. Soil-Less SystemsBecause of their basic biology, perennial crops are generally only grown in soil-based cropping systems, whereas most annuals can also be cultivated using soil-free techniques like hydroponics. There are many varieties of hydroponic systems, which range from deep bed systems where plant roots are directly suspended in water with liquid nutrients, to a variety of systems where species are planted in a soil-less medium (rockwool, coconut fibre, clay pellets, etc.). Aeroponics, another variation, involves applying a fine mist of nutrient solution directly to roots hanging in air without the use of any substrate.
Annual plants grown using soil-free techniques can present significant advantages over traditional soil-based systems. “Closed” recirculating water supplies are commonly cited to save 60 - 90% of water use and 20 – 30% of fertilizer use over outdoor, soil-based cultivation (Jovicich, Cantliffe, Simonne, & Stoffella, 2007). Combining soil-less plant production with fish cultivation in aquaponics systems (a mixed aquaculture and hydroponics system), provides a source of dissolved nutrients to the plants (from fish waste) and recirculates purified water back to the fish in a symbiotic arrangement. This kind of solution addresses both the problems of nutrient run-off from concentrated fish farming as well as the need for nutrient inputs into plant production systems (F. Blidariu & Grozea, 2011). The yields of soil-less cultivation systems are generally much higher than those of soil-based systems due to more precise levels of control for nutrient delivery, oxygenation, pH, and temperature control (Jensen, 1999).
Despite the demonstrated benefits of soil-free cultivation, it is only applied on a small fraction of global agricultural land (on the order of magnitude of 0.0001%) though in some countries, it holds a significant percentage of farm share for certain types of crop production (authors’ estimate, based on figures presented in Peet & Wells, 2005 and FAO, 2015b). For example, hydroponic techniques are used for the majority of tomato and bell pepper cultivation in the Netherlands (Cantliffe & Vansickle, 2009).
The primary reason that soil-free systems are not more broadly applied is that they require a great deal of starting capital and a variety of high-tech inputs (precision management tools and software), not only for the systems themselves, but also for the greenhouses in which they are typically located (Peet & Wells, 2005). For this reason, they are commercially economically viable only for a range
of high-value vegetable crops and primarily implemented in the developed world. An important note regarding soil-free cultivation systems is that they cannot be certified as organic production systems, based on the standards set forth by international certification bodies, since they do not make use of soil, which is the cornerstone of the organic production philosophy (Goodman, 2000).
Soil-less systems also have a number of disadvantages that are worth mentioning. Due to the materials and format of soil-less systems, they are typically quite energy and fossil fuel dependent, and not easily integrated with the environment.
Protected vs. Outdoor CultivationSoil-free cultivation is generally only ever applied in protected cultivation systems: greenhouses or an emerging class of high-tech indoor farms, which often use fully artificial conditions for plant cultivation, including artificial lighting. Greenhouse cultivation can either be soil-based or soil-less, though the productivity of soil-less greenhouse systems is generally higher (Gołaszewski et al., 2012) Protected cultivation systems, which include both glasshouses and plastic greenhouses, were estimated to occupy 1.6 million hectares in 2005, which would translate to 0.001%, of current global arable land use (authors’ calculations based on Peet & Wells, 2005).
Yields in greenhouse systems are generally far higher than in traditional field production systems, partly owing to the fact that they extend the growing season for crops. This allows them to disproportionately contribute to global production relative to their small footprint. Certain varieties of plants, particularly leafy greens and Asian cabbages, can produce up to 12 harvests per year in a greenhouse system as opposed to one or two annual yields in outdoor fields. A single planting of tomatoes can continue to produce for 11 months out of the year in a greenhouse system, effectively boosting the total productivity of a single area of land (Jensen, 1999). This practice at least partially explains the extreme range found in global tomato yields, which spans from an average of approximately 1 tonne per hectare (in Somalia) to 560 tonnes per hectare (in the Netherlands) (FAO, 2015b).
MONOCULTURE VS. POLYCULTUREA further critical distinction in the classification of crop production systems has to do with the number and variety of plants selected for sequential or simultaneous cultivation. There are two broad categories to consider here, though they each have some sub-variations: monoculture and polyculture.
PRODUCTION PROCESSING TRADE RETAIL CONSUMPTION WASTE

THE GLOBAL FOOD SYSTEM: AN ANALYSIS 35
01 CURRENT STATE
MonocultureMonoculture, is the practice of growing a single crop on a large tract of land. It is a hallmark of industrial, conventional agriculture, since it is very well suited to supporting mechanisation and presents large economies of scale (Fitzgerald-Moore & Parai, 1996). Continuous cropping, or mono-cropping, refers to growing a single type of plant species year after year on the same soil (C. E. Murphy & Lemerle, 2006). Strictly speaking, continuous cropping is a term only applied to agricultural production systems that do not implement any form of crop rotation (the practice of growing a winter-season crop on fallow land in order to prevent soil erosion and moisture loss, among other potential benefits). True mono-cropping is less common than is typically made out to be the case in discussions of conventional farming. Even in the United States, which is known for its vast tracts of single-crop agriculture, a significant majority of crops (82 – 94%) is grown with some kind of rotation (corn and soybean being a very common example), though cover cropping, an important conservation agriculture technique, remains uncommon (White, 2014). These rotation systems, however, do not qualify as polycultures under stricter definitions of the term, which generally refer to production systems that grow multiple crops simultaneously on the same plot of land.
Large-scale monocultures are widely reported to result in agricultural problems ranging from depletion of soil fertility due to continuous extraction of the same nutrients, to the intensification of pest problems by providing uninterrupted breeding grounds for specialized pests. Because of their design for large-scale productivity, they typically require very high inputs in terms of both chemicals and energy (for operating machinery, for example) (Olesen & Bindi, 2002).
PolycultureMultiple cropping, also known as poly-cropping or polyculture, involves growing multiple crops on the same plot of land. The intensity and productivity of polyculture systems can range significantly. In general, multiple cropping is associated with stable productivity and on average higher relative yields than are found single crop systems. Certain crop combinations have much higher combined total yields, and can be selected for high productivity (Gliessman, 1985).
Multiple cropping can allow for better pest control through mutualistic interactions, increased microbial activity in the soil, more efficient fertiliser use, better use of time and space with more crops per unit area, pattern disruption for pests, reduction in water evaporation, shared benefits from nitrogen fixation from crops like
Greenhouses using highly efficient LED lightsCreative Commons: US Department of Agriculture, 2014
PRODUCTION PROCESSING TRADE RETAIL CONSUMPTION WASTE

36
legumes. There are also potential disadvantages such as difficulty with mechanisation, competition between plants for nutrients, water, and light; difficulty with incorporating fallow periods; and the possibility of allelopathic interactions between plants (Gliessman, 1985). However, agricultural research is typically focused on maximizing single crop yields, instead of thinking of yields on a long-term diversified basis, which has translated into minimal investment in high-yielding polyculture systems (U.S. Congress Office of Technology Assessment (OTA), 1985).
WATER MANAGEMENT
Irrigated vs. Rainfed AgricultureOn average, irrigated agriculture produces more than twice the yields of rainfed agriculture (Steinfeld, H., Gerber, P., Wassenaar, T., Castel, V., Rosales, M., & De Haan, 2006). However, despite significant bluewater extraction and the doubling of the global irrigated area since the early 1960s (FAO, 2011), rainfed agriculture remains the world’s predominant production system (FAO, 2013) Irrigation is typically associated with large water losses, however new and more efficient irrigation methods such as drip irrigation can reduce water usage considerably; by 15-25% according to one estimate (Mushtaq, Maraseni, & Reardon-Smith, 2013). It is important to emphasize, however, that efficiency
does not necessarily equate to sustainability. Improvements in efficiency do not necessarily lead to sustainable use patterns, as total water withdrawal using efficient methods can still result in a net increase in consumption.
PRODUCTION METHODS AND PHILOSOPHIES
Conventional, Non-Genetically ModifiedDespite the possible variability in applying the term “conventional” agriculture, what is typically meant by this phrase is: outdoor crop cultivation in monoculture systems with high levels of mechanisation and artificial inputs, largely implementing the techniques introduced through the Green Revolution (see Chapter 2). Most conventional agricultural systems use high-yielding varieties that have been bred specifically for large-scale monoculture production, and often have features (like shorter stalks) to facilitate mechanical harvesting, boost yields, and prevent crop spoilage. Generally speaking, conventional agricultural techniques also implement ploughing of soils as a technique for homogenizing and breaking up the top layer of soil prior to planting. This combination of techniques results in a high-input, energy-intensive, soil and biodiversity depleting, low labour and high-yield form of agricultural practice (Matson, Parton, Power, & Swift, 1997).
Monoculture fields in AmericaCreative Commons: Daniel Lobo
PRODUCTION PROCESSING TRADE RETAIL CONSUMPTION WASTE
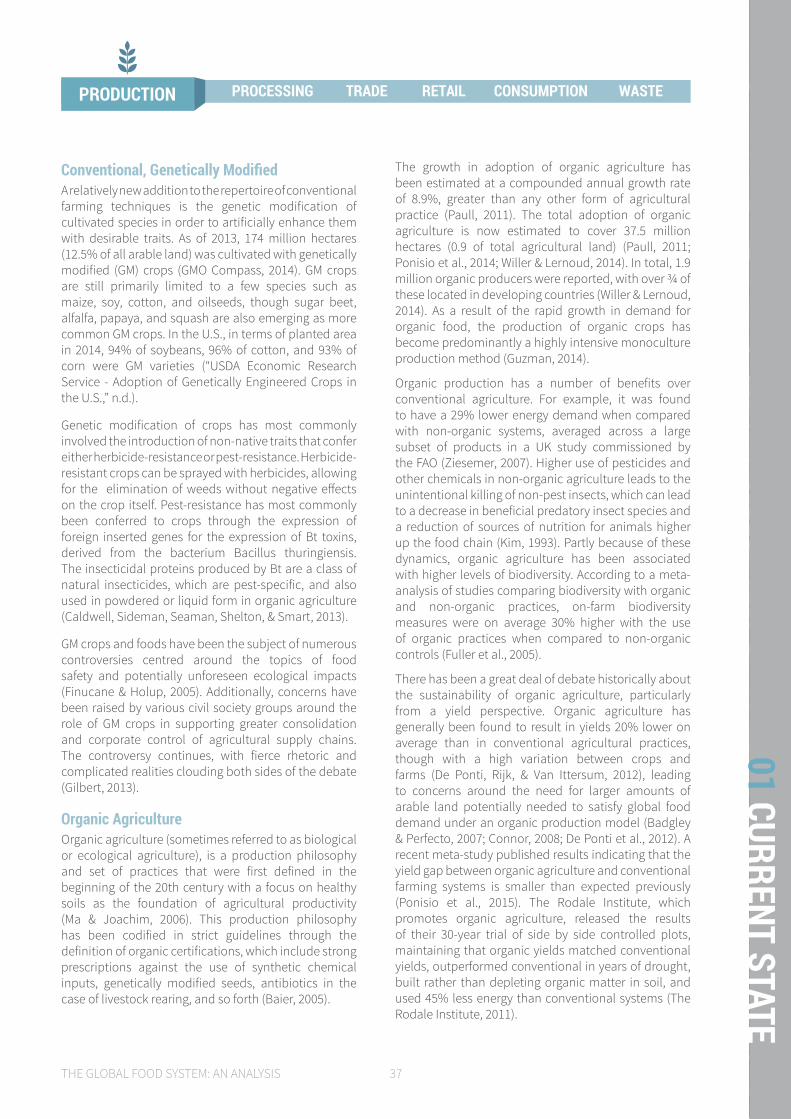
THE GLOBAL FOOD SYSTEM: AN ANALYSIS 37
01 CURRENT STATE
Conventional, Genetically ModifiedA relatively new addition to the repertoire of conventional farming techniques is the genetic modification of cultivated species in order to artificially enhance them with desirable traits. As of 2013, 174 million hectares (12.5% of all arable land) was cultivated with genetically modified (GM) crops (GMO Compass, 2014). GM crops are still primarily limited to a few species such as maize, soy, cotton, and oilseeds, though sugar beet, alfalfa, papaya, and squash are also emerging as more common GM crops. In the U.S., in terms of planted area in 2014, 94% of soybeans, 96% of cotton, and 93% of corn were GM varieties (“USDA Economic Research Service - Adoption of Genetically Engineered Crops in the U.S.,” n.d.).
Genetic modification of crops has most commonly involved the introduction of non-native traits that confer either herbicide-resistance or pest-resistance. Herbicide-resistant crops can be sprayed with herbicides, allowing for the elimination of weeds without negative effects on the crop itself. Pest-resistance has most commonly been conferred to crops through the expression of foreign inserted genes for the expression of Bt toxins, derived from the bacterium Bacillus thuringiensis. The insecticidal proteins produced by Bt are a class of natural insecticides, which are pest-specific, and also used in powdered or liquid form in organic agriculture (Caldwell, Sideman, Seaman, Shelton, & Smart, 2013).
GM crops and foods have been the subject of numerous controversies centred around the topics of food safety and potentially unforeseen ecological impacts (Finucane & Holup, 2005). Additionally, concerns have been raised by various civil society groups around the role of GM crops in supporting greater consolidation and corporate control of agricultural supply chains. The controversy continues, with fierce rhetoric and complicated realities clouding both sides of the debate (Gilbert, 2013).
Organic AgricultureOrganic agriculture (sometimes referred to as biological or ecological agriculture), is a production philosophy and set of practices that were first defined in the beginning of the 20th century with a focus on healthy soils as the foundation of agricultural productivity (Ma & Joachim, 2006). This production philosophy has been codified in strict guidelines through the definition of organic certifications, which include strong prescriptions against the use of synthetic chemical inputs, genetically modified seeds, antibiotics in the case of livestock rearing, and so forth (Baier, 2005).
The growth in adoption of organic agriculture has been estimated at a compounded annual growth rate of 8.9%, greater than any other form of agricultural practice (Paull, 2011). The total adoption of organic agriculture is now estimated to cover 37.5 million hectares (0.9 of total agricultural land) (Paull, 2011; Ponisio et al., 2014; Willer & Lernoud, 2014). In total, 1.9 million organic producers were reported, with over ¾ of these located in developing countries (Willer & Lernoud, 2014). As a result of the rapid growth in demand for organic food, the production of organic crops has become predominantly a highly intensive monoculture production method (Guzman, 2014).
Organic production has a number of benefits over conventional agriculture. For example, it was found to have a 29% lower energy demand when compared with non-organic systems, averaged across a large subset of products in a UK study commissioned by the FAO (Ziesemer, 2007). Higher use of pesticides and other chemicals in non-organic agriculture leads to the unintentional killing of non-pest insects, which can lead to a decrease in beneficial predatory insect species and a reduction of sources of nutrition for animals higher up the food chain (Kim, 1993). Partly because of these dynamics, organic agriculture has been associated with higher levels of biodiversity. According to a meta-analysis of studies comparing biodiversity with organic and non-organic practices, on-farm biodiversity measures were on average 30% higher with the use of organic practices when compared to non-organic controls (Fuller et al., 2005).
There has been a great deal of debate historically about the sustainability of organic agriculture, particularly from a yield perspective. Organic agriculture has generally been found to result in yields 20% lower on average than in conventional agricultural practices, though with a high variation between crops and farms (De Ponti, Rijk, & Van Ittersum, 2012), leading to concerns around the need for larger amounts of arable land potentially needed to satisfy global food demand under an organic production model (Badgley & Perfecto, 2007; Connor, 2008; De Ponti et al., 2012). A recent meta-study published results indicating that the yield gap between organic agriculture and conventional farming systems is smaller than expected previously (Ponisio et al., 2015). The Rodale Institute, which promotes organic agriculture, released the results of their 30-year trial of side by side controlled plots, maintaining that organic yields matched conventional yields, outperformed conventional in years of drought, built rather than depleting organic matter in soil, and used 45% less energy than conventional systems (The Rodale Institute, 2011).
PRODUCTION PROCESSING TRADE RETAIL CONSUMPTION WASTE

38
Many groups have argued that increased research and development funding targeted specifically at organic practices could lead to an elimination of the organic yield gap (Ponisio et al., 2015). Regardless of this assumption, surveying global data makes it clear that a far more dominant cause of low yields is simply less advanced agricultural practice. Organic tomato production in the Netherlands yields 350 tonnes per hectare, while conventional tomato production in otherwise similar conditions ranges from 50 - 120 tonnes per hectare in other parts of Europe (FAO, 2015b; Gołaszewski et al., 2012). This indicates that the yield gap between organic and non-organic forms of production can be much less significant than the yield gap that results simply from lack of knowledge, technique, or sufficient resources.
There are several other agricultural systems which implement some of the same basic principles as organic production as a basis, for instance biodynamic agriculture and permaculture. Within certain contexts, they can be considered variations on organic production (Nesme, Colomb, Hinsinger, & Watson, 2014).
Integrated FarmingIntegrated farming attempts to produce food that is better for the environment taking into consideration a large number of factors. The management practice does not ban or require certain practices or inputs, but attempts to optimize practices depending on a number of conditions analysed using a systemic approach. For example, no-till agriculture may reduce energy use under certain conditions, but increase it if additional crop protection measurements are required in exchange. All of the inputs and effects in the entire system as the result of a change in practice are considered (EISA, 2012).
Studies have shown that though energy use and emissions with integrated farming are higher per hectare than in organic production, they are lower per tonne produced than in organic and conventional agriculture (Tuomisto, Hodge, Riordan, & Macdonald, 2012).
Conservation Agriculture PrinciplesConservation agriculture is a term that encompasses three crop management principles: no-till agriculture, crop rotation, and residue retention. It has gained international support in policy circles as a method of improving long-term soil productivity. Currently around 100 million hectares worldwide apply conservation agriculture principles (Sommer et al., 2012). Anecdotal evidence suggests that herbicide-resistant GM crops have facilitated the adoption of conservation tillage practices due to the increased ease of weed control through herbicide application (Fernandez-
Cornejo, Hallahan, Nehring, Wechsler, & Grube, 2013). Conservation tillage practices have frequently been associated with an increase in herbicide use, because the lack of ploughing allows weeds to become established. Other methods of weed control, such as mulching and cover cropping, can also be applied with conservation tillage practices, removing dependence on chemical weed control (Bullied, Marginet, & Acker, 2010; Moyer, Roman, Lindwall, & Blackshaw, 1994; Sans, Berner, Armengot, & Mäder, 2011).
No-Till No-till farming (also called zero tillage or direct drilling) involves cultivating crops or pasture without using ploughing, thereby maintaining soil ecology, decreasing erosion and compaction, and improving water retention (Holland, 2004). This practice increases soil quality by increasing the amount of infiltrating water and increasing retention of organic matter and nutrient cycling. In addition to reducing soil erosion, it increases new soil formation by promoting the amount and variety of life in the soil, including soil-forming organisms (Martin R. Carter, 1994). In 2014, around 125 million hectares or around 9% of cropland was under no-till cultivation (Pittelkow et al., 2014). In 1999 no-tillage farming was only practiced on around 45 million hectares worldwide. Its adoption grew at a rate of around 6 million hectares per annum between 1999 and 2009. The practice has been widely adopted in all types of climates and on all types of soils (Derpsch, Friedrich, Kassam, & Hongwen, 2010).
Though no-till agriculture provides many benefits for soil and has been largely adopted for this reason, adopting the practice alone may come with drawbacks. Recent findings indicate that, contrary to common beliefs, no-till agriculture generally has been found to have a negative effect on crop yields, of an average of 5.7% in one meta-study, unless applied with other conservation agriculture principles (crop rotation and residue retention), which then narrow the yield gap (Pittelkow et al., 2014). By contrast, under dry and arid conditions, no-till was found to confer a yield benefit regardless of whether it was applied with other techniques. Additionally, no-till practices may initially require a higher need for fertiliser (Frankinet, Roisin, Baumer, & Ehlers, 1989) and pesticides (Soane et al., 2012) in order to maintain yields. If combined with other practices, such as crop rotation and residue retention, the potentially negative effects of conservation tillage can be avoided and benefits strengthened. Regardless of some drawbacks, conservation tillage has been shown to be one of the only agricultural techniques that reduces the rate of soil erosion to within the background geological rate of soil loss and formation (Montgomery, 2007) (see section 3.1.2).
PRODUCTION PROCESSING TRADE RETAIL CONSUMPTION WASTEPRODUCTION PROCESSING TRADE RETAIL CONSUMPTION WASTE

THE GLOBAL FOOD SYSTEM: AN ANALYSIS 39
01 CURRENT STATE
A hillisde agricultural village in UgandaCreative Commons: Rod Waddington, 2015
PRODUCTION PROCESSING TRADE RETAIL CONSUMPTION WASTE
Crop RotationCrop rotation is the second practice within the conservation agriculture portfolio. Methods such as intercropping or crop rotation can increase resistance against pests and disease, as well as increase soil quality, thus reducing the need for expensive inputs. One estimate states that these methods can reduce U.S. pesticide use by 50% without reducing yields (Pimentel & Lehman, 1993). Additionally, polycultures can improve total yields per area by taking advantage of symbiotic relationships (Naeem et al., 2013).
Residue RetentionResidue retention is the third primary component of conservation agriculture. Even when applying no-till agriculture, the removal of crop residues can reduce the fertility of the soil over time. One study showed that organic carbon in the soil was reduced by 75% after 15 years of no-till cropping with residue removal (Chivenge, Murwira, Giller, Mapfumo, & Six, 2007). Several studies have suggested that in addition to improving soil fertility, the combination of residue retention with other conservation agricultural practices leads to an increase in the amount of water available to plants through increased infiltration, reduced runoff and reduced evaporation (Sommer et al., 2012).
PRODUCTION PROCESSING TRADE RETAIL CONSUMPTION WASTE
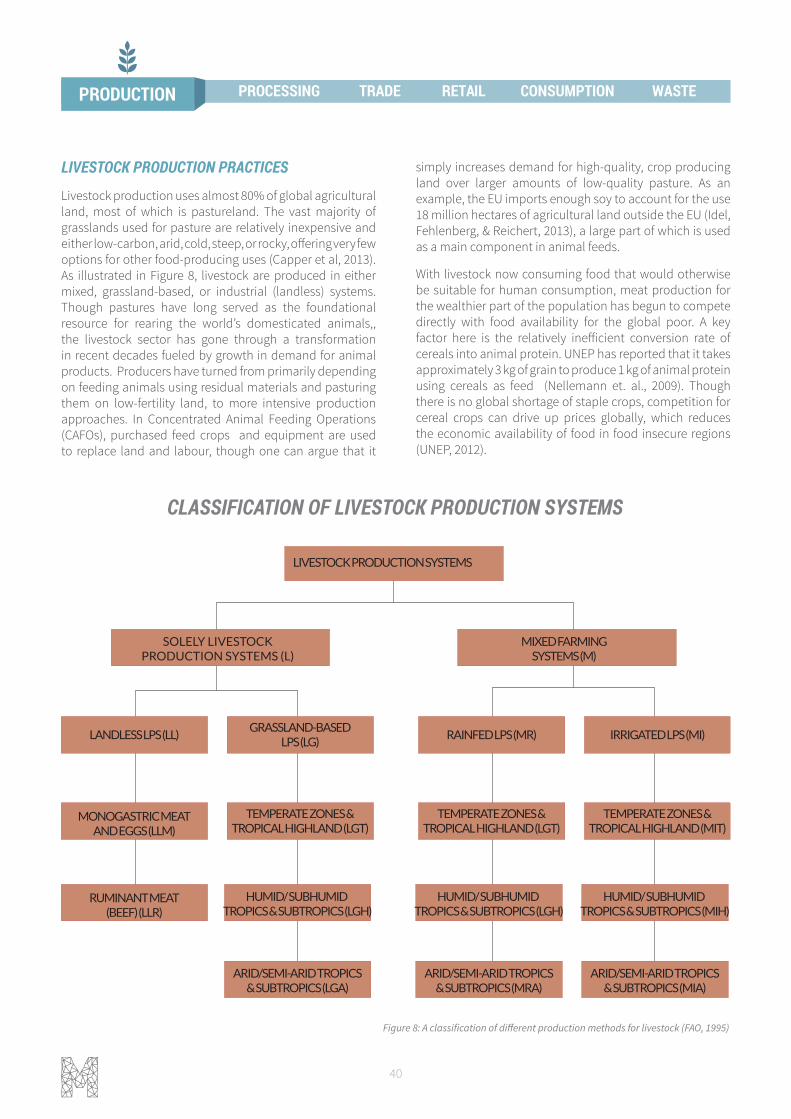
40
LIVESTOCK PRODUCTION SYSTEMS
SOLELY LIVESTOCKPRODUCTION SYSTEMS (L)
LANDLESS LPS (LL)GRASSLAND-BASED
LPS (LG)
MONOGASTRIC MEATAND EGGS (LLM)
RUMINANT MEAT(BEEF) (LLR)
HUMID/ SUBHUMID TROPICS & SUBTROPICS (LGH)
ARID/SEMI-ARID TROPICS& SUBTROPICS (LGA)
TEMPERATE ZONES &TROPICAL HIGHLAND (LGT)
RAINFED LPS (MR)
HUMID/ SUBHUMID TROPICS & SUBTROPICS (LGH)
ARID/SEMI-ARID TROPICS& SUBTROPICS (MRA)
TEMPERATE ZONES &TROPICAL HIGHLAND (LGT)
IRRIGATED LPS (MI)
HUMID/ SUBHUMID TROPICS & SUBTROPICS (MIH)
ARID/SEMI-ARID TROPICS& SUBTROPICS (MIA)
TEMPERATE ZONES &TROPICAL HIGHLAND (MIT)
MIXED FARMINGSYSTEMS (M)
Figure 8: A classification of different production methods for livestock (FAO, 1995)
LIVESTOCK PRODUCTION PRACTICES
Livestock production uses almost 80% of global agricultural land, most of which is pastureland. The vast majority of grasslands used for pasture are relatively inexpensive and either low-carbon, arid, cold, steep, or rocky, offering very few options for other food-producing uses (Capper et al, 2013). As illustrated in Figure 8, livestock are produced in either mixed, grassland-based, or industrial (landless) systems. Though pastures have long served as the foundational resource for rearing the world’s domesticated animals,, the livestock sector has gone through a transformation in recent decades fueled by growth in demand for animal products. Producers have turned from primarily depending on feeding animals using residual materials and pasturing them on low-fertility land, to more intensive production approaches. In Concentrated Animal Feeding Operations (CAFOs), purchased feed crops and equipment are used to replace land and labour, though one can argue that it
simply increases demand for high-quality, crop producing land over larger amounts of low-quality pasture. As an example, the EU imports enough soy to account for the use 18 million hectares of agricultural land outside the EU (Idel, Fehlenberg, & Reichert, 2013), a large part of which is used as a main component in animal feeds.
With livestock now consuming food that would otherwise be suitable for human consumption, meat production for the wealthier part of the population has begun to compete directly with food availability for the global poor. A key factor here is the relatively inefficient conversion rate of cereals into animal protein. UNEP has reported that it takes approximately 3 kg of grain to produce 1 kg of animal protein using cereals as feed (Nellemann et. al., 2009). Though there is no global shortage of staple crops, competition for cereal crops can drive up prices globally, which reduces the economic availability of food in food insecure regions (UNEP, 2012).
CLASSIFICATION OF LIVESTOCK PRODUCTION SYSTEMS
PRODUCTION PROCESSING TRADE RETAIL CONSUMPTION WASTE
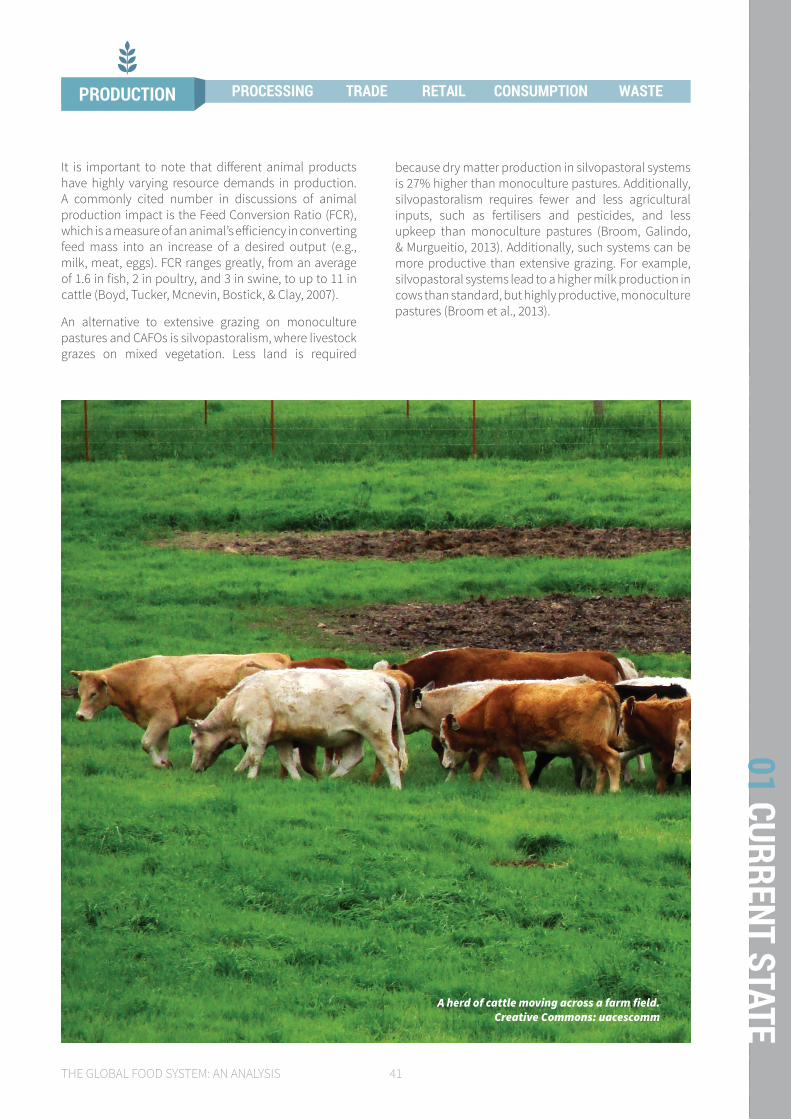
THE GLOBAL FOOD SYSTEM: AN ANALYSIS 41
01 CURRENT STATE
It is important to note that different animal products have highly varying resource demands in production. A commonly cited number in discussions of animal production impact is the Feed Conversion Ratio (FCR), which is a measure of an animal’s efficiency in converting feed mass into an increase of a desired output (e.g., milk, meat, eggs). FCR ranges greatly, from an average of 1.6 in fish, 2 in poultry, and 3 in swine, to up to 11 in cattle (Boyd, Tucker, Mcnevin, Bostick, & Clay, 2007).
An alternative to extensive grazing on monoculture pastures and CAFOs is silvopastoralism, where livestock grazes on mixed vegetation. Less land is required
because dry matter production in silvopastoral systems is 27% higher than monoculture pastures. Additionally, silvopastoralism requires fewer and less agricultural inputs, such as fertilisers and pesticides, and less upkeep than monoculture pastures (Broom, Galindo, & Murgueitio, 2013). Additionally, such systems can be more productive than extensive grazing. For example, silvopastoral systems lead to a higher milk production in cows than standard, but highly productive, monoculture pastures (Broom et al., 2013).
A herd of cattle moving across a farm field.Creative Commons: uacescomm
PRODUCTION PROCESSING TRADE RETAIL CONSUMPTION WASTE

42
FISHING PRACTICES
The FAO defines the term “fishery” as an activity leading to the harvesting of fish through either wild capture or aquaculture. Fisheries are further defined in terms of at least some of the following: “people involved, species or type of fish, area of water or seabed, method of fishing, class of boats, and purpose of the activities” (FAO Term Portal, 2015). As such, fishing methods must always be considered in context: any fishing method not appropriately matched to a species, location, or time of year can potentially result in ecological harm.
Over 90% of fishers involved in global capture fisheries operate in either small-scale or artisanal fisheries. Though many of them are at least partly engaged in fishing for subsistence reasons, they are estimated to produce approximately 50% of fish supply for human consumption (Johnson, 2005).
Small scale fisheries are not necessarily considered artisanal, and vice versa, though when one term applies to a fishery, the other often does as well. Artisanal fisheries are those that typically utilise relatively low levels of technology and have relatively low levels of capital investment per fisher, often making use of traditional fishing techniques (e.g., hook and line, beach seines, cast and lift nets, fish traps and weirs, manual harvesting). They are typically associated with lower ecological impact, lower running costs and fuel consumption, lower cost of technology, higher versatility, and higher employment opportunities. These relative benefits do not imply that artisanal fisheries do not contribute to overfishing or ecological damage, however, as these fishers can and do overfish available resources and occasionally use ecologically damaging methods such as poison or dynamite (Johnson, 2005).
Large-scale, industrial fisheries employ around 10% of fishers globally and are responsible for an estimated 50% of global fish landings (Johnson, 2005). There are four main large-scale commercial methods of catching fish and seafood; trawls and dredges, line fishing, net fishing, and traps. A description of these methods as well as some others are shown in Table 1, along with a brief overview of their relative impacts.
In general, bottom trawling and net methods have the highest negative impacts, but are the most economical as they catch an enormous volume of fish using relatively little labour and time. A survey about impacts due to different fishing methods showed that experts agreed that bottom trawling produced the largest negative effect on the environment, attributed largely to the direct effect on the seafloor habitat (Chuenpagdee, Morgan, Maxwell, Norse, & Pauly, 2003). Bottom trawling accounts for a large part of the destruction to coral reefs and sponges, around 1 million pounds were destroyed between 1997-1999 in the water
around Alaska alone (Lewison, Crowder, Read, & Freeman, 2004). While bottom trawling damages the seafloor habitat by scraping and ploughing the floor up to 30 cm, it also stirs up soil, causing an additional impact through increasing the turbidity of the water (Dayton, Thrush, Agardy, & Hofman, 1995).
Similar to trawls and dredges, other types of nets have little species selectivity, producing a lot of bycatch, including through lost nets (referred to as ‘ghost fishing’) (Suuronen et al., 2012). In particular, gillnets (or driftnets) are particularly damaging, resulting in the highest bycatch levels of mammals, sea turtles, and seabirds (Chuenpagdee et al., 2003). Such nets were banned in international waters in 1992 by a U.N. resolution, though individual nations can still use driftnets of up to 2.5 km in length in their own waters (Lewison et al., 2004).
Longline fishing uses relatively little fuel, inexpensive equipment, is relatively species-selective, and generally causes minimal habitat damage (Pham et al., 2014). The most significant downside to longline fishing is that it still results in capture of non-target species such as marine birds, mammals, and turtles. The method is also labour- and time-intensive, and is dependent on the price of bait (Suuronen et al., 2012). Similarly, trolling, which requires dragging fish lines through the water to attract fish, is more species selective than nets, trawls, or dredges, but also produces a low catch.
Traps and pots catch fish and crustaceans by using barriers that allow fish to enter an area or trap but make it difficult for them to escape. Trap design or bait selection can result in species selectivity. Specialized gear can be very effective at targeting certain species, such as lobsters (FAO, 2001). This method can be a relatively low impact manner of fishing when managed properly, but often old traps are forgotten or discarded, leading to ghost fishing and additional marine debris (Arthur, Sutton-Grier, Murphy, & Bamford, 2014). For example, one program to collect derelict pots and traps around Virginia estimated that 41% of the gear found had been abandoned (Bilkovic, Havens, Stanhope, & Angstadt, 2014).
AQUACULTURE PRACTICES
Aquaculture may offer some benefits over fishing as it does not lead directly to overfishing and can be separate from natural habitats. The problems and solutions associated with aquaculture are generally more similar to those encountered with conventional agriculture. However, the methods that are typically applied for aquaculture can and do have negative effects on the environment. For one, aquaculture isn’t typically separate from marine and freshwater environments. According to the FAO 2012 Fisheries and Aquaculture Yearbook, around 63% of the aquaculture production of fish, crustaceans, and other
PRODUCTION PROCESSING TRADE RETAIL CONSUMPTION WASTE
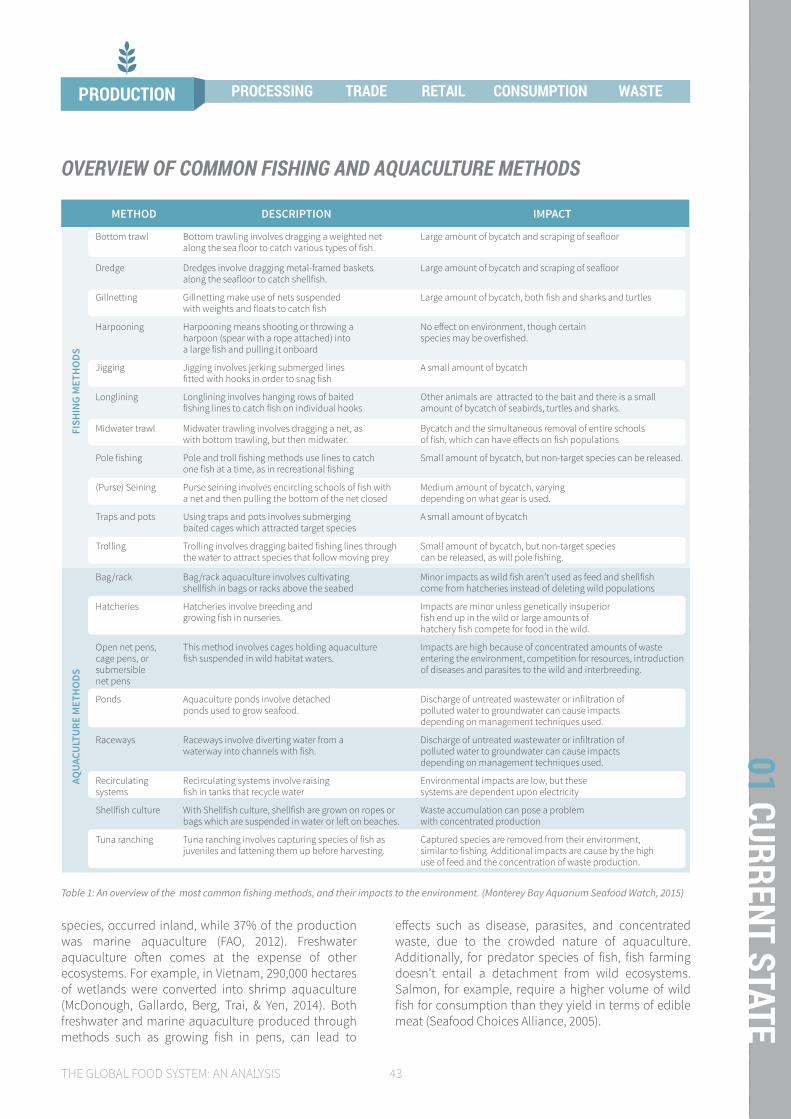
THE GLOBAL FOOD SYSTEM: AN ANALYSIS 43
01 CURRENT STATE
METHOD DESCRIPTION IMPACT
Bottom trawl Bottom trawling involves dragging a weighted net along the sea floor to catch various types of fish.
Large amount of bycatch and scraping of seafloor
Dredge Dredges involve dragging metal-framed baskets along the seafloor to catch shellfish.
Large amount of bycatch and scraping of seafloor
Gillnetting Gillnetting make use of nets suspended with weights and floats to catch fish
Large amount of bycatch, both fish and sharks and turtles
Harpooning Harpooning means shooting or throwing a harpoon (spear with a rope attached) into a large fish and pulling it onboard
No effect on environment, though certain species may be overfished.
Jigging Jigging involves jerking submerged lines fitted with hooks in order to snag fish
A small amount of bycatch
Longlining Longlining involves hanging rows of baited fishing lines to catch fish on individual hooks
Other animals are attracted to the bait and there is a small amount of bycatch of seabirds, turtles and sharks.
Midwater trawl Midwater trawling involves dragging a net, as with bottom trawling, but then midwater.
Bycatch and the simultaneous removal of entire schools of fish, which can have effects on fish populations
Pole fishing Pole and troll fishing methods use lines to catch one fish at a time, as in recreational fishing
Small amount of bycatch, but non-target species can be released.
(Purse) Seining Purse seining involves encircling schools of fish with a net and then pulling the bottom of the net closed
Medium amount of bycatch, varying depending on what gear is used.
Traps and pots Using traps and pots involves submerging baited cages which attracted target species
A small amount of bycatch
Trolling Trolling involves dragging baited fishing lines through the water to attract species that follow moving prey
Small amount of bycatch, but non-target species can be released, as will pole fishing.
Bag/rack Bag/rack aquaculture involves cultivating shellfish in bags or racks above the seabed
Minor impacts as wild fish aren’t used as feed and shellfish come from hatcheries instead of deleting wild populations
Hatcheries Hatcheries involve breeding and growing fish in nurseries.
Impacts are minor unless genetically insuperior fish end up in the wild or large amounts of hatchery fish compete for food in the wild.
Open net pens, cage pens, or submersible net pens
This method involves cages holding aquaculture fish suspended in wild habitat waters.
Impacts are high because of concentrated amounts of waste entering the environment, competition for resources, introduction of diseases and parasites to the wild and interbreeding.
Ponds Aquaculture ponds involve detached ponds used to grow seafood.
Discharge of untreated wastewater or infiltration of polluted water to groundwater can cause impacts depending on management techniques used.
Raceways Raceways involve diverting water from a waterway into channels with fish.
Discharge of untreated wastewater or infiltration of polluted water to groundwater can cause impacts depending on management techniques used.
Recirculating systems
Recirculating systems involve raising fish in tanks that recycle water
Environmental impacts are low, but these systems are dependent upon electricity
Shellfish culture With Shellfish culture, shellfish are grown on ropes or bags which are suspended in water or left on beaches.
Waste accumulation can pose a problem with concentrated production
Tuna ranching Tuna ranching involves capturing species of fish as juveniles and fattening them up before harvesting.
Captured species are removed from their environment, similar to fishing. Additional impacts are cause by the high use of feed and the concentration of waste production.
Table 1: An overview of the most common fishing methods, and their impacts to the environment. (Monterey Bay Aquarium Seafood Watch, 2015)
species, occurred inland, while 37% of the production was marine aquaculture (FAO, 2012). Freshwater aquaculture often comes at the expense of other ecosystems. For example, in Vietnam, 290,000 hectares of wetlands were converted into shrimp aquaculture (McDonough, Gallardo, Berg, Trai, & Yen, 2014). Both freshwater and marine aquaculture produced through methods such as growing fish in pens, can lead to
effects such as disease, parasites, and concentrated waste, due to the crowded nature of aquaculture. Additionally, for predator species of fish, fish farming doesn’t entail a detachment from wild ecosystems. Salmon, for example, require a higher volume of wild fish for consumption than they yield in terms of edible meat (Seafood Choices Alliance, 2005).
OVERVIEW OF COMMON FISHING AND AQUACULTURE METHODS
PRODUCTION PROCESSING TRADE RETAIL CONSUMPTION WASTEFI
SHIN
G M
ETH
ODS
AQUA
CULT
URE
MET
HO
DS
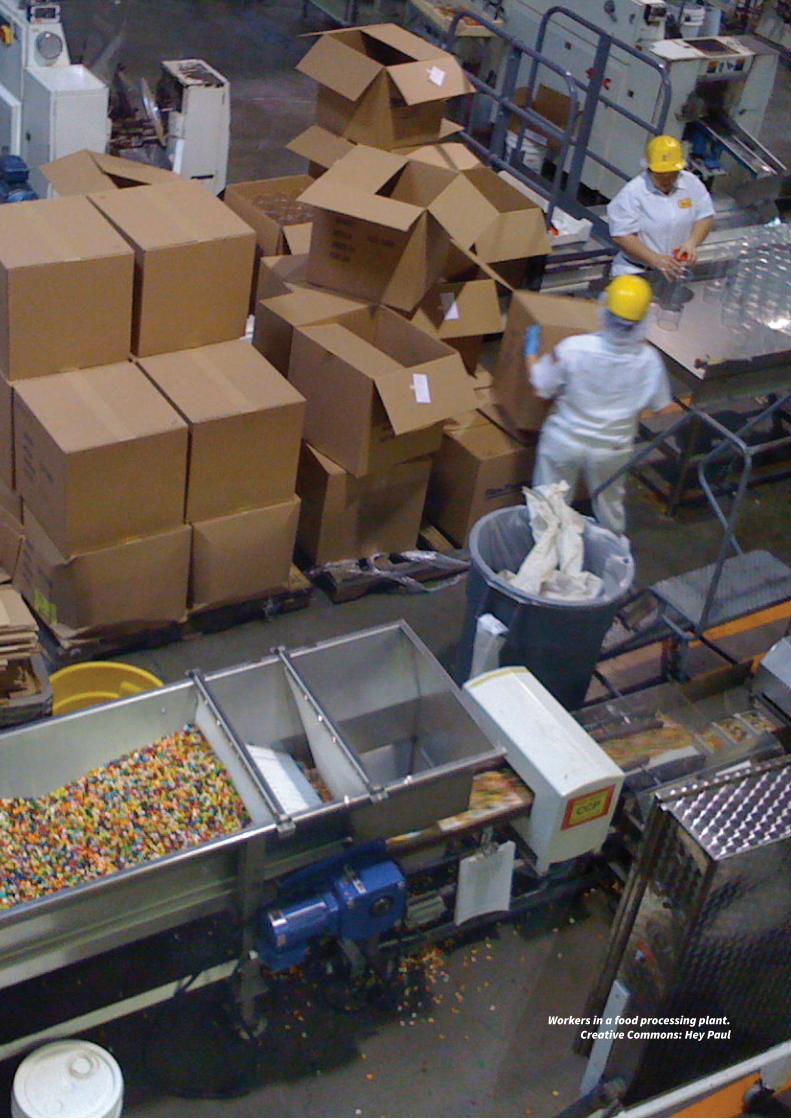
44
Workers in a food processing plant.Creative Commons: Hey Paul
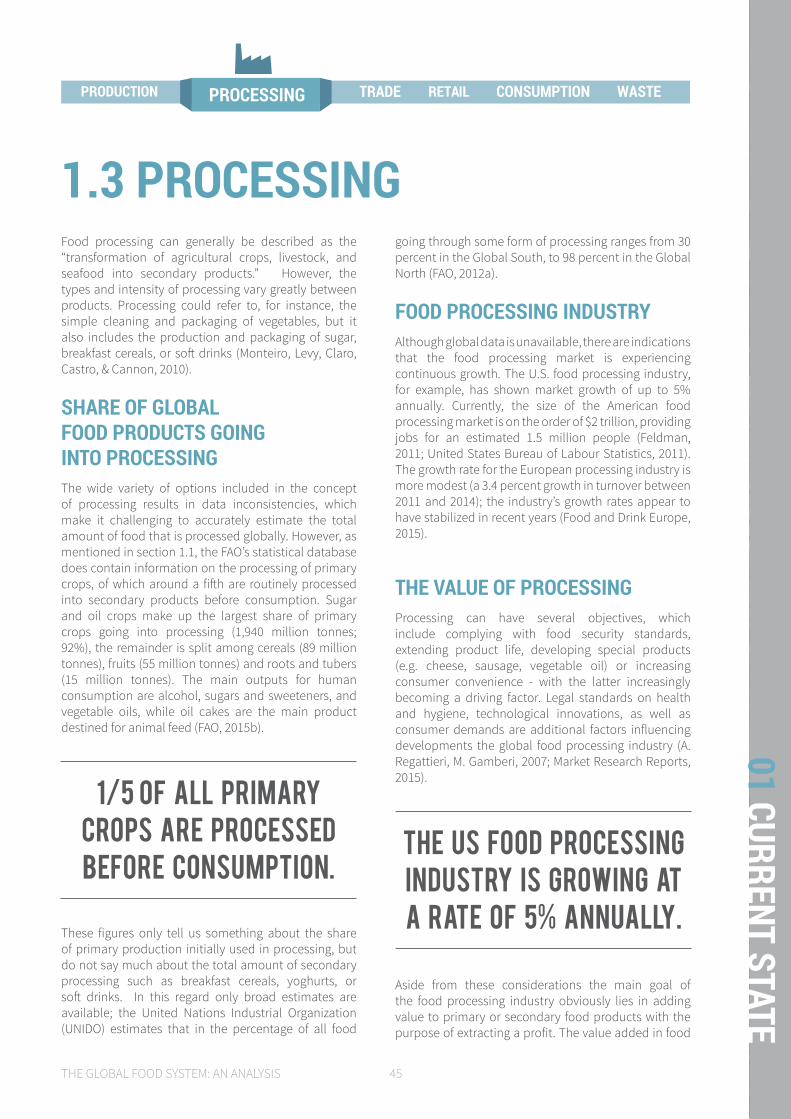
THE GLOBAL FOOD SYSTEM: AN ANALYSIS 45
01 CURRENT STATE
Food processing can generally be described as the “transformation of agricultural crops, livestock, and seafood into secondary products.” However, the types and intensity of processing vary greatly between products. Processing could refer to, for instance, the simple cleaning and packaging of vegetables, but it also includes the production and packaging of sugar, breakfast cereals, or soft drinks (Monteiro, Levy, Claro, Castro, & Cannon, 2010).
SHARE OF GLOBAL FOOD PRODUCTS GOING INTO PROCESSINGThe wide variety of options included in the concept of processing results in data inconsistencies, which make it challenging to accurately estimate the total amount of food that is processed globally. However, as mentioned in section 1.1, the FAO’s statistical database does contain information on the processing of primary crops, of which around a fifth are routinely processed into secondary products before consumption. Sugar and oil crops make up the largest share of primary crops going into processing (1,940 million tonnes; 92%), the remainder is split among cereals (89 million tonnes), fruits (55 million tonnes) and roots and tubers (15 million tonnes). The main outputs for human consumption are alcohol, sugars and sweeteners, and vegetable oils, while oil cakes are the main product destined for animal feed (FAO, 2015b).
These figures only tell us something about the share of primary production initially used in processing, but do not say much about the total amount of secondary processing such as breakfast cereals, yoghurts, or soft drinks. In this regard only broad estimates are available; the United Nations Industrial Organization (UNIDO) estimates that in the percentage of all food
going through some form of processing ranges from 30 percent in the Global South, to 98 percent in the Global North (FAO, 2012a).
FOOD PROCESSING INDUSTRYAlthough global data is unavailable, there are indications that the food processing market is experiencing continuous growth. The U.S. food processing industry, for example, has shown market growth of up to 5% annually. Currently, the size of the American food processing market is on the order of $2 trillion, providing jobs for an estimated 1.5 million people (Feldman, 2011; United States Bureau of Labour Statistics, 2011). The growth rate for the European processing industry is more modest (a 3.4 percent growth in turnover between 2011 and 2014); the industry’s growth rates appear to have stabilized in recent years (Food and Drink Europe, 2015).
THE VALUE OF PROCESSINGProcessing can have several objectives, which include complying with food security standards, extending product life, developing special products (e.g. cheese, sausage, vegetable oil) or increasing consumer convenience - with the latter increasingly becoming a driving factor. Legal standards on health and hygiene, technological innovations, as well as consumer demands are additional factors influencing developments the global food processing industry (A. Regattieri, M. Gamberi, 2007; Market Research Reports, 2015).
Aside from these considerations the main goal of the food processing industry obviously lies in adding value to primary or secondary food products with the purpose of extracting a profit. The value added in food
1.3 PROCESSING
WASTETRADE RETAILPROCESSINGPRODUCTION PROCESSING TRADE CONSUMPTION WASTEPRODUCTION RETAIL
1/5 of all primary crops Are processed before consumption.
the us food processing industry is growing at a rate of 5% annually.
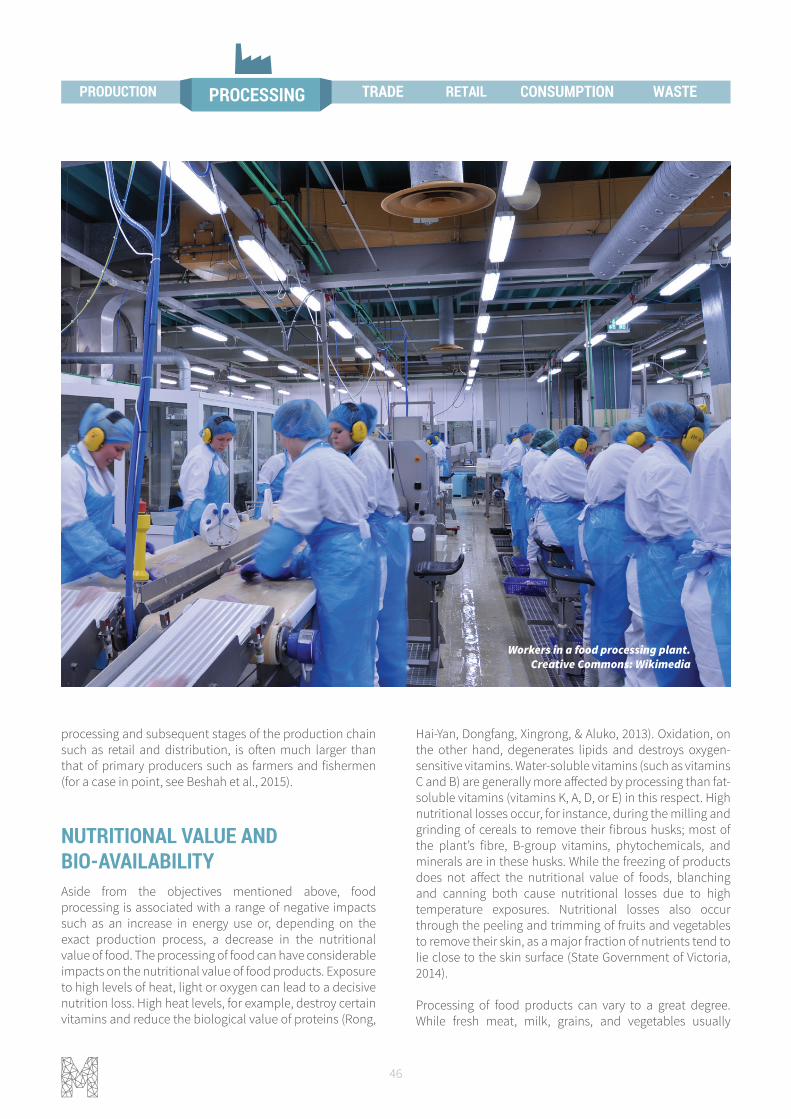
46
processing and subsequent stages of the production chain such as retail and distribution, is often much larger than that of primary producers such as farmers and fishermen (for a case in point, see Beshah et al., 2015).
NUTRITIONAL VALUE AND BIO-AVAILABILITYAside from the objectives mentioned above, food processing is associated with a range of negative impacts such as an increase in energy use or, depending on the exact production process, a decrease in the nutritional value of food. The processing of food can have considerable impacts on the nutritional value of food products. Exposure to high levels of heat, light or oxygen can lead to a decisive nutrition loss. High heat levels, for example, destroy certain vitamins and reduce the biological value of proteins (Rong,
Hai-Yan, Dongfang, Xingrong, & Aluko, 2013). Oxidation, on the other hand, degenerates lipids and destroys oxygen-sensitive vitamins. Water-soluble vitamins (such as vitamins C and B) are generally more affected by processing than fat-soluble vitamins (vitamins K, A, D, or E) in this respect. High nutritional losses occur, for instance, during the milling and grinding of cereals to remove their fibrous husks; most of the plant’s fibre, B-group vitamins, phytochemicals, and minerals are in these husks. While the freezing of products does not affect the nutritional value of foods, blanching and canning both cause nutritional losses due to high temperature exposures. Nutritional losses also occur through the peeling and trimming of fruits and vegetables to remove their skin, as a major fraction of nutrients tend to lie close to the skin surface (State Government of Victoria, 2014).
Processing of food products can vary to a great degree. While fresh meat, milk, grains, and vegetables usually
Workers in a food processing plant.Creative Commons: Wikimedia
WASTETRADE RETAILPROCESSINGPRODUCTION PROCESSING TRADE CONSUMPTION WASTEPRODUCTION RETAIL

THE GLOBAL FOOD SYSTEM: AN ANALYSIS 47
01 CURRENT STATE
undergo few processing steps that include practices like cleaning, removing of inedible fractions, portioning, refrigeration, or bottling to make products more accessible to the consumer, also different highly processed products exist that have been altered a great deal (Monteiro et al., 2010). Examples of these highly processed foods are breads, biscuits, confectioneries, crisps, cereal products, sugared and soft drinks, and processed meat products. They often contain additives such as flavours, colours, or other substances that make them more palatable or even habit-forming (Moubarac et al., 2013). Global diets today increasingly consist of highly processed foods. The more processing, usually the lower the nutritional value and the higher the adverse impacts on human health resulting from low nutrient density, insufficient dietary fibre, and a surplus of simple carbohydrates, saturated fats, sodium, and trans fatty acids (Monteiro, Levy, Claro, de Castro, & Cannon, 2011).
The processing of food also can have positive implications and can increase the bioavailability of nutrients from raw food products. Perhaps unexpectedly, frozen vegetables can have a higher nutritional value than ‘fresh’ vegetables (Rickman, Barrett, & Bruhn, 2007). Furthermore, cooking is a traditional form of processing that is essential to ensuring the bioavailability of certain nutrients (see section 1.6 for more on cooking and food preparation). Finally, methods like canning, pasteurization, dehydration and freezing preserve nutrient contents and can make food longer available (Pasha, Saeed, Sultan, Khan, & Rohi, 2014; Weaver et al., 2014).
RESOURCE CONSUMPTION INFOOD PROCESSINGThe preparation of processed foods requires resources such as energy, water, and materials (e.g., for packaging). The high demand for energy in the food processing industry arises mainly from increasing automation and machinery use during this production stage (Canning, Charles, Huang, Polenske, & Waters, 2010). In an advanced food industry like that found in the United States, food processing is responsible for around one third of total energy use in the food system. Up to 1,000 calories of energy are needed per production of 1 calorie of processed food (Verma, 2015).
From another perspective, looking at the embodied energy in the diet of an EU citizen, it has been estimated that of the total embodied dietary energy, 28% is due
to food processing making it the second largest share next to the production stage (33%). All in all, in the year 2013, the European food industry consumed 28.4 MTOE of energy, or 2.6% of the EU-28’s average final energy consumption (Dallemand et al., 2015).
As there is a multitude of diverse food products that require different production methods and different numbers of processing steps, energy inputs vary widely per product. Canning of fruits and vegetables (575 kcal/kg) and also freezing of fruits and vegetables (1,815 kcal/kg) have lower energy inputs as opposed to food products that entail more processing steps like the production of breakfast cereals (15,675 kcal/kg) or chocolate (18,591 kcal/kg). With a growth in demand for more convenient or new food products (e.g. pre-cut vegetables, salad mix products) which entails more processing, preparation and packaging, the energy intensity of the sector will also increase (Verma, 2015).
Data for the U.S. food processing industry between 1997 to 2002 confirm this trend showing an annual increase in energy consumption of 8.3% (Verma, 2015). The increase in energy intensity is a long term trend: since the early 20th century yearly increases in energy use between 9.6 and 13 percent have been documented for cereal products, baking products, fresh dairy and snacks, frozen and canned food, spices and condiments (Canning et al., 2010). On the other hand, the EU region has managed to decrease its food processing sector’s energy consumption over the past years (2005-2013), despite an overall growth in processing (Dallemand et al., 2015).
Aside from inputs in the form of energy, food processing also typically increases the demand for specialized food packaging. The impact of packaging and associated material wastes is discussed in section 3.1.6.
Global estimates of the share of resources associated with food processing are not available as most studies focus on the production stage of food products where most environmental impact still occurs (Boye & Arcand, 2012).
WASTETRADE RETAILPROCESSINGPRODUCTION PROCESSING TRADE CONSUMPTION WASTEPRODUCTION RETAIL
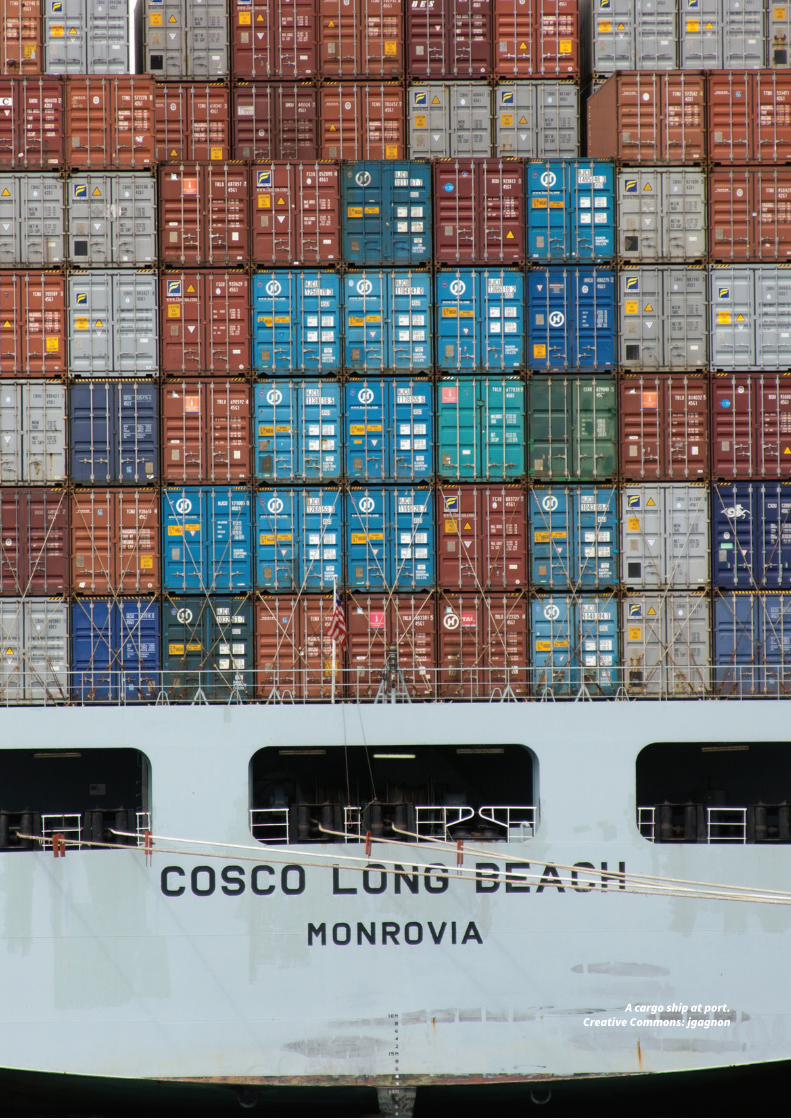
48
A cargo ship at port.Creative Commons: jgagnon
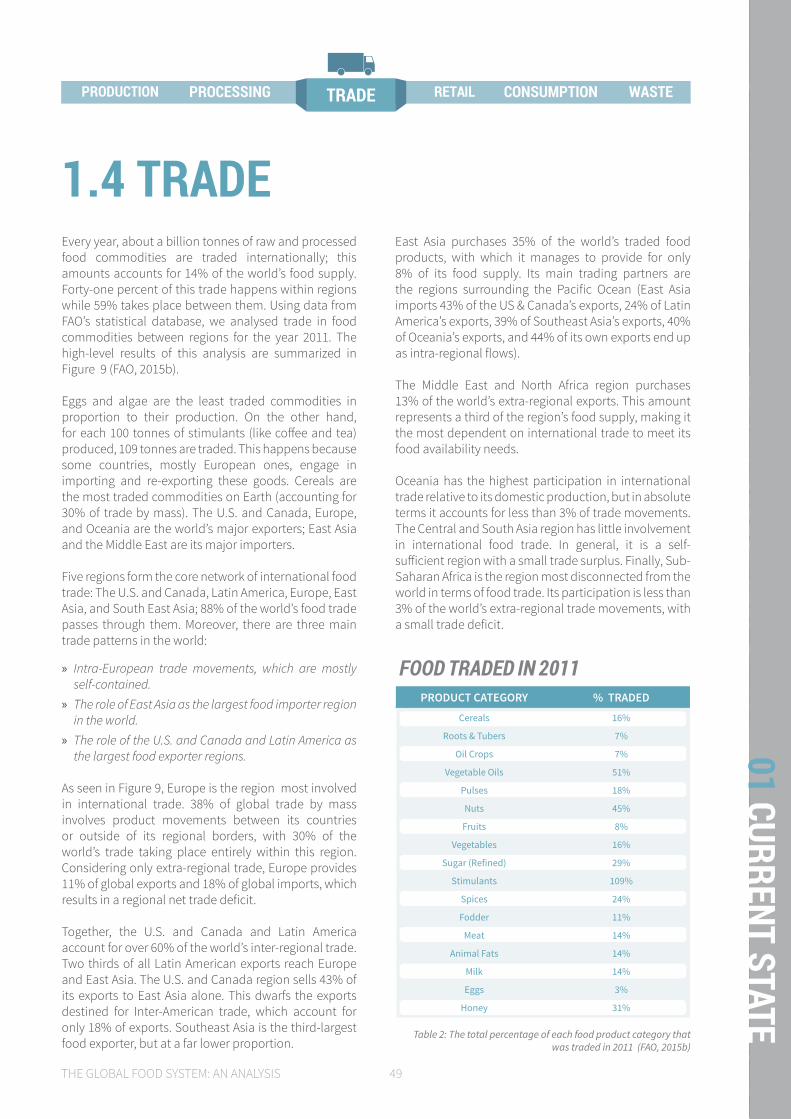
THE GLOBAL FOOD SYSTEM: AN ANALYSIS 49
01 CURRENT STATE
Every year, about a billion tonnes of raw and processed food commodities are traded internationally; this amounts accounts for 14% of the world’s food supply. Forty-one percent of this trade happens within regions while 59% takes place between them. Using data from FAO’s statistical database, we analysed trade in food commodities between regions for the year 2011. The high-level results of this analysis are summarized in Figure 9 (FAO, 2015b).
Eggs and algae are the least traded commodities in proportion to their production. On the other hand, for each 100 tonnes of stimulants (like coffee and tea) produced, 109 tonnes are traded. This happens because some countries, mostly European ones, engage in importing and re-exporting these goods. Cereals are the most traded commodities on Earth (accounting for 30% of trade by mass). The U.S. and Canada, Europe, and Oceania are the world’s major exporters; East Asia and the Middle East are its major importers.
Five regions form the core network of international food trade: The U.S. and Canada, Latin America, Europe, East Asia, and South East Asia; 88% of the world’s food trade passes through them. Moreover, there are three main trade patterns in the world:
» Intra-European trade movements, which are mostly self-contained.
» The role of East Asia as the largest food importer region in the world.
» The role of the U.S. and Canada and Latin America as the largest food exporter regions.
As seen in Figure 9, Europe is the region most involved in international trade. 38% of global trade by mass involves product movements between its countries or outside of its regional borders, with 30% of the world’s trade taking place entirely within this region. Considering only extra-regional trade, Europe provides 11% of global exports and 18% of global imports, which results in a regional net trade deficit.
Together, the U.S. and Canada and Latin America account for over 60% of the world’s inter-regional trade. Two thirds of all Latin American exports reach Europe and East Asia. The U.S. and Canada region sells 43% of its exports to East Asia alone. This dwarfs the exports destined for Inter-American trade, which account for only 18% of exports. Southeast Asia is the third-largest food exporter, but at a far lower proportion.
East Asia purchases 35% of the world’s traded food products, with which it manages to provide for only 8% of its food supply. Its main trading partners are the regions surrounding the Pacific Ocean (East Asia imports 43% of the US & Canada’s exports, 24% of Latin America’s exports, 39% of Southeast Asia’s exports, 40% of Oceania’s exports, and 44% of its own exports end up as intra-regional flows).
The Middle East and North Africa region purchases 13% of the world’s extra-regional exports. This amount represents a third of the region’s food supply, making it the most dependent on international trade to meet its food availability needs.
Oceania has the highest participation in international trade relative to its domestic production, but in absolute terms it accounts for less than 3% of trade movements. The Central and South Asia region has little involvement in international food trade. In general, it is a self-sufficient region with a small trade surplus. Finally, Sub-Saharan Africa is the region most disconnected from the world in terms of food trade. Its participation is less than 3% of the world’s extra-regional trade movements, with a small trade deficit.
PRODUCT CATEGORY % TRADEDCereals 16%
Roots & Tubers 7%
Oil Crops 7%
Vegetable Oils 51%
Pulses 18%
Nuts 45%
Fruits 8%
Vegetables 16%
Sugar (Refined) 29%
Stimulants 109%
Spices 24%
Fodder 11%
Meat 14%
Animal Fats 14%
Milk 14%
Eggs 3%
Honey 31%
1.4 TRADE
Table 2: The total percentage of each food product category that was traded in 2011 (FAO, 2015b)
PROCESSING TRADE CONSUMPTION WASTEPRODUCTION RETAIL
FOOD TRADED IN 2011

50
CEREALS
OIL AND OIL CROPS
FODDER
FRUITS
ROOTS AND TUBERS
VEGETABLES
SUGAR AND SUGAR CROPS
FIBRES
ALCOHOL
MEAT
24%
6%
.3%
23%
13%
24%
11%
9% 18%
39%
2%
19%
3%
EASTASIA
SUBSAHARANAFRICA
MIDDLE EAST
SOUTH &CENTRAL ASIA
EXPORTS: 17,933 M TONS
EXPORTS: 351,867 M TONS
EXPORTS: 35,958 M TONS
EXPORTS: 23,825 M TONS
EXPORTS: 91,619 M TONS
EXPORTS: 45,021 M TONS
2% EUROPE
EXPORTS: 201,807 M TONS
7%
10%3%
42%
OCEANIA
9%
3%
EXPORTS: 225,405 M TONS
LATIN AMERICA& THE CARIBBEAN
43%
US & CANADA
EXPORTS: 201,807 M TONS
SOUTHEASTASIA
23%
EAST ASIA IMPORTS THE LARGEST VOLUMES OF FOOD
East Asia imports only 8% of its food supply, but is the region that imports the largest volumes of food in the world. The region also imports 41% of other products, including seaweed, sugar, and fibres.
THE MIDDLE EAST AND NORTH AFRICA ARE THE MOST DEPENDENT
The Middle East imports 31% of its food supply, including 55% of its cereals, 91% of its oil and 70% of its sugar. It is the region with highest import dependency for its food supply. In turn, it exports a mere 9% of its food output, mostly crops such as nuts and fruits, but also oils and sugar.
GLOBAL TRADE FLOWS IN 2011
PROCESSING TRADE CONSUMPTION WASTEPRODUCTION RETAIL

THE GLOBAL FOOD SYSTEM: AN ANALYSIS 51
01 CURRENT STATE
CEREALS
OIL AND OIL CROPS
FODDER
FRUITS
ROOTS AND TUBERS
VEGETABLES
SUGAR AND SUGAR CROPS
FIBRES
ALCOHOL
MEAT
24%
6%
.3%
23%
13%
24%
11%
9% 18%
39%
2%
19%
3%
EASTASIA
SUBSAHARANAFRICA
MIDDLE EAST
SOUTH &CENTRAL ASIA
EXPORTS: 17,933 M TONS
EXPORTS: 351,867 M TONS
EXPORTS: 35,958 M TONS
EXPORTS: 23,825 M TONS
EXPORTS: 91,619 M TONS
EXPORTS: 45,021 M TONS
2% EUROPE
EXPORTS: 201,807 M TONS
7%
10%3%
42%
OCEANIA
9%
3%
EXPORTS: 225,405 M TONS
LATIN AMERICA& THE CARIBBEAN
43%
US & CANADA
EXPORTS: 201,807 M TONS
SOUTHEASTASIA
23%
OCEANIA HAS THE MOST FAVOURABLE TRADE BALANCE
Oceania imports a mere 7% of its food supply, yet it exports 51% of its production. It has the most favourable food trade balance in the world. Its main exports are cereals, which go to the East Asia and South and Central Asia regions, and oil crops, which are primarily sold to Europe.
LATIN AMERICA IS THE LARGEST IMPORTER OF NON-FOOD CROPS
Latin America imports 15% of its food supply, yet exports 21% of its production. Its main exports are oil crops, which are sold to East Asia, and a range of other products including sugar, fruits and cereals. The region imports mostly non-food crops, such as flowers and live plants, from Europe, but also food products from the U.S. and Canada.
Figure 9: An overview of total international trade volumes between regions. This diagram does not include intra-regional trade
(Trade flow calculations based on FAO, 2015b for the reference year 2011)
PROCESSING TRADE CONSUMPTION WASTEPRODUCTION RETAIL
52
A glimpse down a supermarket aisle in the United States.

THE GLOBAL FOOD SYSTEM: AN ANALYSIS 53
01 CURRENT STATE
THE BIG PLAYERS IN FOOD DISTRIBUTIONDistribution channels have undergone significant changes since the economic reforms of the 1980s and 1990s. Globalisation has created space for large retailers to dominate over much of the developed and developing world (Wrigley & Lowe, 2010). Today, an estimated 51% of global food sales are purchased through supermarkets and hypermarkets. Food sales through these channels are growing at a rate of 2% annually (Nielsen, 2015). While the world’s largest food retailers were traditionally based in the U.S. and Europe, waves of supermarket development have begun globally out in what has been labeled the “supermarket revolution” (S. Murphy, Burch, & Clapp, 2012).
Supermarkets first spread out in the 1990s to South America, Central Europe, and South Africa. In the early 2000s they only accounted for between 5 to 10% of the food retail market share, however later that decade they grew to 50% of the market. A similar pattern occurred in Central America, South East Asia, and Mexico. The
final wave and most recent market expansion has been in China, Vietnam, India, Russia, and Africa. Generally, within nations, the spread of these large retailers has developed out from urbanized cities and middle class regions to rural communities (OECD Competition Committee, 2013).
MANAGING THE BIG RETAILERSGlobalised food networks, high technological management, diversified product branding, and reduced nutritional content, are all characteristics of the modern food distribution system. Retail giants such as Walmart now use high level ICT systems to improve their logistical management and gain a market edge on their competitors (OECD Competition Committee, 2013). The ICT boom of the late 1990s enabled the collection of immediate demand-related data which helped retailers to reduce their incumbent investments and improve their supply chain efficiency (Deloitte Touche Tohmatsu Limited, 2014). Because of their scale, scope, and bargaining power, large food retailers have continued to offer generally cheaper priced food commodities than their small-scale competitors (Ruppanner & Mulle, 2010). So-called “supermarket price wars” between large retailers have also led to continuous downward pressure on food prices, which is a burden that food producers (farmers, fishermen) are ultimately forced to bear (Consumers International, 2012).
PROCESSING AND HEALTHAs discussed in section 1.3, food processing is increasing in both volume and complexity over the last decades. This trend in processing is also connected to the structure of the retail market. While a majority of supermarket products once consisted of relatively basic raw ingredients and vegetables, large retailers increasingly make their profits from “value added” or processed goods (Deloitte Touche Tohmatsu Limited, 2014). Roughly 80% of supermarkets goods are processed and made by a decreasing number of manufacturing firms due to market consolidation with in this industry. These firms include manufacturers and traders such as a General Mills, Nestlé, Con-Agra, and others (OECD Competition Committee, 2013). While some of these processed foods are relatively
1.5 RETAIL
PROCESSING TRADE RETAILPRODUCTION CONSUMPTION WASTE
Globalisation has created space for large retailers to
dominate over much of the developed and developing
world. Today 51% of global food sales are purchased
through supermarkets and hypermarkets. Food
sales through these channels are growing at
an annual rate of 2%.
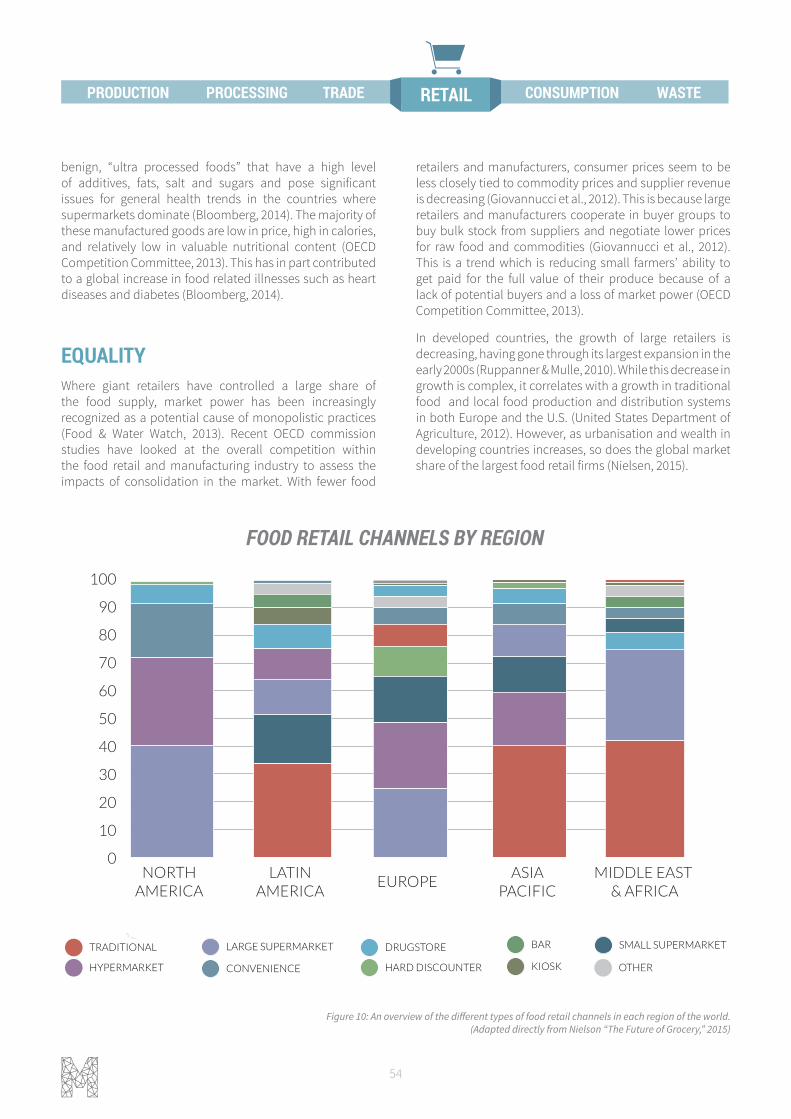
54
benign, “ultra processed foods” that have a high level of additives, fats, salt and sugars and pose significant issues for general health trends in the countries where supermarkets dominate (Bloomberg, 2014). The majority of these manufactured goods are low in price, high in calories, and relatively low in valuable nutritional content (OECD Competition Committee, 2013). This has in part contributed to a global increase in food related illnesses such as heart diseases and diabetes (Bloomberg, 2014).
EQUALITYWhere giant retailers have controlled a large share of the food supply, market power has been increasingly recognized as a potential cause of monopolistic practices (Food & Water Watch, 2013). Recent OECD commission studies have looked at the overall competition within the food retail and manufacturing industry to assess the impacts of consolidation in the market. With fewer food
TRADITIONAL
HYPERMARKET
LARGE SUPERMARKET
CONVENIENCE
SMALL SUPERMARKETDRUGSTORE
HARD DISCOUNTER
BAR
KIOSK OTHER
NORTHAMERICA
0
100
90
80
70
60
50
40
30
20
10
LATINAMERICA
EUROPEMIDDLE EAST
& AFRICAASIA
PACIFIC
TRADITIONAL
HYPERMARKET
LARGE SUPERMARKET
CONVENIENCE
SMALL SUPERMARKETDRUGSTORE
HARD DISCOUNTER
BAR
KIOSK OTHER
NORTHAMERICA
0
100
90
80
70
60
50
40
30
20
10
LATINAMERICA
EUROPEMIDDLE EAST
& AFRICAASIA
PACIFIC
Figure 10: An overview of the different types of food retail channels in each region of the world. (Adapted directly from Nielson “The Future of Grocery,” 2015)
PROCESSING TRADE RETAILPRODUCTION CONSUMPTION WASTE
retailers and manufacturers, consumer prices seem to be less closely tied to commodity prices and supplier revenue is decreasing (Giovannucci et al., 2012). This is because large retailers and manufacturers cooperate in buyer groups to buy bulk stock from suppliers and negotiate lower prices for raw food and commodities (Giovannucci et al., 2012). This is a trend which is reducing small farmers’ ability to get paid for the full value of their produce because of a lack of potential buyers and a loss of market power (OECD Competition Committee, 2013).
In developed countries, the growth of large retailers is decreasing, having gone through its largest expansion in the early 2000s (Ruppanner & Mulle, 2010). While this decrease in growth is complex, it correlates with a growth in traditional food and local food production and distribution systems in both Europe and the U.S. (United States Department of Agriculture, 2012). However, as urbanisation and wealth in developing countries increases, so does the global market share of the largest food retail firms (Nielsen, 2015).
FOOD RETAIL CHANNELS BY REGION

THE GLOBAL FOOD SYSTEM: AN ANALYSIS 55
01 CURRENT STATE
Traditional markets are still one of the most popular retail channelsCreative Commons: Marcelo Druck
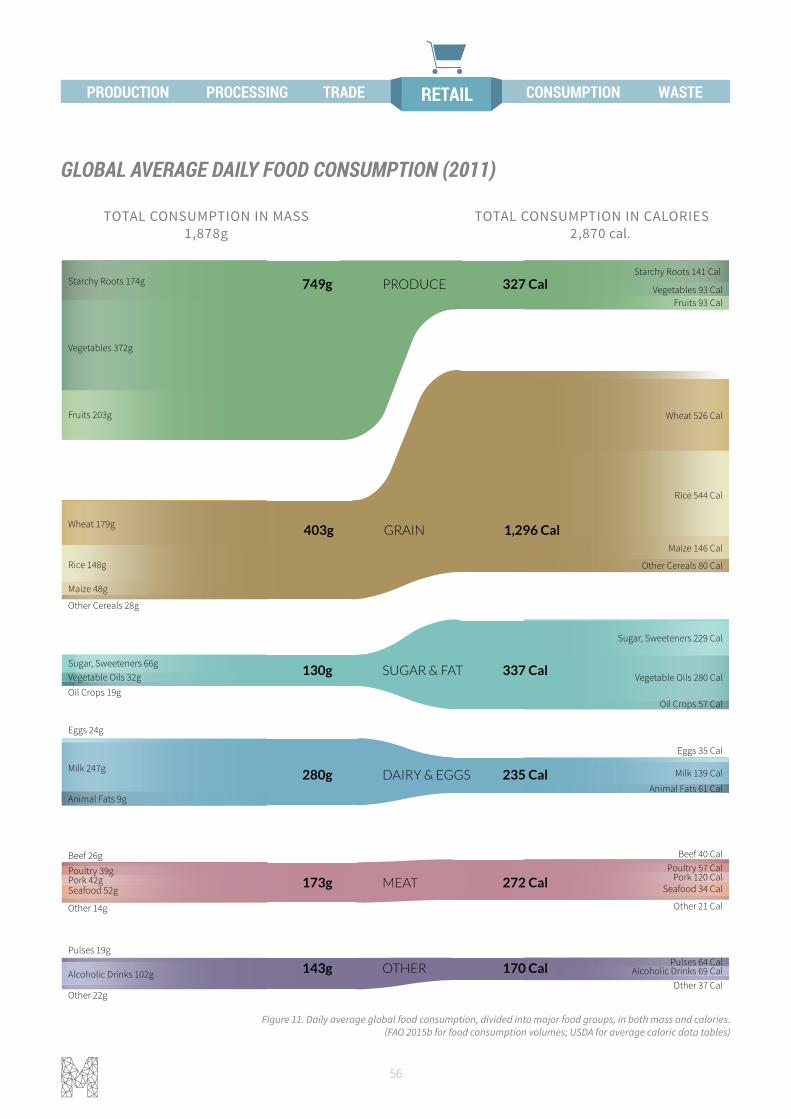
56
TOTAL CONSUMPTION IN MASS1,878g
TOTAL CONSUMPTION IN CALORIES2,870 cal.
Wheat 179g
Rice 148g
Maize 48g
Other Cereals 28g
Sugar, Sweeteners 66g
Oil Crops 19g
Eggs 24g
Milk 247g
Animal Fats 9g
Beef 26g
Poultry 39gPork 42gSeafood 52g
Other 14g
Pulses 19g
Alcoholic Drinks 102g
Other 22g
Starchy Roots 174g
Vegetables 372g
Fruits 203g
Vegetable Oils 32g
Wheat 526 Cal
Rice 544 Cal
Maize 146 Cal
Other Cereals 80 Cal
Sugar, Sweeteners 229 Cal
Oil Crops 57 Cal
Eggs 35 Cal
Milk 139 Cal
Animal Fats 61 Cal
Beef 40 CalPoultry 57 Cal
Pork 120 CalSeafood 34 Cal
Other 21 Cal
Pulses 64 CalAlcoholic Drinks 69 Cal
Other 37 Cal
Starchy Roots 141 Cal
Vegetables 93 CalFruits 93 Cal
Vegetable Oils 280 Cal
749g PRODUCE 327 Cal
403g GRAIN 1,296 Cal
130g SUGAR & FAT 337 Cal
280g DAIRY & EGGS 235 Cal
173g MEAT 272 Cal
143g OTHER 170 Cal
Figure 11. Daily average global food consumption, divided into major food groups, in both mass and calories.(FAO 2015b for food consumption volumes; USDA for average caloric data tables)
GLOBAL AVERAGE DAILY FOOD CONSUMPTION (2011)
PROCESSING TRADE RETAILPRODUCTION CONSUMPTION WASTE
THE GLOBAL FOOD SYSTEM: AN ANALYSIS 57
01 CURRENT STATE
1.6 CONSUMPTIONAfter a long and sometimes extremely complex journey through the global food production line, most food products finally reach their ultimate destination: the proverbial plate. Food consumption patterns largely dictate trends in food production through market response mechanisms, while consumption practices affect environmental and social outcomes.
CONSUMPTION PATTERNSConsumption patterns describe both the types and quantities of food consumed. The evolution of these patterns is constrained by food availability and prices. As countries develop, food expenditures tend to decline as a fraction of total household expenses. For example, in the U.S. and U.K., food budgets constitute an average of 10% of household costs. In many developing countries, food expenses remain a much larger percentage – for example, 70% in Tanzania and 45% in Pakistan (UNEP, 2012).
In addition to prices determining the amount of food consumed, prices for different types of foods also affect dietary choices. Higher incomes and a lower fraction of income spent on food are associated with a shift towards a more nutritionally diverse diet and replacement of grains with animal products (Regmi, 2001). Within the boundaries of food availability and price, consumption patterns are largely determined by social, personal, cultural preferences and by knowledge.
CONSUMPTION QUANTITIESAverage caloric intake varies widely across the least developed, developing, and industrialized countries, amounting to 2,120, 2,640, and 3,430 kilocalories per person per day respectively in 2011 (FAO, 2011). Most regions in the world have access to a sufficient supply of calories. However, calorie intake remains far below the recommended daily amount in certain communities, particularly in South Asia and Sub-Saharan Africa. Roughly one third of Indians and 44% of those living in Sub-Saharan Africa continue to suffer from undernourishment (UNEP, 2012). On the other hand, in the developed world, there is an increasing amount of over-consumption, especially in regard to protein (Forum for the Future, 2014).
Simultaneously, there is an increasing number of overweight individuals, both in developing and developed countries. Nearly 2.5 times as many people are overweight as undernourished, with cases of severe overweight (obesity) rising in parallel. There are a number of factors contributing to rising obesity rates, including food prices. In the United States and many other countries, crops like corn, soy, and wheat are subsidized, while fruit, vegetables and nuts are not (Mortazavi, 2011). While prices for carbonated sodas (made with corn syrup) fell between 1980 and 2010, prices for fruits and vegetables rose (Powell, Chriqui, Khan, Wada, & Chaloupka, 2013). Processed foods are typically less expensive than fresh foods because they largely consist of cheap (often subsidized) ingredients such as grains, sugar, and oil. These foods also contain more calories when compared to their mass and nutritional value. Figure 11 illustrates how unevenly the mass of food consumed translates into caloric value. Consumption quantities and their surrounding trends are further discussed in sections 2.2 and 3.2.2.
PROCESSING TRADE RETAIL CONSUMPTIONPRODUCTION WASTE
Between 1950 and 2009, consumption of animal
products doubled. If the trend continues,
global animal protein consumption will
quadruple by 2050.
Roughly 1/3 of Indians and 44% of those living in Sub-
Saharan Africa suffer from undernourishment.
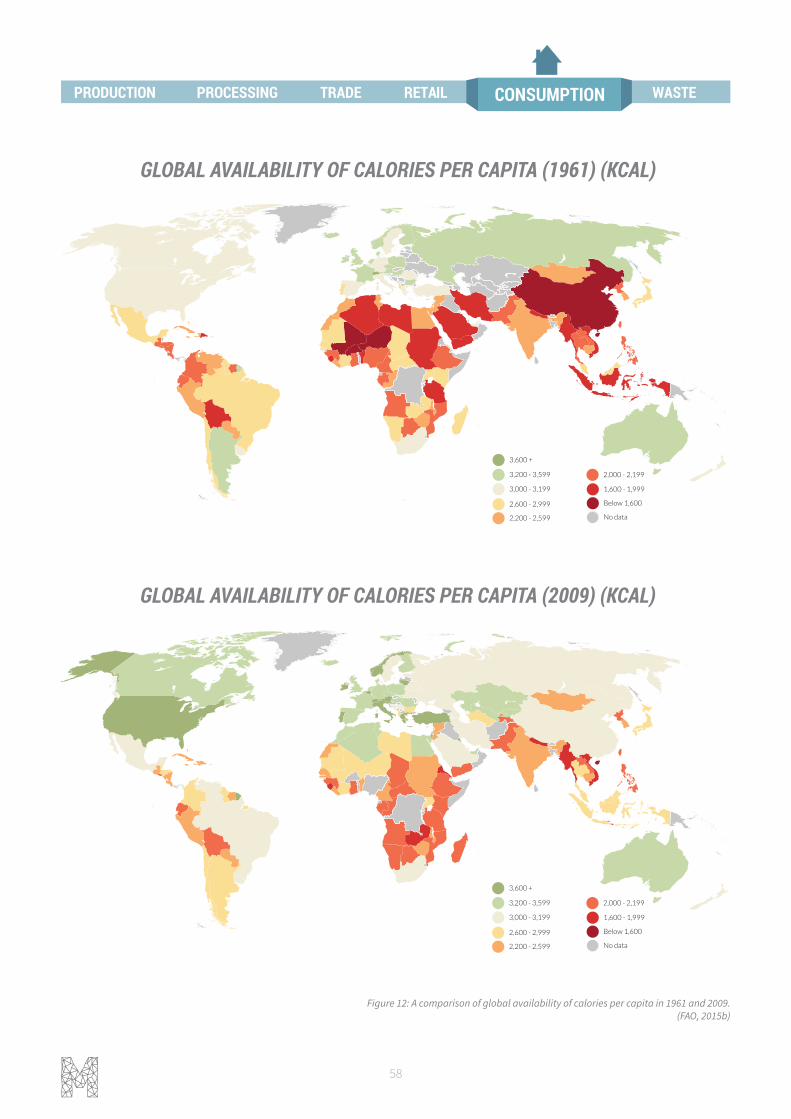
58
C
2,600 - 2,999
3,000 - 3,199
3,200 - 3,599
3,600 +
2,200 - 2,599
2,000 - 2,199
1,600 - 1,999
Below 1,600
No data
GLOBAL AVAILABILITY OF CALORIES PER CAPITA (1961) (KCAL)
C
2,600 - 2,999
3,000 - 3,199
3,200 - 3,599
3,600 +
2,200 - 2,599
2,000 - 2,199
1,600 - 1,999
Below 1,600
No data
2009GLOBAL AVAILABILITY OF CALORIES PER CAPITA (2009) (KCAL)
Figure 12: A comparison of global availability of calories per capita in 1961 and 2009. (FAO, 2015b)
PROCESSING TRADE RETAIL CONSUMPTIONPRODUCTION WASTE
THE GLOBAL FOOD SYSTEM: AN ANALYSIS 59
01 CURRENT STATE
NUTRITIONAL QUALITY The composition of diets and quality of nutrition varies globally. Most high-calorie countries have high intakes of nutritionally insubstantial sugar and sweeteners, with North America ranking highest with 15% of calories coming from this category. Moreover, almost all high-calorie regions obtained more than 10% of their calories from meat, whereas low calorie regions obtained less than 5% of their calories from meat (FAO, 2011). Rising incomes and purchasing power results in a nutrition transition, with the largest impact being an increased amount of consumption of animal protein. Between 1950 and 2009, consumption of animal products doubled. If the trend continues, global animal protein consumption will quadruple by 2050, compared to 1950s levels (Nellemann, 2012).
Humans require a large volume of macronutrients such as protein, carbohydrates, and fats for growth, development, energy provision, and many other vital functions. Additionally, there are a large number of micronutrients which are necessary in smaller amounts, including other essential vitamins and minerals. Over- or under-consumption of vitamins and minerals can lead respectively to toxicity or deficiency. While nutritional deficiencies are often coupled with undernourishment, it is possible to consume a sufficient amount of calories and still suffer from a lack of important micro-nutrients. The most prevalent deficiencies of vitamin A, iron, iodine, and zinc in the diet, contribute to an estimated 19% of childhood deaths and 6% of DALYs (disability-adjusted life years) (Black, 2003).
Although there is an indication for increasing conscious and healthy food choices by some consumers, this is a small dynamic in the context of general consumer choices around the world. The concept of the healthiness of food varies across cultures, and geographic regions. When considering consumer perceptions of healthiness more broadly, there are a few key points that influence their purchasing behaviour. For one, consumers may not be educated on what types of foods are healthy. Low levels of literacy and general education reduce the ability to understand nutritional labeling and thus the ability to make informed consumption choices (Wagner, 2014).
FOOD PREPARATIONIn addition to the quantity and quality of foods that are consumed, methods of preparing and storing food are important for overall outcomes of the food system. The process of cooking is important for a number of reasons such as sterilizing harmful bacteria and other microorganisms, removing toxins, and increasing the availability of certain nutrients (Carmody, Weintraub, & Wrangham, 2012; Miglio, Chiavaro, Visconti, Fogliano, & Pellegrini, 2008). At the same time, cooking requires energy, contributing to emissions due to electricity production, and other fuels like wood and gas (Hager & Morawicki, 2013). Around 2.7 billion people rely on burning biomass for cooking globally, leading to further air emissions and health problems for those cooking indoors (IEA, 2014).
The bioavailability of protein is commonly measured by the percentage of nitrogen present that is retained (referred to as the biological value) and varies by source between around 60-70%. Plant-based sources generally have a lower biological value than animal-derived products, requiring a higher volume of protein consumption to ensure an adequate nitrogen balance (Reeds & Garlick, 2003). Proteins are denatured by heat, making them more easily digested by humans when cooked. Proper processing and cooking methods can also decrease anti-nutrients such as phytate, polyphenols, and oxalate, which reduce absorption of nutrients, while also increase bioavailability by freeing nutrients from chemical compounds. Such processing and cooking methods include thermal processing (boiling, steaming), mechanical processing (pounding), soaking, fermentation, and germination (Hotz & Gibson, 2007).
In some instances however, cooking may reduce the nutritional value as a result of losses and changes in major nutrients, including proteins, carbohydrates, minerals and vitamins (FAO, 1990). In particular, cooking in water or oil which is then drained off and not consumed removes a large portion of nutrients, varying between 35-70% for different nutrients and raw foods (United States Department of Agriculture, 2007).
PROCESSING TRADE RETAIL CONSUMPTIONPRODUCTION WASTE

60
A view of a typical landfill, where most food waste is likely to end up.
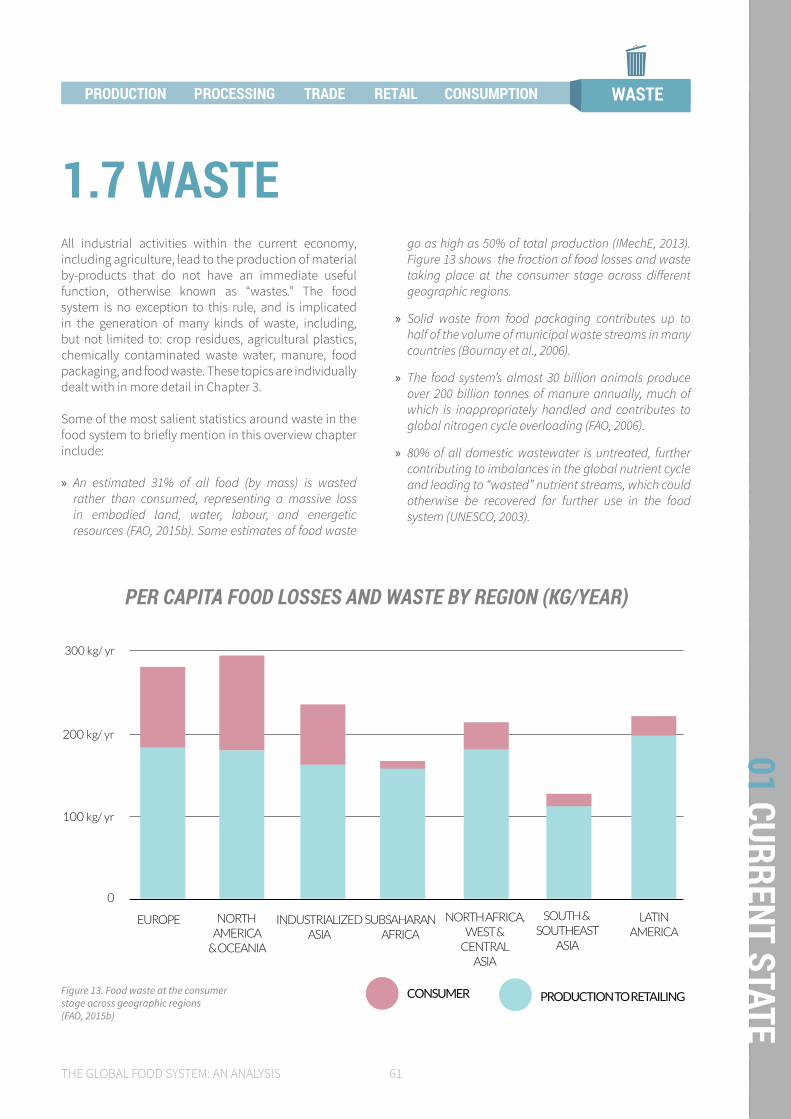
THE GLOBAL FOOD SYSTEM: AN ANALYSIS 61
01 CURRENT STATE
All industrial activities within the current economy, including agriculture, lead to the production of material by-products that do not have an immediate useful function, otherwise known as “wastes.” The food system is no exception to this rule, and is implicated in the generation of many kinds of waste, including, but not limited to: crop residues, agricultural plastics, chemically contaminated waste water, manure, food packaging, and food waste. These topics are individually dealt with in more detail in Chapter 3.
Some of the most salient statistics around waste in the food system to briefly mention in this overview chapter include:
» An estimated 31% of all food (by mass) is wasted rather than consumed, representing a massive loss in embodied land, water, labour, and energetic resources (FAO, 2015b). Some estimates of food waste
go as high as 50% of total production (IMechE, 2013). Figure 13 shows the fraction of food losses and waste taking place at the consumer stage across different geographic regions.
» Solid waste from food packaging contributes up to half of the volume of municipal waste streams in many countries (Bournay et al., 2006).
» The food system’s almost 30 billion animals produce over 200 billion tonnes of manure annually, much of which is inappropriately handled and contributes to global nitrogen cycle overloading (FAO, 2006).
» 80% of all domestic wastewater is untreated, further contributing to imbalances in the global nutrient cycle and leading to “wasted” nutrient streams, which could otherwise be recovered for further use in the food system (UNESCO, 2003).
PER CAPITA FOOD LOSSES AND WASTE BY REGION (KG/YEAR)
300 kg/ yr
200 kg/ yr
100 kg/ yr
EUROPE
CONSUMER PRODUCTION TO RETAILING
NORTH AMERICA
& OCEANIA
INDUSTRIALIZEDASIA
SUBSAHARANAFRICA
NORTH AFRICA,WEST &
CENTRALASIA
SOUTH & SOUTHEAST
ASIA
LATINAMERICA
0
Figure 13. Food waste at the consumer stage across geographic regions(FAO, 2015b)
1.7 WASTE
PROCESSING TRADE RETAILPRODUCTION WASTECONSUMPTION

62
02 TRENDS AND BEHAVIOUR
0102
0304
05
Sunrise in Peachy Canyon vineyard in California.Creative Commons: Malcolm Carlaw
64
The enormity of the food system is plainly apparent from the data presented in the previous chapter. Since World War II, the system has tripled its output across many categories of foods to keep pace with population growth and changes in food demand patterns (FAO, 2015b). As we discuss in more detail in Chapter 3, the continued increase in resource throughput accompanying this expansion has placed ever greater stresses on both the biophysical resource base of the food system as well as the people and animals influenced by it.
In this chapter we present some of the trends and underlying dynamics of the food system in order to better understand how its current shape and direction have evolved. The resource flows linked to the different aspects of the food system have not all grown uniformly. With regards to some parameters (land, greenhouse gas emissions) the food system has gotten much more efficient (though absolute throughput has still increased), whereas with regards to other parameters (pesticides, fertilizers), the food system has gotten much more resource-intensive over the period examined, with some recent signs of increased efficiency. In addition to looking at the quantifiable outcomes of the food system’s activities (food production, resource consumption), we also examine a few of the driving trends (population, GDP) and emergent behaviours (intensification, consolidation) that have shaped the system and characterise its current functioning.
In the discussion section at the end of this chapter, we further look at the implications of the food system’s current trajectory for the coming decades using the FAO’s business as usual projections for 2050 as a starting point. Despite its current enormity, the food system is poised for continued expansion due to projected increases in population growth and wealth. This projected increase in demand raises critical questions regarding limits to the system’s expansion under its historic model of development.
KEY MESSAGES:
» Global food and agricultural production have increased significantly since the end of WWII spurred by a combination of population and economic growth along with technological and cultural shifts in production practices. The amount of food produced per area of land (yield) has steadily increased, demonstrating an emphasis on increasing agricultural output per unit of land area.
» The Green Revolution played a significant role in establishing intensive agricultural production methods globally and shaping the reigning philosophies in mainstream agricultural practice. Though widely credited with helping avert anticipated large-scale food shortages in the post-WWII era, the intensification practices brought on by the Green Revolution have also been critiqued for driving ecological degradation and entrenching dependency on non-renewable resources like fossil fuels.
» There is more food produced today per person than ever recorded. Both calories and grams of protein per capita have steadily increased since the 1950s.
» Growth in yields has begun to slow in recent decades, with annual yield increases in cereal crops now growing on average at half the rate necessary to reach a (potentially necessary) doubling of food production by 2050. The genetic potential of major crops is being reached and land degradation as well as lack of investment in low-producing regions is leading to overall yield declines.
» There is enormous global variability in yield, and the global yield gap between the most and least productive farms globally has increased dramatically since the 1950s.
2.0
INTR
ODUC
TION
THE GLOBAL FOOD SYSTEM: AN ANALYSIS 65
02 TRENDS & BEHAVIOUR
» The food system’s absolute resource use (water, pesticides, fertilizer, energy) has increased significantly over the period evaluated. However, resource intensity per unit of food output has been improving for certain resources. Emissions intensity measured in tonnes of CO2 eq. per tonne of food has decreased. Fertilizer and pesticide intensity have more recently begun to show signs of decline as well. These are indications that the system is becoming more efficient as it expands.
» Key trends that have been driving the expansion pattern and structure of the food system include increases in global population, wealth, and urbanisation. These increases are associated with changes in consumer dietary preferences, which have led to the increased complexity and resource-intensity of average diets.
» Policy-supported trends have also led to structural shifts within the food system. Notably, demand for non-food uses of crops, particularly biofuels and biomaterials, is putting significant pressure on the resource base needed to support continued food production.
» The food system exhibits several large scale behavioral trends including intensification, consolidation, specialisation, and regionalisation. As evidenced in steadily increasing yields, intensive practices now define much of the food system. Control of the system has consolidated onto a handful of actors in production, processing, and retail. Intra-regional trade now encompasses the majority of international trade, indicating a slow-down in the effect of globalisation towards a more regional model.
» Funding for agricultural research and development is not evenly distributed across nations or production methods. This has allowed certain nations and regions to improve, while many low-income nations are excluded. Similarly, funding has been prescriptive in developing specific production methods, allocating little opportunity or funding for alternative practices to take hold.
» A slowly growing counter-movement to the intensive practices brought on by the Green
Revolution has begun to emerge in the form of alternative, lower-impact agricultural systems. However, these practices still make up a small minority of agricultural production worldwide and are generally under-researched. New practices and food processing techniques (advanced greenhouse horticulture, symbiotic agricultural systems like aquaponics, agroecological practices, vertical urban farming, alternative and synthetic protein products), present a small, but promising frontier for food system innovation.
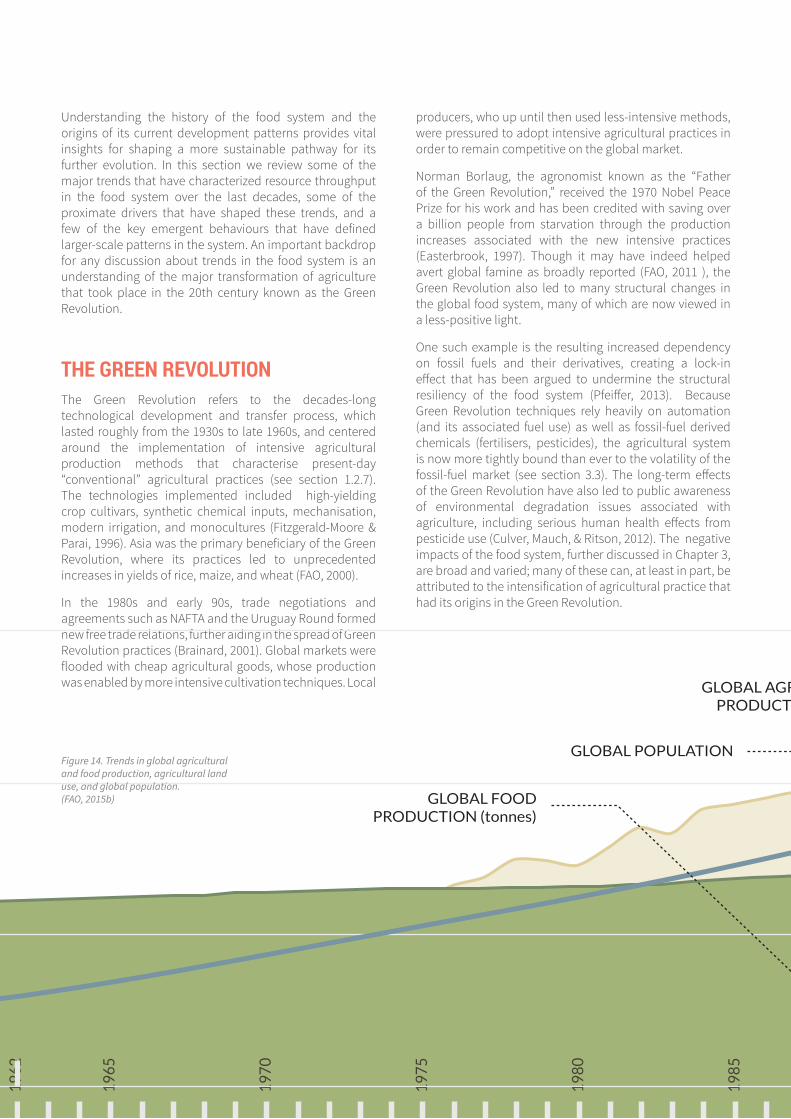
66
Understanding the history of the food system and the origins of its current development patterns provides vital insights for shaping a more sustainable pathway for its further evolution. In this section we review some of the major trends that have characterized resource throughput in the food system over the last decades, some of the proximate drivers that have shaped these trends, and a few of the key emergent behaviours that have defined larger-scale patterns in the system. An important backdrop for any discussion about trends in the food system is an understanding of the major transformation of agriculture that took place in the 20th century known as the Green Revolution.
THE GREEN REVOLUTIONThe Green Revolution refers to the decades-long technological development and transfer process, which lasted roughly from the 1930s to late 1960s, and centered around the implementation of intensive agricultural production methods that characterise present-day “conventional” agricultural practices (see section 1.2.7). The technologies implemented included high-yielding crop cultivars, synthetic chemical inputs, mechanisation, modern irrigation, and monocultures (Fitzgerald-Moore & Parai, 1996). Asia was the primary beneficiary of the Green Revolution, where its practices led to unprecedented increases in yields of rice, maize, and wheat (FAO, 2000).
In the 1980s and early 90s, trade negotiations and agreements such as NAFTA and the Uruguay Round formed new free trade relations, further aiding in the spread of Green Revolution practices (Brainard, 2001). Global markets were flooded with cheap agricultural goods, whose production was enabled by more intensive cultivation techniques. Local
producers, who up until then used less-intensive methods, were pressured to adopt intensive agricultural practices in order to remain competitive on the global market.
Norman Borlaug, the agronomist known as the “Father of the Green Revolution,” received the 1970 Nobel Peace Prize for his work and has been credited with saving over a billion people from starvation through the production increases associated with the new intensive practices (Easterbrook, 1997). Though it may have indeed helped avert global famine as broadly reported (FAO, 2011 ), the Green Revolution also led to many structural changes in the global food system, many of which are now viewed in a less-positive light.
One such example is the resulting increased dependency on fossil fuels and their derivatives, creating a lock-in effect that has been argued to undermine the structural resiliency of the food system (Pfeiffer, 2013). Because Green Revolution techniques rely heavily on automation (and its associated fuel use) as well as fossil-fuel derived chemicals (fertilisers, pesticides), the agricultural system is now more tightly bound than ever to the volatility of the fossil-fuel market (see section 3.3). The long-term effects of the Green Revolution have also led to public awareness of environmental degradation issues associated with agriculture, including serious human health effects from pesticide use (Culver, Mauch, & Ritson, 2012). The negative impacts of the food system, further discussed in Chapter 3, are broad and varied; many of these can, at least in part, be attributed to the intensification of agricultural practice that had its origins in the Green Revolution.
19
62
19
65
19
70
19
75
19
80
19
85
19
90
19
95
20
00
20
05
20
10
GLOBAL AGRICULTURALPRODUCTION (tonnes)
GLOBAL POPULATION
GLOBAL AGRICULTURALLAND USE (hectares)
GLOBAL FOOD PRODUCTION (tonnes)
4 BILLION
6 BILLION
2 BILLION
8 BILLION
Figure 14. Trends in global agricultural and food production, agricultural land use, and global population.(FAO, 2015b)

THE GLOBAL FOOD SYSTEM: AN ANALYSIS 67
02 TRENDS & BEHAVIOUR
It is likely that without the Green Revolution, the food system would not have been capable of undergoing the expansion that we have witnessed since the end of World War II, which has largely underpinned global capacity for providing an uninterrupted food supply for a growing, wealthier population.
Agriculture now occupies 38% of global land, consumes 69% of global fresh water withdrawals, and uses 30% of the world’s primary energy each year (AQUASTAT, 2014; FAO, 2012a; The World Bank, 2014a). In this section we survey some of the most evident physical trends that have accompanied the expansion of the food system to its current state, both in terms of absolute growth and relative efficiency. First we focus on the “outcome trends;” those that are often seen as performance metrics of the food system, rather than those that have been driving the changes at hand.
FOOD PRODUCTIONThe amount of food produced globally more than tripled from 1961 - 2011, growing at an average rate of 2.30% per year. In 2011, 4.54 billion tonnes of food were produced (FAO, 2015b). In this time period, global meat and crop production more than tripled, growing to 205% and 209% above 1961 levels respectively, while global fisheries output quintupled (416%). Meat, crops, and fisheries production had annual growth rates of 2.26%, 2.28% and 3.34% respectively. Though meat and fisheries production have increased significantly, their collective share of production has remained relatively stable at around 25%. Fisheries, individually, have increased in share of production from 1.8% in 1961 to 3.1% in 2011 (FAO, 2015b).
19
62
19
65
19
70
19
75
19
80
19
85
19
90
19
95
20
00
20
05
20
10
GLOBAL AGRICULTURALPRODUCTION (tonnes)
GLOBAL POPULATION
GLOBAL AGRICULTURALLAND USE (hectares)
GLOBAL FOOD PRODUCTION (tonnes)
4 BILLION
6 BILLION
2 BILLION
8 BILLION
2.1 OUTCOME TRENDS
GLOBAL AGRICULTURAL PRODUCTION, LAND USE, AND POPULATION BETWEEN 1961 AND 2009
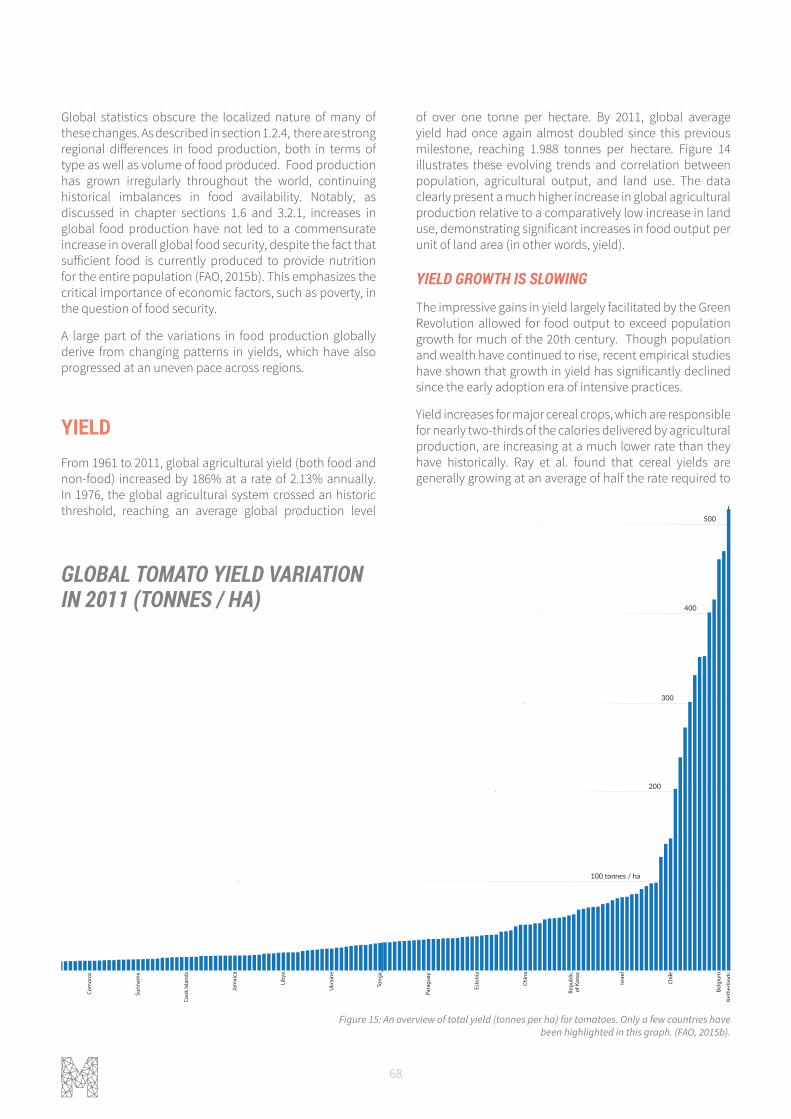
68
Global statistics obscure the localized nature of many of these changes. As described in section 1.2.4, there are strong regional differences in food production, both in terms of type as well as volume of food produced. Food production has grown irregularly throughout the world, continuing historical imbalances in food availability. Notably, as discussed in chapter sections 1.6 and 3.2.1, increases in global food production have not led to a commensurate increase in overall global food security, despite the fact that sufficient food is currently produced to provide nutrition for the entire population (FAO, 2015b). This emphasizes the critical importance of economic factors, such as poverty, in the question of food security.
A large part of the variations in food production globally derive from changing patterns in yields, which have also progressed at an uneven pace across regions.
YIELDFrom 1961 to 2011, global agricultural yield (both food and non-food) increased by 186% at a rate of 2.13% annually. In 1976, the global agricultural system crossed an historic threshold, reaching an average global production level
of over one tonne per hectare. By 2011, global average yield had once again almost doubled since this previous milestone, reaching 1.988 tonnes per hectare. Figure 14 illustrates these evolving trends and correlation between population, agricultural output, and land use. The data clearly present a much higher increase in global agricultural production relative to a comparatively low increase in land use, demonstrating significant increases in food output per unit of land area (in other words, yield).
YIELD GROWTH IS SLOWING
The impressive gains in yield largely facilitated by the Green Revolution allowed for food output to exceed population growth for much of the 20th century. Though population and wealth have continued to rise, recent empirical studies have shown that growth in yield has significantly declined since the early adoption era of intensive practices.
Yield increases for major cereal crops, which are responsible for nearly two-thirds of the calories delivered by agricultural production, are increasing at a much lower rate than they have historically. Ray et al. found that cereal yields are generally growing at an average of half the rate required to
100 tonnes / ha
200
300
400
500
1.58 tonnes / ha
517 tonnes / ha
GLOBAL TOMATO YIELD VARIATION IN 2011 (TONNES / HA)
Figure 15: An overview of total yield (tonnes per ha) for tomatoes. Only a few countries have been highlighted in this graph. (FAO, 2015b).
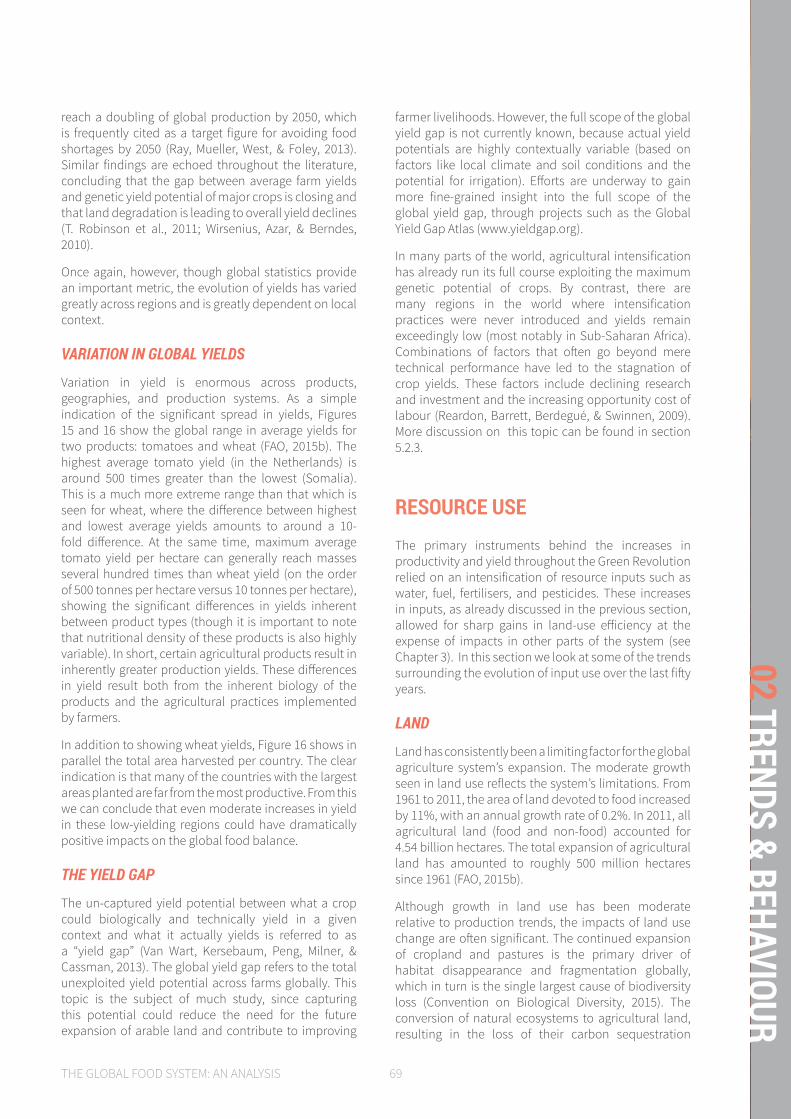
THE GLOBAL FOOD SYSTEM: AN ANALYSIS 69
02 TRENDS & BEHAVIOUR
reach a doubling of global production by 2050, which is frequently cited as a target figure for avoiding food shortages by 2050 (Ray, Mueller, West, & Foley, 2013). Similar findings are echoed throughout the literature, concluding that the gap between average farm yields and genetic yield potential of major crops is closing and that land degradation is leading to overall yield declines (T. Robinson et al., 2011; Wirsenius, Azar, & Berndes, 2010).
Once again, however, though global statistics provide an important metric, the evolution of yields has varied greatly across regions and is greatly dependent on local context.
VARIATION IN GLOBAL YIELDS
Variation in yield is enormous across products, geographies, and production systems. As a simple indication of the significant spread in yields, Figures 15 and 16 show the global range in average yields for two products: tomatoes and wheat (FAO, 2015b). The highest average tomato yield (in the Netherlands) is around 500 times greater than the lowest (Somalia). This is a much more extreme range than that which is seen for wheat, where the difference between highest and lowest average yields amounts to around a 10-fold difference. At the same time, maximum average tomato yield per hectare can generally reach masses several hundred times than wheat yield (on the order of 500 tonnes per hectare versus 10 tonnes per hectare), showing the significant differences in yields inherent between product types (though it is important to note that nutritional density of these products is also highly variable). In short, certain agricultural products result in inherently greater production yields. These differences in yield result both from the inherent biology of the products and the agricultural practices implemented by farmers.
In addition to showing wheat yields, Figure 16 shows in parallel the total area harvested per country. The clear indication is that many of the countries with the largest areas planted are far from the most productive. From this we can conclude that even moderate increases in yield in these low-yielding regions could have dramatically positive impacts on the global food balance.
THE YIELD GAP
The un-captured yield potential between what a crop could biologically and technically yield in a given context and what it actually yields is referred to as a “yield gap” (Van Wart, Kersebaum, Peng, Milner, & Cassman, 2013). The global yield gap refers to the total unexploited yield potential across farms globally. This topic is the subject of much study, since capturing this potential could reduce the need for the future expansion of arable land and contribute to improving
farmer livelihoods. However, the full scope of the global yield gap is not currently known, because actual yield potentials are highly contextually variable (based on factors like local climate and soil conditions and the potential for irrigation). Efforts are underway to gain more fine-grained insight into the full scope of the global yield gap, through projects such as the Global Yield Gap Atlas (www.yieldgap.org).
In many parts of the world, agricultural intensification has already run its full course exploiting the maximum genetic potential of crops. By contrast, there are many regions in the world where intensification practices were never introduced and yields remain exceedingly low (most notably in Sub-Saharan Africa). Combinations of factors that often go beyond mere technical performance have led to the stagnation of crop yields. These factors include declining research and investment and the increasing opportunity cost of labour (Reardon, Barrett, Berdegué, & Swinnen, 2009). More discussion on this topic can be found in section 5.2.3.
RESOURCE USEThe primary instruments behind the increases in productivity and yield throughout the Green Revolution relied on an intensification of resource inputs such as water, fuel, fertilisers, and pesticides. These increases in inputs, as already discussed in the previous section, allowed for sharp gains in land-use efficiency at the expense of impacts in other parts of the system (see Chapter 3). In this section we look at some of the trends surrounding the evolution of input use over the last fifty years.
LAND
Land has consistently been a limiting factor for the global agriculture system’s expansion. The moderate growth seen in land use reflects the system’s limitations. From 1961 to 2011, the area of land devoted to food increased by 11%, with an annual growth rate of 0.2%. In 2011, all agricultural land (food and non-food) accounted for 4.54 billion hectares. The total expansion of agricultural land has amounted to roughly 500 million hectares since 1961 (FAO, 2015b).
Although growth in land use has been moderate relative to production trends, the impacts of land use change are often significant. The continued expansion of cropland and pastures is the primary driver of habitat disappearance and fragmentation globally, which in turn is the single largest cause of biodiversity loss (Convention on Biological Diversity, 2015). The conversion of natural ecosystems to agricultural land, resulting in the loss of their carbon sequestration
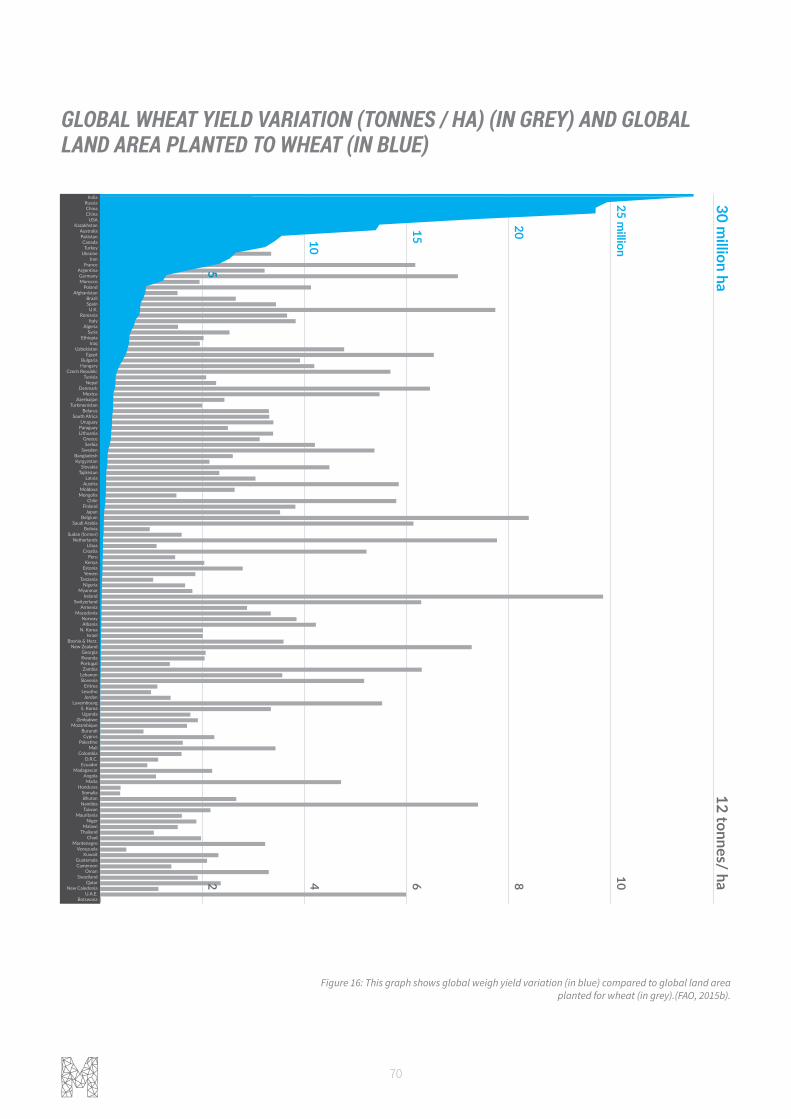
70
IndiaRussiaChinaChina
USAKazakhstan
AustraliaPakistanCanadaTurkey
UkraineIran
FranceArgentinaGermanyMorocco
PolandAfghanistan
BrazilSpain
U.K.Romania
ItalyAlgeria
SyriaEthiopia
IraqUzbekistan
EgyptBulgariaHungary
Czech RepublicTunisiaNepal
DenmarkMexico
AzerbaijanTurkmenistan
BelarusSouth Africa
UruguayParaguayLithuania
GreeceSerbia
SwedenBangladeshKyrgyzstan
SlovakiaTajikistan
LatviaAustria
MoldovaMongolia
ChileFinland
JapanBelgium
Saudi ArabiaBolivia
Sudan (former)Netherlands
LibyaCroatia
PeruKenya
EstoniaYemen
TanzaniaNigeria
MyanmarIreland
SwitzerlandArmenia
MacedoniaNorwayAlbania
N. KoreaIsrael
Bosnia & Herz.New Zealand
GeorgiaRwandaPortugalZambia
LebanonSlovenia
EritreaLesotho
JordanLuxembourg
S. KoreaUganda
ZimbabweMozambique
BurundiCyprus
PalestineMali
ColombiaD.R.C.
EcuadorMadagascar
AngolaMalta
HondurasSomaliaBhutan
NamibiaTaiwan
MauritaniaNiger
MalawiThailand
ChadMontenegro
VenezuelaKuwait
GuatemalaCameroon
OmanSwaziland
QatarNew Caledonia
U.A.E.Botswana
30 million ha
12 tonnes/ ha108642
25 million
201510
5
GLOBAL WHEAT YIELD VARIATION (TONNES / HA) (IN GREY) AND GLOBAL LAND AREA PLANTED TO WHEAT (IN BLUE)
Figure 16: This graph shows global weigh yield variation (in blue) compared to global land area planted for wheat (in grey).(FAO, 2015b).
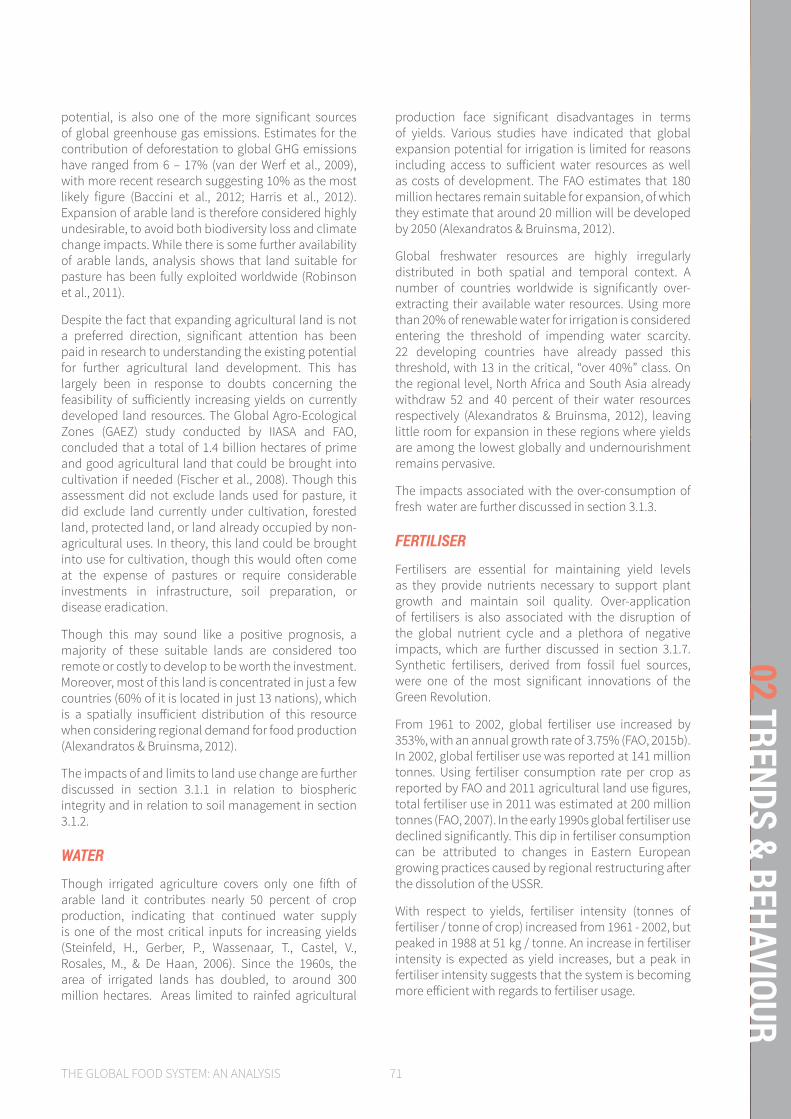
THE GLOBAL FOOD SYSTEM: AN ANALYSIS 71
02 TRENDS & BEHAVIOUR
potential, is also one of the more significant sources of global greenhouse gas emissions. Estimates for the contribution of deforestation to global GHG emissions have ranged from 6 – 17% (van der Werf et al., 2009), with more recent research suggesting 10% as the most likely figure (Baccini et al., 2012; Harris et al., 2012). Expansion of arable land is therefore considered highly undesirable, to avoid both biodiversity loss and climate change impacts. While there is some further availability of arable lands, analysis shows that land suitable for pasture has been fully exploited worldwide (Robinson et al., 2011).
Despite the fact that expanding agricultural land is not a preferred direction, significant attention has been paid in research to understanding the existing potential for further agricultural land development. This has largely been in response to doubts concerning the feasibility of sufficiently increasing yields on currently developed land resources. The Global Agro-Ecological Zones (GAEZ) study conducted by IIASA and FAO, concluded that a total of 1.4 billion hectares of prime and good agricultural land that could be brought into cultivation if needed (Fischer et al., 2008). Though this assessment did not exclude lands used for pasture, it did exclude land currently under cultivation, forested land, protected land, or land already occupied by non-agricultural uses. In theory, this land could be brought into use for cultivation, though this would often come at the expense of pastures or require considerable investments in infrastructure, soil preparation, or disease eradication.
Though this may sound like a positive prognosis, a majority of these suitable lands are considered too remote or costly to develop to be worth the investment. Moreover, most of this land is concentrated in just a few countries (60% of it is located in just 13 nations), which is a spatially insufficient distribution of this resource when considering regional demand for food production (Alexandratos & Bruinsma, 2012).
The impacts of and limits to land use change are further discussed in section 3.1.1 in relation to biospheric integrity and in relation to soil management in section 3.1.2.
WATER
Though irrigated agriculture covers only one fifth of arable land it contributes nearly 50 percent of crop production, indicating that continued water supply is one of the most critical inputs for increasing yields (Steinfeld, H., Gerber, P., Wassenaar, T., Castel, V., Rosales, M., & De Haan, 2006). Since the 1960s, the area of irrigated lands has doubled, to around 300 million hectares. Areas limited to rainfed agricultural
production face significant disadvantages in terms of yields. Various studies have indicated that global expansion potential for irrigation is limited for reasons including access to sufficient water resources as well as costs of development. The FAO estimates that 180 million hectares remain suitable for expansion, of which they estimate that around 20 million will be developed by 2050 (Alexandratos & Bruinsma, 2012).
Global freshwater resources are highly irregularly distributed in both spatial and temporal context. A number of countries worldwide is significantly over-extracting their available water resources. Using more than 20% of renewable water for irrigation is considered entering the threshold of impending water scarcity. 22 developing countries have already passed this threshold, with 13 in the critical, “over 40%” class. On the regional level, North Africa and South Asia already withdraw 52 and 40 percent of their water resources respectively (Alexandratos & Bruinsma, 2012), leaving little room for expansion in these regions where yields are among the lowest globally and undernourishment remains pervasive.
The impacts associated with the over-consumption of fresh water are further discussed in section 3.1.3.
FERTILISER
Fertilisers are essential for maintaining yield levels as they provide nutrients necessary to support plant growth and maintain soil quality. Over-application of fertilisers is also associated with the disruption of the global nutrient cycle and a plethora of negative impacts, which are further discussed in section 3.1.7. Synthetic fertilisers, derived from fossil fuel sources, were one of the most significant innovations of the Green Revolution.
From 1961 to 2002, global fertiliser use increased by 353%, with an annual growth rate of 3.75% (FAO, 2015b). In 2002, global fertiliser use was reported at 141 million tonnes. Using fertiliser consumption rate per crop as reported by FAO and 2011 agricultural land use figures, total fertiliser use in 2011 was estimated at 200 million tonnes (FAO, 2007). In the early 1990s global fertiliser use declined significantly. This dip in fertiliser consumption can be attributed to changes in Eastern European growing practices caused by regional restructuring after the dissolution of the USSR.
With respect to yields, fertiliser intensity (tonnes of fertiliser / tonne of crop) increased from 1961 - 2002, but peaked in 1988 at 51 kg / tonne. An increase in fertiliser intensity is expected as yield increases, but a peak in fertiliser intensity suggests that the system is becoming more efficient with regards to fertiliser usage.
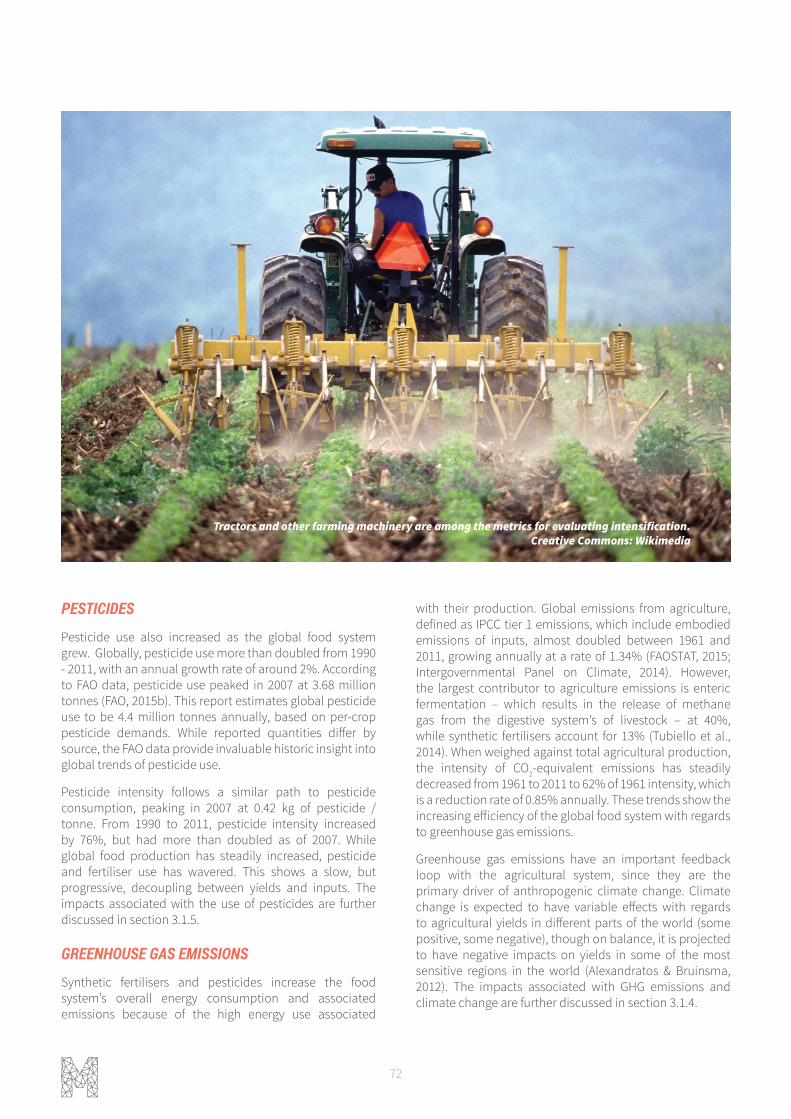
72
Tractors and other farming machinery are among the metrics for evaluating intensification.Creative Commons: Wikimedia
PESTICIDES
Pesticide use also increased as the global food system grew. Globally, pesticide use more than doubled from 1990 - 2011, with an annual growth rate of around 2%. According to FAO data, pesticide use peaked in 2007 at 3.68 million tonnes (FAO, 2015b). This report estimates global pesticide use to be 4.4 million tonnes annually, based on per-crop pesticide demands. While reported quantities differ by source, the FAO data provide invaluable historic insight into global trends of pesticide use.
Pesticide intensity follows a similar path to pesticide consumption, peaking in 2007 at 0.42 kg of pesticide / tonne. From 1990 to 2011, pesticide intensity increased by 76%, but had more than doubled as of 2007. While global food production has steadily increased, pesticide and fertiliser use has wavered. This shows a slow, but progressive, decoupling between yields and inputs. The impacts associated with the use of pesticides are further discussed in section 3.1.5.
GREENHOUSE GAS EMISSIONS
Synthetic fertilisers and pesticides increase the food system’s overall energy consumption and associated emissions because of the high energy use associated
with their production. Global emissions from agriculture, defined as IPCC tier 1 emissions, which include embodied emissions of inputs, almost doubled between 1961 and 2011, growing annually at a rate of 1.34% (FAOSTAT, 2015; Intergovernmental Panel on Climate, 2014). However, the largest contributor to agriculture emissions is enteric fermentation – which results in the release of methane gas from the digestive system’s of livestock – at 40%, while synthetic fertilisers account for 13% (Tubiello et al., 2014). When weighed against total agricultural production, the intensity of CO2-equivalent emissions has steadily decreased from 1961 to 2011 to 62% of 1961 intensity, which is a reduction rate of 0.85% annually. These trends show the increasing efficiency of the global food system with regards to greenhouse gas emissions.
Greenhouse gas emissions have an important feedback loop with the agricultural system, since they are the primary driver of anthropogenic climate change. Climate change is expected to have variable effects with regards to agricultural yields in different parts of the world (some positive, some negative), though on balance, it is projected to have negative impacts on yields in some of the most sensitive regions in the world (Alexandratos & Bruinsma, 2012). The impacts associated with GHG emissions and climate change are further discussed in section 3.1.4.
THE GLOBAL FOOD SYSTEM: AN ANALYSIS 73
02 TRENDS & BEHAVIOUR
2.2 DRIVING TRENDSIn this section, we focus on some of the underlying quantifiable trends that have served as drivers for the growth and transformation of the food system. Many such driving trends can be documented. Here, we focus on four that are broadly considered some of the most significant: the global human population, global human wealth (as measured in GDP), changes in consumer diets, and a significant shift towards the production of biofuels and biomaterials.
POPULATION The vast growth in food and agricultural production can be partially attributed to global population growth. Global population more than doubled between 1961 - 2011, with an annual growth rate of 1.65% (FAOSTAT, 2015). As the food system's ultimate function is to provide adequate nutrition to the world's population, major increases in population challenge the food system to produce enough food to adequately meet demand.
While population increases help drive growth in food production, this does not present the complete picture. Food production has outpaced population growth, with food production per person increasing from 1961 – 2011 at an annual rate of 0.64%. In 2011, there were 669 kilograms of food available per person compared to 487 in 1961, an increase of 37% (FAOSTAT, 2015). By this measure, there is more food available per person globally than ever before. Looking more closely at this trend, the availability of energy from food, measured in kcal per capita per day, increased by 31% from 1961 to 2011 at an annual rate of 0.54%. Similarly, available protein, measured in grams of protein per capita per day, also increased by 31% from 1961 to 2011, growing at an annual rate of 0.54% (FAOSTAT, 2015).
GROSS DOMESTIC PRODUCTProduction growth has also been influenced by growth in global wealth. From 1961 – 2011, global GDP (constant 2005 USD) increased by 461% while per capita GDP (constant 2005 USD) increased by 148% (The World Bank, 2014b). Increased wealth grants populations access to more food both in quantity and diversity (Gerbens-Leenes, Nonhebel, & Krol, 2010). The significant growth seen in food production relative to GDP and population can be partly explained by the combination of growth in
both metrics. The global population is larger and richer than fifty years ago, which has direct implications on food demand patterns and therefore production trends.
CHANGING CONSUMER DIETSThe primary shift in consumption patterns since the 1960s has been a large-scale increase in the throughput of food consumption as a result of increases in population. In addition, as discussed in section 1.6, the past decades have witnessed a global shift towards more complex, processed, and resource-intensive diets. The increase in overall food consumption as well as changes in the composition of the global average diet have been driven by at least three underlying global trends: population growth, urbanisation, and increased wealth.
Global economic trends are driving more people to move to urban areas (Madlener & Sunak, 2011). Urban consumers have access to the global food chain, and thereby a more diverse, nutrient-dense, and resource-intensive diet. Urbanisation is also often followed by increases household income. The process of dietary change has been described to follow two main stages upon the increase in wealth: an “expansion” phase followed by a “substitution phase (Kearney, 2010). The expansion phase is characterised by higher levels of consumption to provide increased caloric input, usually from cheaper, vegetable-based foods. The substitution phase involves a shift from carbohydrate-based staple foods to more desirable and expensive categories of food such as animal products, sugars, and vegetable oils. Between 1950 and 2009, consumption of animal products doubled. If the trend continues, global animal protein consumption will quadruple by 2050, compared to 1950s levels (UNEP, 2012). In addition, average per capital fish consumption increased globally from 9.9 kg
Since the 1950s consumer demand for meat and fish
has roughly doubled.
74
in the 1960s to 19.2 kg in 2012 (FAO, 2014), which has been a notable driver in the unsustainable expansion of fishing fleets (as discussed in section 1.2.3)
As will be discussed in more detail in section 3.2.2, food over-consumption and the related trends of increasing overweight and obesity are now prevalent across both the developed and developing worlds. Obesity is now found in all developing regions, and is growing rapidly, even where hunger exists. In China, the number of overweight people jumped from less than 10% to 15% in just three years. In Brazil and Colombia, the figure hovers around 40%–a level comparable to a number of European countries. Even Sub-Saharan Africa, the region with the highest percentage of undernourishment, is seeing a rise in obesity (FAO, 2012b; Kruger, Puoane, Senekal, & van der Merwe, 2005).
BIOFUELS AND BIOMATERIALS: COMPETING WITH FOODAside from the three primary driving trends discussed above, there are many policy-driven shifts that are dramatically affecting the food system. Though it is beyond the scope of this report to address all of these, one of the dynamics that has recently been impacting crop choice and land use allocation within the food system is policy support for a transition to a biobased economy. In 2011, 7,4% of primary crops and 14,4% of processed crops were diverted to non-food uses, accounting for 11,6% of global arable land use (FAOSTAT, 2015). A majority of these uses can be attributed to biofuel production (Lampe, 2007).
BIOENERGY
Already in 2006, over 50% of Brazil's annual sugar crop was utilized for bioethanol production, while in the EU around 30% of vegetable oil production was diverted to biodiesel manufacturing (Lampe, 2007). This heavy toll in terms of land resource use only displaces a minor fraction of global fuel demand (2,5% in 2010) (Searchinger & Heimlich, 2015).
Based on current policy commitments and subsidy programs targeted at its expansion, production of biofuels is expected to more than double by 2021 over 2011 levels, increasing from around 30 billion gallons of production to around 65 billion gallons (Bastos Lima & Gupta, 2014; Lawrence & Wheelock, 2011). Most of this projected expansion is anticipated in Latin America and Asia.
Though production of biofuels has recently slowed down due to low oil prices, many governments continue to mandate biofuel blending in liquid fuels, which has largely dictated biofuel production levels. Brazilian ethanol blending mandates were recently increased to 27%, though mandates in the United States and European Union are expected to remain stable (OECD & FAO, 2015).
Some institutions have endorsed broader bioenergy goals; the International Energy Agency, for example, recommends a target of 20% of world energy from biomass. Achieving this goal would require the equivalent to the total harvest of all global crop, grass, crop residue, and woody biomass produced in the year 2000, and would, according to estimates by the World Resources Institute, increase the projected 2050 shortfall in food availability by an additional 31% (World Resources Institute, 2013a).
The key feedstocks used for the production of first generation biofuels and biodiesel are food crops, with oil crops serving as the main source of biodiesel, while cereal and sugar crops serve as primary feedstock for bioethanol (U.S. Energy Information Administration, 2012). As such, these first generation biofuels present a source of direct competition for food through the diversion of primarily food products, and the competition for land that could be used for other food production.
For foreseeable decades, projections indicate that the majority of the volume of biofuels will be produced using first-generation technology based on carbohydrate and lipid feedstock (OECD & FAO, 2015). Second generation biofuels, based on cellulose and its derivatives, are generally considered less problematic for food competition because they utilize plant residues that are inedible by humans and occur as agricultural byproducts. However, it is important to note that even agricultural residues can have critical roles to play in sustainable agriculture, for example as animal feed or for the benefits associated with residue retention (IAASTD, 2009).
Achieving the International Energy Agency's supported
target of 20% of world energy from biomass would
require the equivalent of the total crop, grass, crop
residue, and woody biomass production in the year 2000.
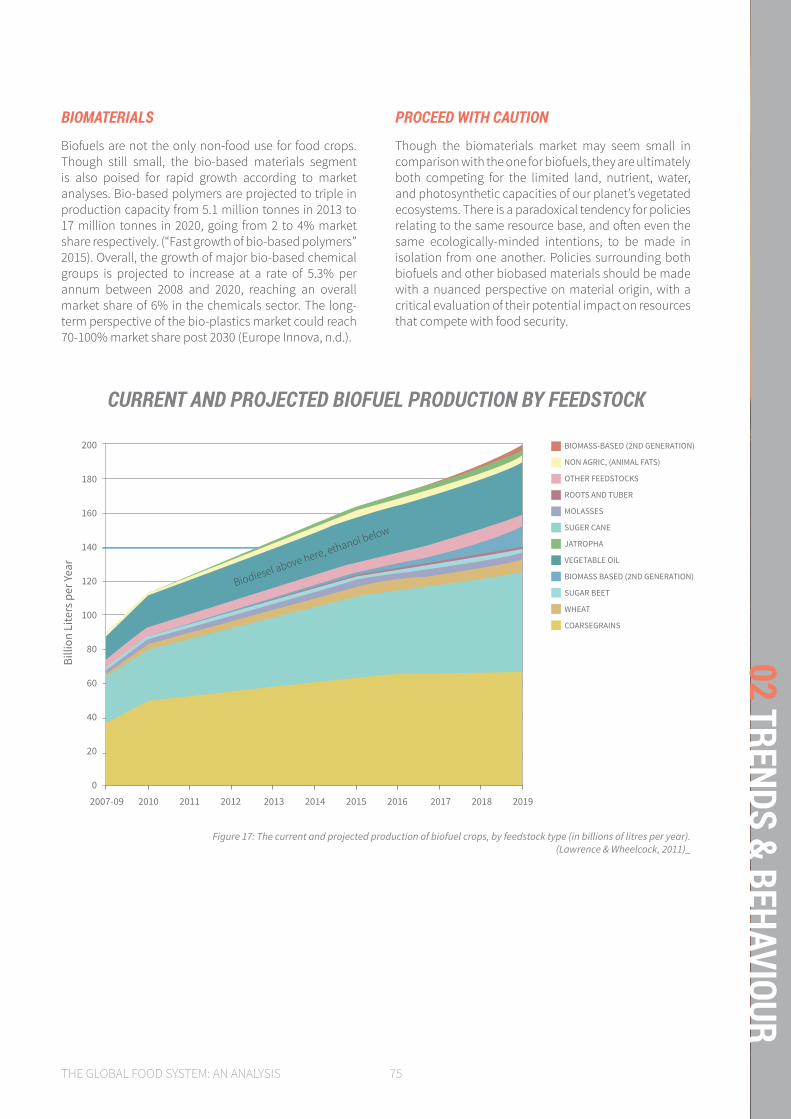
THE GLOBAL FOOD SYSTEM: AN ANALYSIS 75
02 TRENDS & BEHAVIOUR
200
180
160
140
120
100
80
60
40
20
0
2007-09 2010 2011 2012 2013 2014 2015 2016 2017 2018 2019
Current and Projected Biofuel Production by Feedstock
Billi
on L
iters
per
Yea
r
BIOMASS-BASED (2ND GENERATION)
NON AGRIC, (ANIMAL FATS)
OTHER FEEDSTOCKS
ROOTS AND TUBER
MOLASSES
SUGER CANE
JATROPHA
VEGETABLE OIL
BIOMASS BASED (2ND GENERATION)
SUGAR BEET
WHEAT
COARSEGRAINS
Biodiesel above here, ethanol below
Figure 17: The current and projected production of biofuel crops, by feedstock type (in billions of litres per year).(Lawrence & Wheelcock, 2011)_
CURRENT AND PROJECTED BIOFUEL PRODUCTION BY FEEDSTOCK
BIOMATERIALS
Biofuels are not the only non-food use for food crops. Though still small, the bio-based materials segment is also poised for rapid growth according to market analyses. Bio-based polymers are projected to triple in production capacity from 5.1 million tonnes in 2013 to 17 million tonnes in 2020, going from 2 to 4% market share respectively. (“Fast growth of bio-based polymers” 2015). Overall, the growth of major bio-based chemical groups is projected to increase at a rate of 5.3% per annum between 2008 and 2020, reaching an overall market share of 6% in the chemicals sector. The long-term perspective of the bio-plastics market could reach 70-100% market share post 2030 (Europe Innova, n.d.).
PROCEED WITH CAUTION
Though the biomaterials market may seem small in comparison with the one for biofuels, they are ultimately both competing for the limited land, nutrient, water, and photosynthetic capacities of our planet’s vegetated ecosystems. There is a paradoxical tendency for policies relating to the same resource base, and often even the same ecologically-minded intentions, to be made in isolation from one another. Policies surrounding both biofuels and other biobased materials should be made with a nuanced perspective on material origin, with a critical evaluation of their potential impact on resources that compete with food security.
76
2.3 BEHAVIOURSWhen taken together, the trends described in this chapter result in observable, larger-scale “behaviours” that have characterised the identity of the food system. System behaviours are ‘emergent properties,’ arising from the aggregate actions of many different actors within a system. Therefore, a behaviour cannot be linked to single country, company, or moment. Observing these behaviours can provide important clues regarding the underlying rules and structures of the system, which define the overall constraints shaping the system's performance. Some of the underlying structures and rules within the food system are further discussed in Chapter 4 of this report.
Out of the many behaviours of the food system, in this section we highlight intensification, consolidation, and regionalisation. In addition, we discuss how these behaviours have been further entrenched in the system through the agricultural research and development sector. Finally, we briefly touch on the growth in more sustainable agricultural practices, which present a (slowly) growing counter-movement to some of the intensification philosophies introduced through the Green Revolution.
THE INTENSIFICATION OF PRODUCTIONAgricultural intensification can be defined as the increase in agricultural production per input unit. Metrics for evaluating intensification include land, fertiliser and pesticide use, monetary investment, and labour.
The global food system has undergone significant change through the proliferation of intensification. As discussed earlier, yield, fertiliser, and pesticide use per hectare have all increased since 1961. Irrigated surfaces and overall land use have also increased in the same time period (Knudsen
et al., 2006). Similarly the agricultural sector has become increasingly mechanised. The number of tractors used in the agricultural, an indicator for sector mechanisation, more than doubled between 1961 - 2004, growing at an annual rate of 1.6% (FAO, 2015b).
From 1960 to 2000, 70% of the total increase in global crop production in developing nations can be attributed to intensification (FAO, 2002). Increasing production while mitigating expansion in land use directly addresses issues of food security while preventing conversion of ecosystems into farmland; however, these figures mask the growing yield disparities between the world’s most and least productive practices. During the same time of 1950 to 2000 where total food production more than doubled, the gap between the most and least productive systems increased by twenty fold (Knudsen et al., 2006).
Intensification is both a tool and a burden to the global food system. The intensification of agricultural production, associated with the Green Revolution, initially sought to address global issues of food security through improving production methods, but now has embedded intensive agricultural practices into the global food system. It has enabled ‘land saving’ at the costs of other environmental impacts. At its best, intensification can address issues of hunger and food security without encroachment on other land uses or natural ecosystems. At its worst, intensive practices strip soils of key nutrients causing diminishing yields over time, and marginalize populations that cannot compete with high yield practices (Tilman, Cassman, Matson, Naylor, & Polasky, 2002).
CONSOLIDATION WITHIN FOOD PRODUCTION CHAINSThe food system’s growth in size and efficiency is driving actors within the system to keep pace with these trends. If they are able to, actors within the system are incentivised to grow in both size and productivity to out-compete other players. This natural competition yields a trend of consolidation, where those participants most adapted to the system’s dynamism collect the largest market shares.
As intensification helped to increase yields, it has allowed those companies most adept at intensive production practices to flourish in the agricultural sector, resulting in the consolidation of key markets in the hands of a small number of corporations. Consolidation and intensification, combined, have allowed corporations to have prescriptive influence over the global agricultural system, where specific growing practices and crop types dominate markets.
70% of the increase in crop production in developing
nations between years 1960 and 2000 can be attributed
to intensification practices.
THE GLOBAL FOOD SYSTEM: AN ANALYSIS 77
02 TRENDS & BEHAVIOUR
From the data presented in this chapter it becomes clear that there are three major points of consolidation within the food system: production, processing, and distribution. Each of these parts of the agri-food chain has seen large-scale consolidation of market power in the hands of a small number of major corporations.
In the production of agricultural inputs such as seeds and fertilisers, 10 companies own 50% of the global seed market as seen in Figure 18 (Zacune, 2012). Monsanto, in particular, owns 17.5% of the global seed market, with particular dominance in the soy industry where it has a 90% global market share in soy seed. Fertilisers and pesticides have followed similar trends, where large corporations control the majority of the market (Worldwatch Institute, 2013). Lastly, a similar phenomenon has also occurred within the farming sector, where 1% of farms now control 65% of agricultural land. (FAO, 2014). These large farms are an extreme in the spectrum of farm size where many farms are small, low-technology businesses, far removed from the production methods dominating the market.
Processing has consolidated onto agribusinesses – food traders that control food supply chains including transport and processing. Currently, four agribusinesses control 90% of the global grain trade (Murphy, Burch, & Clapp, 2012). Processing is also growing in developing nations. In India, for example, food processing is the fastest growing industrial sector, with the present rupee value of processed foods in India now 1000 times the value in 1960 (Hulse, 2004).
Food retail has seen major consolidation in the past decades as supermarket retailers have established a dominant position in the market. As discussed in section 1.5, 51% of food globally is sold through supermarket chains, much of which is controlled by major market players, namely Walmart (US), Tesco (UK), Costco (US), Carrefour (France) and Kroger (US) (Hulse, 2004). Market globalization has helped to fuel consolidation as these companies establish branches in less competitive international markets, facilitated by a global trend of trade liberalization. Tesco, for example, had a 2.4% increase in total sales in 2004 due to its investment in Asian markets. This is compared to only 0.2% growth
in the UK market in the same year (TESCO, 2015). These large corporations are often welcome in foreign markets, as opening up the market to competition from imports can lower local food prices and improve food availability (FAO, 2012b). Such liberalization, however, can be detrimental to the same communities trade policies seek to benefit.
Food system consolidation can have negative impacts for small farmers who cannot compete with the scale of large agricultural corporations. Likewise, large retailers, producers and processors can sell goods at prices inconsistent with commodity and production inputs, out-competing the smaller farmers and retailers. In developing nations, cheaper goods from outside markets decrease local commodity prices, making them more volatile while damaging local businesses’ revenues. Small retailers are forced out of business, while local farmers are trapped in a poverty cycle (Kearney, 2010). These impacts are discussed in more detail in Chapter 4.
REGIONALISATION OF WORLD TRADEThe food system’s expansion in both size and scope has allowed diverse foods to become more globally available with significant growth in international food trade. From 1986 – 2011, food trade increased 2.3 times in absolute terms due to increases in both total production and trade across borders. While in 1986 only 9% of food produced was traded internationally, that number rose to 13% in 2011. Emerging nations in Latin America, Africa, Asia, and Southeast Asia have driven much of this growth. Though food trade trends suggest market globalisation, they hide a more nuanced picture of regionalisation of food trade and shifting geographies of production (FAO, 2015a).
In the 25 years between 1986 and 2011, intra-regional trade – defined as trade within a global region - increased its share of total international trade from 29 to 42%. The most important driver behind this trend is European political integration (Vicard, 2012). European trade maintained a share of around 30% of world trade throughout this period. However, in the early 1990s Europe shifted much of its trade away from the Atlantic bolstering intra-regional trade. Europe’s inward shift had impacts on the contribution of other regions to global trade. North America in general saw its presence in world trade decrease from 21% to 14%, while Latin American countries gained ground, jumping from 12 to 15% of world trade share. Meanwhile, Southeast Asia increased its share of global trade from 1 to 2%, while Central and South Asia moved from 2 to 3%.
Currently, only 4 agribusinesses control 90%
of the global grain trade.
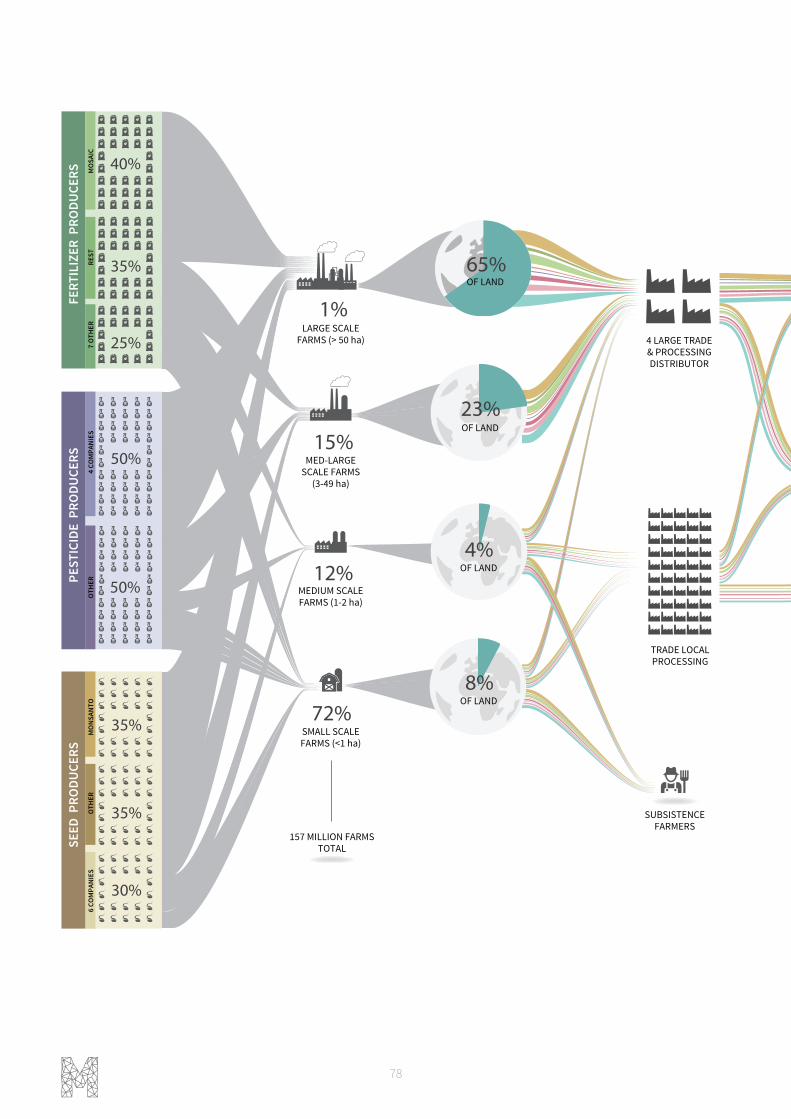
78
157 MILLION FARMSTOTAL
50%
50%
35%
35%
30%
40%
35%
FERT
ILIZ
ER P
RODU
CERS
PEST
ICID
E P
RODU
CERS
SEED
PRO
DUCE
RS
25% 4 LARGE TRADE& PROCESSINGDISTRIBUTOR
10 LARGESTBUYING COMPANIESFOOD & BEVERAGES
SUPERMARKETCHAINS
OTHER FOOD &BEVERAGE COMPANIES
TRADE LOCALPROCESSING
1%
FISH & SEAFOOD (3%)
OILCROPS (6%)
MEATS, MILK, EGGS & ANIMAL FATS (13%)
CEREALS (25%)
STARCHY ROOTS (10%)
SUGAR CROPS (23%)
FRUITS AND VEGETABLES (19%)
PULSES (2%)
MO
NSAN
TOO
THER
4 CO
MPA
NIES
7 O
THER
REST
MO
SAIC
OTH
ER6
COM
PANI
ES
BILLIONCONSUMERS
72%SMALL SCALEFARMS (<1 ha)
12%MEDIUM SCALEFARMS (1-2 ha)
15%MED-LARGE
SCALE FARMS(3-49 ha)
LARGE SCALEFARMS (> 50 ha)
65%OF LAND
23%OF LAND
8%OF LAND
4%OF LAND
SUBSISTENCEFARMERS
SUPERMARKETS& HYPERMARKETS
5.6
OF FOOD45%
OTHER
35.5%OF FOOD
OF FOOD
19.5%
TRADITIONAL

THE GLOBAL FOOD SYSTEM: AN ANALYSIS 79
02 TRENDS & BEHAVIOUR
157 MILLION FARMSTOTAL
50%
50%
35%
35%
30%
40%
35%
FERT
ILIZ
ER P
RODU
CERS
PEST
ICID
E P
RODU
CERS
SEED
PRO
DUCE
RS
25% 4 LARGE TRADE& PROCESSINGDISTRIBUTOR
10 LARGESTBUYING COMPANIESFOOD & BEVERAGES
SUPERMARKETCHAINS
OTHER FOOD &BEVERAGE COMPANIES
TRADE LOCALPROCESSING
1%
FISH & SEAFOOD (3%)
OILCROPS (6%)
MEATS, MILK, EGGS & ANIMAL FATS (13%)
CEREALS (25%)
STARCHY ROOTS (10%)
SUGAR CROPS (23%)
FRUITS AND VEGETABLES (19%)
PULSES (2%)
MO
NSAN
TOO
THER
4 CO
MPA
NIES
7 O
THER
REST
MO
SAIC
OTH
ER6
COM
PANI
ES
BILLIONCONSUMERS
72%SMALL SCALEFARMS (<1 ha)
12%MEDIUM SCALEFARMS (1-2 ha)
15%MED-LARGE
SCALE FARMS(3-49 ha)
LARGE SCALEFARMS (> 50 ha)
65%OF LAND
23%OF LAND
8%OF LAND
4%OF LAND
SUBSISTENCEFARMERS
SUPERMARKETS& HYPERMARKETS
5.6
OF FOOD45%
OTHER
35.5%OF FOOD
OF FOOD
19.5%
TRADITIONAL
Figure 18: An overview of the consolidation at each step in the food chain from inputs to production to retail.(FAO, 2014a; FAO, 2010; OECD Competition Committee, 2010; Nielsen, 2015)
MARKET CONSOLIDATION IN THE GLOBAL FOOD CHAIN
80
Most world regions have also shifted to focus more on intra-regional trade. Trade within Southeast Asia, the U.S. and Canada, Central and South Asia, the Middle East and North Africa, and Sub-Saharan Africa increased between 1986 – 2011, with Latin American countries experiencing the largest increase. These trends towards regionalisation are facilitated by trade agreements such as NAFTA, ASEAN, and Mercosur (FAO, 2012b). East Asia was the only region that moved towards more extra-regional trade.
There are two main ways in which trade has changed in this period, first, most regions, led by Europe, have turned towards their interior; secondly, the Global South has very slowly increased its share of total trade, pulling a greater proportion of trade away from the Atlantic into the Pacific and Indian Oceans (see section 1.4).
RESEARCH AND DEVELOPMENTSubstantive change in the global food system requires nations and regions to critically assess current practices and trends to find means for continuous progress towards multiple goals (food security, sustainability). Investment in agricultural research is vital for ensuring that nations have the means and foresight to meaningfully address their food issues. Funding for agricultural research has generally been increasing, but investments have been highly variable in terms of geographical distribution and timing. Globally, agricultural research saw increased investment between 1981 and 2008, with an annual growth rate hovering around 2% (N. Beintema, Gert-Jan, Keith, & Paul, 2012) (N. M. Beintema & Stads, 2008). While the majority of research spending comes from high-income nations, the majority of growth in spending during this time period came from low and middle-income nations, mainly China, India, and Brazil. Globally, the narrative of research investment is split between high-income and low and middle-income nations.
In 2008, public agricultural research spending as a share of agricultural GDP in high and middle-income nations was at its highest for the 1981 – 2008 time period. High-income nations appropriate significant public funding for agricultural research; however, funding has not been annually consistent, while growth in research investments has stagnated. In OECD nations, funding from all donors to all developing nations for agricultural research ranged from $358 million (2005 USD) to $822 million between 2005 and 2013 (OECD, 2014). Similarly, appropriated funding for agricultural research in the United States from 2002 – 2013 ranged from $1.5 billion to almost $2.2 billion (USDA, 2014a, 2014b). These fluctuations in research investment demonstrate that, while present, public funding from high-income nations is inconsistent in level of commitment from year to year. Such variances in the availability of research funding create uncertainty, especially for research in need of long-term financing, thus hampering progress in the areas that need it most. Although investment in agricultural research by private market actors in high-income nations
has grown recently, it has not reached the levels of funding coming from public institutions and governments. Between 2000 and 2008, global private spending in agricultural research grew by 26%, with high-income nations driving the trend. Still, private spending accounted for only 21% of total research spending in 2008 (Beintema et al., 2012).
In middle and low-income nations, research investment has grown steadily. These nations represented 49% of total global investment in 2008, up from 38% in 1981 (Beintema et al., 2012). China appropriated 4 billion USD in research funding in 2008, a more than 450% increase since 1981. These investments have yielded large national growth in productivity, as China and Brazil have each seen more than 100% productivity growth from 1970 – 2009 (Beintema et al., 2012). However, within this group of countries there are wide disparities: in contrast to middle and high income nations, low-income nations had the lowest share of research spending in 2008 (Beintema et al., 2012). Since low-income nations have the most serious food security issues, bringing investment levels up in these areas, either from outside donors or internally, may yield positive returns similar to those seen in China, India, and Brazil.
While overall financial commitment to research is an important metric, a key concern for agricultural research in both in high-, middle-, and low-income countries, relates to the type of research funded. Historically, the majority of funding for agricultural research and development has been allocated towards improving conventional agricultural practices by emphasizing yield gains through the application of synthetic inputs such as chemical fertilisers. Less funding is appropriated to research exploring alternative practices. In the U.S., certified organic farming systems receive less than 2% of funding from the USDA’s Research, Extension and Education (REE) program (Carlisle & Miles, 2013).
A GROWING COUNTER MOVEMENTIn the past two decades, there has been a rise in production methods that seek to alleviate the impacts of the damaging production practices proliferated by the Green Revolution. Many alternative methods are now practiced including conservation agriculture, organic agriculture, and permaculture, among others. These practices, thus far, have not had nearly the scale of influence over the food system as the Green Revolution’s intensive practices. Organic agriculture currently occupies 0.9% of global agricultural land; conservation tillage occupies 9%, while other practices have marginal representation (Derpsch et al., 2010). While their role is currently small, alternative practices’ representation in the food system is growing (Chappell & LaValle, 2011).
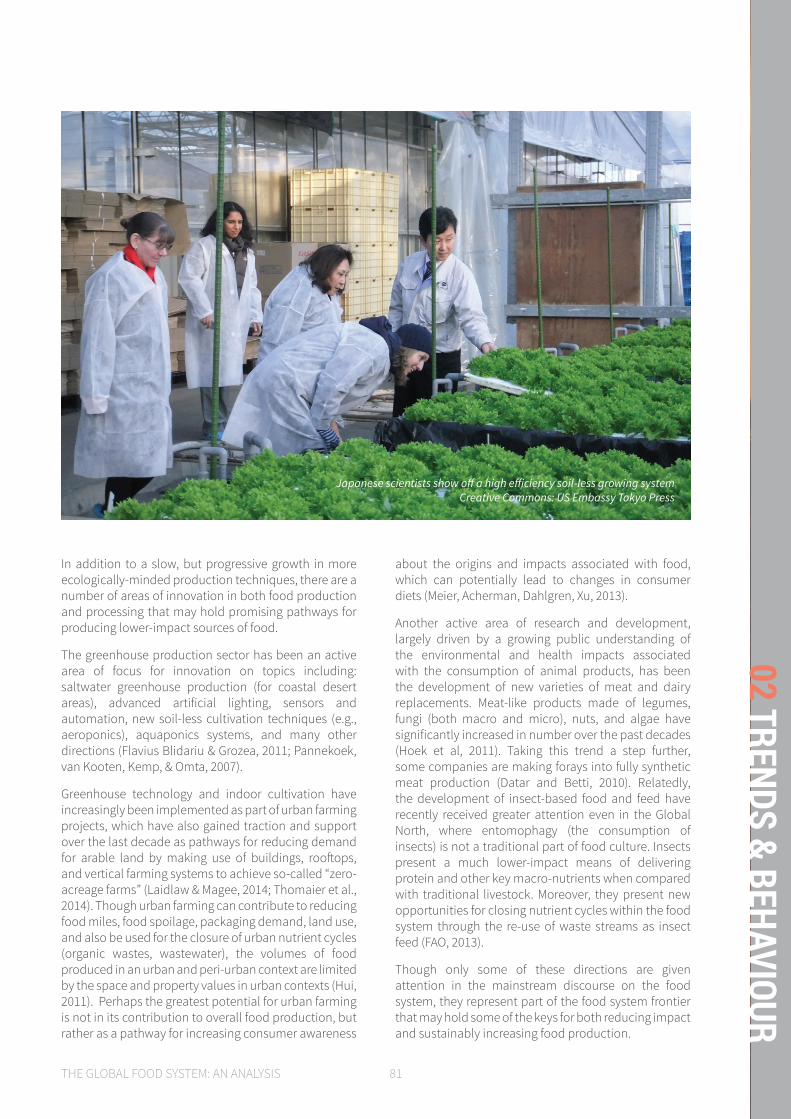
THE GLOBAL FOOD SYSTEM: AN ANALYSIS 81
02 TRENDS & BEHAVIOUR
In addition to a slow, but progressive growth in more ecologically-minded production techniques, there are a number of areas of innovation in both food production and processing that may hold promising pathways for producing lower-impact sources of food.
The greenhouse production sector has been an active area of focus for innovation on topics including: saltwater greenhouse production (for coastal desert areas), advanced artificial lighting, sensors and automation, new soil-less cultivation techniques (e.g., aeroponics), aquaponics systems, and many other directions (Flavius Blidariu & Grozea, 2011; Pannekoek, van Kooten, Kemp, & Omta, 2007).
Greenhouse technology and indoor cultivation have increasingly been implemented as part of urban farming projects, which have also gained traction and support over the last decade as pathways for reducing demand for arable land by making use of buildings, rooftops, and vertical farming systems to achieve so-called “zero-acreage farms” (Laidlaw & Magee, 2014; Thomaier et al., 2014). Though urban farming can contribute to reducing food miles, food spoilage, packaging demand, land use, and also be used for the closure of urban nutrient cycles (organic wastes, wastewater), the volumes of food produced in an urban and peri-urban context are limited by the space and property values in urban contexts (Hui, 2011). Perhaps the greatest potential for urban farming is not in its contribution to overall food production, but rather as a pathway for increasing consumer awareness
about the origins and impacts associated with food, which can potentially lead to changes in consumer diets (Meier, Acherman, Dahlgren, Xu, 2013).
Another active area of research and development, largely driven by a growing public understanding of the environmental and health impacts associated with the consumption of animal products, has been the development of new varieties of meat and dairy replacements. Meat-like products made of legumes, fungi (both macro and micro), nuts, and algae have significantly increased in number over the past decades (Hoek et al, 2011). Taking this trend a step further, some companies are making forays into fully synthetic meat production (Datar and Betti, 2010). Relatedly, the development of insect-based food and feed have recently received greater attention even in the Global North, where entomophagy (the consumption of insects) is not a traditional part of food culture. Insects present a much lower-impact means of delivering protein and other key macro-nutrients when compared with traditional livestock. Moreover, they present new opportunities for closing nutrient cycles within the food system through the re-use of waste streams as insect feed (FAO, 2013).
Though only some of these directions are given attention in the mainstream discourse on the food system, they represent part of the food system frontier that may hold some of the keys for both reducing impact and sustainably increasing food production.
Japanese scientists show off a high efficiency soil-less growing systemCreative Commons: US Embassy Tokyo Press
82
In this chapter, we have examined some of the underlying trends and behaviours that have shaped the current state of the food system. The expansion and intensification of the food system since World War II averted anticipated shortfalls in global food supply, largely by quickly harnessing vast amounts of resources that were previously untapped (fossil fuels and their derivatives, freshwater aquifers).
We now turn to consider what the implications might be of the continuation of this pattern, considering current projections of population growth and wealth increase. Our basis for this discussion is the FAO’s global food demand projections for 2050, which were last updated in 2012.
KEY MESSAGES:
» Past concerns about global capacity to produce sufficient food for a growing human population have historically been disproven by continuous increases in food output, most recently as a result of the intensification techniques brought on by the Green Revolution.
» Projections for continued population growth coupled with declining increases in yields and recent spikes in food prices (largely driven by market factors), have led to renewed concern about the food system’s ability to keep pace with future demand.
» In 2012, the FAO released the latest update of their global food demand projections for 2050. Based on a business-as-usual (BAU) scenario, the FAO projected that by 2050, there will be a 60% increase in food production in mass over 2005/2007 levels. More recent analysis has resulted in claims that as much as a 70 – 100% increase in food production by 2050 is more likely (Ray et al., 2013; World Resources Institute, 2013a).
» To understand the implications of a continued growth trajectory within the food system, we must first have a solid grasp of the food system’s impacts.
2.4
DISC
USSI
ON

THE GLOBAL FOOD SYSTEM: AN ANALYSIS 83
02 TRENDS & BEHAVIOUR
Humanity has long been preoccupied with the perceived limits to producing sufficient food for its growing population. In the late 1700s, scholar Thomas Robert Malthus first published his An Essay on the Principle of Population, postulating that exponential growth in human population was likely to eventually be checked by famine. More recently, Paul Ehrlich's 1968 book, Population Bomb, led to sweeping concern of impending food shortages (Haberman, 2015). As described in this chapter, increases in food production have thus far managed to outpace population growth, most recently as a result of the intensification techniques brought on through the Green Revolution.
However, once again we have reached a moment in history when public doubts are increasingly raised about the food system's ability to continue producing sufficient quantities to feed the growing billions (FAO, 2009). As discussed, this concern has emerged partly because the growth in global yields of staple crops has slowed or even stagnated in many parts of the world, while population continues to grow (Alexandratos & Bruinsma, 2012). As detailed in the next chapter, these concerns are further aggravated by what have been called “unacceptably large” environmental impacts associated with the food system's activities, that may undermine its very basis for functioning (Alexandratos & Bruinsma, 2012).
Simultaneously, market and policy pressures on the food system, which, as already touched on in this chapter, include a range of influences such as bioenergy policies, speculation on food commodities, and regional specialization in cash crops for export, have led to increased price volatility and “food shocks.” Periodic and sudden decreases in yields resulting from, for example, extreme climate events, are expected to steadily increase in frequency over the course of the next century (World Resources Institute, 2013a). Spikes in food prices can disproportionately affect the world's poorest and hungriest denizens, who commonly spend over 50% of their income on food and are thus very sensitive to these fluctuations (Challinor, Elliott, Kent, Lewis, & Wuebbles, 2015). Bearing out this risk, between 2006 and 2008, a combination of rising oil prices and droughts resulted in the “world food price crisis,” which led to riots and social unrest in dozens of countries, and public concerns about the stability of the food supply (FAO, 2011).
Partly in response to some of these concerns, the public, academic, and non-profit sectors have all actively engaged in the discourse around food system
expansion scenarios and the system's potential limits to growth (e.g., Wirsenius et al., 2010; World Resources Institute, 2013). One of the most-commonly referred-to sets of scenarios on this topic is the FAO's periodically updated global food demand projections.
FAO'S PROJECTIONS FOR 2050In 2012, the FAO released the latest update of their global food demand projections for 2050. Based on a business-as-usual (BAU) scenario, the FAO projected that by 2050, there will be a 60% increase in food production in mass over 2005/2007 levels. This extrapolation includes demand shifts as a result of growth in wealth and urbanisation, modeled after past trends witnessed in developed countries. A significant proportion of this increase, which also accounts for the use of crops for animal feed, is projected to derive from a growing demand for animal products. Though the model assumes that global daily average calorie availability will rise significantly (to 3,050 calories per capita per day), 290 million people are still projected to be undernourished by 2050 (FAO, 2012).
To achieve the projected increases in demand, the FAO estimates that global cereal production will need to increase by almost 1 billion tonnes by 2050. Meat consumption per capita is projected rise from 41 kg per capita at present to 52 kg in 2050 (with the largest increase in developing countries, going from 30 to 44 kg per capita), requiring an increase of 470 million tonnes of meat production (FAO, 2012). A majority of these production increases will need to occur in developing countries, necessitating a near doubling of production over current levels in these areas.
It is important to note that since the publication of the FAO's 2012 projections, the United Nations issued an upward revision in population levels projected for 2050 (from 9.15 billion to 9.7 billion, with a disproportionate growth in Sub-Saharan Africa). Moreover, rather than peaking at 9.45 billion and then declining after 2075 (as assumed in the 2012 FAO projections), population is now expected to continue growing to 11.2 billion by 2100 (United Nations, 2015).
Some other key variables that are not fully represented in the FAO models include the impact of climate change on agricultural production and the effects of land allocation to biofuel production (climate change impacts are largely omitted due to uncertainty; land use
LOOKING FORWARD

84
for biofuels is assumed by the FAO to stabilize at 2020 rates). These intentional omissions and emerging discrepancies suggest that latest FAO projections are likely to require significant upward adjustment. Estimates now frequently cited call for a 70 – 100% increase in food production by 2050 (Ray et al., 2013; World Resources Institute, 2013a).
IMPLICATIONS OF CONTINUED GROWTHThere are, broadly speaking, three primary mechanisms for the expansion of cultivated food production: increasing crop yield per unit area, cropping the same land more frequently, and expanding agricultural production onto new land. Over the last decades, developing countries have seen increases in production enabled by these strategies at a relative rate of 71, 6, and 23 percent respectively (Steinfeld, H., Gerber, P., Wassenaar, T., Castel, V., Rosales, M., & De Haan, 2006).
Despite the fact that, as discussed earlier in this chapter, growth in yields has been declining, the FAO still projects this to be the largest source of increases in food production between now and 2050, with 80% of the expansion in food supply by 2050 anticipated to come from yield gains and improvements. The 20% remaining is expected to derive from arable land expansion, primarily in the developing world.
Though the FAO has emphasized that its projections are not intended to be normative guidelines for what “should” be done, but rather merely extrapolations of what is likely based on a BAU scenario, there has nonetheless been some criticism of the policy implications of the FAO's models (Alexandratos & Bruinsma, 2012; Grethe, Dembélé, & Duman, 2011).
The largest critique has been the projections' implicit assumption that the primary strategy for responding to increases in food demand should remain the expansion of global agricultural production, following a similar pattern of intensification and expansion to what has been witnessed in the past handful of decades.
The acceptance of the necessity of growth based on historical trends assumes the continuation and acceptance of many highly undesirable patterns, including: high levels of food waste, continuation of over-consumption and its related health impacts, breaching greenhouse gas emissions boundaries needed to stay within 2⁰C of global warming, crossing biodiversity thresholds through arable land expansion, policy-supported allocation of land to non-food uses such as first generation biofuels, and unsustainably intensive soil and water management practices. Many researchers maintain that strategies focused on reducing food demand and improving economic access to food should be given political priority over default support of expanding production (Grethe et al., 2011).
How can we shape the food system to evolve in such a way that it provides continued access to diversified and nutritious food without encroaching on critical ecological boundaries? Does the food system necessarily need to grow in the coming decades, or, as some researchers suggest, would other measures focused on reducing food demand and improving food distribution be sufficient for reaching its broader objectives? If the food system must grow, then which biophysical boundaries should we absolutely steer it clear of?
Answering these critical questions requires a more nuanced understanding of the food system's impacts; a prerequisite to shaping interventions and policy directions for achieving a sustainable food future.
The companies behind food brands show the extent to which the food chain is consolidated.
Creative Commons: Anthony Albright
THE GLOBAL FOOD SYSTEM: AN ANALYSIS 85
02 TRENDS & BEHAVIOUR
Creative Commons: Ray From LA

86
Cows grazing in front of an oil refinery.Creative Commons: World Bank Photo Collection

THE GLOBAL FOOD SYSTEM: AN ANALYSIS 87
03 IMPACTS
0102
0304
05

88
The expansion and intensification of the food system that have been discussed in the previous chapter have led to increasing yields and a growth of overall food production. However, at the same time the food system is causing a range of environmental and humanitarian impacts. This chapter provides insight in the magnitude of these impacts, as well as their key drivers. The discussion that follows with regards to the drivers behind key impacts of the food system, focusses on direct causal relationships between drivers and impacts at the global level. Thus it provides a clear overview of the way in which the food system impacts environmental and social issues that have sparked wide international concern, ranging from biodiversity loss and climate change, to hunger and poverty. For purposes of clarity, the key impacts are discussed in this chapter as if they were points; caused by something, a final consequence. This is, of course, a simplification of reality. As Figure 19 illustrates, the set of impacts discussed in this chapter are interrelated, biophysical impacts such as climate change influence other impacts in turn (e.g. biodiversity or food security).These issues are reflected upon in more detail in the discussion at the end of this chapter.
KEY MESSAGES » The food system is the primary driver of several key environmental impacts that are
leading to the transgression of the planetary boundaries. Based on an analysis of the global material flow for the reference year 2010, the extraction of biological resources accounted for around 20% of total material extraction by mass. However, this single category of resource extraction accounts for a disproportionate majority of impacts that are leading to planetary boundary transgressions (land use change, water management, release of novel entities into the environment, climate change, biogeochemical cycle displacement, and through all of these driving mechanisms: biodiversity loss). The food system is the primary source of biological resource extraction, and is therefore a disproportionate contributor to overall anthropogenic impact.
» The food system is one of the largest sources of emissions accumulating in environmental “sinks.” The production and dispersion of emissions, novel chemical entities and the large-scale production of waste burden many of the environmental elements and processes that are able to convert and eventually remove pollutants. Food waste and the lack of infrastructure or oversight to avoid it, results in not only higher environmental tolls, but also humanitarian costs such as a lack of food security. Packaging, while reducing food waste, adds to waste streams.
» The available physical resource base for food production cannot expand under current practices to meet the projected needs of the human population by 2050 if we are to remain within the planetary boundary limits. The food system uses land, soils, water, riparian and coastal habitats, nutrients, and many other essential inputs. Most of these key inputs are either fully exploited or projected to become so if current production trends continue.
» A large proportion of the global population is entirely dependent upon the food system for their livelihoods and access to affordable food. For many however, inadequate compensation, unacceptable workingv conditions or unaffordable or low-quality food continue to result from the functioning of the food system.
INTR
ODUC
TION
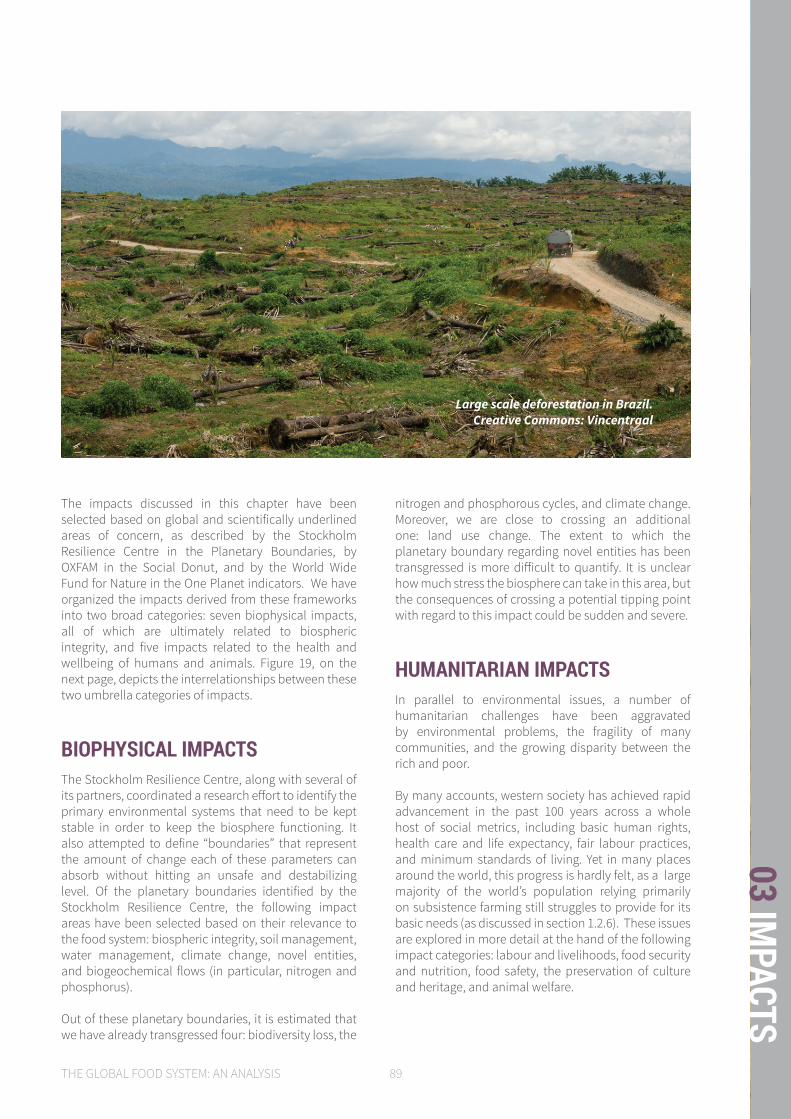
THE GLOBAL FOOD SYSTEM: AN ANALYSIS 89
03 IMPACTS
The impacts discussed in this chapter have been selected based on global and scientifically underlined areas of concern, as described by the Stockholm Resilience Centre in the Planetary Boundaries, by OXFAM in the Social Donut, and by the World Wide Fund for Nature in the One Planet indicators. We have organized the impacts derived from these frameworks into two broad categories: seven biophysical impacts, all of which are ultimately related to biospheric integrity, and five impacts related to the health and wellbeing of humans and animals. Figure 19, on the next page, depicts the interrelationships between these two umbrella categories of impacts.
BIOPHYSICAL IMPACTSThe Stockholm Resilience Centre, along with several of its partners, coordinated a research effort to identify the primary environmental systems that need to be kept stable in order to keep the biosphere functioning. It also attempted to define “boundaries” that represent the amount of change each of these parameters can absorb without hitting an unsafe and destabilizing level. Of the planetary boundaries identified by the Stockholm Resilience Centre, the following impact areas have been selected based on their relevance to the food system: biospheric integrity, soil management, water management, climate change, novel entities, and biogeochemical flows (in particular, nitrogen and phosphorus).
Out of these planetary boundaries, it is estimated that we have already transgressed four: biodiversity loss, the
nitrogen and phosphorous cycles, and climate change. Moreover, we are close to crossing an additional one: land use change. The extent to which the planetary boundary regarding novel entities has been transgressed is more difficult to quantify. It is unclear how much stress the biosphere can take in this area, but the consequences of crossing a potential tipping point with regard to this impact could be sudden and severe.
HUMANITARIAN IMPACTSIn parallel to environmental issues, a number of humanitarian challenges have been aggravated by environmental problems, the fragility of many communities, and the growing disparity between the rich and poor.
By many accounts, western society has achieved rapid advancement in the past 100 years across a whole host of social metrics, including basic human rights, health care and life expectancy, fair labour practices, and minimum standards of living. Yet in many places around the world, this progress is hardly felt, as a large majority of the world’s population relying primarily on subsistence farming still struggles to provide for its basic needs (as discussed in section 1.2.6). These issues are explored in more detail at the hand of the following impact categories: labour and livelihoods, food security and nutrition, food safety, the preservation of culture and heritage, and animal welfare.
Large scale deforestation in Brazil.Creative Commons: Vincentraal

90
3.1 BIOPHYSICAL IMPACTSThe Millennium Ecosystem Assessment of 2005 concluded that changes to ecosystems due to human activities were more rapid in the past 50 years than at any time in human history, increasing the risks of abrupt and irreversible changes (Millennium Ecosystem Assessment, 2005). The food system is identified as one of the most important global drivers of these ecosystem changes. It has monumental impacts on the earth’s finite resources, and is one of the major drivers of biodiversity loss, emissions, and the over-exploitation of freshwater resources. In this section we provide an overview of the main biophysical impacts of the food system. We describe the current state of these impacts globally, highlight the key drivers of the impacts, and discuss their related trends and future outlook.
This section further elaborates on the following impact categories:
3.1.1 BIOSPHERIC INTEGRITY3.1.2 SOIL MANAGEMENT3.1.3 WATER MANAGEMENT3.1.4 CLIMATE CHANGE3.1.5 NOVEL ENTITIES3.1.6 SOLID WASTE3.1.7 BIOGEOCHEMICAL FLOWS
BIOSPHERICINTEGRITY
BIO-GEOCHEMICAL
FLOWS
OCEANACIDIFICATION
CLIMATECHANGE
LAND USECHANGE
NOVELENTITIES
STRATOSPHERICOZONE
DEPLETION
ATMOSPHERICAEROSOLLOADING
FRESHWATER
USE
LIVELIHOODS
FOODSECURITY
HUMAN HEALTH & WELLBEING
_
_
_
_
_
__
_
_ _
__ _
_
__
_
_
_ _
_
__
_
_
_
_
CAUSAL RELATIONSHIPS BETWEEN IMPACT AREAS
Figure 19. A causal loop diagram showing the interrelationship between key impact areas.
(Metabolic)

THE GLOBAL FOOD SYSTEM: AN ANALYSIS 91
03 IMPACTS
3.1.1 Biospheric Integrity
TERRESTRIAL ECOSYSTEMSIn terrestrial ecosystems, deforestation, degradation of forests and other ecosystems, and land conversion for the purpose of agriculture is the single greatest driver of biodiversity loss (Convention on Biological Diversity, 2015).
Natural ecosystems and diverse habitats have been largely replaced with intensive monocropping systems that support just a few species. Currently only 40 crops and 14 livestock species account for 90% of all agricultural production globally (World Wildlife Fund, 2014a). The practice of selective breeding for desirable traits to improve productivity are the major driving forces behind genetic erosion, and seriously threaten long-term food security as the ability for adaptation to change or recovery from external shocks is being greatly reduced (FAO, 2011).
AQUATIC ECOSYSTEMSWith regards to aquatic ecosystems, food production drives biodiversity loss primarily through fishing and habitat destruction. In the last 200 years, overfishing has been documented to cause the extinction of 73 species in marine ecosystems. The loss of an additional 60 species that became extinct in this time period, was attributed to habitat loss and other threats (UNEP, 2012). Destructive fishing practices are a major contributor to
the loss of coral reefs. Together with climate change and pollution, fishing has caused at least 70% of all coral reefs to be threatened or lost (IUCN, 2011).
Species populations in marine ecosystems are shrinking rapidly. The proportion of marine stocks estimated to be under- or moderately exploited declined from 40 percent in the mid-1970s to 12 percent in 2009. In contrast, the proportion of over-exploited, depleted, or recovering stocks increased from 10 percent in 1974 to 30 percent in 2009. Of the marine fish stocks assessed in 2011, fully fished stocks accounted for 61.3% and under fished stocks 9.9% (FAO, 2014b).
Freshwater ecosystems, which host 7 – 10% of all known species, are heavily affected as well (Veron, Patterson, & Reeves, 2008). There is general concensus that the decline and loss of species is far greater in freshwater ecosystems than marine and terrestrial ecosystems (Strayer and Dudgeon, 2010). Freshwater biodiversity is threatened by the food system in a number of ways, including pollution, habitat degradation, over-exploitation, and the introduction of invasive species. The anthropogenic drivers that are anticipated to contribute most to biodiversity loss in these ecosystems are climate-induced changes in water temperature and hydrological infrastructure projects involving irrigation. Fifty percent of global crop production stems from fresh-water-irrigated agriculture (Lake, 2000; Veron et al., 2008).
Human health and wellbeing are fundamentally dependent upon well-functioning ecosystem services, which provide us with, among many things, the food, water, and clean air that are essential for all life. Biospheric integrity is an overarching term that refers to the maintenance of biodiversity as an essential global resource. It is one of the nine planetary boundaries as defined by the Stockholm Resilience Centre. One of its variables is genetic biodiversity, measured through the global extinction rate, which is currently estimated to be ten times higher than the estimated “safe” boundary (Steffen, Richardson, et al., 2015a).
Taken as a whole, the food system is the largest contributor to biodiversity loss globall y. Though it is impossible to accurately quantify the exact contribution of the food system to biodiversity loss, we can evaluate it relative to other sources of ecological impact. Figure 20 is a sankey diagram showing the comparative magnitude of vertebrate biodiversity loss across different ecosystems over the last 50 years. The relative sizes of the lines indicate a rough approximation of how significantly certain drivers have contributed to the overall loss of species in each ecosystem type. The most severely impactful of these drivers (such as habitat loss and wild species extraction), are primarily attributable to activities within the food system. Most of the secondary drivers, which also have severe impact, like climate change and the release of novel entities, are also traceable in large part to food-system-related activities. Despite the absence of exact data, these approximations lead us to conclude with relative confidence that the food system is the single largest contributor to vertebrate biodiversity loss globally, which can be considered a proxy for all biodiversity loss. Within the system, production and extraction activities (agriculture, fisheries, and aquaculture) are the most significant contributors to the transgression of this planetary boundary.

92
Mining
Urban & infraDevelopment
Fuelwood Charcoal
Timber
Uncontrolled Fires
Food chain
Non food
GMO
SalmonShrimp
RapeseedSoy
Oil palm
Rice
Sugarcane
Corn
Whitefish
Tuna
Whitefish
Shrimp
Prawns
SharkNon food
BananaVegetabes
Citrus
EXPLOITATIONFISHING
BYCATCH
HUNTING
AQUACULTURE
DEFORESTATION HABITAT LOSS & DEGRADATION
30% CROPS
70% LIVESTOCK
BIOFUELS
AGRICULTURE
DISEASE
POLLUTION
INVASIVE SPECIES
CLIMATE CHANGE
WEEDS
OTHER
EMISSIONS
FERTILIZER
PESTICIDES
HORMONES
MARINE
FRESHWATER
TERRESTRIAL
TOTAL GLOBAL BIODIVERSITY LOSS
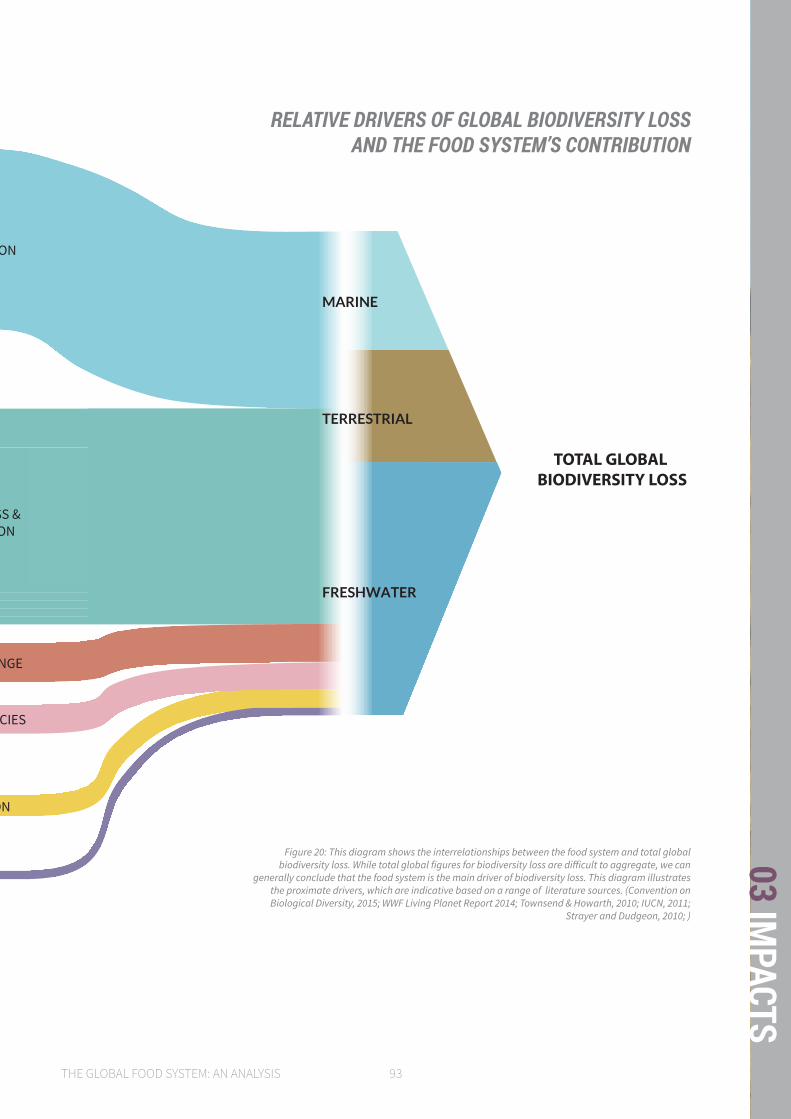
THE GLOBAL FOOD SYSTEM: AN ANALYSIS 93
03 IMPACTS
Mining
Urban & infraDevelopment
Fuelwood Charcoal
Timber
Uncontrolled Fires
Food chain
Non food
GMO
SalmonShrimp
RapeseedSoy
Oil palm
Rice
Sugarcane
Corn
Whitefish
Tuna
Whitefish
Shrimp
Prawns
SharkNon food
BananaVegetabes
Citrus
EXPLOITATIONFISHING
BYCATCH
HUNTING
AQUACULTURE
DEFORESTATION HABITAT LOSS & DEGRADATION
30% CROPS
70% LIVESTOCK
BIOFUELS
AGRICULTURE
DISEASE
POLLUTION
INVASIVE SPECIES
CLIMATE CHANGE
WEEDS
OTHER
EMISSIONS
FERTILIZER
PESTICIDES
HORMONES
MARINE
FRESHWATER
TERRESTRIAL
TOTAL GLOBAL BIODIVERSITY LOSS
Figure 20: This diagram shows the interrelationships between the food system and total global biodiversity loss. While total global figures for biodiversity loss are difficult to aggregate, we can
generally conclude that the food system is the main driver of biodiversity loss. This diagram illustrates the proximate drivers, which are indicative based on a range of literature sources. (Convention on Biological Diversity, 2015; WWF Living Planet Report 2014; Townsend & Howarth, 2010; IUCN, 2011;
Strayer and Dudgeon, 2010; )
RELATIVE DRIVERS OF GLOBAL BIODIVERSITY LOSS AND THE FOOD SYSTEM’S CONTRIBUTION
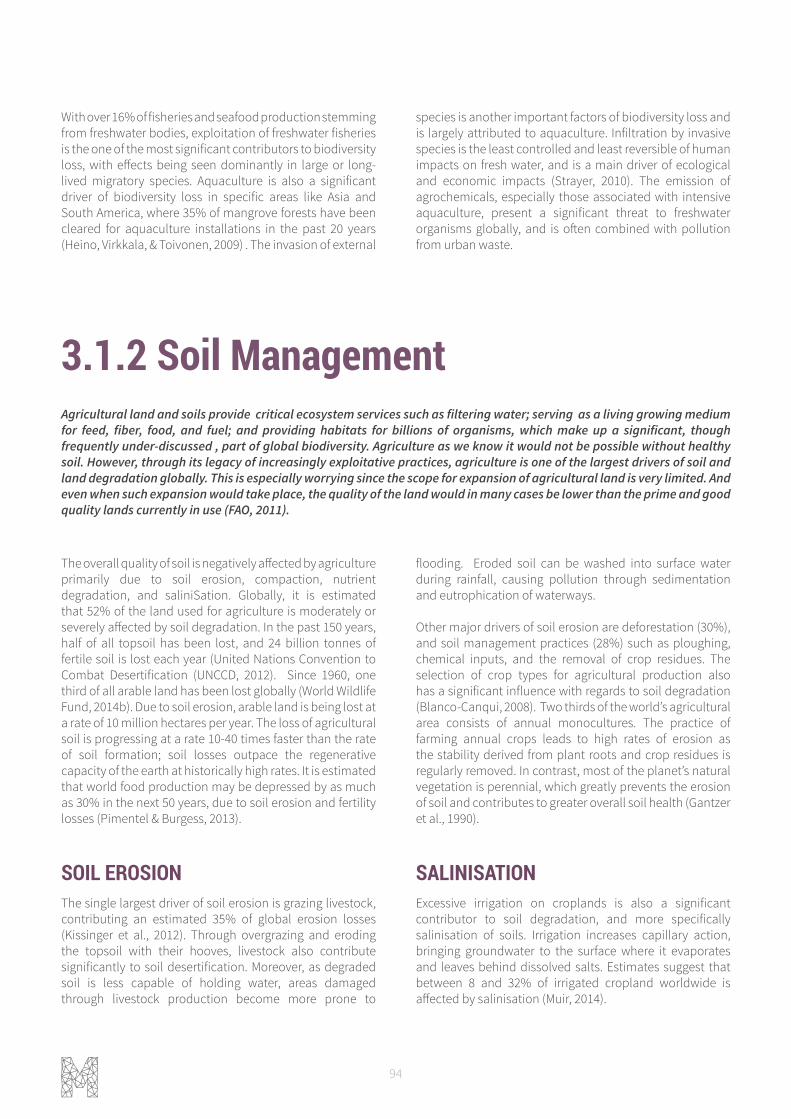
94
3.1.2 Soil Management
The overall quality of soil is negatively affected by agriculture primarily due to soil erosion, compaction, nutrient degradation, and saliniSation. Globally, it is estimated that 52% of the land used for agriculture is moderately or severely affected by soil degradation. In the past 150 years, half of all topsoil has been lost, and 24 billion tonnes of fertile soil is lost each year (United Nations Convention to Combat Desertification (UNCCD, 2012). Since 1960, one third of all arable land has been lost globally (World Wildlife Fund, 2014b). Due to soil erosion, arable land is being lost at a rate of 10 million hectares per year. The loss of agricultural soil is progressing at a rate 10-40 times faster than the rate of soil formation; soil losses outpace the regenerative capacity of the earth at historically high rates. It is estimated that world food production may be depressed by as much as 30% in the next 50 years, due to soil erosion and fertility losses (Pimentel & Burgess, 2013).
SOIL EROSIONThe single largest driver of soil erosion is grazing livestock, contributing an estimated 35% of global erosion losses (Kissinger et al., 2012). Through overgrazing and eroding the topsoil with their hooves, livestock also contribute significantly to soil desertification. Moreover, as degraded soil is less capable of holding water, areas damaged through livestock production become more prone to
flooding. Eroded soil can be washed into surface water during rainfall, causing pollution through sedimentation and eutrophication of waterways.
Other major drivers of soil erosion are deforestation (30%), and soil management practices (28%) such as ploughing, chemical inputs, and the removal of crop residues. The selection of crop types for agricultural production also has a significant influence with regards to soil degradation (Blanco-Canqui, 2008). Two thirds of the world’s agricultural area consists of annual monocultures. The practice of farming annual crops leads to high rates of erosion as the stability derived from plant roots and crop residues is regularly removed. In contrast, most of the planet’s natural vegetation is perennial, which greatly prevents the erosion of soil and contributes to greater overall soil health (Gantzer et al., 1990).
SALINISATIONExcessive irrigation on croplands is also a significant contributor to soil degradation, and more specifically salinisation of soils. Irrigation increases capillary action, bringing groundwater to the surface where it evaporates and leaves behind dissolved salts. Estimates suggest that between 8 and 32% of irrigated cropland worldwide is affected by salinisation (Muir, 2014).
Agricultural land and soils provide critical ecosystem services such as filtering water; serving as a living growing medium for feed, fiber, food, and fuel; and providing habitats for billions of organisms, which make up a significant, though frequently under-discussed , part of global biodiversity. Agriculture as we know it would not be possible without healthy soil. However, through its legacy of increasingly exploitative practices, agriculture is one of the largest drivers of soil and land degradation globally. This is especially worrying since the scope for expansion of agricultural land is very limited. And even when such expansion would take place, the quality of the land would in many cases be lower than the prime and good quality lands currently in use (FAO, 2011).
With over 16% of fisheries and seafood production stemming from freshwater bodies, exploitation of freshwater fisheries is the one of the most significant contributors to biodiversity loss, with effects being seen dominantly in large or long-lived migratory species. Aquaculture is also a significant driver of biodiversity loss in specific areas like Asia and South America, where 35% of mangrove forests have been cleared for aquaculture installations in the past 20 years (Heino, Virkkala, & Toivonen, 2009) . The invasion of external
species is another important factors of biodiversity loss and is largely attributed to aquaculture. Infiltration by invasive species is the least controlled and least reversible of human impacts on fresh water, and is a main driver of ecological and economic impacts (Strayer, 2010). The emission of agrochemicals, especially those associated with intensive aquaculture, present a significant threat to freshwater organisms globally, and is often combined with pollution from urban waste.
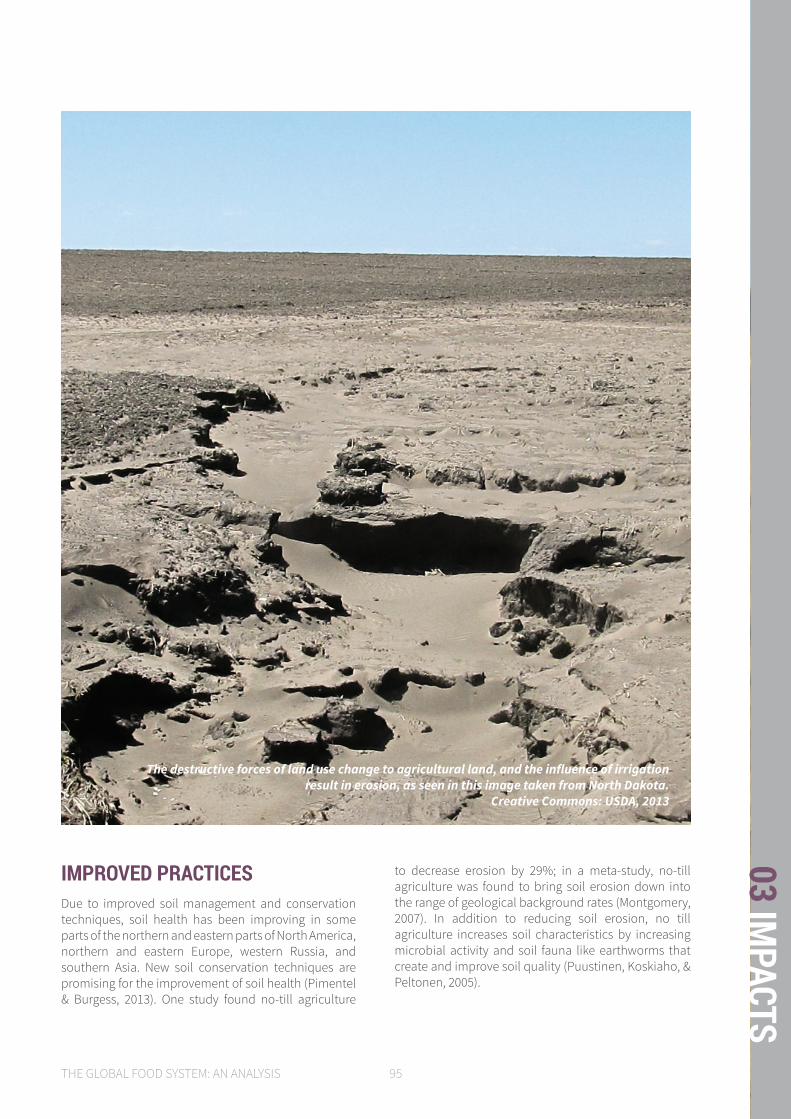
THE GLOBAL FOOD SYSTEM: AN ANALYSIS 95
03 IMPACTS
The destructive forces of land use change to agricultural land, and the influence of irrigation result in erosion, as seen in this image taken from North Dakota.
Creative Commons: USDA, 2013
IMPROVED PRACTICESDue to improved soil management and conservation techniques, soil health has been improving in some parts of the northern and eastern parts of North America, northern and eastern Europe, western Russia, and southern Asia. New soil conservation techniques are promising for the improvement of soil health (Pimentel & Burgess, 2013). One study found no-till agriculture
to decrease erosion by 29%; in a meta-study, no-till agriculture was found to bring soil erosion down into the range of geological background rates (Montgomery, 2007). In addition to reducing soil erosion, no till agriculture increases soil characteristics by increasing microbial activity and soil fauna like earthworms that create and improve soil quality (Puustinen, Koskiaho, & Peltonen, 2005).

96
3.1.3 Water Management
Though the global planetary boundary with regard to fresh water consumption (4.000 billion m3 of fresh water consumption per year) has not yet been exceeded, this is not necessarily a boundary that can be set at a global scale since water is a highly spatially and temporally variable resource. the current average withdrawal of 2,600 billion m3 per year, doesn’t account for the impact of regional water scarcity, only for global yearly averages (Steffen, Richardson, et al., 2015b). When averaging monthly blue water scarcity values per river basin, global water scarcity is 244%. In other words, by this measure the global water footprint exceeds water availability by 2.44 -fold (Hoekstra, Mekonnen, Chapagain, Mathews, & Richter, 2012). Agriculture impacts local and regional water availability in many complex ways - from direct extraction to physical changes in the structure of river basins. Most of these impacts reinforce each other and ultimately contribute to ecological damage and water stress.
WATER STRESSWhen the demand for water within a defined time period cannot be met with locally available resources, either due to lack of water availability or poor water quality, the region where this is occurring is said to be experiencing “water stress.” Regional and temporal variability in water availability explain why many regions of the world are water stressed. It is estimated that, globally, more than 2.5 billion people live in water stressed areas (GrowingBlue, 2015). Generally such situations arise due to the increase in population and economic growth leading to an increased water usage by municipalities and different economic sectors.
About 70% of the planet’s accessible fresh water withdrawals are currently used for agricultural activities, more than twice that used by industry (23%), and dwarfing municipal use (8%). Agriculture consumed over 8.300 billion m3 of water per year over the period 1996-2005, representing 92% of total global fresh water use (Hoekstra et al., 2012).
IRRIGATIONWith more food being produced worldwide than ever before, and an increasing demand for more water-intensive agricultural products, irrigation has increased rapidly in the past decades. Globally the total irrigated land surface of arable land has more than doubled since the 1960s. I rrigation systems now cover over 300 million hectares, and this trend has been especially strong in in developing countries (FAO, 2011). By contrast, in developed countries, irrigated area is expected to remain constant in the near future (Alexandratos & Bruinsma, 2012). The over-development of hydraulic irrigation systems for agriculture is one of the main drivers behind global and regional water scarcity, boosting the demand beyond catchment availability (Luck, Landis, & Gassert, 2015). The excessive water use is leaving rivers, lakes, and underground water sources dry in many irrigated areas (FAO, 2012a).
According to a recent analysis by the World Resources Institute, 28% of all crop land is subject to high water stress; this figure doubles for irrigated cropland, of 56% is water stressed. Certain crops are particularly frequently grown in water-stressed areas, such as cotton (57%) and wheat (43%) (Gassert, 2013).
WATER FOOTPRINTSAbout 38% of the water footprint of global food production lies within China, India, and the United States. Most of these regions suffer from moderate to severe water scarcity (Hoekstra et al., 2012). It is not always straightforward to
Water is essential to all life on earth. Though 71% of the planet’s surface is covered with water, only 2.5% is fresh water. A large part of this fresh water is stored in glaciers and deep aquifers, leaving less than 1% available for use. Water is becoming scarce in many regions of the world, threatening the livelihoods of millions of people and the health of ecosystems. Agriculture uses more fresh water than any other human activity, often competing with other critical needs such as drinking water and the sustenance of natural ecosystems (World Wildlife Fund, 2014a). Aside from being the largest single consumer of fresh water, agricultural activities also lead to the degradation of freshwater resources through pollution and over-exploitation (which can result in, for example, salt water intrusion into aquifers) (Atapattu & Kodituwakku, 2009; Parris, 2011). the conversion of natural ecosystems into agricultural land also has a significant impact on the drainage and water retention capabilities of land areas, leading to structural ecosystem changes (Moss, 2008).
More than 2.5 billion people live in water stressed areas.
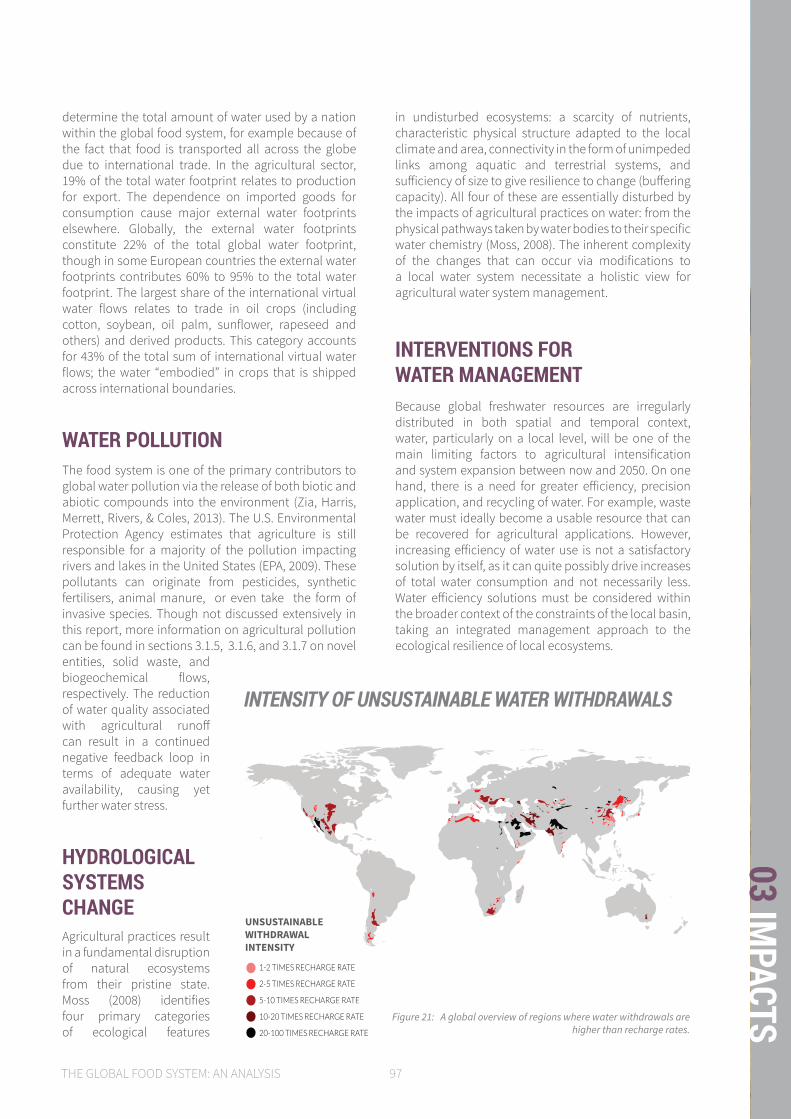
THE GLOBAL FOOD SYSTEM: AN ANALYSIS 97
03 IMPACTSFigure 21: A global overview of regions where water withdrawals are
higher than recharge rates.
1-2 TIMES RECHARGE RATE
2-5 TIMES RECHARGE RATE
5-10 TIMES RECHARGE RATE
10-20 TIMES RECHARGE RATE
20-100 TIMES RECHARGE RATE
Data retrieved from : http://www.wri.org/resources/data-sets/aqueduct-global-maps-21-data
UNSUSTAINABLE WITHDRAWAL INTENSITY
1-2 TIMES RECHARGE RATE
2-5 TIMES RECHARGE RATE
5-10 TIMES RECHARGE RATE
10-20 TIMES RECHARGE RATE
20-100 TIMES RECHARGE RATE
Data retrieved from : http://www.wri.org/resources/data-sets/aqueduct-global-maps-21-data
UNSUSTAINABLE WITHDRAWAL INTENSITY
1-2 TIMES RECHARGE RATE
2-5 TIMES RECHARGE RATE
5-10 TIMES RECHARGE RATE
10-20 TIMES RECHARGE RATE
20-100 TIMES RECHARGE RATE
Data retrieved from : http://www.wri.org/resources/data-sets/aqueduct-global-maps-21-data
UNSUSTAINABLE WITHDRAWAL INTENSITY
1-2 TIMES RECHARGE RATE
2-5 TIMES RECHARGE RATE
5-10 TIMES RECHARGE RATE
10-20 TIMES RECHARGE RATE
20-100 TIMES RECHARGE RATE
Data retrieved from : http://www.wri.org/resources/data-sets/aqueduct-global-maps-21-data
UNSUSTAINABLE WITHDRAWAL INTENSITY
1-2 TIMES RECHARGE RATE
2-5 TIMES RECHARGE RATE
5-10 TIMES RECHARGE RATE
10-20 TIMES RECHARGE RATE
20-100 TIMES RECHARGE RATE
Data retrieved from : http://www.wri.org/resources/data-sets/aqueduct-global-maps-21-data
UNSUSTAINABLE WITHDRAWAL INTENSITY
1-2 TIMES RECHARGE RATE
2-5 TIMES RECHARGE RATE
5-10 TIMES RECHARGE RATE
10-20 TIMES RECHARGE RATE
20-100 TIMES RECHARGE RATE
Data retrieved from : http://www.wri.org/resources/data-sets/aqueduct-global-maps-21-data
UNSUSTAINABLE WITHDRAWAL INTENSITY
determine the total amount of water used by a nation within the global food system, for example because of the fact that food is transported all across the globe due to international trade. In the agricultural sector, 19% of the total water footprint relates to production for export. The dependence on imported goods for consumption cause major external water footprints elsewhere. Globally, the external water footprints constitute 22% of the total global water footprint, though in some European countries the external water footprints contributes 60% to 95% to the total water footprint. The largest share of the international virtual water flows relates to trade in oil crops (including cotton, soybean, oil palm, sunflower, rapeseed and others) and derived products. This category accounts for 43% of the total sum of international virtual water flows; the water “embodied” in crops that is shipped across international boundaries.
WATER POLLUTIONThe food system is one of the primary contributors to global water pollution via the release of both biotic and abiotic compounds into the environment (Zia, Harris, Merrett, Rivers, & Coles, 2013). The U.S. Environmental Protection Agency estimates that agriculture is still responsible for a majority of the pollution impacting rivers and lakes in the United States (EPA, 2009). These pollutants can originate from pesticides, synthetic fertilisers, animal manure, or even take the form of invasive species. Though not discussed extensively in this report, more information on agricultural pollution can be found in sections 3.1.5, 3.1.6, and 3.1.7 on novel entities, solid waste, and biogeochemical flows, respectively. The reduction of water quality associated with agricultural runoff can result in a continued negative feedback loop in terms of adequate water availability, causing yet further water stress.
HYDROLOGICAL SYSTEMS CHANGEAgricultural practices result in a fundamental disruption of natural ecosystems from their pristine state. Moss (2008) identifies four primary categories of ecological features
in undisturbed ecosystems: a scarcity of nutrients, characteristic physical structure adapted to the local climate and area, connectivity in the form of unimpeded links among aquatic and terrestrial systems, and sufficiency of size to give resilience to change (buffering capacity). All four of these are essentially disturbed by the impacts of agricultural practices on water: from the physical pathways taken by water bodies to their specific water chemistry (Moss, 2008). The inherent complexity of the changes that can occur via modifications to a local water system necessitate a holistic view for agricultural water system management.
INTERVENTIONS FOR WATER MANAGEMENTBecause global freshwater resources are irregularly distributed in both spatial and temporal context, water, particularly on a local level, will be one of the main limiting factors to agricultural intensification and system expansion between now and 2050. On one hand, there is a need for greater efficiency, precision application, and recycling of water. For example, waste water must ideally become a usable resource that can be recovered for agricultural applications. However, increasing efficiency of water use is not a satisfactory solution by itself, as it can quite possibly drive increases of total water consumption and not necessarily less. Water efficiency solutions must be considered within the broader context of the constraints of the local basin, taking an integrated management approach to the ecological resilience of local ecosystems.
INTENSITY OF UNSUSTAINABLE WATER WITHDRAWALS
UNSUSTAINABLE WITHDRAWAL INTENSITY

98
3.1.4 Climate Change
DEFORESTATIONDeforestation is one of the largest contributors to climate change as the burning and clearing of forests and wetlands structurally degrades the natural ability of the earth to sequester carbon from the atmosphere. The conversion of natural ecosystems to agricultural land, resulting in the loss of their carbon sequestration potential, is one of the more significant sources of global greenhouse gas emissions.
Estimates for the contribution of deforestation to global GHG emissions ranged from 6 – 17% of the global total in the past (van der Werf et al., 2009), with more recent research suggesting 10% as the most likely figure (Baccini et al., 2012; Harris et al., 2012). Globally, the clearing of land for agricultural purposes is the largest driver of deforestation, however other activities that are peripherally related to the food system such as land speculation, logging, and clearing of peat lands are also important drivers of deforestation (Fairlie, 2010).
INPUTS FOR PRODUCTIONAs a whole, agriculture is the single largest contributor of GHG emissions within the food system. The production of fertilisers and pesticides alone accounts for 40% of
the energy use in agriculture (Arei-Usda, 1996). Irrigation systems are also highly energy intensive, some estimated to consume up to 15% of total energy in agriculture (Pimentel, D. Pimentel, 2008). Other drivers of GHG emissions in production include the manufacturing and operation of farm machinery, operation of greenhouses, and heating and the cooling in livestock facilities. Since 1990, agricultural emissions have significantly increased in the developing world. Over the period 1990-2010, particularly emissions from synthetic fertiliser, manure on cropland and pasture, and enteric fermentation have increased, with average growth rates of 3.9%, 1.1%, and 0.7% per year respectively. The IPCC estimates that agricultural emissions in the developing world will increase about 60% over the period 1990-2020, whereas the emissions in the developed world are estimated to stay roughly the same (Intergovernmental Panel on Climate, 2014).
GLOBAL FOOD CHAINSDue to the globalization of the food system the distances foodstuffs travel between producer and end-consumer have roughly doubled within the last three decades (James & James, 2010). Here, refrigeration required to minimize post-harvest losses and the respective modes of transport bear the biggest influencing factor for GHG emissions per food mile. Estimates on the exact numbers vary significantly as the available studies evaluate very specific products and geographical contexts or categorize processing, transport, and refrigeration differently. The FAO estimates that globally, ‘processing and distribution’ roughly accounts for 20% of food-related GHG emissions (around 4% of global anthropogenic GHG emissions) (FAO, 2012b). Similarly, the UNCTAD Trade and Environment Review 2013 refers to ‘processing, transport, packing, and retail’ to account for 15-20% of global GHG emissions (UNCTAD, 2013a). A US-study suggests that transportation alone accounts for about 11% of food-related GHG emissions (James & James, 2010). An EU study suggests that ¼ of overall transport is due to food transportation. In terms of refrigeration, it is estimated that 40% of all food is refrigerated, accounting for 15% of energy usage globally, therefore accounting for about 1% of global CO2 emissions (James & James, 2010).
Climate change is one of the most pressing issues facing human civilization today. The global food system is inextricably linked to climate change, as it is one of the largest contributors of greenhouse gas (GHG) emissions, from the inputs to agriculture, to the processing, distribution, and consumption of food. Estimates place GHG emissions from the whole food system at approximately 25 - 30% of total global GHG emissions. (IPCC, 2013b) The food system is also heavily affected by climate change. Flooding, droughts, and natural disasters compromise agricultural yields and earnings, food prices, food quality, and food safety. Globally, it is the lower-income producers and consumers of food that are the most vulnerable, due to their limited ability to adapt under growing climate risks.
The food system is the largest driver of
deforestation globally. Deforestation is estimated to be responsible for 10%
of global GHG emissions.
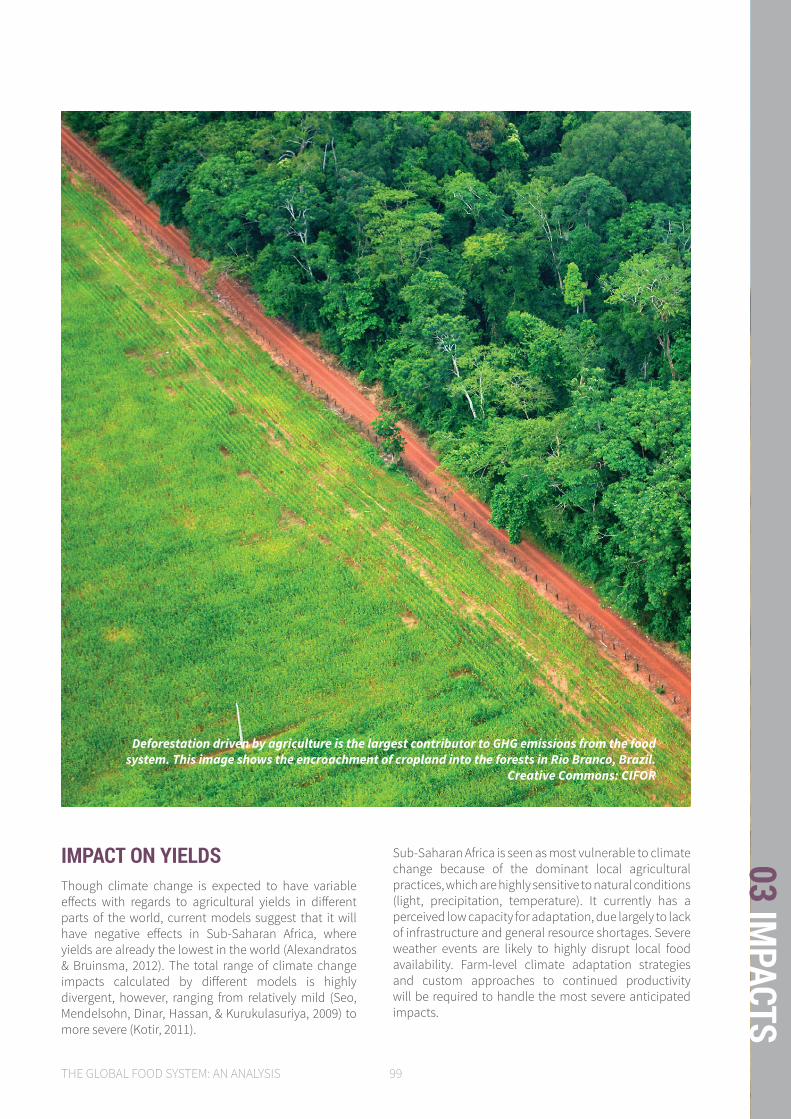
THE GLOBAL FOOD SYSTEM: AN ANALYSIS 99
03 IMPACTS
Deforestation driven by agriculture is the largest contributor to GHG emissions from the food system. This image shows the encroachment of cropland into the forests in Rio Branco, Brazil.
Creative Commons: CIFOR
IMPACT ON YIELDSThough climate change is expected to have variable effects with regards to agricultural yields in different parts of the world, current models suggest that it will have negative effects in Sub-Saharan Africa, where yields are already the lowest in the world (Alexandratos & Bruinsma, 2012). The total range of climate change impacts calculated by different models is highly divergent, however, ranging from relatively mild (Seo, Mendelsohn, Dinar, Hassan, & Kurukulasuriya, 2009) to more severe (Kotir, 2011).
Sub-Saharan Africa is seen as most vulnerable to climate change because of the dominant local agricultural practices, which are highly sensitive to natural conditions (light, precipitation, temperature). It currently has a perceived low capacity for adaptation, due largely to lack of infrastructure and general resource shortages. Severe weather events are likely to highly disrupt local food availability. Farm-level climate adaptation strategies and custom approaches to continued productivity will be required to handle the most severe anticipated impacts.
100
3.1.5 Novel Entities
PESTICIDESPesticide pollution is one of the most significant emissions from agricultural production, and is often exacerbated by irrigation infrastructure (FAO, 2012a). Pesticides are applied to protect crops, but contaminate the soil, air, and water as many are water soluble. It is estimated that over 98% of insecticides and 95% of herbicides reach destinations other than targeted species, due to intentional spraying over agricultural fields (Miller, 2004; United States Department of Health and Human Services, 2011). Particularly systemic pesticides like neonicotinoids and fipronil have been shown to cause significant damage to a range of beneficial invertebrates and vertebrates, like honey bees, butterflies, earthworms, and birds, which eat contaminated insects and crops. Persistent, bioaccumulative and toxic (PBT) substances are typically deposited in water bodies and concentrate up the food chain, accumulating and ultimately harming fish-eating animals and humans (Acton, 2011).
In addition to their use on crop lands, pesticides are used in aquaculture to treat parasite outbreaks that are generally promoted by the overcrowded and stressful conditions the fish are bred in (Animal Welfare Institute, 2015). Pesticides are also used to control weeds and pests, and to eliminate certain fish and invertebrates. These pesticides often travel beyond the point of application and leak into the environment; they also accumulate in the edible fatty tissue of fish. The use of pesticides in aquaculture has shown to have direct devastating effects on the environment,
Some of the main waste products emitted to the environment, through air, water, and land come from agricultural chemicals, hormones, and antibiotics from animal waste. these and other synthetic substances that are only present in the environment as a result of human activities, are categorized as “novel entities.” emissions of these substances into the environment can have many long-term ecological and health consequences (Laird et al, 2013), many of which are not immediately apparent. Agriculture is one of the primary contributors globally to the release of novel entities.
yet the effect on human health through consumption of contaminated fish is still extensively researched as direct relationship is hard to establish (United States Department of Health and Human Services, 2011).
The consumption of pesticides varies depending on the location and year of assessment. Pesticide use peaked in 2007 and has generally been declining, despite a continued increase in agricultural productivity increases (see section 2.1). When looking at patricide use per hectare of arable land used, China and parts of South America have the highest pesticide use (FAO, 2013).
GM CROPSThough controversial, genetically modified crops can be designed to naturally deter pests, minimizing pesticide use. In China, for example, pesticide use for non-genetically modified crops was 8 to 10 times higher than for GM pest-resistant crops. On the other hand, there are some serious concerns about GMO crops. Some pesticide-resistant GM crops result in the increased use of pesticides and consequent impacts. Organic crops show lower levels of pesticide residues, however the pesticides used in conventional farming still affect organically grown products (Mullin et al., 2010). Furthermore, it has been shown that GMO crops have, in some instances resulted in significantly greater use of herbicides (Benbrook, 2012).
ANTIBIOTICSIn addition to pesticide emissions, antibiotics and hormones that are used for livestock and in fisheries are also often emitted to the water table. Accurate data on antibiotic use is limited due to a lack of publicly funded surveillance systems, and a reluctance of producers to report on consumption or sales (Grace Communications Foundation, 2015). Growth hormones that are applied to fish and livestock end up in food products and the environment. The emission of these substances directly contributes to antibiotic resistance, posing serious threats to animal and environmental health. Many studies have found increased risks of developmental, neurobiological,
Approximately 98% of insecticides and 95%
of herbicides reach destinations other than
their targeted species.

THE GLOBAL FOOD SYSTEM: AN ANALYSIS 101
03 IMPACTS
10.57 + kg
5.92 - 10.57 kg
2.73 - 5.92 kg
1.19 - 2.73 kg
0.89 - 1.19 kg
0.40 - 0.89 kg
0 - 0.40 kg
No data
10.57 + kg
5.92 - 10.57 kg
2.73 - 5.92 kg
1.19 - 2.73 kg
0.89 - 1.19 kg
0.40 - 0.89 kg
0 - 0.40 kg
No data
Figure 22: Pesticide use per area (kg pesticide use per hectare arable land). (FAO, 2015b)
genotoxic and carcinogenic effects, but with different levels of conclusive evidence (European Commission, 1999).
The rising demand for meat across the world has led to a significant increase in the amount of antibiotics used in pork, beef, and poultry. The amount of antibiotics is expected to continue to grow, nearly doubling the current amount used by 2030. With the projected increase on meat consumption, it is estimated that total antimicrobial consumption will increase by 67% by 2030. This increase is mostly driven by the middle-
income countries as Brazil, India, China and Russia and the transition to intensified livestock farms where they are widely used to prevent diseases and promote growth. The U.S. and China are projected to rank the top in total consumption (Van Boeckel et al., 2015).
On a regional level however, some efforts are being made to reduce the amount of antibiotics and growth hormones used per live animal. It is likely that restrictions will be more widely adopted on a per animal level, mainly to prevent antimicrobial resistance (Levy, 2014; Maron, Smith, & Nachman, 2013).
PESTICIDE USE INTENSITY PER GEOGRAPHIC REGION
102
3.1.6 Solid Waste
FOOD WASTEBy mass, food waste is the largest source of solid waste in the global food system. Along the entire production chain, 1.3 billion tonnes of all food that is suitable for human consumption is wasted annually (Gustavsson et al., 2011). Based on FAO data, around a third (31%) of all food is either lost through spoilage or disposal throughout the chain, or wasted at the retail and consumer stage (FAOSTAT, 2015). Some sources estimate the level of food losses to be even greater, potentially reaching up to 50% of total output (IMechE, 2013).
Food losses in the chain from farm to fork can occur for a number of reasons. A significant fraction of produce never makes it off the farm because it does not meet the stringent quality and aesthetic requirements of supermarkets and other retailers (Stuart, 2009). Further losses of food accumulate through the chain at different steps. Spoilage is natural for fresh produce, however can be exacerbated by a lack of adequate infrastructure for transportation, cooling, markets, and storage (Rolle, 2006; Stuart, 2009). Losses through spoilage typically affect developing countries more, as they lack these basic infrastructure provisions.
Additional losses along the different steps in the chain occur due to the nature of food processing. Food trimmings, errors and unacceptable levels quality, and other damages that occur in standardized production lines can turn perfectly edible food into waste (Stuart, 2009; SEPA, 2008).
Although the amount of food wasted differs significantly between product types, regions, and the stages within the production chain, at a global level most food waste and losses are estimated to take place at point of consumption (35%), followed by production (24%), and handling and
storage (24%) (The World Bank, 2014b). Much more food is wasted in industrialized countries than in the developing world. In North America, Oceania, and Europe about 280-300 kg of food is wasted per capita every year, from which 95-115 kg (~35%) is wasted by the consumer. In Sub-Saharan Africa and South- and Southeast Asia the total amount of food wasted per capita is 120-170 kg/yr., with only 5-11 kg/yr. (~5%) lost due to the consumer. In industrialized regions, around 60% of the total food waste is attributed to dairy products (Gustavsson et al., 2011). FOOD WASTE FROM CONSUMERS
There are a number of contributing factors that determine the amount of consumer food waste, which vary greatly across different contexts. A major factor is spoilage, often connected to concerns about safety. In the United Kingdom for example, one fifth of all unnecessarily discarded food is thrown away due to “best by” labeling, which does not always correctly indicate when a food product has actually spoiled. Consumers often choose to dispose of food products beyond their “best by” dates out of precaution, despite the fact that it is still safe to eat (World Resources Institute, 2013). In similar fashion as in the rest of the food chain, damage to food and excessive trimming of food products leads to waste at home. Other factors contributing to food waste at the consumer stage can include spoilage due to excessive preparation or a lack of storage, and excessive portion sizes of prepared foods and restaurant meals (Gustavsson et al., 2011).
The amount of food waste is expected to increase with the rise in per capita calorie intake (Millennium Institute, 2013). However, food waste is an issue that has also received attention from governments and companies. Retailers in some countries, like the United Kingdom, are either voluntarily choosing, or more often forced by law, to sell ‘ugly’ foods, as 20-40% of all food discarded by farmers is due to cosmetic requirements imposed by retailers (Geiling, 2015).
PACKAGINGIn addition to food waste, packaging is another large waste stream in the global food system. Of the 3.4 to 4 billion tonnes of municipal and industrial waste generated
The food system as a whole produces a range of different solid waste streams, from animal manure and agricultural residues, to food packaging and waste. The nature and scale of the impacts associated with these waste streams varies depending on how the material is collected and handled. In this section, we focus the discussion on three primary waste categories: food waste, food packaging waste, and agricultural plastics. These categories have among the largest volumes and impact, and are not discussed elsewhere in this chapter.
Approximately 1/3 of food that is produced
is ultimately wasted.
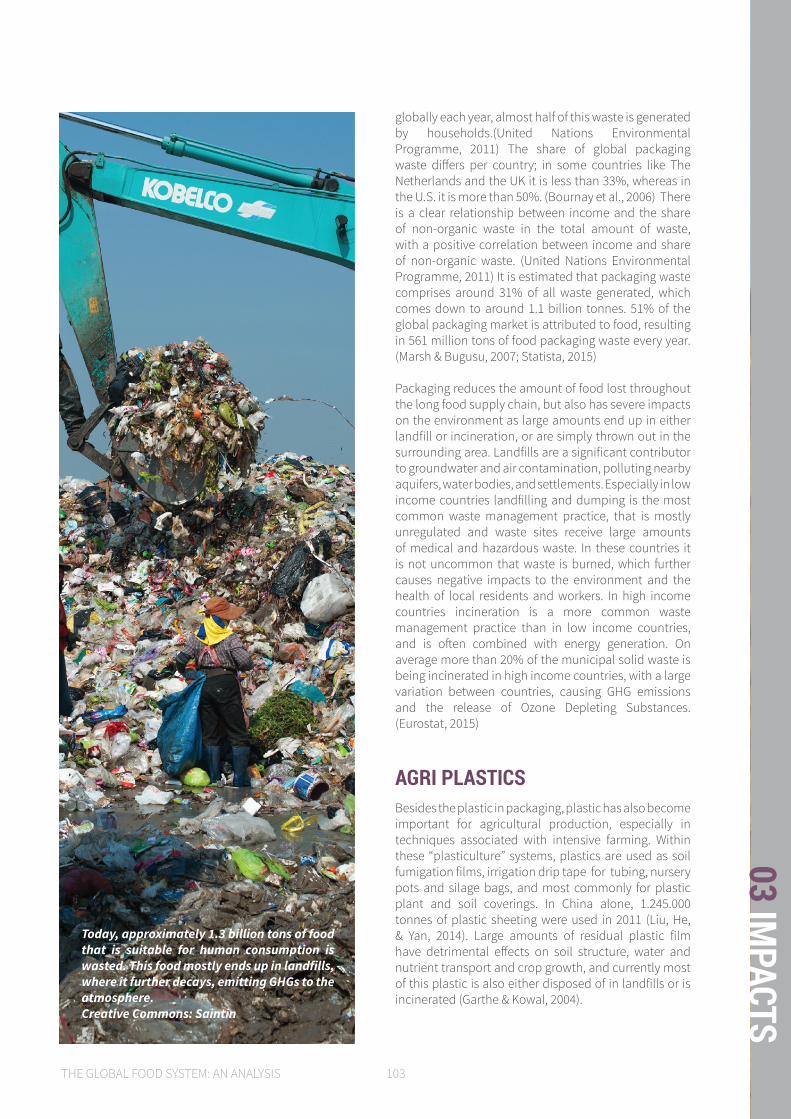
THE GLOBAL FOOD SYSTEM: AN ANALYSIS 103
03 IMPACTS
Today, approximately 1.3 billion tons of food that is suitable for human consumption is wasted. This food mostly ends up in landfills, where it further decays, emitting GHGs to the atmosphere.Creative Commons: Saintin
globally each year, almost half of this waste is generated by households.(United Nations Environmental Programme, 2011) The share of global packaging waste differs per country; in some countries like The Netherlands and the UK it is less than 33%, whereas in the U.S. it is more than 50%. (Bournay et al., 2006) There is a clear relationship between income and the share of non-organic waste in the total amount of waste, with a positive correlation between income and share of non-organic waste. (United Nations Environmental Programme, 2011) It is estimated that packaging waste comprises around 31% of all waste generated, which comes down to around 1.1 billion tonnes. 51% of the global packaging market is attributed to food, resulting in 561 million tons of food packaging waste every year. (Marsh & Bugusu, 2007; Statista, 2015)
Packaging reduces the amount of food lost throughout the long food supply chain, but also has severe impacts on the environment as large amounts end up in either landfill or incineration, or are simply thrown out in the surrounding area. Landfills are a significant contributor to groundwater and air contamination, polluting nearby aquifers, water bodies, and settlements. Especially in low income countries landfilling and dumping is the most common waste management practice, that is mostly unregulated and waste sites receive large amounts of medical and hazardous waste. In these countries it is not uncommon that waste is burned, which further causes negative impacts to the environment and the health of local residents and workers. In high income countries incineration is a more common waste management practice than in low income countries, and is often combined with energy generation. On average more than 20% of the municipal solid waste is being incinerated in high income countries, with a large variation between countries, causing GHG emissions and the release of Ozone Depleting Substances. (Eurostat, 2015)
AGRI PLASTICSBesides the plastic in packaging, plastic has also become important for agricultural production, especially in techniques associated with intensive farming. Within these “plasticulture” systems, plastics are used as soil fumigation films, irrigation drip tape for tubing, nursery pots and silage bags, and most commonly for plastic plant and soil coverings. In China alone, 1.245.000 tonnes of plastic sheeting were used in 2011 (Liu, He, & Yan, 2014). Large amounts of residual plastic film have detrimental effects on soil structure, water and nutrient transport and crop growth, and currently most of this plastic is also either disposed of in landfills or is incinerated (Garthe & Kowal, 2004).
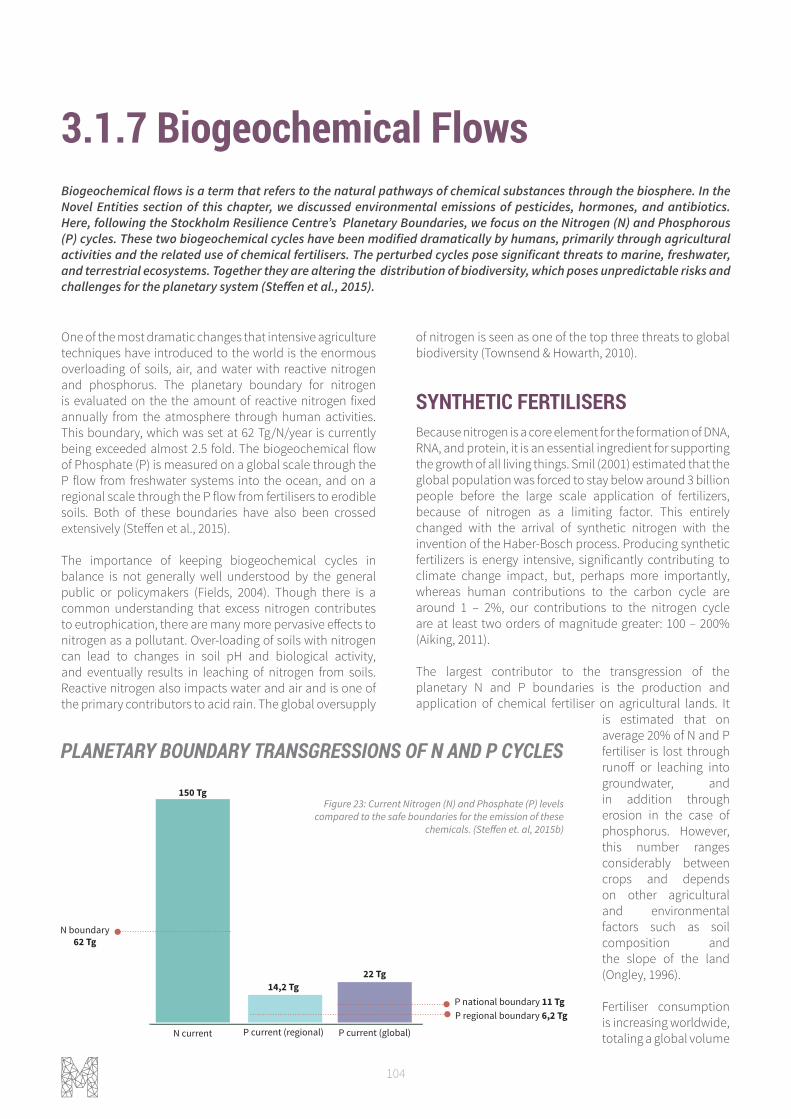
104
3.1.7 Biogeochemical Flows
One of the most dramatic changes that intensive agriculture techniques have introduced to the world is the enormous overloading of soils, air, and water with reactive nitrogen and phosphorus. The planetary boundary for nitrogen is evaluated on the the amount of reactive nitrogen fixed annually from the atmosphere through human activities. This boundary, which was set at 62 Tg/N/year is currently being exceeded almost 2.5 fold. The biogeochemical flow of Phosphate (P) is measured on a global scale through the P flow from freshwater systems into the ocean, and on a regional scale through the P flow from fertilisers to erodible soils. Both of these boundaries have also been crossed extensively (Steffen et al., 2015).
The importance of keeping biogeochemical cycles in balance is not generally well understood by the general public or policymakers (Fields, 2004). Though there is a common understanding that excess nitrogen contributes to eutrophication, there are many more pervasive effects to nitrogen as a pollutant. Over-loading of soils with nitrogen can lead to changes in soil pH and biological activity, and eventually results in leaching of nitrogen from soils. Reactive nitrogen also impacts water and air and is one of the primary contributors to acid rain. The global oversupply
of nitrogen is seen as one of the top three threats to global biodiversity (Townsend & Howarth, 2010).
SYNTHETIC FERTILISERSBecause nitrogen is a core element for the formation of DNA, RNA, and protein, it is an essential ingredient for supporting the growth of all living things. Smil (2001) estimated that the global population was forced to stay below around 3 billion people before the large scale application of fertilizers, because of nitrogen as a limiting factor. This entirely changed with the arrival of synthetic nitrogen with the invention of the Haber-Bosch process. Producing synthetic fertilizers is energy intensive, significantly contributing to climate change impact, but, perhaps more importantly, whereas human contributions to the carbon cycle are around 1 – 2%, our contributions to the nitrogen cycle are at least two orders of magnitude greater: 100 – 200% (Aiking, 2011).
The largest contributor to the transgression of the planetary N and P boundaries is the production and application of chemical fertiliser on agricultural lands. It
is estimated that on average 20% of N and P fertiliser is lost through runoff or leaching into groundwater, and in addition through erosion in the case of phosphorus. However, this number ranges considerably between crops and depends on other agricultural and environmental factors such as soil composition and the slope of the land (Ongley, 1996).
Fertiliser consumption is increasing worldwide, totaling a global volume
Biogeochemical flows is a term that refers to the natural pathways of chemical substances through the biosphere. In the Novel Entities section of this chapter, we discussed environmental emissions of pesticides, hormones, and antibiotics. Here, following the Stockholm Resilience Centre’s Planetary Boundaries, we focus on the Nitrogen (N) and Phosphorous (P) cycles. These two biogeochemical cycles have been modified dramatically by humans, primarily through agricultural activities and the related use of chemical fertilisers. The perturbed cycles pose significant threats to marine, freshwater, and terrestrial ecosystems. Together they are altering the distribution of biodiversity, which poses unpredictable risks and challenges for the planetary system (Steffen et al., 2015).
N boundary62 Tg
150 Tg
N current
14,2 Tg
P current (regional)
22 Tg
P current (global)
P regional boundary 6,2 TgP national boundary 11 Tg
N boundary62 Tg
150 Tg
N current
14,2 Tg
P current (regional)
22 Tg
P current (global)
P regional boundary 6,2 TgP national boundary 11 Tg
Figure 23: Current Nitrogen (N) and Phosphate (P) levels compared to the safe boundaries for the emission of these
chemicals. (Steffen et. al, 2015b)
PLANETARY BOUNDARY TRANSGRESSIONS OF N AND P CYCLES
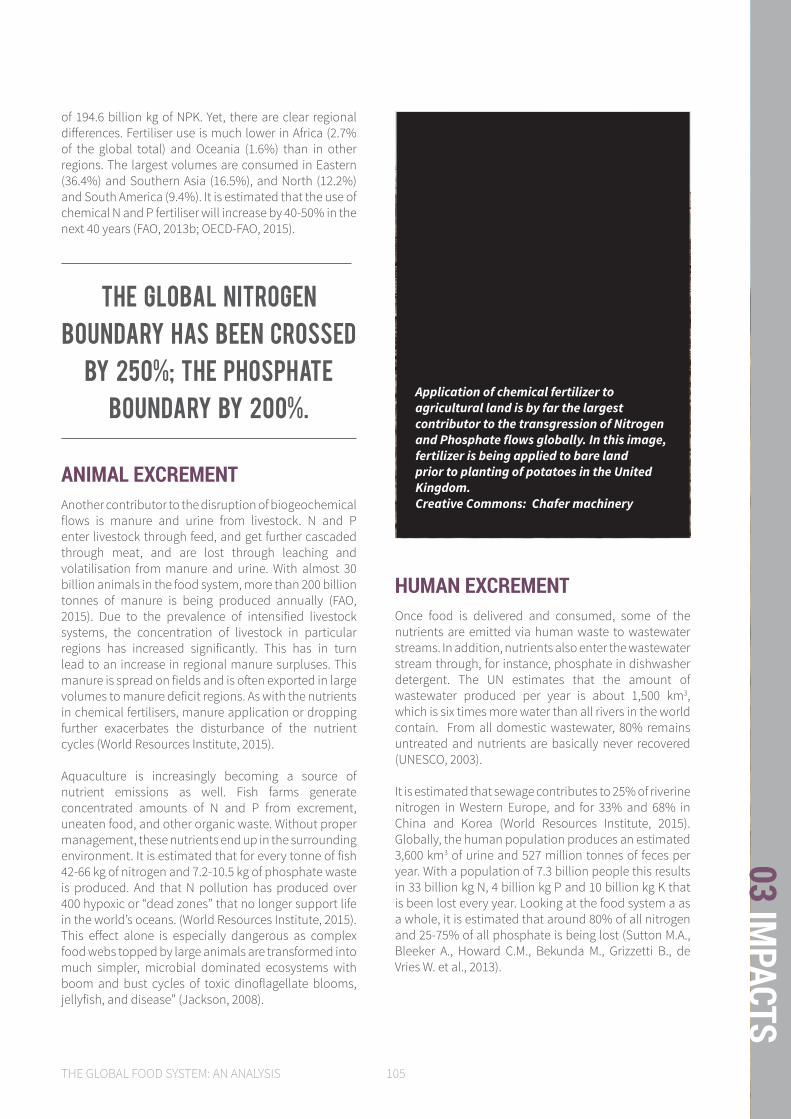
THE GLOBAL FOOD SYSTEM: AN ANALYSIS 105
03 IMPACTS
of 194.6 billion kg of NPK. Yet, there are clear regional differences. Fertiliser use is much lower in Africa (2.7% of the global total) and Oceania (1.6%) than in other regions. The largest volumes are consumed in Eastern (36.4%) and Southern Asia (16.5%), and North (12.2%) and South America (9.4%). It is estimated that the use of chemical N and P fertiliser will increase by 40-50% in the next 40 years (FAO, 2013b; OECD-FAO, 2015).
ANIMAL EXCREMENTAnother contributor to the disruption of biogeochemical flows is manure and urine from livestock. N and P enter livestock through feed, and get further cascaded through meat, and are lost through leaching and volatilisation from manure and urine. With almost 30 billion animals in the food system, more than 200 billion tonnes of manure is being produced annually (FAO, 2015). Due to the prevalence of intensified livestock systems, the concentration of livestock in particular regions has increased significantly. This has in turn lead to an increase in regional manure surpluses. This manure is spread on fields and is often exported in large volumes to manure deficit regions. As with the nutrients in chemical fertilisers, manure application or dropping further exacerbates the disturbance of the nutrient cycles (World Resources Institute, 2015).
Aquaculture is increasingly becoming a source of nutrient emissions as well. Fish farms generate concentrated amounts of N and P from excrement, uneaten food, and other organic waste. Without proper management, these nutrients end up in the surrounding environment. It is estimated that for every tonne of fish 42-66 kg of nitrogen and 7.2-10.5 kg of phosphate waste is produced. And that N pollution has produced over 400 hypoxic or “dead zones” that no longer support life in the world’s oceans. (World Resources Institute, 2015). This effect alone is especially dangerous as complex food webs topped by large animals are transformed into much simpler, microbial dominated ecosystems with boom and bust cycles of toxic dinoflagellate blooms, jellyfish, and disease” (Jackson, 2008).
HUMAN EXCREMENTOnce food is delivered and consumed, some of the nutrients are emitted via human waste to wastewater streams. In addition, nutrients also enter the wastewater stream through, for instance, phosphate in dishwasher detergent. The UN estimates that the amount of wastewater produced per year is about 1,500 km3, which is six times more water than all rivers in the world contain. From all domestic wastewater, 80% remains untreated and nutrients are basically never recovered (UNESCO, 2003).
It is estimated that sewage contributes to 25% of riverine nitrogen in Western Europe, and for 33% and 68% in China and Korea (World Resources Institute, 2015). Globally, the human population produces an estimated 3,600 km3 of urine and 527 million tonnes of feces per year. With a population of 7.3 billion people this results in 33 billion kg N, 4 billion kg P and 10 billion kg K that is been lost every year. Looking at the food system a as a whole, it is estimated that around 80% of all nitrogen and 25-75% of all phosphate is being lost (Sutton M.A., Bleeker A., Howard C.M., Bekunda M., Grizzetti B., de Vries W. et al., 2013).
Application of chemical fertilizer to agricultural land is by far the largest contributor to the transgression of Nitrogen and Phosphate flows globally. In this image, fertilizer is being applied to bare land prior to planting of potatoes in the United Kingdom.Creative Commons: Chafer machinery
The global nitrogen boundary has been crossed
by 250%; the phosphate boundary by 200%.

106
3.2 HUMAN HEALTH AND WELLBEING IMPACTSThe food system not only has impacts on the biophysical sphere; how we produce and consume food also has a significant impact on the health and wellbeing of humans and animals. The food system is deeply connected to a number of global social issues that affect millions of people around the world, such as: food security, healthy and equitable working conditions, the preservation of livelihoods, and animal wellbeing. In this section, we provide an overview of the main social impacts of the food system and discuss the current state of these global areas of concern. In addition, we look at drivers, trends, and the future outlook of all the impacts evaluated.
3.2.1 LABOUR AND LIVELIHOODS3.2.2 FOOD SECURITY AND NUTRITION3.2.3 FOOD SAFETY3.2.4 PRESERVATION OF CULTURE AND RIGHTS3.2.5 ANIMAL WELFARE
This section further elaborates on the following impact categories:
Farmers cultivating a rice paddy.Creative Commons: CIFOR
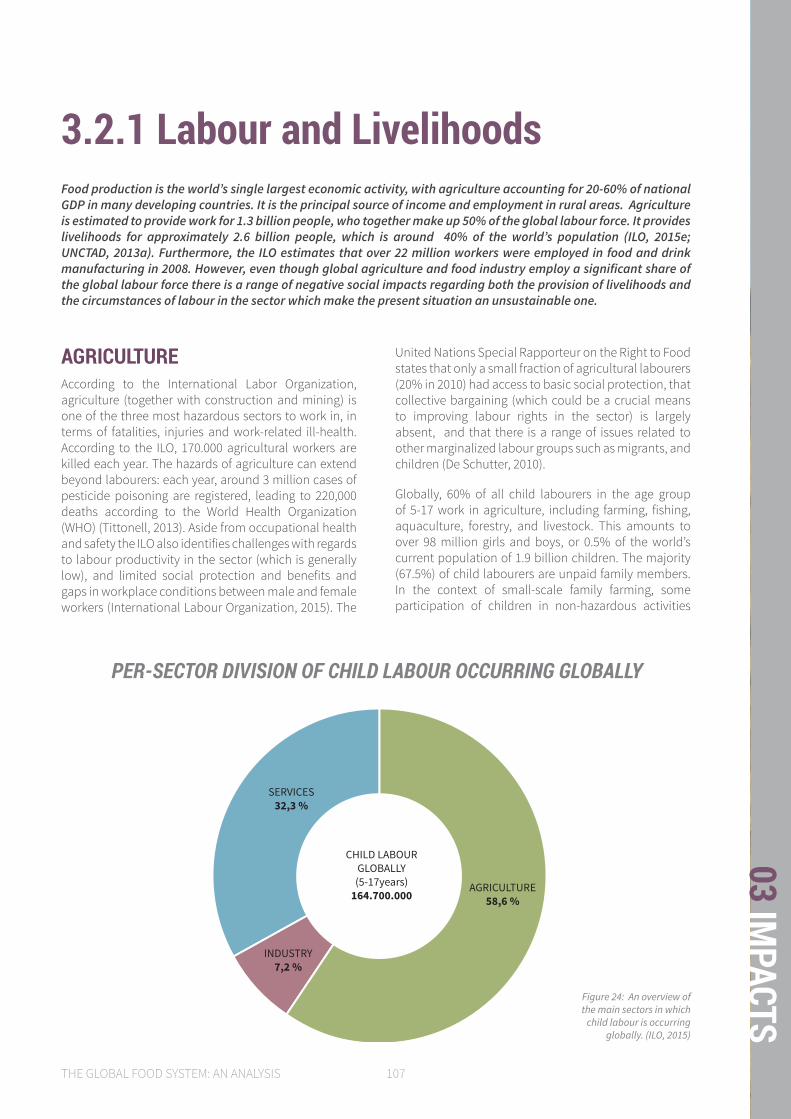
THE GLOBAL FOOD SYSTEM: AN ANALYSIS 107
03 IMPACTS
3.2.1 Labour and Livelihoods
AGRICULTUREAccording to the International Labor Organization, agriculture (together with construction and mining) is one of the three most hazardous sectors to work in, in terms of fatalities, injuries and work-related ill-health. According to the ILO, 170.000 agricultural workers are killed each year. The hazards of agriculture can extend beyond labourers: each year, around 3 million cases of pesticide poisoning are registered, leading to 220,000 deaths according to the World Health Organization (WHO) (Tittonell, 2013). Aside from occupational health and safety the ILO also identifies challenges with regards to labour productivity in the sector (which is generally low), and limited social protection and benefits and gaps in workplace conditions between male and female workers (International Labour Organization, 2015). The
United Nations Special Rapporteur on the Right to Food states that only a small fraction of agricultural labourers (20% in 2010) had access to basic social protection, that collective bargaining (which could be a crucial means to improving labour rights in the sector) is largely absent, and that there is a range of issues related to other marginalized labour groups such as migrants, and children (De Schutter, 2010).
Globally, 60% of all child labourers in the age group of 5-17 work in agriculture, including farming, fishing, aquaculture, forestry, and livestock. This amounts to over 98 million girls and boys, or 0.5% of the world’s current population of 1.9 billion children. The majority (67.5%) of child labourers are unpaid family members. In the context of small-scale family farming, some participation of children in non-hazardous activities
Food production is the world’s single largest economic activity, with agriculture accounting for 20-60% of national GDP in many developing countries. It is the principal source of income and employment in rural areas. Agriculture is estimated to provide work for 1.3 billion people, who together make up 50% of the global labour force. It provides livelihoods for approximately 2.6 billion people, which is around 40% of the world’s population (ILO, 2015e; UNCTAD, 2013a). Furthermore, the ILO estimates that over 22 million workers were employed in food and drink manufacturing in 2008. However, even though global agriculture and food industry employ a significant share of the global labour force there is a range of negative social impacts regarding both the provision of livelihoods and the circumstances of labour in the sector which make the present situation an unsustainable one.
AGRICULTURE58,6 %
SERVICES32,3 %
INDUSTRY7,2 %
CHILD LABOURGLOBALLY (5-17years)
164.700.000
Figure 24: An overview of the main sectors in which
child labour is occurring globally. (ILO, 2015)
PER-SECTOR DIVISION OF CHILD LABOUR OCCURRING GLOBALLY

108
can be beneficial for transferring knowledge and skills through generations (ILO, 2015b). However, these benefits do not extend to children working in unsafe contexts or at the broader expense of their development and formal education. While accurate information on the actual level of child and hazardous labour is difficult to ascertain, the ILO has recently indicated that the overall level of child labour globally has reduced by nearly one third since 2000 (ILO, 2013; The Hague Global Child Labour Conference, 2010).
Aside from hazardous and child labour, a vast number of especially small and medium-sized farmers are unable to derive a livelihood from agricultural production. Because of globalized food chains and the pressure from lead firms in these chains (e.g. large retailers or food processors; Ahold, Nestlé) suppliers demand lower prices for food products delivered by farmers. For instance, smallholder tea farmers
earn but 3% of the price of tea. Coffee growers in Uganda were found to earn just 0.5% of the retail price of coffee sold in London (International Fund for Agricultural Development (IFAD), 2015). While it is understandable that parties along the value chain are entitled to their fraction of added value, it is well documented that farmers do not receive adequate compensation, and often depend on subsidies to make up a large part of their annual revenues (Rigg, 2006).
FISHERIES AND AQUACULTUREAccording to FAO estimates, 58.3 million people were engaged in fisheries and aquaculture in 2012 (FAO, 2014b). The sector is plagued by a range of severe labour issues such as child labour, forced labour, and slavery. Although global data on child labour in fisheries is not available (ILO, 2015c) case studies indicate that child labour is predominantly occurring in small-scale capture fisheries operations; aquaculture; and post-harvest fish processing, distribution, and marketing, which includes the vast majority of fishing and fish farming operations, globally (Chantavanich et al., 2013). Furthermore, a recent study of the ILO indicates that forced labour is wide spread in the sector especially among migrant workers from developing states (ILO, 2015c). In his study on transnational crimes in the fishing industry, de Coning mentions the “severity of
Village women cultivating grain cropsCreative Commons: Asian Development Bank
Agriculture is one of the 3 most hazardous
sectors to work in.

THE GLOBAL FOOD SYSTEM: AN ANALYSIS 109
03 IMPACTS
the abuse of fishers trafficked for the purpose of forced labour on board fishing vessels” and “the frequency of trafficking in children in the fishing industry” as two of the most disturbing phenomena encountered during the research for the study (de Coning, 2013).
THE FOOD PROCESSING INDUSTRYFurther upstream in the food chain, there are also a range of social impacts associated with food and drink manufacturing industry. According to the ILO, over 22 million people are globally employed in the sector in which over 4 billion tonnes of food are moved from field to table every year (ILO, 2007). The ability of workers in the food industry to derive decent livelihoods is made difficult due to low wages and lacking worker’s rights. Generally, food chains are controlled by a very limited number of suppliers engaged in the processing and distribution of products, and a small number of retailers that control the market. Evidence from several countries and industries suggests that, in the case of processors, many aspects similar to that of farmers and fisherman described earlier: they become locked into global food chains. In such a situation the downward pressure from leading firms such as large traders or retailers can lead to a decrease of wages, social benefits and protection for labourers, and an increasing appliance of temporary and flexible labour agreements which are often associated with a decrease in labour rights
and social benefits (ILO, 2007; Lloyd & James, 2008). A lack of rights and social benefits applies especially to migrant workers, who are widely employed in the food processing industry and packaging houses in developed economies are reported to be marginalized and at risk from exploitation and abuse (ILO, 2013b, 2015d).
Lastly there is a range of occupational health and safety concerns that should be mentioned. Although food manufacturing workers are spared some of the dangers associated with agriculture (e.g. pesticide and chemical exposure), there are some consistent health and safety issues associated with the work in the sector (which is often physically demanding and repetitive) such as muscular pains and discomfort. The specific health and safety issues differ per sector. Musculoskeletal disorders, resulting from carrying heavy or awkward loads, are common in the beef and poultry processing industry together with trauma from electrical or manual cutting (Graham, J.C., Jensen, G., Malagie, M., Smith, 2015; James, S. Loyd, 2008). In fish processing chains, the main health and safety issues are similar and furthermore include prolonged exposure to noise, low temperatures and the inhalation of wet and dry aerosols (Jeebhay, Robins, & Lopata, 2004). In the fruit and vegetable production chains the most prevalent health and safety issues relate to continued exposure to chemicals and pesticides, physical strain, working in adverse temperatures and inadequate hygiene and sanitation (Dolan & Sorby, 2003).
Workers at the L & H beef slaughterhouse in San Antonio, TexasCreative Commons: US Department of Agriculture

110
3.2.2 Food Security And Nutrition
The global food system currently fails to provide significant portions of the global population with food security.
UNDERNOURISHMENTOne of the most visible aspects of global food insecurity is the prevalence of undernourishment in developing countries. According to the FAO around 795 million people were malnourished in 2015, of which the vast majority (780 million) are living in developing countries (Marx, 2015).
The largest number of undernourished people live in Asia and Sub-Saharan Africa; these regions account for 65.6 and 29.8 percent of the total undernourished population in developing countries respectively. In relative terms the situation is most desperate in Sub-Saharan Africa where a share of 23.2 percent of the population is undernourished (Marx, 2015). In developed nations under-nourishment only affects a marginal fraction of the population.
UNDERNUTRITIONCaloric intake alone does not say much about the nutritional value of the food consumed. Even when calorie intake is sufficient, inadequate diets can result in nutrient deficiencies, such as a lack of iodine, iron, or certain vitamins. It is estimated that globally, two billion people lack sufficient vitamins and minerals essential for good health (Black, 2003). Two of the most impactful and most widespread nutrient deficiencies globally are Vitamin A and Iodine deficiencies, both of which occur mainly in the Global South. Vitamin A deficiencies are a public health problem in over half of the world’s nations, especially in Africa and South East Asia (Black, 2003). Although the number of countries in which the prevalence of iodine deficiencies is a public health problem has halved in the past decade, it is still a problem in 54 nations. The percentage of the population with an iodine deficiency is especially high in Africa, South East Asia, and Europe (de Benoist, Andersson, Egli, Takkouche, & Allen, 2004).
The right to food is recognized in the United Nations Declaration on Human Rights as part of the right to a decent standard of living, and has also been highlighted by the Committee on Economic Social and Cultural Rights (CESCR) and the United Nations Special Rapporteur on the Right to Food. Food security is the measure to which this human right is lived up to. The World Food Summit in Rome agreed that food security exists where: “all people, at all times, have physical and economic access to sufficient, safe and nutritious food to meet their dietary needs and food preferences for an active and healthy life” (FAO, 1996).
Two of the most vulnerable groups affected by these deficiencies are women and children. Children are especially vulnerable in the face of malnutrition since it can hamper both physical and mental development processes. According to joint estimates by the World Bank, UNICEF, and the WHO, over 161 million children under 5 years old, or 25% of all children under 5 are stunted: they are so malnourished that they do not reach their full physical and cognitive potential (UNICEF, 2013).
OVER-CONSUMPTIONAt the same time, approximately 2 billion people are overweight (having a Body Mass Index (BMI) equal or greater than 25). (Stuckler & Nestle, 2012), and the prevalence of obesity (a BMI of 30 or greater) doubled between 1980 and 2008 (de Schutter, 2014). Being overweight or obese increases the risk of non-communicable diseases such as for example type 2 diabetes or coronary heart disease. The World Health Organization estimates that at least 2.7 million people die across the globe every year as a result of being overweight or obese (WHO, 2015b).
As illustrated in Figure 25, overweight and obesity are most widespread in developed economies. With an average of 45.7% of their population over-acquiring food, versus an average percentage of 27.6 in developing nations (Food and Agriculture organisation of the United Nations, 2015b). However, while the prevalence of overweight and obesity has risen in all regions, and nearly all countries between 1990 and 2014 (Food and Agriculture Organization of the United Nations, 2014), the percentage of the population over-acquiring food has risen more sharply in the developing nations, than in developed ones (Food and Agriculture Organization of the United Nations, 2015b). In both developed and developing nations, it is often the lower socioeconomic class that is most susceptible to over-consumption, partly due to the consumption of processed foods. These are cheap, but combine high caloric density with low nutritional value.

THE GLOBAL FOOD SYSTEM: AN ANALYSIS 111
03 IMPACTS
DOUBLE BURDEN The rapidly developing and middle income countries, like the BRICS, are increasingly confronted with the so-called ‘double burden of malnutrition:’ both the undernourished as well as the overweight fractions of the population are rising. Contrary to popular belief, it is often the lower classes that suffer the most from obesity. Driven by limited financial resources, these people become dependent on high calorie, low nutritional cheap processed foods. These cause overweight in adults and malnutrition in young children due to vitamin deficiencies. Studies show that 22–66% of households in these countries can be classified as double burden households, which have both an undernourished person as well as an overweight person (Doak, Adair, Bentley, Monteiro, & Popkin, 2005).
DRIVERS OF FOOD SECURITYThe extent of food security is determined by four main drivers: the availability and accessibility of food, stability and the utilization of food.
The actual amount and diversity of food available has grown in most regions. The main reason for this is that the growth in food production has outstripped population growth in the past decades. Globally, per capita food supply rose from about 2.200 kcal/day in the early 1960s to more than 2.800 kcal/day by 2009 (FAO, 2015). Despite this average global increase in food output, food availability remains insufficient in Southern Asia and Africa.
Despite a rise in food availability, the physical or economic access to food remains problematic mostly in developing regions due to high poverty rates, poor infrastructure for transportation and distribution of food, but also due to other factors such as armed conflict and natural disasters (FAO, 2010). Globally, economic access to food has increased significantly: GDP per capita has risen 36% from 2000 to 2013, while the relative price of food, has increased across the globe with only 18.1% (FAO, 2010). However, speculation on commodities is a major contributor to extreme price volatility, which skews agriculture commodity markets to such a degree that both farmers and consumers are impacted (IATP, 2008).
The stability of food access and availability remains a challenge, especially in regions which rely heavily on international markets and are characterized by low domestic food availability. Import dependency makes these regions vulnerable in the face of price or supply volatilities on the global market. These issues are especially relevant in Sub-Saharan Africa, the Middle-East, North Africa and the Caribbean (FAO et al., 2015).
Utilization is often used synonymously with nutrition, but the term also includes also food storage, processing, health and sanitation. Factors like gender, family income, knowledge, and sanitation all play a role in how food is utilized by the body, however these are rarely the only factors, and often are aggravated by poor availability, accessibility, and stability (World Bank, 2006).
The boundaries and names shown and the designations used on this map do not imply the expression of any opinion whatsoeveron the part of the World Health Organization concerning the lega status of any country, territory, city or area or of its authorities,or concerning the delimitation of its frontiers or boundaries. Dotted and dashed lines on maps represent approximate border linesfor which there may not yet be full agreement.
Data Source: World Health OrganizationMap Production: Health Statistics and Information Systems (HSI)World Health Organization WHO 2015. All rights reserved.
22.5
Mean Body Mass Index (kg/m2)
22.6-24.9
25.0-27.4
27.5-29.9
30.0
Data not available
Not applicable
Mean Body Mass Index (kg/m2), ages 18+, 2014 (age standardized estimate)Male
Figure 25: A global overview showing the mean body mass index (kg/m2). (World Bank, 2014b)
REGIONAL DISTRIBUTION OF MEAN BODY MASS INDEX
112
3.2.3 Food Safety
More than 200 diseases are spread through food and millions of people fall ill due to food borne diseases (World Health organisation (WHO), 2015a). Vulnerable people, especially in the developing world, like infants, the sick, and the elderly generally face more severe consequences from food borne illnesses. Not only is human health affected by food borne diseases, they also impede socioeconomic development by straining health care systems, and harming national economies, tourism, and trade (World Health organisation (WHO), 2014). Outbreaks of food borne illnesses, for example, can have a negative effect on the reputation of a region for tourism (Smith DeWaal & Robert, 2005). Unfortunately, there is little aggregated and comparable data at the global level on food safety issues (Smith Dewaal, Robert, Witmer, & Tian, 2010).
FOOD-BORNE TOXINSEstimates for the effects of chemical and toxins on humans are hard to obtain, since the time between exposure and symptoms is long, and many diseases occur only after long-term chronic exposure. However, chemicals present in food can cause cancer, birth defects, and damage to the nervous, reproductive, and immune systems (Rocourt, Moy, Vierk, & Schlundt, 2003).
Well-known chemical contaminants are dioxins and PCBs, which are highly toxic and accumulate in the food chain as unwanted by-products of industrial processes and waste incineration. Heavy metal contamination of food products can happen via inhalation, feeding, water, and handling, like through contaminated shipping container (World Health Organization (WHO), 2014).
Demographic changes, such as a larger participation of women in the workforce, a larger percentage of elderly population, and higher numbers of immunosuppressed people contribute to the increased the incidence of foodborne illness events. Additional factors include the consumption of minimally packaged, poorly processed or cooked food, and lack of hygiene knowledge (Hotchkiss, 1997; Seaman & Eves, 2006).
PATHOGENSA pathogen is an organism (e.g. bacterium, virus, or fungus) which causes a disease. In the USA, there are 76 million cases of pathogen-caused food borne disease per year, of which 5,000 result in deaths. The WHO estimates that these numbers are representative of OECD member countries. Incident rates for disease are vary between contaminants, but have for instance shown no change since 2006 for the nine most common pathogens in the U.S. These same patterns are visible for the EU (EFSA, 2014). Yet, for most infections incidence rates are still well above national health targets, keeping food safety a high priority topic across nations (Center for Disease Control and Prevention, 2013; Center for Disease control and Prevention, 2013).
BACTERIAAmong the most common food borne pathogens are the bacteria Salmonella and E. coli, which affect millions of people annually. Animal products are the main sources of contamination with Salmonella. On the other hand, E. coli can be spread through both raw animal products and fresh fruits and vegetables. Vibrio cholerae is another common bacterium that is spread through rice, vegetables, millet gruel, and seafood. Around 30% of illnesses and 72% of deaths attributed to food borne pathogens are
Food safety has to do with the prevention of food borne illnesses, and has become an important point of the agenda of organisations as WHO and governmental institutions. The number of food-related infections and incident rates vary between pathogens or chemicals over time, as well as the types or variants of pathogens. Food borne illnesses are either infectious or toxic in nature. Infectious illnesses are caused by pathogens including bacteria, viruses, parasites, and prions. Toxic illnesses are caused by biological agents, like fungal and bacterial toxins, or chemical agents, like Persistent Organic Pollutants (POPs) and heavy metals. Effects vary from diarrhoea, infections, poisoning and long-term diseases, like cancer.
About 60% of all human diseases and 75% of
emerging diseases have originated from animals
in the past 3 decades.
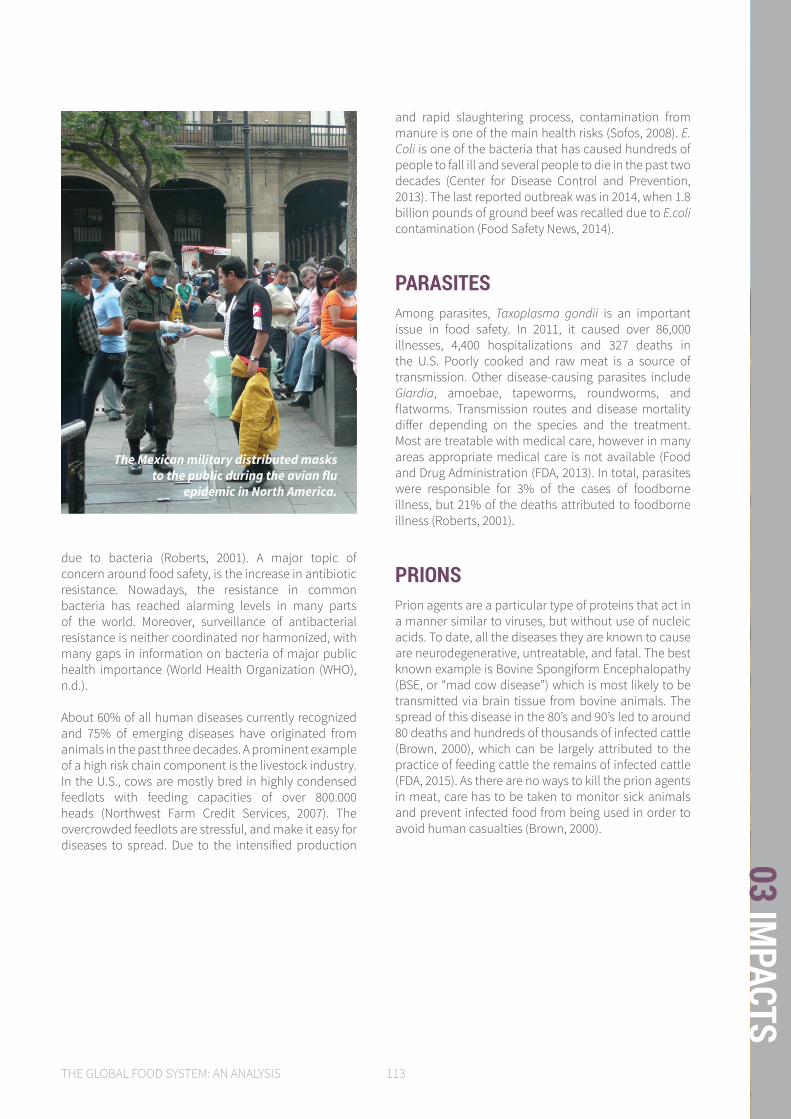
THE GLOBAL FOOD SYSTEM: AN ANALYSIS 113
03 IMPACTS
due to bacteria (Roberts, 2001). A major topic of concern around food safety, is the increase in antibiotic resistance. Nowadays, the resistance in common bacteria has reached alarming levels in many parts of the world. Moreover, surveillance of antibacterial resistance is neither coordinated nor harmonized, with many gaps in information on bacteria of major public health importance (World Health Organization (WHO), n.d.).
About 60% of all human diseases currently recognized and 75% of emerging diseases have originated from animals in the past three decades. A prominent example of a high risk chain component is the livestock industry. In the U.S., cows are mostly bred in highly condensed feedlots with feeding capacities of over 800.000 heads (Northwest Farm Credit Services, 2007). The overcrowded feedlots are stressful, and make it easy for diseases to spread. Due to the intensified production
The Mexican military distributed masks to the public during the avian flu
epidemic in North America.
and rapid slaughtering process, contamination from manure is one of the main health risks (Sofos, 2008). E. Coli is one of the bacteria that has caused hundreds of people to fall ill and several people to die in the past two decades (Center for Disease Control and Prevention, 2013). The last reported outbreak was in 2014, when 1.8 billion pounds of ground beef was recalled due to E.coli contamination (Food Safety News, 2014).
PARASITESAmong parasites, Taxoplasma gondii is an important issue in food safety. In 2011, it caused over 86,000 illnesses, 4,400 hospitalizations and 327 deaths in the U.S. Poorly cooked and raw meat is a source of transmission. Other disease-causing parasites include Giardia, amoebae, tapeworms, roundworms, and flatworms. Transmission routes and disease mortality differ depending on the species and the treatment. Most are treatable with medical care, however in many areas appropriate medical care is not available (Food and Drug Administration (FDA, 2013). In total, parasites were responsible for 3% of the cases of foodborne illness, but 21% of the deaths attributed to foodborne illness (Roberts, 2001).
PRIONSPrion agents are a particular type of proteins that act in a manner similar to viruses, but without use of nucleic acids. To date, all the diseases they are known to cause are neurodegenerative, untreatable, and fatal. The best known example is Bovine Spongiform Encephalopathy (BSE, or “mad cow disease”) which is most likely to be transmitted via brain tissue from bovine animals. The spread of this disease in the 80’s and 90’s led to around 80 deaths and hundreds of thousands of infected cattle (Brown, 2000), which can be largely attributed to the practice of feeding cattle the remains of infected cattle (FDA, 2015). As there are no ways to kill the prion agents in meat, care has to be taken to monitor sick animals and prevent infected food from being used in order to avoid human casualties (Brown, 2000).

114
3.2.4 Preservation Of Culture and Rights
Since the 1990s, the field of ‘biocultural’ studies has investigated the link between biological and cultural diversity, establishing that areas of flora and fauna diversity were the centres of rich cultural evolution (Green, Cornell, Scharlemann, & Balmford, 2005). The argument is that cultural diversity is an adaptive response to niches of ecological diversity. Modern industrial agriculture looks to homogenize ecosystems and food practices as a measure of efficiency but in doing so, can inhibit cultural practices, undermining ecosystems and identities. Food traditions require communication and the passing of knowledge through language and when language is lost, traditional food practices are put at risk (Jacques & Jacques, 2012). One example of this can be found in the Philippines, where local populations were pressured into abandoning traditional rice cultivars in favour of modern agri-technical strands together with their pesticides and fertilisers. This adoption of these new farming practices led to the abandonment of the Ifuguao language and the loss of intimate knowledge related to their traditional rice technologies (Harrison, 2007). Other examples exist such as the Ainu people of Japan. They practiced traditional hunting and fishing in a way that preserved wetlands and contributed to their culture. But the introduction of rice and fabrics pressured them to commodify their products. This commodification lead to overfishing but also to changes in other cultural aspects, most notably a reduction in the number of gods recognized by their belief system (B. Walker, 2006). Similar dynamics are also documented in Native American populations in the US and elsewhere (White, 1994).
LAND RIGHTSA critical issue when considering sustainable management of agricultural lands and human welfare is need to recognize indigenous land rights by non-indigenous interest groups (Cotula, Vermeulen, Keeley, & Leonard, 2009). These can be business investors, governments, international development funds or even local farmers looking to utilize larger land area’s (Cotula et al., 2009). These lands and territories provide food, material resources and often spiritual connectedness on which the traditional communities depend but these values may go unrecognized by outsider interests (Walker, 2006). The people-land relationship is a part of cultural identity; this relationship is
often ingrained into their language, practices, rituals, and history (Bramley, 2014). Therefore, the loss of traditional lands, which are the socioeconomic and environmental space on which community life occurs, endangers not only the material basis of these groups’ survival, but also the preservation of their culture and heritage. This is also why many peasant and indigenous political movements, such as the Zapatistas, have actively used systems of agricultural production as the symbolic and material core of their fight against the influence of dominant, foreign cultures on their own (Walker, 2006). And this is why it is important to investigate the mutual interactions between the dynamics of production systems and cultural heritage.
Land privatization, titling, and registration programmes, as opposed to common property regimes, can have negative effects on community identity, health, and livelihoods. For example, in Uganda, 60% of pastoralists have been driven off their land for investment. Local farmers also suffer from knowledge imbalances as there is often a lack of local and/or national government support, especially with regard to clarity in terms of farmers’ rights. In many cases, there is a lack of support and representation from local and national governments. Although many indigenous communities have the right of consultation and expression of views regarding national projects, these rights are rarely carried out appropriately due to various communication and power imbalance issues (Bramley, 2014).
LAND ‘GRABBING’In the past decade, the amount of foreign investment in cash crops and large-scale plantations has increased, displacing indigenous populations and driving further biodiversity loss (Zoomers, 2010). Approximately 126 countries participate in international land trade, with China being the most dominant. While estimates on the actual displacement of indigenous populations is not readily available due to a lack of consistent data and reporting, the results of virtual land trading shows that 82.2 million hectares of land were sold in international deals between 2000 and 2012 (Seaquist, J, Johansson, E, & Nicholas, 2014).
In Africa in particular, large-scale land acquisitions are pushed by investment programs, food security concerns
The food system is about more than the provision of livelihoods and food security alone: it carries within it a vast variety of cultural practices, religious activities, ceremonies and traditions from which people construct both collective and individual identities (Jacques & Jacques, 2012). These socio-cultural systems are often closely interrelated to local ecosystems. For these communities, fulfilling lives are inextricably linked to the ecosystems that support them. Preserving such cultural systems therefore goes hand in hand with the preservation of biospheric integrity discussed earlier.

THE GLOBAL FOOD SYSTEM: AN ANALYSIS 115
03 IMPACTS
as well as local small-scale farmers scaling up (Cotula et al., 2009). The uproar over specifically African land-grabbing arises, because newly established farms are export driven to serve the domestic needs of investor countries at the expense of local livelihoods, and especially that a lot of deals have a complete lack of transparency. In many cases where local farmers have been given land, they lack the resources, technologies and access to markets to climb out of poverty traps. Thus enabling those with little knowledge or access to political representation to have their land rights abused and their culture undermined (Bramley, 2014).
A GLOBAL FOOD CULTURE?Aside from land, food itself is an important, material, carrier of culture and symbol of identity. Food culture arises from a people’s place of origin and it’s influenced by available resource, belief and information systems, ethnicity, technology, health, and history (Jacques & Jacques, 2012). After WWII, Western food culture
changed substantially not only because women entered the workforce, but also because pre-war recipes were no longer feasible (Pearson & Gillett, 1996). Instead, substitute materials with lesser nutritional benefit but greater accessibility have taken their place. This has become one of the significant drivers of large scale processing companies, who were able to utilize inexpensive, refined inputs to create new kinds of foods (Pearson & Gillett, 1996).
Presently, globalization results in greater standardization and an Americanization of cultures, as evidenced by the spread of American-style fast-food chains, colloquially called ‘McDonaldization’. McDonald’s alone has over 34,000 restaurants in over 120 countries (Chalabi & Burn-Murdoch, 2013). On the other hand, there is a re-localisation of food as counter to homogenization (Kranjac, 2012). However, culinary heritage is seeing somewhat of a revival for rural tourism, with tourists seeking an ‘authentic’ experience., This is tied to the certification of origin of particular heritage foods, such as cheese and wine in Europe (Sims, 2009).
1,000,000 - 5,000,000
500,000 - 1,000,000
100,000 - 500,000
50,000 - 100,000
0 - 50,000
No data
1,000,000 - 5,000,000
500,000 - 1,000,000
100,000 - 500,000
50,000 - 100,000
0 - 50,000
No data
1,000,000 - 5,000,000
500,000 - 1,000,000
100,000 - 500,000
50,000 - 100,000
0 - 50,000
No data
Figure 25: A global overview of land grabs per country. A “land grab” is defined as a large-scale land acquisition made by a foreign
investor (World Bank, 2014b)
OCCURRENCES OF LAND GRABBING PER COUNTRY

116
3.2.5 Animal Welfare
The major problem around many industrial farms is that they restrict animals in performing their natural behaviours, as grazing, stretching, general free movement and social interactions. By now, this is broadly recognized as a causality for stress in animals, and therefore affects animal welfare. Other animal treatments that are very common in food production and which are at the centre of public debate, are practices as (unsedated) tail dockings, castrations, and beak trimming, and even physical abuse or violent handling by farmers and workers.(Parente & van de Weerd, 2012).
Although animal welfare is harder to measure amongst fish than for instance in cows and chicken, there is growing evidence that aquatic species suffer from pain and stress in fishing and aquaculture practices (National Veterinary Institute, 2008). Fish are subject to stressors such as crowding during breeding and capture, poor water quality, food deprivation, exhaustion, injuries, and the most traditional way of slaughtering, asphyxia, which means suffocation by being taken out of water. These are just a few examples of the conditions fish are in and which indicate that current fishing and aquaculture practices negatively influence animal welfare (Bergqvist & Gunnarsson, 2011).
REGULATIONS AND POLICIESUntil the 1970s, the pressure for legislation and guidelines around animal welfare typically came from journalists and campaigners. Nowadays, also governmental bodies and NGOs, like the UN, are (lobbying for) stating that “animals are sentient and consequently that legislation should ensure their welfare.” The increase in concern around animal welfare is reflected in the amount of research conducted on the topic, which has been steadily increasing by 10-15% over the last two decades. This is essential for future policies and guidelines on animal welfare in the food industry, as a great deal of legislation is based on scientific research (M. Walker, Diez-Leon, & Mason, 2014).
Many countries in the developed world have binding laws around animal welfare, next to which non-binding codes of practice and voluntary schemes for certification exist (FAO, 2008). These certifications have been introduced in response to consumer demand, and are being developed by animal welfare organisations, as well as food retailers as food businesses, including retailers, food service operators and food manufacturers. Non-legislative actions are playing an important role in improving animal welfare and involve stakeholders such as non-governmental organisations (NGOs) and non-profit organisations (FAO Investment Center, 2014).
On a more global level, the World Organization for Animal Health (OIE) recently developed international Codes on animal health and welfare which are aimed at promoting safe international trade between WTO members. Other international organisations, FAO, OIE, the Council of Europe and the World Bank’s IFC, have played a major role in the formulation of international legislation and standards concerning animal welfare (Ramírez, Patel, & Blok, 2006). Despite the known detrimental effects to animal welfare, some development organisations are still promoting and encouraging intensive livestock and aquaculture systems in developing countries. Moreover, a recent report from FAO concluded that the implementation of the OIE recommendations is poor in many of its member countries, particularly in the developing world. Altogether, the challenges around animal welfare far from being solved and will remain a global political point of concern (World Animal Net (WAN), 2015).
Welfare does not only concern human beings, but also animals. The definition of animal welfare according to The World Organization for Animal Health (OIE) refers to how well an animal is able to cope with the conditions in which it lives (World Organization for Animal Health, 2013). There are at least four times more livestock animals than the total amount of humans on earth, and trillions of fish directly concerned with our food production (FAO, 2015b; Mood, 2010). This excludes the number of wild caught invertebrates and fish in aquaculture, and all wild animals that are indirectly affected by habitat destruction, toxification, and waste. Animal welfare is inherently connected to our food system and should be taken into account in a comprehensive assessment of its performance.

THE GLOBAL FOOD SYSTEM: AN ANALYSIS 117
03 IMPACTS
ECONOMIC FACTORSA last major driver of lacking animal welfare are the costs associated with less intensive production systems, or perceived to be associated with them. Changing conditions to improve animal welfare are associated with higher costs, which initially is generally the case. On the other hand, there is also a clear business sense for raising standards for animals. The OIE estimates that, on a global scale, mortality and morbidity due to animal diseases cause the loss of at least 20% of livestock production (FAO-OECD, 2015). This amount equals at
least 60 million tonnes of meat and 150 million tonnes of milk, and a value of US$ 300 billion a year. Moreover, the majority of consumers in the EU and North America have indicated to be willing to pay more for animal friendly products. However, consumer demand for “lower welfare” products is still much higher compared to the demand for higher welfare products. It is likely that this is related to the lack of general knowledge/awareness about the various welfare issues involved in animal production systems (FAO Investment Center, 2014).
A glimpse inside of an intensive poultry farm for broiler chickens.Creative Commons: Oikeutta Elaimille

118
This chapter’s overview of the key impacts resulting from the functioning of the food system illustrates the breadth and depth of the problems at hand. In this discussion, we first turn back to the FAO’s projections, which were introduced at the end of Chapter 2, and consider them once again in light of the impacts described here. Despite the FAO’s conclusions that the global resource base is sufficient to fulfill the anticipated growth in demand by 2050, this claim primarily focuses on physical availability of resources, and does not take into account planetary boundary constraints. A future pathway focused primarily on the continuation of historic expansion trends, as described in Chapter 2, presents unacceptably large risks in a few key impact areas (e.g., biodiversity loss, biogeochemical cycles). An alternative and more nuanced combination of strategies, including strong approaches to demand reduction and ensuring equitable food access, must provide a balancing counterpart to any increases in growth in production that occur. Moreover, the very nature of the food system’s future growth should take on a significantly lower-impact character than it had in the early era of the Green Revolution.
Before we turn to what a balanced strategy for the development of the food system could look like (in Chapter 5), we must also consider the nature of the impacts at hand and how these could be tackled from a systemic perspective. Priority should be given to the largest and most severe impacts that bring us closest to potential tipping points in both biophysical and human systems (e.g., climate change, antibiotic resistance) and impacts broadly seen as irreversible (biodiversity loss, loss of culture and heritage). Finally, strategies aimed at transforming the food system should be aimed at addressing root causes, which are often shared between multiple impacts (poverty traps), rather than dealing with superficial symptoms or more proximate causes (undernourishment). Chapter 4 continues with a more in-depth discussion of underlying system structures and root causes that should be primary points of focus for a broader system transition.
KEY MESSAGES:
» Though the FAO’s 2012 global food projections study concluded that sufficient global resources exist to supply the 2050 projected global food demand, these conclusions are based primarily on the physical availability of basic resources and do not take into account the continued likely transgression of key planetary boundaries.
» The four planetary boundaries that have already been transgressed (biospheric integrity, N and P cycles, and climate change) place limits on the further expansion of the food system. In particular, biospheric integrity is an apex boundary that is further breached when any of the other boundaries are impacted. Based on the overview of food system impacts presented in this chapter, we conclude that the food system cannot expand under current practices to meet the projected needs of the human population by 2050 without further crossing planetary boundaries that have already been severely transgressed.
» In addition to the planetary boundaries, a second set of limits to the expansion of the food system under current practices is the depletion of key non-renewable or slowly renewable resources (soils, fossil fuels, fossil water, mineral nutrients).
» When developing strategies for moving towards a sustainable, resilient food system we must consider the systemic nature of the behaviours and impacts within the system.
3.3
DISC
USSI
ON
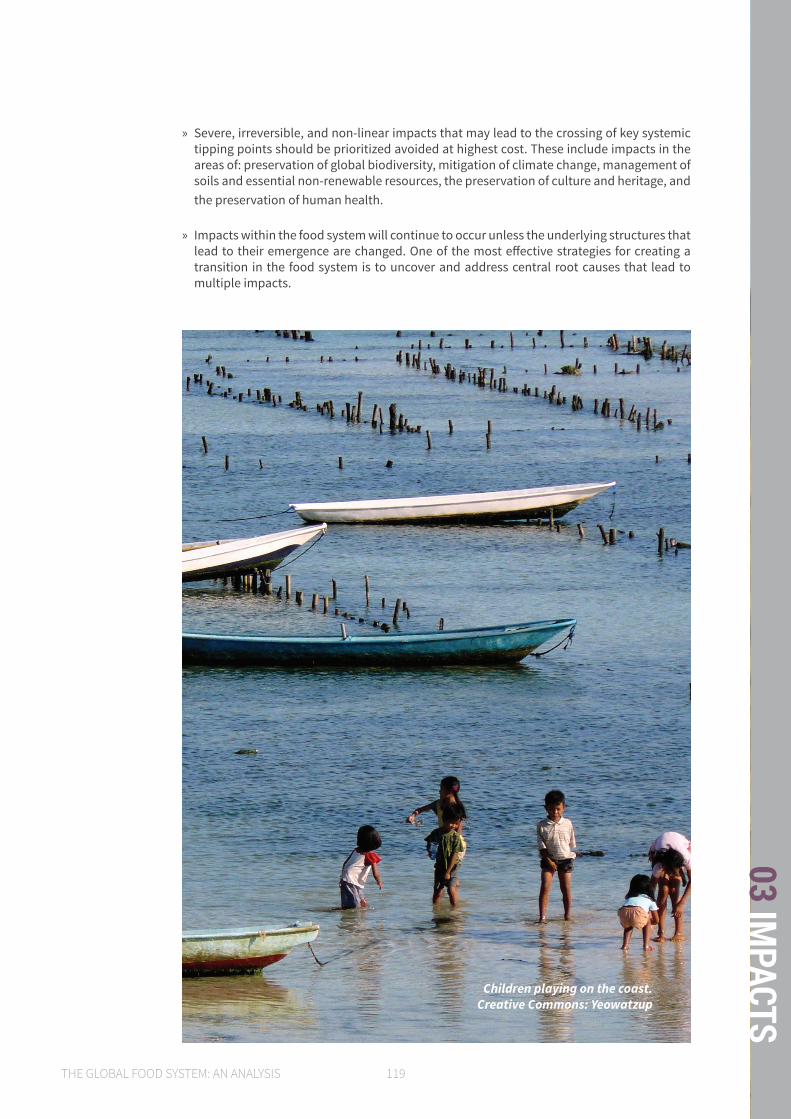
THE GLOBAL FOOD SYSTEM: AN ANALYSIS 119
03 IMPACTS
Children playing on the coast.Creative Commons: Yeowatzup
» Severe, irreversible, and non-linear impacts that may lead to the crossing of key systemic tipping points should be prioritized avoided at highest cost. These include impacts in the areas of: preservation of global biodiversity, mitigation of climate change, management of soils and essential non-renewable resources, the preservation of culture and heritage, and the preservation of human health.
» Impacts within the food system will continue to occur unless the underlying structures that lead to their emergence are changed. One of the most effective strategies for creating a transition in the food system is to uncover and address central root causes that lead to multiple impacts.
120
With a more complete look at the range and severity of the impacts associated with the food system, we now return to the FAO’s projections for 2050, which, as reviewed in the discussion section of Chapter 2, expect at least a 60% expansion in food production over 2005/07 levels. This growth is expected to come from a combination of yield improvements (80%) and an increase in arable land (20%). Yield increases are generally assumed to derive from conventional intensification techniques (improved crop varieties, fertilisers, pesticides, mechanisation, and, where possible, irrigation) (Alexandratos & Bruinsma, 2012).
According to the projections’ authors, there are sufficient land, water, and fertiliser resources available to support this anticipated growth in food output, though achieving this growth is still presented as great challenge considering the increased scarcity and unequal geographic distribution of these resources. However, what is not considered sufficiently in the projections, and in some cases barely at all, are other limits to the food system’s expansion related to the planetary boundaries and other impact areas presented in this chapter.
LIMITS TO THE EXPANSION OF THE FOOD SYSTEMWhether we consider crop or animal production (terrestrial or aquatic), growth strategies involving either expansion or intensification are typically associated with severe and non-linear impacts. Even if it could be argued that the planetary system can withstand another round of food system expansion between now and 2050, when population is expected to reach 9.7 billion, it becomes very challenging to maintain this line of reasoning for the phase of growth that would be required between 2050 and 2100, when the world’s population is projected to reach over 11 billion people (United Nations, 2015). This points to the need for a paradigm shift in thinking about the structure of the global food system.
Without aiming to reiterate the impact areas presented in this chapter, here we highlight a few of the main constraints and threats to the continued growth of the food system that we believe are inadequately considered in the FAO’s projections and related policy-oriented scenarios.
BIOSPHERIC INTEGRITY AS A KEY SYSTEM BOUNDARY
Biospheric integrity is the most severely transgressed of all planetary boundaries identified by the Stockholm Resilience Centre (Steffen et al., 2015). The food system is the largest single contributor to biodiversity loss out of all human activities, while at the same time being highly dependent on the maintenance of biodiversity for its continued functioning. Ecosystem services, like pollination,
soil fertility, pest control, and water purification, are difficult to account for and their importance to agriculture is systematically under-appreciated (Power, 2010). These services can be classified as “emergent systemic features” that are dependent on the healthy maintenance of commonly shared resources like air and water quality, forests, and healthy soils (see relevant discussion on the “Tragedy of the Commons” in section 4.4).
The emergent nature of these services, and their dependency on public, common goods, makes them particularly challenging to quantify or protect. It is difficult to connect large-scale changes in ecosystem services with singular activities (like the clearing of a stretch of forest). There is little insight into related systemic tipping points (how much over-application of fertilizer on individual farms will lead to a large-scale eutrophication event?). Time-delays between action and impact can also cloud relationships between activities (is the application of neonicotinoids responsible for declines in bee populations? (Budge et al., 2015)). This makes it challenging to set appropriate limits for individual activities that collectively pose a grave risk.
Despite these difficulties, we argue that the critical nature and irreversibility of biodiversity-related impacts calls for a much more precautionary stance in agricultural policy setting than has been seen thus far. The structural depletion of biodiversity should be considered a hard boundary for the expansion of the food system, which is currently far from the case.
Biospheric integrity is impacted by most of the practices within the food system. This hard boundary should ideally be integrated in a number of agricultural policy areas, including, but not limited to:
» Arable land and pasture: The FAO’s projections estimate a 120 million hectare expansion of arable land in developing countries by 2050 (12% over current levels), offset by a decline of 50 million hectares (8%) in developed ones, resulting in a net total increase of less than 5%, around 70 million hectares (FAO, 2009a). Though this net total increase in arable land is considered to be relatively small, the most problematic aspect of this change is that a majority of these land conversions will occur in developing countries with high biodiversity indices. This is anticipated to lead to a disproportionately high impact on biodiversity loss, which will not be offset by natural reclamation of agricultural land in the developed world. Since habitat conversion is the primary driver of terrestrial biodiversity loss, arable land expansion should be regarded more as a last resort than an inevitable pathway when setting policy plans for agricultural development. If croplands must expand, then it is critical to consider where the lowest-impact areas for expansion would be, and create policies to strongly incentivise these directions. The World Resources Institute suggests that expanding palm
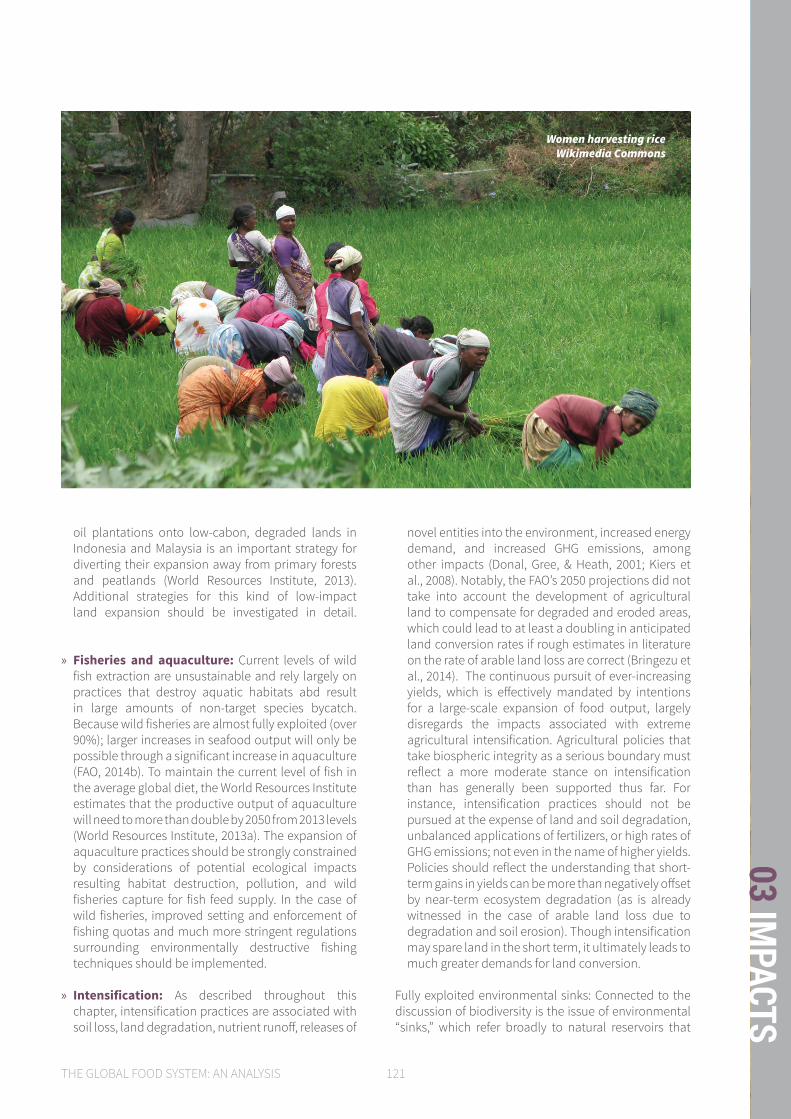
THE GLOBAL FOOD SYSTEM: AN ANALYSIS 121
03 IMPACTS
oil plantations onto low-cabon, degraded lands in Indonesia and Malaysia is an important strategy for diverting their expansion away from primary forests and peatlands (World Resources Institute, 2013). Additional strategies for this kind of low-impact land expansion should be investigated in detail.
» Fisheries and aquaculture: Current levels of wild
fish extraction are unsustainable and rely largely on practices that destroy aquatic habitats abd result in large amounts of non-target species bycatch. Because wild fisheries are almost fully exploited (over 90%); larger increases in seafood output will only be possible through a significant increase in aquaculture (FAO, 2014b). To maintain the current level of fish in the average global diet, the World Resources Institute estimates that the productive output of aquaculture will need to more than double by 2050 from 2013 levels (World Resources Institute, 2013a). The expansion of aquaculture practices should be strongly constrained by considerations of potential ecological impacts resulting habitat destruction, pollution, and wild fisheries capture for fish feed supply. In the case of wild fisheries, improved setting and enforcement of fishing quotas and much more stringent regulations surrounding environmentally destructive fishing techniques should be implemented.
» Intensification: As described throughout this chapter, intensification practices are associated with soil loss, land degradation, nutrient runoff, releases of
novel entities into the environment, increased energy demand, and increased GHG emissions, among other impacts (Donal, Gree, & Heath, 2001; Kiers et al., 2008). Notably, the FAO’s 2050 projections did not take into account the development of agricultural land to compensate for degraded and eroded areas, which could lead to at least a doubling in anticipated land conversion rates if rough estimates in literature on the rate of arable land loss are correct (Bringezu et al., 2014). The continuous pursuit of ever-increasing yields, which is effectively mandated by intentions for a large-scale expansion of food output, largely disregards the impacts associated with extreme agricultural intensification. Agricultural policies that take biospheric integrity as a serious boundary must reflect a more moderate stance on intensification than has generally been supported thus far. For instance, intensification practices should not be pursued at the expense of land and soil degradation, unbalanced applications of fertilizers, or high rates of GHG emissions; not even in the name of higher yields. Policies should reflect the understanding that short-term gains in yields can be more than negatively offset by near-term ecosystem degradation (as is already witnessed in the case of arable land loss due to degradation and soil erosion). Though intensification may spare land in the short term, it ultimately leads to much greater demands for land conversion.
Fully exploited environmental sinks: Connected to the discussion of biodiversity is the issue of environmental “sinks,” which refer broadly to natural reservoirs that
Women harvesting riceWikimedia Commons
122
are able to absorb or process chemicals from other parts of their natural cycle (for example, trees are carbon sinks in the carbon cycle). Pushing beyond the boundaries of environmental sinks presents threats to both global biodiversity and human wellbeing. In many cases, the boundaries of environmental sinks are not strictly defined or quantified; this is generally the case with novel entities, because they are not part of a natural cycle. Three environmental sinks, which we argue should play a stronger role in setting a balanced agricultural policy, are nutrient sinks (namely, nitrogen deposition from both synthetic and biological sources, like legumes), atmospheric sinks of greenhouse gases that cause climate change (which are largely contributed to through agriculture by carbon dioxide, methane, and nitrous oxide emissions), and various sinks for novel entities (which are generally poorly understood, and require greater precaution).
UNSUSTAINABLE RESOURCE DEPLETION The question of resource depletion is in many cases related, but nonetheless distinct from the issues described above, which directly impact biospheric integrity. Certain resources that the human economy currently relies on are non-renewable (or very slowly renewable), and are currently being used at rates far greater than they are regenerated. In some cases this unsustainable resource use can also have direct ecological impact (non-renewable water reserves, soils), in other cases, the impact is largely economic (fossil fuels, phosphorus). Our food system is currently largely reliant on the extraction of non-renewable and slowly renewable resources at an unsustainable rate, which translates into risks for its continued functioning, without even considering systemic expansion. Some of the resource limits we argue should be more strongly considered as “expansion boundaries” in policy measures include:
» Water: Though water resources are already generally considered to be a limiting factor for the growth of the food system; insufficient attention is paid to our reliance on depleting so-called ‘fossil groundwater’ (water deposits from earlier geological periods, which are not currently recharged) as well as non-renewable water resources (those which have exceedingly slow recharge rates not relevant on a human time-scale). Currently, at least 4% of agricultural activities are dependent on the extraction of water from non-renewable resources, though this figure is known to be incomplete due to lack of sufficient data (UNESCO, 2006).
» Soil: Conventional agriculture practices have been shown to deplete soil levels at a rate of 10 – 100 times greater than the geological background formation rate (Montgomery, 2007). Because of the naturally slow rate of soil formation, soil can effectively be considered a non-renewable resource. Soil depletion should be considered a much stronger boundary in the setting of agricultural
policies, which should aim to reduce depletion rates to at least at the geological background rate of formation. This has been shown to be achievable through the implementation of conservation agriculture practices (Montgomery, 2007), and can also result from improved livestock management (Horrigan, Lawrence, & Walker, 2002; Ward, Ngairorue, Kathena, Samuels, & Ofran, 1998).
» Fossil fuels: Though less prominent in discussions on agricultural resource shortages in writings by the FAO, UNEP, and the World Bank, the finite nature of fossil fuels and the extreme dependency of agriculture on these resources is a concern that has been highlighted by many (Pimentel et al, 2015). It has been estimated that about 70% of the energy in one kernel of industrially-produced corn is derived from fossil fuels, with the largest potion originating from fossil fuel inputs into fertilizer production (Cuijpers, 2013). The theory of “Peak Oil” has been generally and broadly accepted, even by traditionally conservative organisations like the United States’ Department of Energy (Hirsch, Bezdek, & Wendling, 2007). This theory suggests that once global oil extraction reaches its maximum rate and begins to decline, it will no longer be able to keep up with global demand. This will first lead to price volatility followed by a general price increase driven by competition between sectors for the remaining quantities of the resource. Modern, intensive agriculture is one of the most dependent sectors on fossil fuels (oil and gas in particular), leading to concerns that this will lead to severe threats to food security once oil prices destabilize. Though the predicted date of when oil reserves will run out varies annually, current reserves of oil and gas are not currently projected to last until 2050 (IEA, 2014; Shafiee & Topal, 2009). This brings up an even more fundamental question: how will modern agriculture look like once the oil heyday is over? Investigating efficient and productive systems that are entirely powered through renewable energy is therefore another urgent topic for research. This concern should be reflected in the shaping of policies on the future of agriculture.
» Non-renewable nutrient sources: In 2008, a short-term 800% price spike in phosphorus rock and fertilizer triggered global concern over the long-term security of phosphorus. This limiting nutrient for crop growth is elemental, which means it cannot be manufactured. Because it has no significant gaseous phase, it cannot circulate freely in the atmosphere, and is therefore easily “lost” into the environment if diluted in agricultural runoff. The current agricultural system is highly dependent on phosphorus mined from phosphate rock, of which known reserves are concentrated in only a handful of countries (Cordell & White, 2011; Clabby, 2010) To avoid reaching limits of concentrated, economically accessible phosphorus reserves, more efforts should be directed at its recovery from wastewater streams, which should also become a strategic and policy priority for further shaping the food system.
THE GLOBAL FOOD SYSTEM: AN ANALYSIS 123
03 IMPACTS
DEVELOPING SYSTEMIC STRATEGIESAs we have argued here, physical limits to the expansion of the food system should include the transgression of planetary boundaries and the unsustainable depletion of non-renewable resources. However, understanding the existence of these biophysical boundaries is only half of the challenge. Trade-offs between impacts are unavoidable when addressing the multitude of impacts resulting from the food system. As such, it is critical to develop a sophisticated approach to prioritizing which impacts should be tackled first or avoided at greatest cost. Holistic strategies that address all of these areas of concern should reflect several key considerations regarding the nature of impacts within a system:
» The prevention of long-term, irreversible impacts should be prioritized. Certain impacts resulting from the food system are more severe and irreversible than others. Once, for example, keystone species within an ecosystem, or traditional practices and language forming the basis of cultural systems have disappeared, these properties will likely never emerge in the same form again. In many cases, the removal of these critical elements from within a system can lead to severe consequences like localized system collapse or long-term loss of resilience (Folke et al., 2004). As partly highlighted in this discussion, high priority areas include: preservation of global biodiversity, mitigation of climate change, management of soils and non-renewable resources, the preservation of culture and heritage, and the preservation of human health.
» The non-linear nature of impacts should be taken into account in decision making and policy setting. Systemic impacts are often non-linear, meaning that increasing a driving agent by a certain amount will not necessary result in a continuously equivalent incremental response. For instance, fertilising a crop will generally increase yields. However, giving a crop twice as much fertiliser may result in no yield at all due to over-fertilization (Weinbaum, Johnson, & Dejong, 1992). Taking another example, once the natural buffering capacity of soils surrounding a water body is depleted, even a short acid rainfall event can lead to rapid growth in pH and severe ecological disturbance (Krusche et al., 2003; Vogt et al., 2007). Policies should be structured around an understanding of the non-linearity of impacts, taking into consideration that individual actions can add up to disproportionate effects that are highly dependent on the time, location, and context in which they occur.
» Potential tipping points in the global system should be identified and carefully avoided. Severe, irreversible, and non-linear impacts can in some cases lead to an even more significant effect: the crossing of tipping points. A tipping point is crossed when the amount of change to a system has resulted in a regime-shift, or a transition to a fundamentally new state of operation (Biggs, Carpenter, & Brock, 2009). Aside from the extinction of key species and biodiversity loss, other areas where tipping points in the food system are likely to be found include the effects of climate change, eutrophication related to the use of artificial fertilisers, or loss of cultural heritage through the extinction of languages, practices, or institutions.
» The only lasting way to create change in a system is to address the underlying structures and root causes leading to undesired impacts. The famous parable which states, “give a man a fish and he will be full for one day; teach a man to fish and he will never go hungry again,” hearkens to a deeper truth about the nature of systems. As stated elsewhere in this report, the structure of a system is what determines its behaviour. If structures and rules are in place (lack of knowledge about fishing) that consistently lead to undesirable consequences (hunger), the only way to eliminate these impacts in a lasting fashion is to change the underlying structures. As blatantly stated in the parable, continuously addressing the symptoms of food insecurity by providing nourishment rather than addressing its underlying causes will not be effective in the long run. This general principle applies to other aspects of systemic entrenchment, like the existence of trade agreements, laws, and taxes that create structural support for continued agricultural intensification.
Combining these general insights about how impacts radiate through a complex system, we can begin to formulate an approach for developing a holistic and effective strategy for achieving lasting changes in the functioning of the food system. Though the non-linearity and interconnectivity of impacts may present a challenge, a potentially simplifying factor is that most can be traced towards a smaller subset of underlying structures. It is for this reason that we turn to a more detailed look at some of the root causes in the structure of the food system that result in these observed behaviours.

124
THE GLOBAL FOOD SYSTEM: AN ANALYSIS 125
06 POSSIBLE INTERVENTIONS01
0203
0405
04 STRUCTURALCAUSES
Two women selling produce in a street marketWikimedia Commons: Manioc

126
4.0
INTR
ODUC
TION
There are many studies on sustainability of the global food system that readily identify a number of important immediate drivers behind sustainability impacts. These drivers are often identified as (but not limited to) policy failures, exploitative practices, population growth, and other emergent behavioural phenomena. While these are certainly an important part of the explanation of how impacts occur, these drivers alone do not tell the full story. In systems science, understanding the underlying structures is the key to identifying the root causes of problems. Only by addressing root causes, rather than the symptoms of problems or their more superficial causes, are we able to create long-lasting changes in a system’s functioning.
The structures within a system (e.g., the infrastructural elements, rules, and key relationships) determine the system’s behaviour. Understanding the structure of a system allows us to pinpoint higher-leverage interventions that can result in target behaviour and outcomes (Meadows & Wright, 2008).Taking the main impact categories that we discussed in the Impacts chapter as a starting point, we identified case studies which are major contributors to these impacts, and investigated the root causes for each case. What we have observed from these case studies is that a relatively small set of structural mechanisms are at the root of many shared problems. While the exact structural elements that make up the “root causes” for each impact area vary across different contexts, what we can see is that there are several common themes and patterns that emerge.
KEY MESSAGES » There are almost never any single root causes to impacts. The vast majority of structural
root causes that were identified from a case study analysis pointed to several structural elements working together to create either self-reinforcing mechanisms or other forms of path dependency. Because there are several structural root causes, the behaviour and ultimately the impacts that result are deeply entrenched into the system.
» Poverty is the largest threat to producers of food globally. Small farmers and fisherfolk around the world are caught in a similar cycle of poverty, whereby a fundamental absence of educational services, employment opportunities, economic and social infrastructure, and political representation force them to subsist.
» Research and investment in production is locked-in on traditional, intensive approaches. Alternative, more sustainable practices do not have the opportunity to continually develop and evolve like conventional paradigms that benefit from reliable funding, further cementing their market dominance. With funding focused on specific practices, investment in developing nations from high-income nations has become intermittent, making long-term development difficult without sustained and reliable resources.
» Mechanisms and loopholes in the architecture of trade agreements are often abused by powerful countries to continue pursuing protectionist policies, resulting in unfair competition scenarios for the developing countries, ultimately creating trade dependence and eroding local food security.
» Policy making is strongly influenced by wealthy actors in the system. Liberal trade policies and the revolving door for government lobbyists have solidified a culture where large, wealthy corporations have disproportionate power over political decision making, whereby small players in the food system are marginalized both economically and politically.

THE GLOBAL FOOD SYSTEM: AN ANALYSIS 127
04 STRUCTURAL CAUSES
The poverty trap is a self-reinforcing
cycle of restrictions to opportunities,
vulnerability to shocks, and social exclusion.
Reflecting upon the outcomes of our research in the global food system, there are a number of important structural causes to discuss. While this certainly is not a definitive list, we have good evidence to claim that these areas represent some of the key reasons for the poor performance of the global food system today.
An important finding from our case study research is that there is rarely a single structural cause behind any particular impact. In fact, there are almost always several structural elements working together to create self-reinforcing cycles that create the conditions for an impact to occur. Self-reinforcing cycles can best be thought of as a chain of events, whereby certain structures of a system, like laws, incentives, or dominant paradigms act together to reinforce certain behaviours and decisions, which further perpetuate impacts in a feedback loop. This phenomenon is also closely linked to path dependencies, when a certain way of doing things is further reinforced and entrenched through various structural incentives that marginalize alternatives. Actors who find themselves in these situations experience tremendous difficulty escaping, sometimes even if taking steps to decouple from a certain behaviour or decision. We have observed from our research within the food system that there are a few root causes that work together to create self reinforcing mechanisms and path dependencies.
4.1 THE POVERTY TRAPPoverty is one of the most important structural challenges at the global level today. The issue of poverty is especially important for the global food system, as the world’s poorest countries are those most dependent on agriculture. It happens that three quarters of those who live in extreme poverty also live in rural areas (IFAD, 2001), which are far from urban centres with higher economic activity or have the least productive land. Even in developed countries like the United States, poverty is a chronic problem amongst small scale farmers who face similar conditions (ILO, 2003).
The eradication of poverty has become the overarching objective of development discourse, as reflected in internationally agreed-upon development goals, including the United Nations’ Sustainable Development Goals, which link poverty and human well being to ecology. While the total number of people living in
poverty has reduced from 1.9 billion in 1990 to 836 million in 2015, progress has been uneven, and many social groups are still largely disadvantaged (DESA-UN, 2010). If we view poverty in terms of the wider definition adopted by the 1995 Social Summit (DESA-UN, 1995), which includes deprivation, social exclusion, and lack of participation, the situation that we see today is far worse than what only the income poverty line would suggest.
What makes poverty such an intractable problem is its multidimensional nature that extends beyond the economic arena to encompass factors such as the inability to participate in social and political life (Sen, 2014). Poverty can be best considered as a self-reinforcing cycle of restrictions in opportunities, vulnerability to shocks, and social exclusion. This self-reinforcing cycle is commonly referred to as the poverty trap.
The cycle of the poverty trap is driven by a combination of structural elements working together to limit the ability of individuals to invest or protect themselves over the long term. These structures work in such a way that the only viable option for most poor people is to further regress into choices and behaviour that will lead them to a future with fewer opportunities. While many of these structures are more fully described later in this section, we will show how some common structural elements work in a reinforcing pattern to perpetuate poverty particularly in agriculture.
STRUCTURAL CAUSES IN THE FOOD SYSTEM

128
EDUCATIONAL SERVICES
One of the main structural elements at work in the poverty trap is the provision of affordable education. In many developing countries, the education service is in crisis (Alderman, 2011). Rural areas are especially impacted due to existing entrenchment of poverty. Most families require their children to work on the family farm. Due to the need for child labour and a historical lack of education services, many attitudes toward it see it as a waste of time that cannot be afforded. Where schooling is available, it is often in very poor quality or unaffordable to most. High quality teachers are in short supply, and equipment and buildings are in a poor condition (ILO, 2001). This ongoing lack of opportunity and access make it extremely difficult to provide early skills that can be fundamental in maneuvering into greater economic opportunity later in life.
LABOUR AND EMPLOYMENT
Accessibility to employment and the effect of labour markets on the global poor are key structural factors in forming the poverty trap. For young workers, the ability to find a job is highly dependent on education and the overall state of labour demand. It is often the less experienced and educated that are least likely to be hired, and the most likely to be laid off when the business cycle enters a downturn (Clark & Summers, 1982). The cost of youth unemployment to economic and social development is extremely high. It perpetuates the intergenerational cycle of poverty and is associated with a number of other social problems such as crime, violence, and substance abuse, which further damages communities. A general lack of employment and labour opportunities makes communities, and especially the young people within them, vulnerable to illegal or very dangerous activities. In some countries virtually the only paid occupation open to many young men is to join the various armed groups involved in civil conflict. For young women, the dangers of entrapment in the sex industry are widespread (International Labour Office, 1998).
GENDER DISCRIMINATION
Cultural and more structural discrimination against women is deeply ingrained in many regions globally, and has an important link to the feminisation of poverty and to the perpetuation of poverty from one generation to the next (Topouzis, 1990). In addition to discrimination in pay, access to land, and legacies and credit, women are also tied to cultural roles that make them particularly vulnerable to poverty and hazard. Women carry multiple burdens of having to care for the elderly and children as well as responsibility for household and farm tasks. What this means when put together is that women are structurally discriminated against compared to men, not only in terms of accumulated social security but also in terms of opportunities for lifelong learning and continuous training – without which they have lower employability (International Labour Office, 2003).
ECONOMIC AND SOCIAL INFRASTRUCTURE
One of the critical factors in development are the different forms of economic and social infrastructure that are provided by governments to its citizens. The general absence of economic and social infrastructure in poor rural areas disproportionately affect agricultural workers, even when they represent a majority of the regional workforce (Mirle, 2007). While regional contexts vary, many of the common disadvantages that face rural communities are a lack of access to credit and subsidies, markets, social services, labour protection, and social security (DESA-UN, 2010). Perhaps more importantly, the direct lack of social and economic provisions structurally limits the ability for poor rural communities to exercise their political voice on either a local or national level. What we have seen is that in many cases, rural agricultural areas are often overlooked in policy making, specifically poverty reduction strategies. Some countries specifically exclude the agriculture sector from their general labour legislation. In others, general protective legislation may not be fully applicable to the agriculture sector, or may simply not be applied (Tallontire, Dolan, Smith, & Barrientos, 2005).
POWER ENTRENCHMENT
The entrenchment of power in political and economic spheres is slightly more abstract, but an important element in the overall picture of the poverty trap. We will discuss power entrenchment more fully in the next page, however its specific link to the poverty trap is covered here. Within the context of rural agricultural communities, large scale farmers and landowners have a much more dominant political and economic role, and can often reinforce their power through the intimidation of workers to deter them from building collective organisations, for example by threats of eviction, the calling in of loans or violence (DESA-UN, 2010). This is an important structural barrier for those who are in poverty, as access to, and the costs of legal protection are out of reach, even when such mechanisms for protecting civil and political rights are not in the hands of local elites.
It is clear that due to the debilitating impact that poverty has on such a large portion of food producers, finding structural solutions that break the cycle of the poverty trap need to be a primary focal point in moving toward a fundamentally more sustainable and resilient food system.
4.2 POWER-WEALTH ENTRENCHMENT In much of society today, we see that dominant power structures are tightly coupled with the interests of wealthy actors, whether that be “big business” or individuals (Piketty,2014). In the impact cases we examined, large-scale
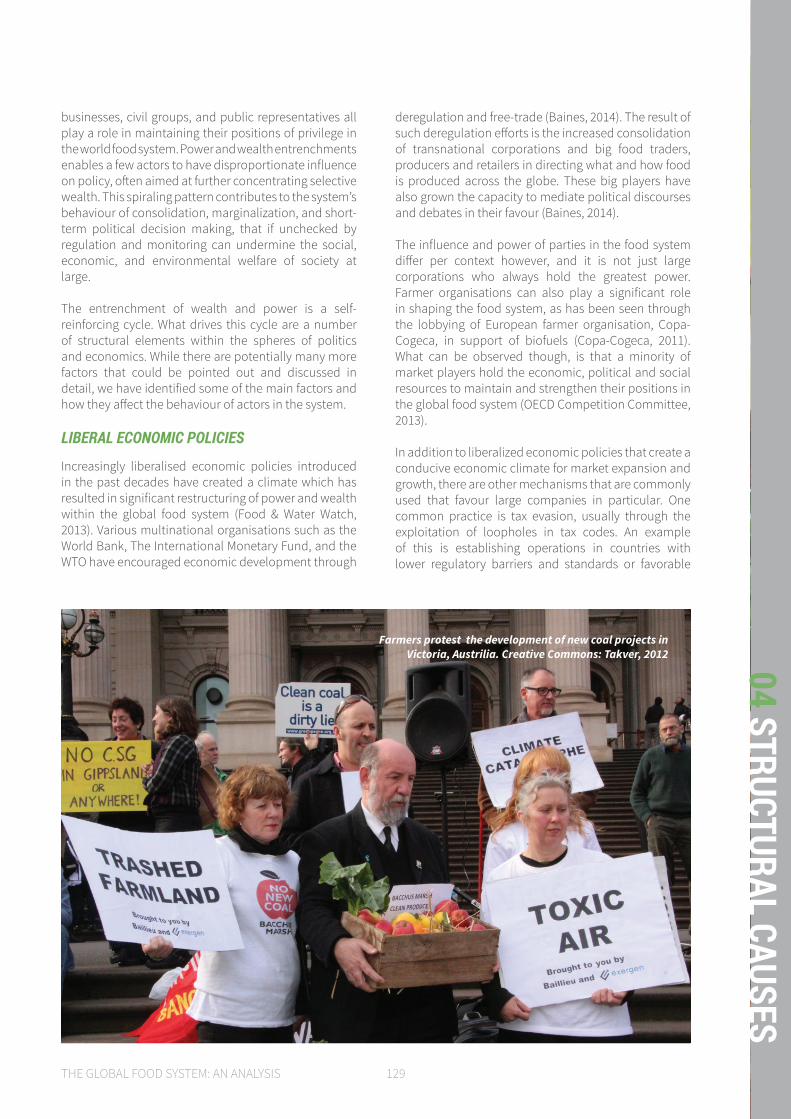
THE GLOBAL FOOD SYSTEM: AN ANALYSIS 129
04 STRUCTURAL CAUSES
businesses, civil groups, and public representatives all play a role in maintaining their positions of privilege in the world food system. Power and wealth entrenchments enables a few actors to have disproportionate influence on policy, often aimed at further concentrating selective wealth. This spiraling pattern contributes to the system’s behaviour of consolidation, marginalization, and short-term political decision making, that if unchecked by regulation and monitoring can undermine the social, economic, and environmental welfare of society at large.
The entrenchment of wealth and power is a self-reinforcing cycle. What drives this cycle are a number of structural elements within the spheres of politics and economics. While there are potentially many more factors that could be pointed out and discussed in detail, we have identified some of the main factors and how they affect the behaviour of actors in the system.
LIBERAL ECONOMIC POLICIES
Increasingly liberalised economic policies introduced in the past decades have created a climate which has resulted in significant restructuring of power and wealth within the global food system (Food & Water Watch, 2013). Various multinational organisations such as the World Bank, The International Monetary Fund, and the WTO have encouraged economic development through
deregulation and free-trade (Baines, 2014). The result of such deregulation efforts is the increased consolidation of transnational corporations and big food traders, producers and retailers in directing what and how food is produced across the globe. These big players have also grown the capacity to mediate political discourses and debates in their favour (Baines, 2014).
The influence and power of parties in the food system differ per context however, and it is not just large corporations who always hold the greatest power. Farmer organisations can also play a significant role in shaping the food system, as has been seen through the lobbying of European farmer organisation, Copa-Cogeca, in support of biofuels (Copa-Cogeca, 2011). What can be observed though, is that a minority of market players hold the economic, political and social resources to maintain and strengthen their positions in the global food system (OECD Competition Committee, 2013).
In addition to liberalized economic policies that create a conducive economic climate for market expansion and growth, there are other mechanisms that are commonly used that favour large companies in particular. One common practice is tax evasion, usually through the exploitation of loopholes in tax codes. An example of this is establishing operations in countries with lower regulatory barriers and standards or favorable
Farmers protest the development of new coal projects in Victoria, Austrilia. Creative Commons: Takver, 2012
130
economic structures (i.e. lower taxes, food subsidies, etc.). This fundamentally favours large corporations as they are not constricted to the local contexts and nominal regulatory expenses that smaller competitors are (Baines, 2014).
LOBBYING AND THE REVOLVING DOOR
While on one hand the economic climate and a lack of structures for regulation favour the expansion and growth of large companies, there is another side to this cycle where those powerful companies exercise their power over the political decision making process through lobbying. It should be stated that it is not only wealthy corporations who engage in lobbying. Non Governmental Organisations and Civil Society Organisations also frequently engage in lobbying activities, often in cooperation with industry parties.
From our research however, we have found many examples of wealthy interests controlling decision making. It is difficult to point to a specific behaviour because the structures of influence in different countries can look much different from each other. In addition to instances of corruption and connivance, there are also much more accepted channels for political influence. These channels are namely lobbying, and financial assistance, mostly secured through political donations.
Perhaps the most prominent example of lobbying and financial donations is found within the agri-food industry, which is deeply involved in these activities to sustain their interests in policy and regulatory discussions (Auble, 2013). This issue is most clearly articulated by the “revolving door” phenomenon, where members of the political elite or agribusiness leaders are commonly employed interchangeably in regulatory positions in government or as directors and CEOs in agribusiness firms after a career in the opposing institution/industry (Yoon, 2006). This practice is highly common in the U,S. with notable examples within Monsanto, ConAgra, Walmart, and many more (Meghani & Kuzma, 2010). Essentially, this situation creates informal
lobbyists, who because of past or future affiliations, have an interest in pursuing policies which will benefit the financial development of a company (Auble, 2013). This is problematic because the interests of food industry giants are not always in sync with the broader interest of all actors involved in the production, distribution, and consumption of food, or with broader societal objectives.
What we have observed through our study of the food system is that there is a cultural climate where the interests of wealthy actors have privileged representation in the political decision making process. Financial restitution is provided to decision makers for supporting their interests. What results from this cycle is an erosion of a fair economic playing field, whereby structural elements like policies, regulations, subsidies, and other incentives inherently favour wealthy actors.
4.3 INSTITUTIONAL LOCK-INS IN TRADEThe WTO was established to reduce and eliminate the historical protectionist policies used across the world to protect domestic markets from price volatility, protect employment, and as a long-term guarantee for food security. Before the emergence of the WTO, countries used trade barriers and market-distortion mechanisms to these ends, including import tariffs, trade quotas, farmer support through production subsidies and direct payments, and non-tariff barriers.
The WTO however, institutionalized liberalization as the official discourse and status quo for international trade. Liberalization is advocated not as an end in itself, but rather as a means to achieve development and improve consumer welfare. There are some clear benefits that have emerged from the liberalization of trade and the involvement of large companies in the food system, such as connecting small scale farmers to international markets (Huang, Jun, Xu, Rozelle, & Li, 2007). Compared to state-controlled alternative systems, such as those found in China or the former Soviet Union, liberalization can have much better outcomes for people and the environment (Duit, 2008; Young, 2010).
However, the current global trade system has structural flaws that subject developing and least developed countries to unfair competition against richer countries. The most important element of the trade governance framework is the World Trade Organization, and in particular, its Agreement on Agriculture. Agricultural goods have received special considerations and are subject to different regulations than other goods because of their importance to food security.
In practice, however, special mechanisms and loopholes in the institutional architecture are often abused by powerful
Deregulation has created a climate for multinationals to
dominate the food and drink sector and influence policy
to suit their interests.

THE GLOBAL FOOD SYSTEM: AN ANALYSIS 131
04 STRUCTURAL CAUSES
countries to continue pursuing protectionist policies. In this manner, environmental, consumer welfare, and labour issues are often given a secondary role or are only invoked, when necessary, as a justification to enact trade barriers. This behaviour is facilitated by loopholes in the institutional architecture and the different productive capacities and resources of richer and poorer countries, and results in an unfair competition scenario for the latter, ultimately creating trade dependence and eroding local resilience against food insecurity (Birovljev, J., & Ćetković, 2013).
ERODING DOMESTIC PRODUCTIVE CAPACITY
Free trade agreements are not always beneficial for consumers, and can result in a structural disadvantage for developing countries that have to compete, without protection, against developed ones where agriculture is more productive, heavily subsidized, and credit and insurance are readily available. For example, subsidies represent 22% of farm receipts in OECD countries, a total of 253 billion USD as of 2009, these include direct payments, agricultural input and export subsidies, and fiscal incentives (OECD, 2010). A particular set of emerging economies, including countries in Latin America and Asia, have been able to leverage the trade framework in their favor. This has only been possible through heavy state involvement to strengthen the agricultural system as trade barriers are progressively removed.
One of the results of trade liberalization has been the expansion of global supply chains and increases of power of transnational corporations, which manage this trade, vis-à-vis consumers and producers. This is especially relevant in less developed countries, where smallholder farmers lack access to production inputs, capital, and better practices. Faced with consolidated traders who will only buy specific crops and unable to compete against imported goods from developed countries, farmers in the developing world will move to one of two divergent scenarios; they will be pushed towards growing cash crops to serve export markets or to content themselves with subsistence agriculture to meet their own needs (de Schutter, 2009). Thus, least developed countries are unable protect their agricultural industries and achieve their expected comparative advantages (de Schutter, 2009). A salient example is Sub-Saharan Africa, where until the 1970s, many countries were net food-exporters. During the following decade their competitive advantage was lost due both to local reductions in investment and to increases in subsidies in Northern countries, and the trade balance shifted towards net imports (de Schutter, 2009).
HIDDEN PROTECTIONISM
Developed and emerging countries play a two-way game of defending and encouraging free trade in their official narratives while engaging in trade distorting behaviours, creating a climate of hidden protectionism. Common tools used include export tariffs, fiscal barriers, trade quotas, export subsidies, governmental purchases from domestic producers, and monetary policy instruments (namely devaluation of the national currencies) (Serpukhov, 2013). Protectionism in itself is not necessarily a negative thing, and in many instances it has been effective in regulating illegal behaviour. For example, the US Lacey Act and the EU Timber Regulation have been useful instruments in barring the entrance of illegal timber products into the United States and European Union (Brack & Buckrell, 2010; Gan, Cashore, & Stone, 2013).
In regard to the food system specifically, protectionism appears in international trade architecture, including many preferential trade schemes designed to favor least developed countries. Some of these include the African Growth and Opportunity Act and the Caribbean Basin Initiative of the United States; the Everything But Arms Initiative and the Cotonou Agreement of the European Union. These schemes, however, have had limited success in encouraging exports from these countries, as they are often contested by additional requisites, such as rules of origin and non-tariff barriers linked to sanitary and private sector standards (de Schutter, 2009).
A similar issue emerges through the WTO’s dispute settlement system, which was designed to bring down protectionist behaviours. However, as it is a highly complex system that requires extensive legal, diplomatic, economic, and business expertise, as well as financial resources to be effectively used, in practice developed countries are the main parties to make use of it. In the developing world not only are these resources scarce, but stakeholders are poorly coordinated amongst themselves and with their governments. As of 2011, 400 disputes had been initiated in the WTO, with only around 30 developing countries and one least developed country, Bangladesh, represented amongst the initiators (International Centre for Trade and Sustainable Development, 2011; Najam & Robins, 2001).
The interaction between the diverse productive capacities of countries and the institutional architecture leads to unequal trade positions at the global scale, with an advantage for northern countries in trade. Year after year, this provides perverse incentives for countries in the South to become trade-dependent to meet their food supply needs, shifting in turn their production to cash or subsistence crops (ICTSD, 2012). This systemic
132
behaviour inhibits the development of productive capacity in the South, hampers efforts to close the North-South income gap, contributes to systemic marginalization, and ultimately leads to a structural erosion of resilience in food security matters. All of these effects further propagate environmental impacts in the Global South, through lack of investment in improved agricultural practices, which ultimately lead to the degradation of land resources.
4.4 TRAGEDY OF THE COMMONSOne of the main structural problems within the food system is what Garrett Hardin famously called the “Tragedy of the Commons” (Hardin, 1968). Hardin describes this tragedy at the hand of the behaviour of herders on a pasture, specifically discussing the circumstances and mechanisms leading to overgrazing on this hypothetical pasture. Hardin’s original example relates to the food system, in that we now see vast ecological over-exploitation due to individual interests.
THE TRAGEDY OF THE COMMONS AND THE FOOD SYSTEM
Since the publication of Hardin’s essay a large body of research has developed around the tragedy of the commons. This research shows that the dynamics that have just been described, can also apply to the use of many natural resources which are an integral part of the food system. The tragedy of the commons can for example provide an explanation for the exploitation patterns in fisheries (Beitl, 2015; Noussair, Soest, & Stoop, 2014), water management practices (Allouche, 2011; Madani & Dinar, 2013), the management of soils and land (Cao, Yeh, Holden, Yang, & Du, 2013; Vetter, 2013), and forests (Fleischman, Garcia-Lopez, Loken, & Villamayor-Tomas, 2013). In all these examples the decisions of individual actors can potentially lead to the abuse or depletion of natural resources and ecosystem services. The mechanisms central to the tragedy of the commons also applies to the environmental pollution. Here, the main concern is not ‘taking something out’ of the common resources of society, but ‘putting something in them.’ Examples related to the food system are the emission of greenhouse gasses (Stavi & Lal, 2013), novel entities, or large quantities of fertilisers related to the food system (Good & Beatty, 2011). In all these cases there is an incentive to ‘add to the global waste bin’, so to say, since the costs of pollution are often carried by society as a whole while the costs associated with the prevention or control of emissions are allocated to the individual.
EMPIRICAL EVIDENCE
It should be noted that the mechanisms of the tragedy of the commons only provide a partial explanation with regards to the management of natural resources and sinks, and that the extent to which these mechanisms play out are
highly context dependent. Much of the empirical research which has followed the publication of Hardin’s essay in the 1960s has shown that specific geographical location or society influence the extent to which the tragedy of the commons actually occurs. One of the most elaborate research projects in this regards is the work of Elinor Ostrom, in identifying which institutions (e.g. regulations, property rights, or cultural norms) influence the management of common pool resources (Ostrom, 1990, 2011; Robson et al., 2014). From her research as well as that of others we can see that a number of assumptions in Hardin’s theory are only partially present in reality and that societies are sometimes able to avoid a tragedy of the commons, even in circumstances similar to those described by Hardin (see Feeny et al. (1990) for an overview).
The assumption of the rational, profit maximizing herdsman in Hardin’s story for example, is usually not fully confirmed by empirical evidence. In the field experiments conducted in villages in Thailand and Colombia by Cardenas, Janssen, and Bousquet (1994), for example, none of the groups of villagers completely depleted the communal natural resources (i.e. fish, forests, and water for irrigation), because none of the villagers acted completely selfishly at the expense of the collective. In other cases the tragedy of the commons is avoided because communities realize exploitation rates are threatening the continued existence of vital natural resources (Cardenas et al., 1994). At other times social and cultural norms prevent individual actors from behaving selfishly (Galappaththi, 2015; Mertens et al., 2015). Moreover, the tragedy of the commons only provides a partial explanation of the behaviour of actors. Political structures and power relations may be a much larger influence on the behaviour of actors, and provide a better explanation of resource depletion (for another example, see the study of Fleischman et al. (2013) on tropical deforestation in Indonesia). From the cases we have evaluated and other discourse it has become clear that, although aspects of the tragedy of the commons are present in most socio-ecological systems, including the food system, the way in which this tragedy plays out on a case to case basis. Nevertheless the mechanisms behind the tragedy of the commons can partially be observed in many of the case studies we have evaluated.
4.5 TECHNOLOGICAL AND INFRASTRUCTURAL LOCK-INS One of the structural problems of the food system lies in the prevalence of conventional, intensive agricultural production systems. Once a system of practices and their related technologies has been established, it is difficult to shift towards a new model of operation.
This phenomenon is often referred to as ‘path dependency’: it is a self-reinforcing process which leads to a technological
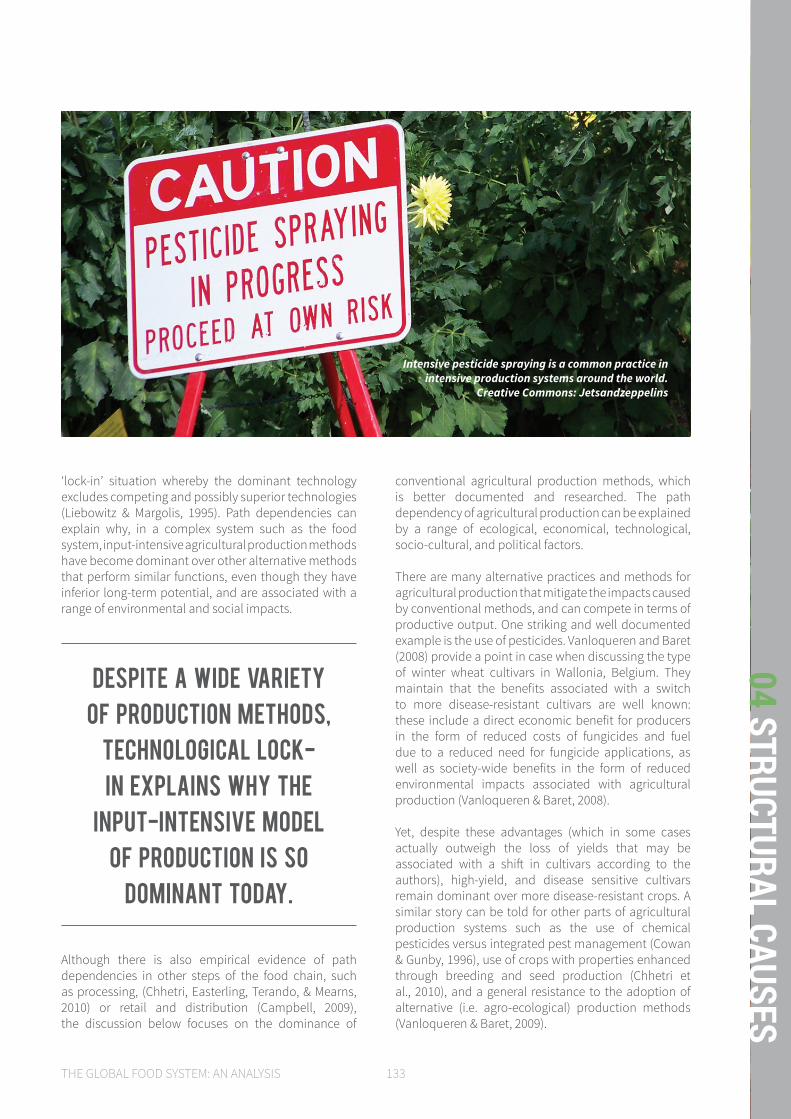
THE GLOBAL FOOD SYSTEM: AN ANALYSIS 133
04 STRUCTURAL CAUSES
‘lock-in’ situation whereby the dominant technology excludes competing and possibly superior technologies (Liebowitz & Margolis, 1995). Path dependencies can explain why, in a complex system such as the food system, input-intensive agricultural production methods have become dominant over other alternative methods that perform similar functions, even though they have inferior long-term potential, and are associated with a range of environmental and social impacts.
Although there is also empirical evidence of path dependencies in other steps of the food chain, such as processing, (Chhetri, Easterling, Terando, & Mearns, 2010) or retail and distribution (Campbell, 2009), the discussion below focuses on the dominance of
conventional agricultural production methods, which is better documented and researched. The path dependency of agricultural production can be explained by a range of ecological, economical, technological, socio-cultural, and political factors.
There are many alternative practices and methods for agricultural production that mitigate the impacts caused by conventional methods, and can compete in terms of productive output. One striking and well documented example is the use of pesticides. Vanloqueren and Baret (2008) provide a point in case when discussing the type of winter wheat cultivars in Wallonia, Belgium. They maintain that the benefits associated with a switch to more disease-resistant cultivars are well known: these include a direct economic benefit for producers in the form of reduced costs of fungicides and fuel due to a reduced need for fungicide applications, as well as society-wide benefits in the form of reduced environmental impacts associated with agricultural production (Vanloqueren & Baret, 2008).
Yet, despite these advantages (which in some cases actually outweigh the loss of yields that may be associated with a shift in cultivars according to the authors), high-yield, and disease sensitive cultivars remain dominant over more disease-resistant crops. A similar story can be told for other parts of agricultural production systems such as the use of chemical pesticides versus integrated pest management (Cowan & Gunby, 1996), use of crops with properties enhanced through breeding and seed production (Chhetri et al., 2010), and a general resistance to the adoption of alternative (i.e. agro-ecological) production methods (Vanloqueren & Baret, 2009).
Intensive pesticide spraying is a common practice in intensive production systems around the world.
Creative Commons: Jetsandzeppelins
Despite a wide variety of production methods,
technological lock-in explains why the
input-intensive model of production is so
dominant today.
134
ENVIRONMENTAL DEGRADATION AND TECHNOLOGICAL LOCK-INS
The prevalence of input-intensive agricultural systems can be partly explained by looking at the interrelationships between agricultural production and environmental degradation. Allison and Hobbs highlight this relationship in a case study regarding technological lock-in in agricultural production in Western-Australia (Allison & Hobbs, 2004). Their study shows how agricultural intensification and changes in technology can, at least temporarily, compensate for the degradation of soils, water, and other natural resources upon which production systems rely. This way the system is stable, in the sense that production levels are stable or even rising. However, at the same time production will become heavily dependent on a continuous stream of external inputs such as artificial fertilisers or pesticides, or rely on continuous technological innovations to prevent a decline in production. Thus the system enters a state of lock-in where, due to environmental degradation, the abandonment of conventional practices would lead to yield losses and possible a collapse of the system; this prohibits a change in production systems. At the same time however, these methods lead to further degradation. Thus the system is locked in a vicious cycle where intensification is triggered by environmental degradation and in turn leads to a further erosion of the natural capital upon which the production of food is based.
SUNK COSTS, TIME FOR PROFITS AND MARKET STRUCTURES
Aside from environmental factors, there are a range of economic causes for technological lock-ins. The most important ones in the agricultural sector are sunk costs, the time period over which profits are accounted for, and the structures of markets for agricultural inputs such as fertilisers, pesticides, and seeds. Sunk costs may prohibit the adoption of new production methods or technologies in agricultural production, especially when the capital goods or knowledge in which actors have invested in the past, becomes useless to some extent because of these changes. When farmers have invested in machinery for harvesting within large scale, mono-cropping systems, for example, they may not be willing or able to switch to a completely different production system when this means that these machines become useless, since they have an incentive to utilize their existing capital stocks and ensure a return on their investment.
Sunk costs can also occur in research and development programs. Research trajectories often take a long time to generate marketable results. As a result the costs of long research and development trajectories are comparatively high to the variable costs associated with the application of resulting technologies: producing pesticides, for example, is relatively cheap compared to the costs associated with developing the process and technology needed
to produce them (Wolff & Recke, 2000). Furthermore, research and development programs usually build upon previously generated results and knowledge as a basis for new research. This is especially relevant in the case of breeding programs (Vanloqueren & Baret, 2009)(McGuire, 2008). For example, wheat varieties launched in the United States in the early 1990s partially rely on crop breeding research dating as far back as 1873 (Pardey & Beintema, 2001). Although this accumulation of knowledge and research is the basis of progress in agricultural research and development, it can also hinder the development of new technologies or directions of research since a changing direction in research effort means partially abandoning existing knowledge and capital stocks.
The example of environmental degradation already illustrated the fact that actors prefer short-term gains over long term ones. In relation to environmental degradation this can mean that a short term yield rise is preferred over a long term preservation of natural capital. This way of thinking, however, can also enforce the technological lock-in of conventional agriculture in different way. Vanloqueren and Baret show this in their research on cultivar choices by Belgian farmers: these farmers selected their cultivars mainly on the basis of two criteria: maximum yields and commercial value. In combination with uncertainties regarding the performance of more pest and disease-resistant cultivars, this orientation to short term profits ensures a dominance of conventional, high yielding cultivars (Vanloqueren, G., & Baret, 2009). The last economic factor reinforcing path dependent tendencies in agricultural production relates to the role of supply companies. These companies have a prominent and often even prescriptive influence within the food system. As discussed in other parts of this report (see section 2.3 and Figure 18), often a few firms dominate the market for agricultural inputs such as crop protection products, fertilisers, seeds, advice, and agricultural machinery to farmers and also buy their produce. Vertical integration creates a situation in which the business model of these companies can to some degree influence which types of cultivars are grown: the pesticides produced by a company are developed to optimally ‘fit’ the seeds that same company sells, for example. These influences are reported to reinforce conventional agricultural production systems by several authors (Lamine et al., 2010).
INSTITUTIONAL STRUCTURES
Next to ecological and economic reasons, institutional factors are another important reason for the path dependency of agricultural research and practices. The intensification and consolidation seen in the global system can partially be attributed to the structure of global agricultural research and development funding. Research is often geared at producing techniques for maximising yields, without taking long-term environmental
THE GLOBAL FOOD SYSTEM: AN ANALYSIS 135
04 STRUCTURAL CAUSES
costs, or even the immediate costs of inputs such as chemical fertilisers and pesticides into account. This bias reinforces practices geared at yield maximsation, even though such production systems do not always result in a maximum profit for farmers (as described in the case presented by Vanloqueren and Baret, 2008). This focus of research and development in the private sector is also linked to past (and present) government policies; subsidies for farmers were often provided on the basis of production quantities, defining the primary development criterion for the agricultural industry as a whole (Vanloqueren & Baret, 2008).
Sunrise in SeptemberCreative Commons: Dave McLear

136
4.6
DISC
USSI
ONThe impacts across the global food system are numerous, and come about for different reasons in different areas and circumstances. From our research on the food system, we have explored the different drivers to better identify the deeper structural causes within the system. While our research is limited in scope of analysis, what we have managed to capture are the major elements contributing to the specific impact, and the hierarchy in which the affect each other. As a result, what this gives us is a useful first sketch of the structural causes of a selection of key impacts in the global food system.
KEY MESSAGES » There are shared structural causes at the root of a diverse set of impacts. This demonstrates
the close linkage between social and environmental impacts, and suggests that a more integrated approach to thinking about system-wide trade offs and rebound effects is needed.
» Making good policy decisions for the global food system requires a stronger and more cooperative international governance. Many serious impacts in the food system today can be traced back to a structural limitation of governance and enforcement.
» To ensure that solutions are comprehensive and adaptive, there is a need to hard-wire systems thinking into food system policy. By broadening the scope of decision-making, and accounting for systemic effects, we could understand feedback loops and adverse effects early-on, and adapt policy accordingly.

THE GLOBAL FOOD SYSTEM: AN ANALYSIS 137
04 STRUCTURAL CAUSES
SELF-REINFORCING CYCLES AND MULTI-DIMENSIONALITY OF PROBLEMSAs we introduced earlier in this chapter, one of the most noticeable features of the structural causes is that there are no single causes for an impact. Rather, we have consistently found that there are several structural causes working together in a cyclical or lock-in pattern. For example, the poverty trap is best described as a set of structural failures or absences in the system such as a lack of social or economic infrastructure, coupled with a lack of educational services, and an absence of employment opportunities.
These structural failures all inter-relate and reinforce each other, and create a despondent environment that it is nearly impossible for individuals and communities to escape from. Other examples include institutional lock-in and power entrenchment that work together to drive a dominant but narrow frame by which policy decisions are made. This narrow frame of decision-making is further reinforced by a number of other structural factors including the institutionalized privilege of large, wealthy actors in the political sphere, and dominant technological pathways. When we zoom out and observe the behaviour of the system as a whole, the picture that we see is quite a powerful and streamlined system, but also very path committed and surprisingly resilient against change. In the case of the food system specifically, what this results in is an input-intensive, industrial scale, control model of agricultural production, connected to a vast, centralized food chain controlled by a handful of very large companies.
WHAT DO THESE INSIGHTS IMPLY FOR OUR FOOD SYSTEM? While insights derived from our case study analysis show that there is important contextual variability in this narrative, essentially there is a visibly dominant model of food production and provision that privileges a select few, while marginalizing a vast number of other actors, and devastating the health of the environment. In fact, another key observation from our case studies is that, across impact categories (from biodiversity loss to human livelihoods) there are similar structural causes at the root. The same structural barriers that push small scale farmers deeper into subsistence farming, also force them to make choices that are fundamentally short-term, often resulting in environmental damage. In many ways this may seem obvious as the food system is a single system. What is important to realize however is
that when looking for solutions for a more sustainable food system, there must be an integrated approach that considers phenomena like trade-offs, rebound effects, and other feedback loops that stretch across the entire system.
This undoubtedly requires a new approach to thinking about strategies for a sustainable food system. On one hand, there is a need for stronger and more international form of governance, which has a means to enforce, but is also able to adapt to feedback. What we see in the fisheries sector for example, is a failure of individual nations to appropriately govern or enforce water bodies under their jurisdiction. And even where one nation’s policies may be strong, a lack of international cooperation can lead to impacts in neighbouring countries that share the same waterways or bodies. This specific case is currently occurring in the Mekong basin, where inland and coastal fishing communities are being deeply affected by policies made in neighbouring countries (Chantavanich et al., 2013).
Additionally, there is a strong need for better decision-making tools and channels for decision-makers to collect high quality information on the effects of their policies. There are an abundance of examples where well-intended policies have had disastrous results due to a lack of knowledge of how systems behave, and how policies may affect the overall dynamic and resilience of a system. Massive economic incentives for the expansion of commodities like palm oil have resulted in large scale deforestation of rainforests, resulting in significant biodiversity loss in some of the earth’s richest ecosystems. The entrenchment of power that results from this initial policy decision is a lock-in effect that makes it very difficult to push through corrective policy. While power entrenchment is a serious problem on its own, many policies focus on too limited a set of criteria or too narrow of a scope. What is needed is a more comprehensive approach which addresses multiple aspects. An alternative approach to palm oil subsidies should not only include investment into multiple forms of production, but also into training and knowledge, so that farmers have the tools to understand how to adapt and evolve their production practices over time to benefit from local conditions, minimize harmful impacts to the environment, and reap the benefits from diversified production and additional employment opportunities to augment their overall income and resilience. This is a simplified example, but is demonstrative of the need to broaden the scope of policy making to ensure that solutions are more comprehensive, but perhaps more importantly, adaptive over time.
138
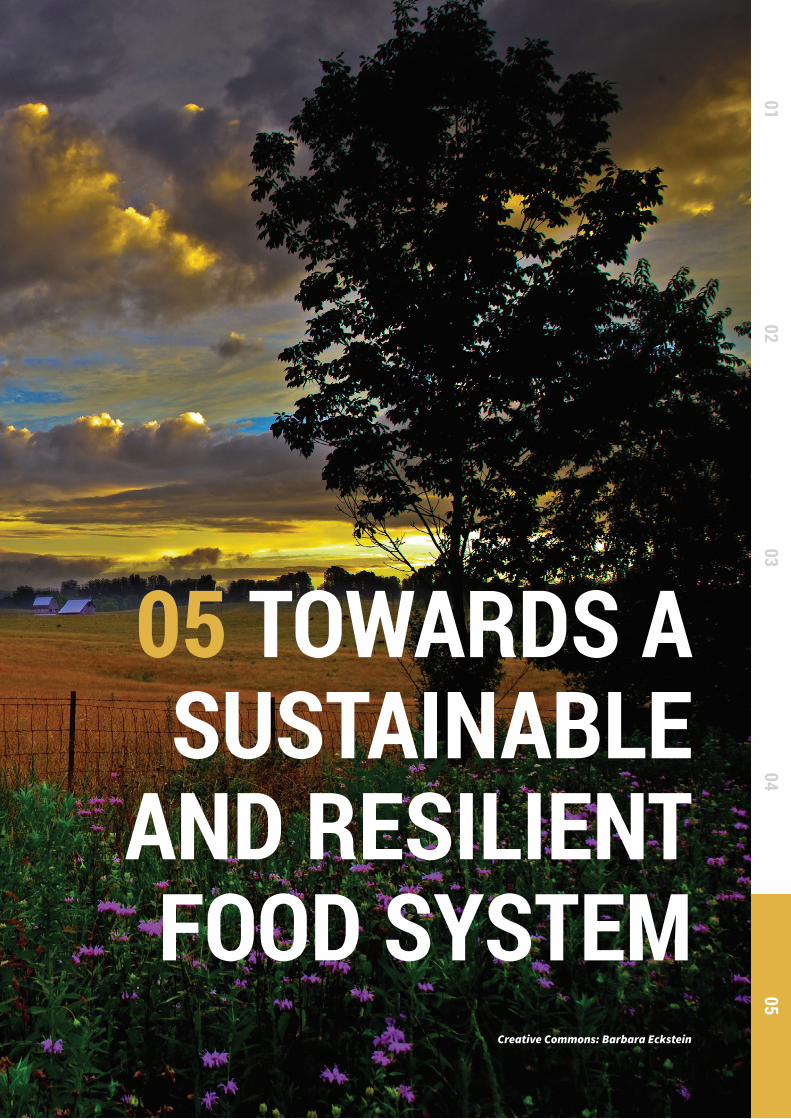
THE GLOBAL FOOD SYSTEM: AN ANALYSIS 139
Creative Commons: Barbara Eckstein
05 TOWARDS A SUSTAINABLE
AND RESILIENT FOOD SYSTEM
0102
0304
05

140
It is clear that the food system is in need of a significant transformation if it is to feed our growing population in a sustainable, equitable, and adaptive manner. Because the food system is poised to expand in the coming decades, there is an opportunity to intervene in shaping its future direction. The current functioning of the food system is the result of deeply embedded, self-reinforcing structures and paradigms. These lead to the problematic behaviours and impacts that we have described throughout this report. With the right interventions, we may be able to avoid impacts and break out of patterns that now seem inevitable as a result of its current trajectory.
Before we can chart a course for transitioning the food system to a different state, we must have a clear outlook of where we would actually like it to go; a working definition of what sustainability might mean in the context of this system. Though it may seem challenging to develop consensus on the “ideal state” of the food system, this task is greatly simplified by sticking to performance or outcome-oriented features (e.g., adequate food supply for all people) rather than describing the specific mechanisms or approaches that should be used to produce those outcomes (e.g., applying conventional versus organic farming techniques).
In this chapter, we propose a working draft of performance criteria for a sustainable food system. By describing what the system would function like if all of its negative impacts were addressed, we are able to describe how an ideal system might look without prescribing mechanisms for how to get there.
The resulting performance criteria of an ideal food system can be grouped under four key challenges that the food system must address in order to be considered sustainable:
» Challenge 1: Adaptive and Resilient Food System » Challenge 2: Nutritious Food for All » Challenge 3: Within Planetary Boundaries » Challenge 4: Supporting Livelihoods and Well-Being
In a sustainable food system, all four of these challenges should be adequately addressed: only dealing with a subset shifts the “burden” from one problem to another, and leaves the system in a state of vulnerability that threatens its overall functioning. We provide an overview of the key objectives that need to be addressed within the scope of each of these challenges.
KEY MESSAGES: » Table 3 presents a set of idealised performance criteria for a food system that addresses
human and ecological needs simultaneously. The performance criteria adhere to the principles set forth in systemic sustainability frameworks like the circular economy, biomimicry, or industrial ecology thinking. They describe a state where the negative impacts within the food system have been reversed (i.e., universal food security has been achieved, biodiversity levels are no longer threatened by activities of the food system, etc.). We have grouped the objectives presented in Table 3 under the heading of four central challenges for achieving a sustainable and resilient food system.
» A transition to a sustainable and resilient food system will require all four challenges to be simultaneously addressed. Though distinct from one another, the challenges share a number of root causes, which should be central targets in shaping a coherent strategy for transitioning the food system:
5.0
INTR
ODUC
TION
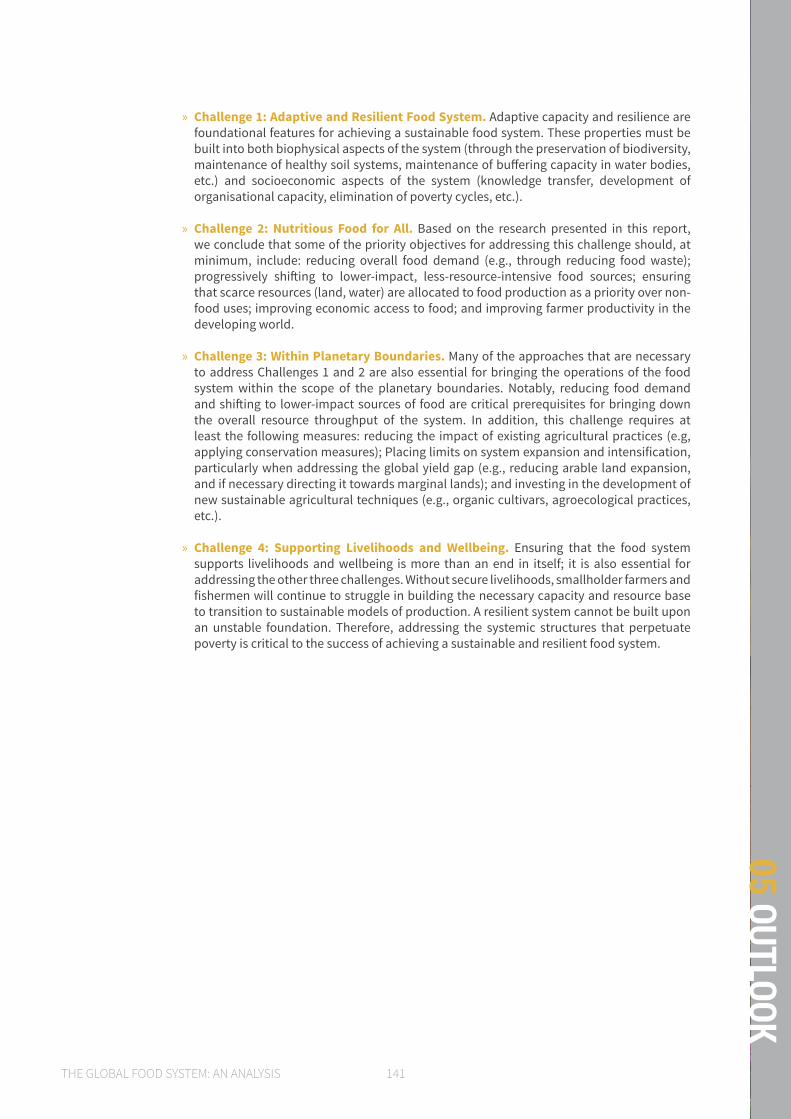
THE GLOBAL FOOD SYSTEM: AN ANALYSIS 141
05 OUTLOOK
» Challenge 1: Adaptive and Resilient Food System. Adaptive capacity and resilience are foundational features for achieving a sustainable food system. These properties must be built into both biophysical aspects of the system (through the preservation of biodiversity, maintenance of healthy soil systems, maintenance of buffering capacity in water bodies, etc.) and socioeconomic aspects of the system (knowledge transfer, development of organisational capacity, elimination of poverty cycles, etc.).
» Challenge 2: Nutritious Food for All. Based on the research presented in this report,
we conclude that some of the priority objectives for addressing this challenge should, at minimum, include: reducing overall food demand (e.g., through reducing food waste); progressively shifting to lower-impact, less-resource-intensive food sources; ensuring that scarce resources (land, water) are allocated to food production as a priority over non-food uses; improving economic access to food; and improving farmer productivity in the developing world.
» Challenge 3: Within Planetary Boundaries. Many of the approaches that are necessary to address Challenges 1 and 2 are also essential for bringing the operations of the food system within the scope of the planetary boundaries. Notably, reducing food demand and shifting to lower-impact sources of food are critical prerequisites for bringing down the overall resource throughput of the system. In addition, this challenge requires at least the following measures: reducing the impact of existing agricultural practices (e.g, applying conservation measures); Placing limits on system expansion and intensification, particularly when addressing the global yield gap (e.g., reducing arable land expansion, and if necessary directing it towards marginal lands); and investing in the development of new sustainable agricultural techniques (e.g., organic cultivars, agroecological practices, etc.).
» Challenge 4: Supporting Livelihoods and Wellbeing. Ensuring that the food system supports livelihoods and wellbeing is more than an end in itself; it is also essential for addressing the other three challenges. Without secure livelihoods, smallholder farmers and fishermen will continue to struggle in building the necessary capacity and resource base to transition to sustainable models of production. A resilient system cannot be built upon an unstable foundation. Therefore, addressing the systemic structures that perpetuate poverty is critical to the success of achieving a sustainable and resilient food system.
142
To develop a outlook of how the food system would perform in a sustainable state, we can start with taking all of its current negative impacts and describing how the system would look like if they were to be eliminated or reversed. The ultimate picture that emerges should be a holistic vision of a system that addresses human and ecological needs simultaneously, characterised by its adherence to the principles set forth in systemic sustainability frameworks like the circular economy, biomimicry, or industrial ecology thinking.
Applying these mental frameworks to any kind of system leads to some general criteria for performance. Using this approach, a sustainable system is one:
» That operates fully on renewable or otherwise sustainable forms of energy
» That structurally enhances and preserves biodiversity
» Whose material cycles are fully closed on a human-relevant time scale (a zero waste system)
» That does not structurally consume, disperse, or deplete non-renewable resources, or at minimum, uses them at a pace that is consistent with inter-generational equity
» That extracts and utilises renewable resources at a sustainable rate
» That is highly efficient, maximizing value extracted per resource used (where “value” is more broadly defined than simply in terms of finances and also includes aspects that are less easily quantified, such as ecosystem services and preservation of cultural heritage)
» That structurally safeguards the health and wellbeing of humans and other animals
» That creates resilience and adaptability in human societies
» That supports adequate livelihoods
» That is culturally inclusive
If we apply these generic ideas to the impact areas we have seen in the food system thus far, we can specify in more detail how they would translate to the food system in particular. In the table below we sketch how each of the main impact or behavioural areas that we identified as problematic earlier in this report would perform in a sustainable state. This is a sketch, since the details of the ideal performance of each impact category could be refined in a great deal more detail and potentially coupled with quantitative performance assessment targets. However, for our purposes in this work, we do not intend to use them for any quantitative evaluation. The descriptions are simply meant to provide a framework for steering our decision-making in the right direction, and avoiding strategies that improve one area of the system at the expense of another.
The performance descriptions are intentionally idealistic. A truly ideal state is likely never to be achievable, but it is nonetheless important to aim for best performance possible.v
5.1 DEVELOPING AN OUTLOOK
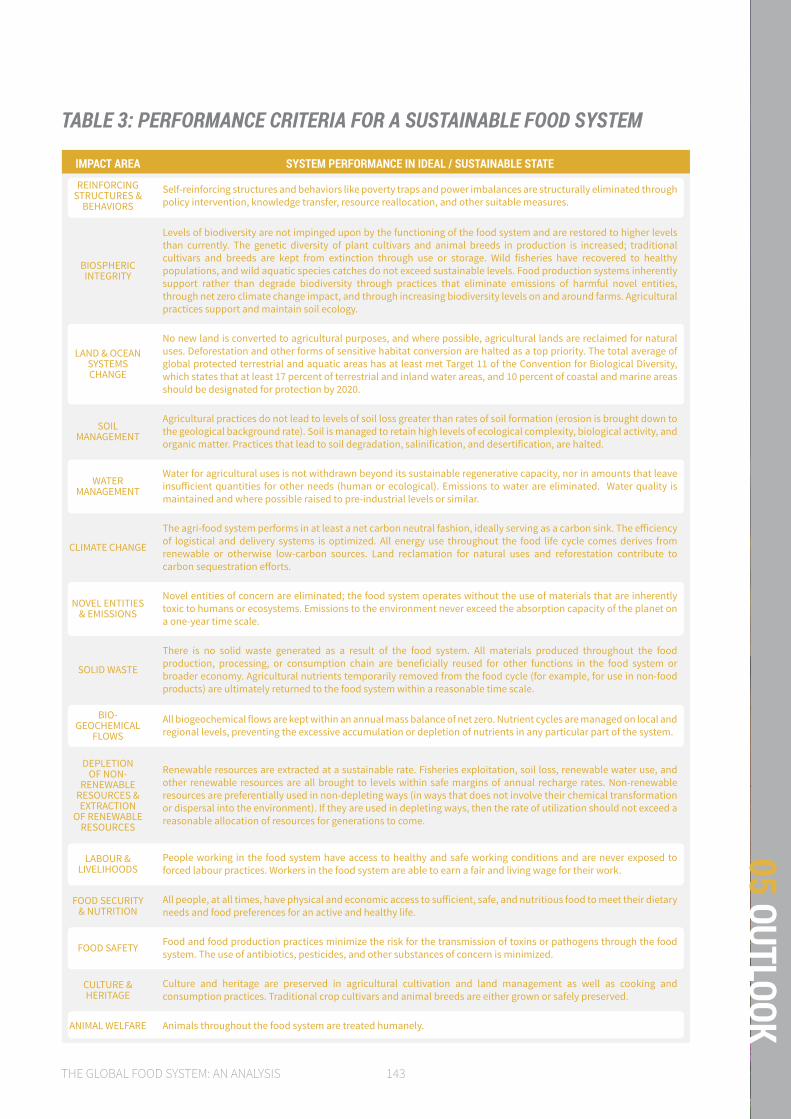
THE GLOBAL FOOD SYSTEM: AN ANALYSIS 143
05 OUTLOOK
IMPACT AREA SYSTEM PERFORMANCE IN IDEAL / SUSTAINABLE STATE
REINFORCING STRUCTURES &
BEHAVIORS
Self-reinforcing structures and behaviors like poverty traps and power imbalances are structurally eliminated through policy intervention, knowledge transfer, resource reallocation, and other suitable measures.
BIOSPHERIC INTEGRITY
Levels of biodiversity are not impinged upon by the functioning of the food system and are restored to higher levels than currently. The genetic diversity of plant cultivars and animal breeds in production is increased; traditional cultivars and breeds are kept from extinction through use or storage. Wild fisheries have recovered to healthy populations, and wild aquatic species catches do not exceed sustainable levels. Food production systems inherently support rather than degrade biodiversity through practices that eliminate emissions of harmful novel entities, through net zero climate change impact, and through increasing biodiversity levels on and around farms. Agricultural practices support and maintain soil ecology.
LAND & OCEAN SYSTEMS CHANGE
No new land is converted to agricultural purposes, and where possible, agricultural lands are reclaimed for natural uses. Deforestation and other forms of sensitive habitat conversion are halted as a top priority. The total average of global protected terrestrial and aquatic areas has at least met Target 11 of the Convention for Biological Diversity, which states that at least 17 percent of terrestrial and inland water areas, and 10 percent of coastal and marine areas should be designated for protection by 2020.
SOIL MANAGEMENT
Agricultural practices do not lead to levels of soil loss greater than rates of soil formation (erosion is brought down to the geological background rate). Soil is managed to retain high levels of ecological complexity, biological activity, and organic matter. Practices that lead to soil degradation, salinification, and desertification, are halted.
WATER MANAGEMENT
Water for agricultural uses is not withdrawn beyond its sustainable regenerative capacity, nor in amounts that leave insufficient quantities for other needs (human or ecological). Emissions to water are eliminated. Water quality is maintained and where possible raised to pre-industrial levels or similar.
CLIMATE CHANGE
The agri-food system performs in at least a net carbon neutral fashion, ideally serving as a carbon sink. The efficiency of logistical and delivery systems is optimized. All energy use throughout the food life cycle comes derives from renewable or otherwise low-carbon sources. Land reclamation for natural uses and reforestation contribute to carbon sequestration efforts.
NOVEL ENTITIES & EMISSIONS
Novel entities of concern are eliminated; the food system operates without the use of materials that are inherently toxic to humans or ecosystems. Emissions to the environment never exceed the absorption capacity of the planet on a one-year time scale.
SOLID WASTE
There is no solid waste generated as a result of the food system. All materials produced throughout the food production, processing, or consumption chain are beneficially reused for other functions in the food system or broader economy. Agricultural nutrients temporarily removed from the food cycle (for example, for use in non-food products) are ultimately returned to the food system within a reasonable time scale.
BIO-GEOCHEMICAL
FLOWS
All biogeochemical flows are kept within an annual mass balance of net zero. Nutrient cycles are managed on local and regional levels, preventing the excessive accumulation or depletion of nutrients in any particular part of the system.
DEPLETION OF NON-
RENEWABLE RESOURCES & EXTRACTION
OF RENEWABLE RESOURCES
Renewable resources are extracted at a sustainable rate. Fisheries exploitation, soil loss, renewable water use, and other renewable resources are all brought to levels within safe margins of annual recharge rates. Non-renewable resources are preferentially used in non-depleting ways (in ways that does not involve their chemical transformation or dispersal into the environment). If they are used in depleting ways, then the rate of utilization should not exceed a reasonable allocation of resources for generations to come.
LABOUR & LIVELIHOODS
People working in the food system have access to healthy and safe working conditions and are never exposed to forced labour practices. Workers in the food system are able to earn a fair and living wage for their work.
FOOD SECURITY & NUTRITION
All people, at all times, have physical and economic access to sufficient, safe, and nutritious food to meet their dietary needs and food preferences for an active and healthy life.
FOOD SAFETY Food and food production practices minimize the risk for the transmission of toxins or pathogens through the food system. The use of antibiotics, pesticides, and other substances of concern is minimized.
CULTURE & HERITAGE
Culture and heritage are preserved in agricultural cultivation and land management as well as cooking and consumption practices. Traditional crop cultivars and animal breeds are either grown or safely preserved.
ANIMAL WELFARE Animals throughout the food system are treated humanely.
TABLE 3: PERFORMANCE CRITERIA FOR A SUSTAINABLE FOOD SYSTEM
144
Though Table 3 illustrates the multitude of performance areas that we would ideally see properly addressed in a sustainable food system (and is likely not exhaustive on this front), it is clear that the different performance areas fall naturally into certain categories of higher concern. We have grouped these performance areas below into four over-arching categories or “challenges” that a sustainable food system should address. All of these challenges must be addressed simultaneously for the system to be considered sustainable; solutions that fix one problem while aggravating another critical problem will generally lead to a new, unstable situation.
CHALLENGE 2: NUTRITIOUS FOOD FOR ALL
The most basic and fundamental challenge that the food system must address is to ensure the supply of adequate nutrition for the world’s population. Ideally, it should achieve the objective set out by the World Food Summit in Rome, which states that food security is addressed when, “all people, at all times, have physical and economic access to sufficient, safe, and nutritious food to meet their dietary needs and food preferences for an active and healthy life.” This challenge encompasses all of the food security, nutrition, and food safety performance impact areas in Table 3.
CHALLENGE 3: WITHIN PLANETARY BOUNDARIES
A sustainable food system should operate within safe boundaries in all of the key biophysical impact areas across the entire life cycle of food production, consumption, and disposal. This is one of the largest and most complex challenges, which encompasses all of the primary biophysical impact categories described in Table 3. Though we should continuously strive for the minimization of negative impacts within the food system, there are some areas, such as preservation of biodiversity, that should be prioritized over others within this category, as discussed in section 3.3. In general, severe and irreversible impacts should be addressed with the highest urgency.
CHALLENGE 4: LIVELIHOODS AND WELL-BEING
The food system should structurally support the livelihoods and well-being of people working within it. It should be possible to fully nourish and support oneself or earn a reasonable living wage in exchange for average work hours within the food system. This challenge addresses the impacts in the labour and livelihoods, culture and heritage, and animal welfare categories, as well as structural elements like the poverty trap and power / wealth imbalances.
CHALLENGE 1: ADAPTIVE AND RESILIENT FOOD SYSTEM
An adaptive and resilient food system is one that will be able to respond to changing circumstances and new challenges as they emerge. Adaptive capacity and resilience are foundational features for achieving a sustainable food system. These properties must be built into both biophysical aspects of the system (through the preservation of biodiversity, maintenance of healthy soil systems, maintenance of buffering capacity in water bodies, etc.) and socioeconomic aspects of the system (knowledge transfer, development of organisational capacity, elimination of poverty cycles, etc.).
FOOD FOR ALL NET ZERO IMPACT PRODUCTION
LIVELIHOODS AND WELLBEING ADAPTIVE AND RESILIENT SYSTEMS
FOOD FOR ALL NET ZERO IMPACT PRODUCTION
LIVELIHOODS AND WELLBEING ADAPTIVE AND RESILIENT SYSTEMS
FOOD FOR ALL NET ZERO IMPACT PRODUCTION
LIVELIHOODS AND WELLBEING ADAPTIVE AND RESILIENT SYSTEMS
FOOD FOR ALL NET ZERO IMPACT PRODUCTION
LIVELIHOODS AND WELLBEING ADAPTIVE AND RESILIENT SYSTEMS
5.2 SYSTEMIC CHALLENGES FOR THE FOOD SYSTEM
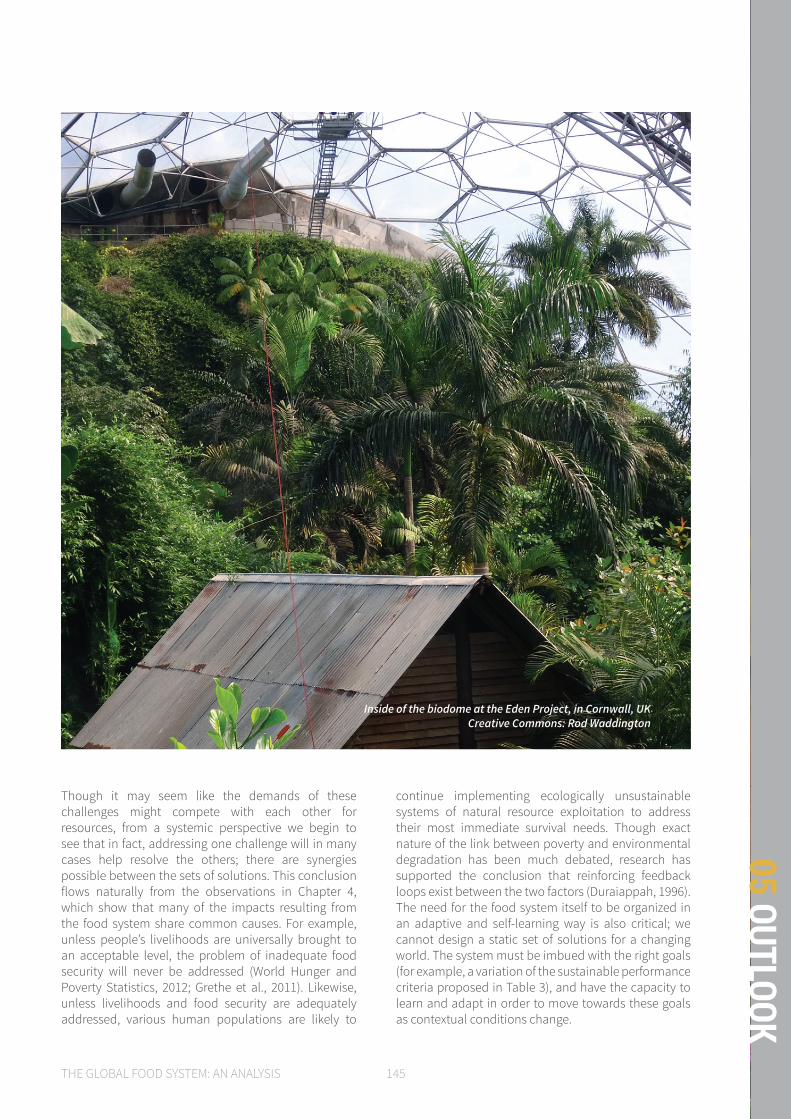
THE GLOBAL FOOD SYSTEM: AN ANALYSIS 145
05 OUTLOOK
Though it may seem like the demands of these challenges might compete with each other for resources, from a systemic perspective we begin to see that in fact, addressing one challenge will in many cases help resolve the others; there are synergies possible between the sets of solutions. This conclusion flows naturally from the observations in Chapter 4, which show that many of the impacts resulting from the food system share common causes. For example, unless people’s livelihoods are universally brought to an acceptable level, the problem of inadequate food security will never be addressed (World Hunger and Poverty Statistics, 2012; Grethe et al., 2011). Likewise, unless livelihoods and food security are adequately addressed, various human populations are likely to
continue implementing ecologically unsustainable systems of natural resource exploitation to address their most immediate survival needs. Though exact nature of the link between poverty and environmental degradation has been much debated, research has supported the conclusion that reinforcing feedback loops exist between the two factors (Duraiappah, 1996). The need for the food system itself to be organized in an adaptive and self-learning way is also critical; we cannot design a static set of solutions for a changing world. The system must be imbued with the right goals (for example, a variation of the sustainable performance criteria proposed in Table 3), and have the capacity to learn and adapt in order to move towards these goals as contextual conditions change.
Inside of the biodome at the Eden Project, in Cornwall, UKCreative Commons: Rod Waddington
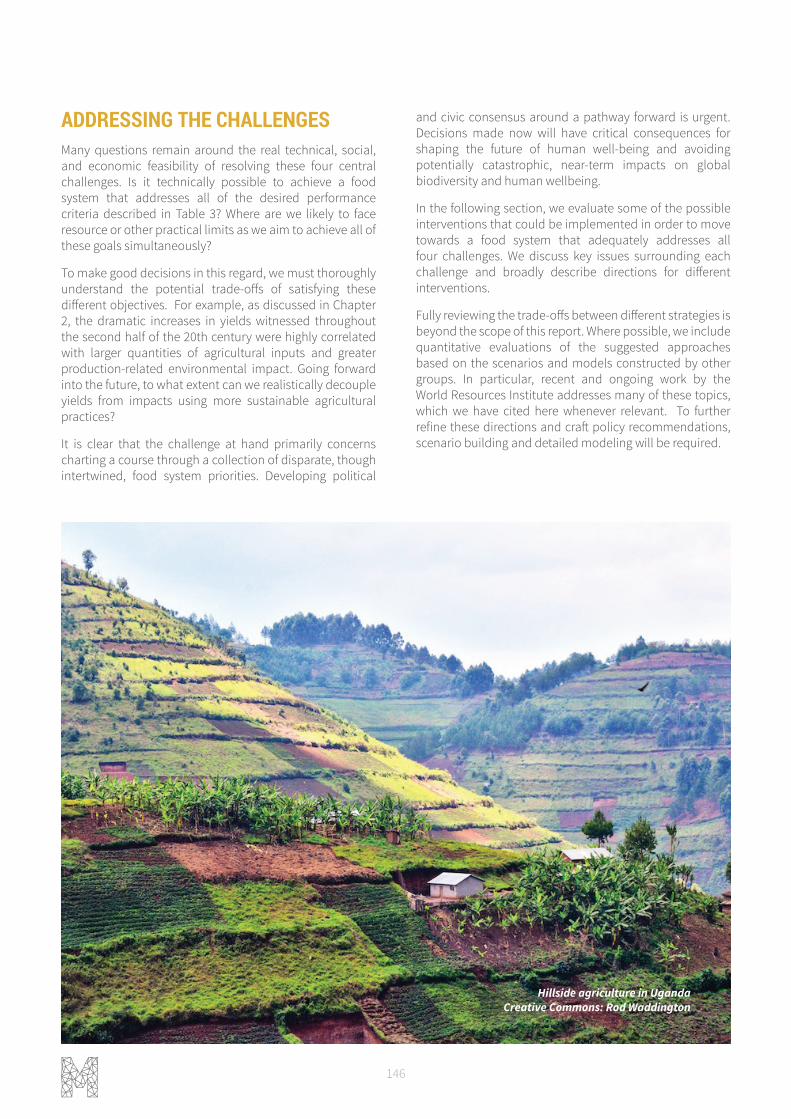
146
ADDRESSING THE CHALLENGESMany questions remain around the real technical, social, and economic feasibility of resolving these four central challenges. Is it technically possible to achieve a food system that addresses all of the desired performance criteria described in Table 3? Where are we likely to face resource or other practical limits as we aim to achieve all of these goals simultaneously?
To make good decisions in this regard, we must thoroughly understand the potential trade-offs of satisfying these different objectives. For example, as discussed in Chapter 2, the dramatic increases in yields witnessed throughout the second half of the 20th century were highly correlated with larger quantities of agricultural inputs and greater production-related environmental impact. Going forward into the future, to what extent can we realistically decouple yields from impacts using more sustainable agricultural practices?
It is clear that the challenge at hand primarily concerns charting a course through a collection of disparate, though intertwined, food system priorities. Developing political
and civic consensus around a pathway forward is urgent. Decisions made now will have critical consequences for shaping the future of human well-being and avoiding potentially catastrophic, near-term impacts on global biodiversity and human wellbeing.
In the following section, we evaluate some of the possible interventions that could be implemented in order to move towards a food system that adequately addresses all four challenges. We discuss key issues surrounding each challenge and broadly describe directions for different interventions.
Fully reviewing the trade-offs between different strategies is beyond the scope of this report. Where possible, we include quantitative evaluations of the suggested approaches based on the scenarios and models constructed by other groups. In particular, recent and ongoing work by the World Resources Institute addresses many of these topics, which we have cited here whenever relevant. To further refine these directions and craft policy recommendations, scenario building and detailed modeling will be required.
Hillside agriculture in UgandaCreative Commons: Rod Waddington
THE GLOBAL FOOD SYSTEM: AN ANALYSIS 147
05 OUTLOOK
5.2.1 Challenge 1: Adaptive and Resilient Food System
FOOD FOR ALL NET ZERO IMPACT PRODUCTION
LIVELIHOODS AND WELLBEING ADAPTIVE AND RESILIENT SYSTEMS
Resilience is the general capacity of a system to maintain its performance and functionality even in the face of crisis or disturbance (Holling and Gunderson, 2002). It is an emergent property of systems and is generally very context-dependent. Though it may sound like a universally beneficial trait, it is not necessarily so. As discussed in Chapter 4, one might argue that our current food system is highly resilient, because it has continued generally on the same path of development and expansion despite many crises and pressures that may have otherwise indicated failure. The cycles of poverty and environmental degradation that we see in our current food system are one hallmark of its great resilience to breaking out of its established patterns.
Therefore, though resilience can be a very beneficial systemic feature, it does not come without certain risks. One way to counteract the pitfalls of inherent resilience is to ensure that the system in question is also adaptive: that it can learn about its changing environment, build capacity, and self-organize into a new forms that function better. Biological systems are by definition adaptive, though removing their base of diversity or systemic buffers (like the ability to absorb beyond a certain level of pollution) can undermine this adaptive capacity. Human systems vary significantly in their degree of adaptability. They can be highly adaptive if they are organized in a way that includes the capacity for self-organisation and that includes mechanisms for translating experience into new behaviours or rules (codified learning).
There are many complex dimensions, most of which are not fully predictable, to understanding how to design an adaptive and resilient food system. This is increasingly
important as we enter a period of greater planetary instability resulting from the impacts of climate change or even the periodic perturbations of the global economy. It is therefore critical, on many fronts, to develop rules and policies that encode adaptation and resilience rather than permanently entrenching specific patterns. It is never the case that a solution which works in one specific circumstance will continue to work in all circumstances at all times.
Cabel and Oelofse have developed a useful framework for assessing the resilience of agroecosystems, which provides 13 indicators for evaluating broad dimensions of resilience relevant to food systems (Cabel & Oelofse, 2012). These span from the design of agricultural systems in the direction of self-regulation, to the preservation of culture and heritage as a mechanism for maintaining social evolutionary diversity (in parallel to maintaining biodiversity as a key adaptive element). This framework can be useful as a guideline for assessing the development of new policies with regards to their support of resilience and adaptability.
One example of how policies and behaviours in the food system have led to low resilience and adaptability can be seen through the allocation of resources to technological innovation in agriculture. A study commissioned by the FAO and the World Bank, The International Assessment of Agricultural Knowledge, Science, and Technology for Development (IAASTD), showed that the pattern of investment in agricultural R&D has essentially been leading to technological lock-in and increased vulnerability in the food system. The study found that technological innovations have generally favoured large-scale producers, due to their capital-intensive and resource-intensive nature. The externalities, or non-monetary costs, of these innovations, like pollution and resource-depletion, have continually been borne by small-holder farmers, communities, and the environment. Investing in low-cost inorganic fertilisers, expanding on local knowledge bases, in local seed sharing, reducing agricultural dependency on fossil fuels, and setting up Participatory Plant Breeding Programs and Farmer Research groups, were all identified as promising ways to improve the penetration and effectiveness of agricultural technology development (Tittonell & Giller, 2013). These alternative approaches also inherently build resilience by increasing the spread of knowledge and shifting agriculture towards practices that are less dependent on centrally-controlled resources.
Systemic resilience does not come without certain risks: it can lock a system in to problematic patterns. One way to counteract hard-wired
resilience is to ensure that the system is also adaptive, and can
find answers to its own problems.
148
If we assume that the food system does indeed face significant growth constraints from a planetary boundary perspective, as argued in the discussion at the end of Chapter 3, then the strategy for addressing the challenge of universal food security must be multi-faceted and nuanced, relying on more than just the expansion and conventional intensification of the food system.
As discussed in section 3.2.2, there is a general consensus in the scientific community that poverty, rather than the lack of physical food availability, is the primary driver of food insecurity (Alexandratos & Bruinsma, 2012). Therefore, strategies for combating under-nourishment should focus at least as much on economic availability of food as actual food production. Even so, it is clear that unless a sufficient quantity of food is produced, the elimination of under-nourishment remains physically impossible.
There are many factors that bear influence on what a sufficient quantity of food might be. What type of food is produced and where it is produced both play significant roles in determining the quantity that we need. Factors like nutrient density, bioavailability, micro-nutrients, spoilage rates, location of production relative to sites of demand, and economic factors related to specific food types, can all significantly alter the total mass of food we need to produce to satisfy global food demand, even as calorie and other nutrient demands remain inflexibly fixed to global population size. Furthermore, the production of different food types is associated with a widely varying range of impacts, offering many opportunities for shifting towards lower-impact nutrition that places structurally lower demands on scarce resources like land and fresh water.
Based on the research presented in this report, we conclude that some of the priority objectives for addressing this challenge should, at minimum, include:
1. Reducing overall food demand
2. Progressively shifting to lower-impact, less-resource-intensive food sources
3. Ensuring that scarce resources (land, water) are allocated to food production as a priority over non-food uses
4. Improving economic access to food
5. Improving farmer productivity in the developing world
REDUCING OVERALL FOOD DEMANDThe World Resources Institute has calculated that 25% of calories produced each year are wasted before ever reaching a plate (as compared to around 30% of food by mass). Significantly reducing food losses and waste, though challenging, clearly presents one of the largest and least-controversial pathways for structurally reducing food demand.
More moderate gains in reducing food demand can be achieved by reducing over-consumption in the developed world. though the type and location of the excess calories currently produced is not necessarily conducive to re-distribution to hungrier parts of the world. The World Resources Institute estimates that this strategy could reduce projected increases in food demand by 6% (World Resources Institute, 2013a).
PROGRESSIVELY SHIFTING TO LOWER-IMPACT, LESS RESOURCE-INTENSIVE FOOD SOURCESReducing the resource-intensity of foods consumed is a way to save resources like land and water without cutting food output or compromising on the quality of nutritional supply. This objective can be achieved by changing the type of foods consumed or reducing the impact associated with the production practices of specific food products. There are significant gains to be made through taking this approach because of the enormous variability in the nutritional yield of food products relative to their total impact.
NUTRITIONAL YIELDThere is high variability in the total number of calories, proteins, fats, and micro-nutrients produced per hectare depending on the food source. Figure 28 illustrates the relationship between land use demand, total mass produced, calories, and protein for the major food categories used throughout this study. From this graphic, it is clear that certain sources of food provide much larger amounts of key nutrient resources per hectare than others. This critical variability means that switching to foods that are more efficient at nutrient delivery offers an important point of leverage for reducing the overall impact of the food system without compromising food security. For simplicity’s sake, Figure 28 only shows nutritional yields relative to land use; similar assessments can be made with a broader range of resource inputs.
5.2.2 Challenge 2: Nutritious Food for All
FOOD FOR ALL NET ZERO IMPACT PRODUCTION
LIVELIHOODS AND WELLBEING ADAPTIVE AND RESILIENT SYSTEMS

THE GLOBAL FOOD SYSTEM: AN ANALYSIS 149
05 OUTLOOK
Cereals Roots & Tubers
Oil Crops Pulses Nuts Vegetables Fruits Sugar Crops Mushrooms
50,000,000 Calories / Hectare
3,000,000 Grams of Protein / Hectare
100,000,000
6,000,000
150,000,000
9,000,000
200,000,000
12,000,000
Cereals Roots & Tubers
Oil Crops Pulses Nuts Vegetables Fruits Sugar Crops
70,000,000 Calories / Hectare
700,000 Grams of Protein / Hectare
10,000,000
100,000
20,000,000
200,000
30,000,000
300,000
40,000,000
400,000
50,000,000
500,000
60,000,000
600,000
Figure 27: Comparison of protein and calorie yields per hectare from different plant-based products. (FAO, 2015b)
PROTEIN AND CALORIE YIELDS ACROSS SELECTED PLANT-BASED FOOD CATEGORIES
Differences in nutritional value per unit of resource input exist across both animal- and plant-derived products. Though the largest variation in this nutritional yield is between plant and animal products, there is also significant variation between plant-derived foods. Figure 27 illustrates the yield of calories (kcal, in orange) and protein (grams, in blue) per hectare averaged across different plant-derived food categories. In Figure 27, we can see that one hectare of mushroom production
can yield an average of almost 15,000 tonnes of protein, which is 21 times greater than the protein yield achieved by oil crops, the second-most effective source of plant-based protein out of those evaluated. Similarly, the impacts associated with emerging alternative food sources, like insects, algae, and products like micro-fungi, could likewise provide pathways for food sources with much-lower resource demand.
150
THE MEAT QUESTIONThe consumption of meat and animal products is, rightfully, one of the most fervently debated and discussed topics in food sustainability. Livestock production currently uses around 80% of global land resources (as shown on the global food production overview in Figures 2 and 3), and also disproportionally contributes to the food system’s role in climate change, land degradation, and eutrophication. At the same time, animal protein is highly desired by many for taste and dietary reasons, and provides a single, concentrated source of key macro- and micro-nutrients. In many parts of the world, protein deficiencies are pervasive, and an increase in animal product consumption could potentially bring significant health benefits (Murphy & Allen, 2003).
The question of whether, and to what extent, meat and animal products have a place in a sustainable food future is complex to answer. As briefly described in Chapter 1, the livestock production sector has gone through a transformation in recent decades, moving from primarily depending on residual materials and low-fertility land, to more intensive production approaches that rely on outside inputs for concentrated animal feed. With livestock now consuming food that would otherwise be suitable for human consumption, meat production for the wealthier part of the population has begun to compete directly with food availability for the global poor. A key factor here is the relatively inefficient conversion rate of cereals into animal protein. UNEP has reported that it takes approximately 3 kg of grain to produce 1 kg of animal protein using cereals as feed (Nellemann et. al., 2009).
Considering the enormous footprint associated with most animal production, the consumption of animal products should certainly be limited: in principle, livestock production should be matched to available land resources, and should support local nutrient demands. However, simply calling for a stop to meat consumption, a strategy publicly supported by many groups and institutions (UNEP, 2010), is an oversimplified perspective that obscures many of the complex underlying roles of livestock. There is a level of animal husbandry within the global food system that would be considered generally sustainable, even if the animals themselves were not raised to be eaten, but rather primarily for manure production, draught power, and weed control. By contrast, however, in the increasingly common industrial production circumstances, where large amounts of resources are diverted to livestock rearing in CAFO systems, animal production has become a driver for ecosystem destruction. The type of practices used and the origin of the animal are critical to making this distinction.
DIETARY EVOLUTIONData on “nutritional yield” can help orient decision-making for impact reduction from food sources and also help indicate potential for improvement in production practices in terms of impact and resource intensity. Efficiency
measures for food production should ideally account for total yield not in tonnes, but rather, in nourishment per hectare (Cassidy, West, Gerber, & Foley, 2013). If we could achieve dietary shifts towards more efficient sources of nutrition by this measure, then the overall demand in mass for food output and demand for land resources could significantly decline. Though achieving large-scale changes in consumer diets is no easy task, reducing the impact associated with the production of certain foods through improved production practices can circumvent that necessity to a certain extent.
ENSURING THAT SCARCE RESOURCES ARE ALLOCATED TO FOOD PRODUCTION AS A PRIORITY OVER NON-FOOD USESAgricultural land use for traditional non-food crops like fibre and tobacco, is relatively negligible and has remained stable in past decades. However, agricultural crops dedicated to industrial uses, like biofuel production, play a significant and growing role. The World Resources Institute has estimated that removing support for first generation biofuels could close the 2050 food production gap by 30% (World Resources Institute, 2013a). The competition for land, water, food, or feedstock material from biofuels is clearly evident. The scale of the solution offered by biofuels relative to the overall demand for fuel resources makes it clear that this is an insufficient and detrimental approach; policy support for first generation biofuels should be eliminated.
IMPROVING ECONOMIC ACCESS TO FOODBreaking the cycle of poverty traps is a primary objective in ensuring food security. This topic is further discussed in section 5.2.4.
IMPROVING FARMER PRODUCTIVITY IN THE DEVELOPING WORLDGlobal statistics, though informative, tend to obscure a great deal of contextual resolution that is of critical importance to decision-making and policy. In the case of food security, it is particularly important to understand where the projected shortfalls of food are likely to occur, rather than simply having an understanding that they will occur on a global level. As discussed elsewhere in this report (sections 1.6, 2.2, and 3.2.2), the majority of the population
THE GLOBAL FOOD SYSTEM: AN ANALYSIS 151
05 OUTLOOK
increases projected by the United Nations are going to occur in Sub-Saharan Africa, the region with the highest percentage of undernourished people in the world and the lowest global yields. Though Sub-Saharan Africa only accounts for 9% of calorie consumption today, it is projected to demand 37% of global calories by 2050 (World Resources Institute, 2013b).
Within the literature, there is consensus that nutrient supply is by far the most significant limiting factor for agriculture in this region (Tittonell & Giller, 2013). Specifically, soils have been depleted of organic matter, to the point where they are so nutrient-depleted that they do not initially respond to applications of fertiliser; this supply must be kept continuous and without interruption to prevent the soils from losing productivity. The rehabilitation of these soils is challenging and costly, and many synthetic fertilisers do not work on these soils. Not enough livestock is kept in the region to supply sufficient manure. A calculation by Tittonell and Giller revealed that rehabilitating one hectare of arable land in Zimbabwe would require the manure from 30 hectares of pastureland (8 tonnes per year).
Ample evidence does exist that significant yield improvements are possible even in areas facing the most challenging conditions (Tittonell & Giller, 2013). However, it is also clear that a nuanced and context-specific approach is required for making headway in these locations. Detailed data on particular local conditions, problems, preferences, and limitations will be needed in order to develop set of strategies for agricultural improvement.
Studies have shown that even small changes in crop management specifications, like delaying or advancing the transplating date of rice by as little as seven days, can result in yield potential estimates that are up to 15% greater than what is achieved in practice. In combination with other modeled factors, yields could be raised by as much as 46% from simple improvements in practice, not even counting the increases possible from additional nutrient supply or better plant cultivars (Van Wart et al., 2013). This kind of regional data, in combination with updated information streams on weather, soil conditions, and other temporal factors clearly show great potential for increasing yields in low-yielding areas.
Of course, technical potential aside, yield gaps are caused by a broad mix of factors, many of which are purely socio-economic. One study which looked at localized yield gaps for a range of crops in South Asia found that potential improvements in output that ranged between 11 and 67%, with a majority of potential increases at the middle to high end of this range. They found key productivity constraints to include: undependable weather, land degradation, inefficient use of natural resources particularly rainfall,
inappropriate soil and water management practices, imbalanced use of fertilisers, infestation by weeds pests and diseases, lack of region-specific varieties of crops resistant to local stresses, shortage of labour, inadequate use of equipment, inaccessibility to knowledge, low adoption of scientific crop production practices, uncertainty of land tenure, meager credit facilities to small farmers for appropriate investments, and high interest rates by private money lenders (Singh, Pongkanjana, & Pradesh, 2006). Out of this slew of problems, many have origins in non-technical barriers, most of which have as their foundation an insufficient access to resources.
Addressing these challenges is complicated by the fact that continued dependency in certain developing nations on inexpensive food imports creates structural disincentives for farmers in those nations to invest in improved agricultural capacity (Dixon, Gulliver, Gibbon, & Kassam, 2001). As discussed in Chapter 4, these productivity issues are therefore not likely to be resolved without addressing the full range of structural causes and entrenched patterns that keep farmers and fishermen in the developing world in marginalized conditions (poverty trap; power-wealth entrenchment; institutional lock-ins in trade, technology, and infrastructure; tragedy of the commons).
LOCATION AND CONTEXT ARE CRITICALBased on logical approximations and the addition of all of the potential “savings” that can be achieved through these different strategies, we can conclude that successfully implementing all of these demand-reduction strategies could theoretically fully cover the otherwise anticipated food supply shortfall between today’s production levels and 2050. However, it is clear that making progress on these objectives will require tackling structural problems within the food system (for example, addressing imbalanced market dynamics between the global north and south) and the application of strategies for larger-scale shifts in systemic behaviour (achieving changes in consumer diets). The geographical location of production and consumption also need to be consistently considered in the shaping of strategies.

152
LANDmillion hectares
PRODUCTIONmillion tonnes
TOTAL CALORIEStrillion kcal
TOTAL PROTEINtrillion grams
4870 4550 7000 310
CEREALS
OIL CROPS
VEGETABLE OILS
PULSES
TREE NUTS
VEGETABLES
FRUITS
SUGAR CROPS
SUGAR
STIMULANTS
SPICES
ROOTS & TUBERS
EGGS
COW’S MILK
TOTAL
OTHER MILK
MUTTON
BEEF
POULTRY
PORK
OTHER MEAT
SEAFOOD
3363
304514
235
163 633
930
232
27
685
287
179.4
347
8.7
434
1010
3133
101
308
23
28
600
33620
17
143
143
LAND USE, AGRICULTURAL PRODUCTION, CALORIES, AND PROTEIN

THE GLOBAL FOOD SYSTEM: AN ANALYSIS 153
05 OUTLOOK
LANDmillion hectares
PRODUCTIONmillion tonnes
TOTAL CALORIEStrillion kcal
TOTAL PROTEINtrillion grams
4870 4550 7000 310
CEREALS
OIL CROPS
VEGETABLE OILS
PULSES
TREE NUTS
VEGETABLES
FRUITS
SUGAR CROPS
SUGAR
STIMULANTS
SPICES
ROOTS & TUBERS
EGGS
COW’S MILK
TOTAL
OTHER MILK
MUTTON
BEEF
POULTRY
PORK
OTHER MEAT
SEAFOOD
3363
304514
235
163 633
930
232
27
685
287
179.4
347
8.7
434
1010
3133
101
308
23
28
600
33620
17
143
143
Figure 28. The relationship between land use, production, calories, and protein per product category, relative to total mass of global production in 2011. Reading the graphic from left to right, the first column shows the fraction of global land use allocated per product
category, followed by colums showing production in tonnes, calories, and protein, respectively. This graph once again illustrates the clear dominance of animal products in global agricultural land use. It also illustrates the importance of cereal products in global calorie
supply and animal products in global protein supply (FAO, 2015b)
154
5.2.3 Challenge 3: Within Planetary Boundaries
FOOD FOR ALL NET ZERO IMPACT PRODUCTION
LIVELIHOODS AND WELLBEING ADAPTIVE AND RESILIENT SYSTEMS
The third great challenge of achieving a sustainable food system is to eventually reach a state where food production, processing, and consumption all operate within the boundaries of our planetary system, and have a regenerative influence if possible. Though impacts occur throughout the food chain – from production through processing and disposal – the most irreversible and severe impacts generally take place in the agricultural production part of the chain. It is in this part of the life cycle that the enormous scale of the food system’s production lines most contributes to the transgression of key planetary boundaries like biodiversity loss, biogeochemical cycle disruptions, and climate change.
As discussed throughout this report, a majority of the severe impacts associated with agricultural production originate with system expansion (increases in arable and pasture lands) and conventional intensification practices. In order to keep the food system within safe planetary boundaries, we must focus on strategies that reduce both expansion and intensification.
Strongly related to the challenge of bringing the food system within the safe range of planetary boundaries are the strategies already discussed in the previous section (Challenge 2: Nutritious Food For All), including a strong focus on food demand reduction strategies (e.g., elimination of food waste) and transitioning to lower-impact modes of nutrition.
In addition, some of the practices common in current modes of agricultural production, like the reliance on heavy nutrient applications and high dependence on fossil fuels, need to be phased out over time as we transition to a new model of resilient and sustainable agriculture.
Based on the research presented in this report, we conclude that some of the priority objectives for addressing this challenge should, at minimum, include:
1. Reducing impact of existing agricultural, fishing, and aquaculture practices (e.g, applying conservation measures, phasing out damaging fishing practices)
2. Placing limits on system expansion and intensification, particularly when addressing global yield gap (e.g., reducing arable land expansion, and if necessary directing it towards marginal lands, enforcing fisheries quotas more effectively)
3. Investing in the development of new sustainable agricultural and aquaculture techniques (e.g., organic cultivars, agroecological practices, alternative fish feeds, etc.)
TOWARDS SUSTAINABLE AGRICULTURAL PRACTICESMaintaining the continued functioning and resilience of agroecological systems is critical for both medium and long-term preservation of the food system. One of the core foundations of agroecological systems are healthy soils, which are the basis for many ecosystem processes and local biodiversity. Many of the traditional biological features of soil have been instead replaced with chemical control mechanisms, creating a continuous dependency on continued outside inputs. Practices that structurally undermine the health of soils or that contribute to the transgression of key planetary boundaries are fundamentally unsustainable.
It is clear that our agricultural practices must evolve beyond the era of the Green Revolution. We need to achieve similar yields, but without the externalities. It is also clear from this review that yields should not be the yardstick that everything is measured against, particularly not when viewed over a short time-scale. It is not acceptable to sacrifice the basic long-term functioning of an agricultural system in exchange for a short period of high yields.
The primacy of yields as a measure of successful and efficient agricultural production often emerges in debates around so-called “aspirational” or sustainable production practices. The wisdom of switching to organic cultivation, or even to no-till agricultural practices, has been highly debated because of their documented reduction in yields over conventional practices though these yield gaps have been shown to narrow with proper complementary practices, and range significantly depending on the farmer and crop type (see section 1.2.1 for a discussion the variability in crop production systems and a more detailed discussion of yield differences between organic and conventional practices). However, from surveying global data, it is clear that a far more dominant cause of yield reduction is simply less advanced agricultural practice. Organic tomato production in the Netherlands yields 350 tonnes per hectare, while conventional tomato production in similar conditions ranges from 50 - 120 tonnes per hectare in other parts of Europe (FAO, 2011). This indicates that the yield gap between organic and non-organic forms of production (just to single out one form of agricultural practice) is much less significant than the yield gap that simply results from lack of knowledge and technique.
THE GLOBAL FOOD SYSTEM: AN ANALYSIS 155
05 OUTLOOK
A new era of sustainable agricultural production is needed, one which centres on maximising productive output for farmers without damaging the ecological resources on which this is based. One of the foundations of this approach should be that it is not a “one size fits all” strategy: rather, a menu of agricultural options should exist, which should be applied as needed to the specific contexts in which they best function.
There are many potential techniques available for significantly reducing the impacts associated with conventional agriculture practices (Campanhola, 2013). Though it is beyond the scope of this report to fully describe all of the options in this regard, some of the best practices that can be implemented to this effect in existing crop production systems include:
» Minimizing soil disturbance through direct seeding, no-till practices, and prevention of soil compaction
» Applying permanent organic soil cover through retaining crop residues, cover cropping, or relay cropping
» Diversifying species through crop rotation, agroforestry, intercropping, or polyculture
» Selecting plant cultivars suitable to local conditions and implementing appropriate cultivation techniques (spacing, pruning, etc.)
» Balancing plant nutrition by increasing organic soil matter and using appropriate (limited) nutrient applications
» Applying integrated pest and weed management
» Managing water supply efficiently through improved rainwater harvesting, enhanced infiltration, avoidance of evaporation (e.g., through mulching, no-till practices, and cover cropping)
» Avoiding soil compaction associated with machinery and field traffic
» Introducing farm biodiversity through the planting of ecological buffer zones
» Applying precision farming techniques, which can replace the need for inputs like water and fertilisers with better information about the timing and quantity of applications
Existing pasture lands, which will also need to increase in output by 80% by 2050 if they are to meet projected demand (Searchinger et al., 2013), will also need to be managed for high yields without leading to environmental degradation. Management practices for improving pasture productivity could include picking breeds that are better environmentally and metabolically suited to local conditions, diversifying plant cover on pasture fields to include trees and shrubs in addition to grasses, applying targeted fertilization, and improving cattle rotation schedules.
As discussed in section 3.3, in addition to these kinds of measures, similar efforts need to be made in order to bring the fisheries and aquaculture sectors within planetary limits, and the exploitation of other resources (both renewable and non-renewable), needs to be brought to a sustainable rate across the full scope of the food system.
With these and other approaches, existing, intensive agricultural techniques can progressively become less impactful while maintaining high yields. In countries that have already gone through a phase of Green Revolution intensification, implementing these kinds of measures, which may in some cases have a slight reduction on yield, is a higher priority than maintaining unsustainable yields.
Further research and investment is needed to develop improved, locally-adapted plant cultivars and plant varieties resistant to drought, salinisation, and other emerging challenges (Araus, Slafer, Reynolds, & Royo, 2002; Silva Dias, 2010). Research is needed on the potential of agroecology and agroforestry; on the development of alternative non-fossil-fuel based fertilisers (such as struvite, from both human and animal urine); and on integrated agricultural systems that effectively link nutrient flows between multiple species, such as aquaponics and stacked vertical farming systems (Balcom, 2015; Rahman et al., 2014; Silici, 2014). We should aim to develop agricultural and aquacultural systems that interface properly with both ecosystems and human habitations, and aspire towards fully closed material cycles and fully renewable resource use.
MANAGING THE TRANSITIONIt is clear that the profound transformation of the global food system needed to reach these objectives cannot happen overnight. Concerted and long-term investments in sustainable agricultural techniques are needed. Capacity building, structural investment, and large scale soil rehabilitation will need to take place in the least productive regions of the Global South. Only when systemic improvements begin to take hold can recommended de-intensification practices take place in excessively intensive, leading to an overall balancing of global agricultural productivity to within levels of bio-regional carrying capacity.
156
5.2.4 Challenge 4: Supporting Livelihoods and Wellbeing
FOOD FOR ALL NET ZERO IMPACT PRODUCTION
LIVELIHOODS AND WELLBEING ADAPTIVE AND RESILIENT SYSTEMS
Though it may often seem like fixing the global food system is a very technical matter, primarily concerning itself with soil carbon, mass balances, and exergetic efficiencies, at its core, food is about people; about our health, our culture, our experience of our lives and our environments. Without a holistic strategy that deeply recognizes the critical role of individuals and societies in the proper functioning of the food system, we will not be able to solve the Gordian knot of challenges that has been described here.
Human well-being is not simply about livelihoods and basic access to resources, but also about having the social conditions to thrive, preserve cultural heritage, and pursue self-actualization. Without addressing this core need, we perpetuate cycles that continue environmental degradation and lead to desperate and short-sighted policies that favor short-term gains and intensification practices over longer-term, sustainable solutions. Moreover, the condition of poverty itself leads directly to much of the environmental degradation that we witness throughout the food system.
Most of the world’s extreme poor are farmers or agricultural workers. Poverty is a pernicious state. Not only is it the primary cause of food insecurity and malnourishment globally, as already highlighted, but it is also one of the main drivers of the low yields and unsustainable agricultural practices that are leading to widespread land degradation in the more impoverished regions of the world.
Farmers without access to sufficient resources are unable to improve upon their agricultural production techniques (Tittonell & Giller, 2013). As soil gets increasingly nutrient-depleted and eroded, it becomes ever more unresponsive and challenging to rehabilitate for use. Eventually, this condition necessitates either the shift towards other agricultural land, or the need for greater dietary supplementation through imported food. Increasing reliance on imported food can further impoverish people, expose them to global price shocks, and further reduce investment in local capacity and infrastructure.
As discussed more extensively in Chapter 4, these kinds of patterns result in further reinforcing cycles on the level of local governance. Wishing to serve the needs of their impoverished populations, many governments are incentivised to implement permissive policies for the exploitation of natural resources, or encourage the development of lands for the production of cash crops for export, at the expense of local food security.
Poverty, thus, can be found at the origins of many of the food system’s most pervasive problems, including land degradation and the associated results of arable land expansion and agricultural land shifting. Being in an impoverished state casts a lens of desperation on one’s perception of the world, and necessitates a focus on short-term survival. In it, no resources are allocated for investing in longer-term objectives, resource maintenance, or ephemeral values.
The world’s poorest individuals have been described as being cut off from participation in the global economy for various contextual reasons, including physical isolation, lack of access to infrastructure, social or ethnic exclusion, lack of access to societal safety nets, or inability to make full use of labour capacity or acquire skills. A disproportionate number of people falling into this category globally are women and indigenous people. Though many proximate causes may exist, Gatzweiler et al have identified marginalization as one of the primary root causes of extreme poverty.
Marginality, is defined as “ an involuntary position and condition of an individual or a group at the margins of social, political, economic, ecological, and biophysical systems, preventing them from access to resources, assets, services, restraining freedom of choice, preventing the development of capabilities” (Gatzweiler, Baumüller, Ladenburger, & Braun, 2011). As defined here, marginalization has a strong correlation with food insecurity, with the greatest numbers of marginalized poor are in Sub-Saharan Africa and South Asia.
Some of the primary strategies for achieving a sustainable, global food system will need to strongly centre around tackling this core challenge. Systemic structures that perpetuate poverty need to be dismantled.
Sustainable solutions may often be less reliant on technology or on products, but rather more on knowledge and capacity building. They may not always tend towards the highest efficiency or highest yield, but rather reach a Pareto optimum of satisfying numerous societal and ecological needs; ones that are holistically essential for the system to continue existing and improving. As such, these types of solutions are not necessarily equally attractive to private interests as more straightforward technological fixes or rigid policy prescriptions (De Schutter, 2008).
THE GLOBAL FOOD SYSTEM: AN ANALYSIS 157
05 OUTLOOKA dried fruit vendor in KazakhstanCreative Commons: Asian Development Bank, 2015

158
BIBLIOGRAPHYActon, A. (2011). Issues in Food Production, Processing, and Preparation: 2011 Edition.
Aiking, H. (2011). Future protein supply. Trends in Food Science and Technology, 22(2-3), 112–120. http://doi.org/10.1016/j.tifs.2010.04.005
Alderman, H. (2011). No small matter: the impact of poverty, shocks, and human capital investments in early childhood development. Human development perspectives. http://doi.org/10.1596/978-0-8213-8677-4
Alexandratos, N., & Bruinsma, J. (2012). WORLD AGRICULTURE TOWARDS 2030 / 2050 The 2012 Revision. ESA Working Paper, (12).
Allison, H. E., & Hobbs, R. J. (2004). Resilience, adaptive capacity, and the “lock-in trap” of the Western Australian agricultural region. Ecology and Society, 9(1). http://doi.org/3
Allouche, J. (2011). The sustainability and resilience of global water and food systems: Political analysis of the interplay between security, resource scarcity, political systems and global trade. Food Policy, 36(SUPPL. 1). http://doi.org/10.1016/j.foodpol.2010.11.013
Animal Welfare Institute. (2015). Fish Farming. Retrieved September 4, 2015, from https://awionline.org/content/fish-farming
Aquastat. (2014). Water Withdrawal by Sector. Retrieved September 3, 2015, from http://www.fao.org/nr/aquastat
AQUASTAT. (2014). Water withdrawal by sector , 2007. Rome.
Araus, J. L., Slafer, G. a., Reynolds, M. P., & Royo, C. (2002). Plant breeding and drought in C3 cereals: What should we breed for? Annals of Botany, 89(SPEC. ISS.), 925–940. http://doi.org/10.1093/aob/mcf049
Arei-Usda. (1996). Agricultural Resources and Environmental Indicators, 1996-97. Agricultural Handbook No. 712., (712).
Arthur, C., Sutton-Grier, A. E., Murphy, P., & Bamford, H. (2014). Out of sight but not out of mind: Harmful effects of derelict traps in selected U.S. coastal waters. Marine Pollution Bulletin, 86(1-2), 19–28. http://doi.org/10.1016/j.marpolbul.2014.06.050
Atapattu, S. S., & Kodituwakku, D. C. (2009). Agriculture in South Asia and its implications on downstream health and sustainability: A review. Agricultural Water Management, 96(3), 361–373. http://doi.org/10.1016/j.agwat.2008.09.028
Auble, D. (2013). Lobbyists 2012: Out of the Game or Under the Radar? Washington, DC. Retrieved from https://www.opensecrets.org/news/2013/03/lobbyists-2012-out-of-the-game-or-u/
Baccini, A., Goetz, S. J., Walker, W. S., Laporte, N. T., Sun, M., Sulla-Menashe, D., … Houghton, R. A. (2012). Estimated carbon dioxide emissions from tropical deforestation improved by carbon-density maps. Nature Climate Change, 2(3), 182–185. http://doi.org/10.1038/nclimate1354
Badgley, C., & Perfecto, I. (2007). Can organic agriculture feed the world? Renewable Agriculture and Food Systems. http://doi.org/10.1017/S1742170507001871
Baier, A. (2005). Organic Certification Process. Review Literature And Arts Of The Americas.
Baines, J. (2014). Food Price Inflation as Redistribution: Towards a New Analysis of Corporate Power in the World Food System. New Political Economy, 19(1), 79–112. http://doi.org/10.1080/13563467.2013.768611
Balcom, P. (2015). Irrigation and Aquaponics — Technologies to Improve the Quality of Life in Developing Nations. Wise Journal of Public Policy. Retrieved from http://www.wise-intern.org/journal/2015/documents/IrrigationandAquaponicsFinalDraft_000.pdf
Bastos Lima, M. G., & Gupta, J. (2014). The extraterritorial dimensions of biofuel policies and the politics of scale: live and let die? Third World Quarterly, 35(3), 392–410. http://doi.org/10.1080/01436597.2014.893484
Batello, C., Wade, L., Cox, S., Pogna, N., Bozzini, A., & Choptiany, J. (2013). Perennial Crops for Food Security: Proceedings of the FAO Expert Workshop. FAO.
Beintema, N., Gert-Jan, S., Keith, F., & Paul, H. (2012). Asti Global Assessment of Agriculture R&D Spending, (October). Retrieved from http://www.asti.cgiar.org/pdf/ASTI_global_assessment.pdf
Beintema, N. M., & Stads, G.-J. (2008). Measuring agricultural research investments. A revised global picture. ASTI Background Note, (October).
Beitl, C. M. (2015). Mobility in the mangroves: Catch rates, daily decisions, and dynamics of artisanal fishing in a coastal commons. Applied Geography, (JANUARY). http://doi.org/10.1016/j.apgeog.2014.12.008
Benbrook, C. M. (2012). Impacts of genetically engineered crops on pesticide use in the U.S. – the first sixteen years. Environmental Sciences Europe, 24(24).
Bergqvist, J., & Gunnarsson, S. (2011). Finfish Aquaculture: Animal Welfare, the Environment, and Ethical Implications. Journal of Agricultural and Environmental Ethics, 26(1), 75–99. http://doi.org/10.1007/s10806-011-9346-y
Beshah, B., Kitaw, D., & Dejene, T. (2015, February 5). Quality and value chain analyses of Ethiopian coffee. Journal of Agriculture and Social Research (JASR). Agricultural Volunteers of Nigeria (AgVON). http://doi.org/10.4314/jasr.v13i2.
Biggs, R., Carpenter, S. R., & Brock, W. a. (2009). Turning back from the brink: detecting an impending regime shift in time to avert it. Proceedings of the National Academy of Sciences of the United States of America, 106(3), 826–831. http://doi.org/10.1073/pnas.0811729106
Bilkovic, D. M., Havens, K., Stanhope, D., & Angstadt, K. (2014). Derelict fishing gear in Chesapeake Bay, Virginia: Spatial patterns and implications for marine fauna. Marine Pollution Bulletin, 80(1-2), 114–123. http://doi.org/10.1016/j.marpolbul.2014.01.034
Birovljev, J., & Ćetković, B. (2013). The impact of the WTO Agreement on Agriculture. EAAE Seminar Challenges for the Global Agricultural Trade Regime after Doha, 135.
Black, R. (2003). Micronutrient deficiency: an underlying cause of morbidity and mortality. Bulletin of the World Health Organization, 81(2).
Blanco-Canqui, H. (2008). Principles of Soil Conservation and Management. http://doi.org/10.2136/vzj2009.0110br
Blidariu, F., & Grozea, A. (2011). Increasing the Economical Efficiency and Sustainability of Indoor Fish Farming by Means of Aquaponics. Scientific Papers Animal Science and Biotechnologies, 44(2), 1–8.
Blidariu, F., & Grozea, A. (2011). Increasing the economical efficiency and sustainability of indoor fish farming by means of aquaponics. Animal Science and Biotechnologies, 44(2), 1–8.

THE GLOBAL FOOD SYSTEM: AN ANALYSIS 159
BIBLIOGRAPHY
Bloomberg. (2014). Bloomberg Industry Market Leaders. Retrieved August 9, 2015, from http://www.bloomberg.com/visual-data/industries/detail/food-retailers
Bournay, E., Heberlein, C., Bovet, P., Rekacewicz, P., Rizzolio, D., Marin, C., & Dawe, N. (2006). Vital waste graphics 2, 2–45. Retrieved from http://books.google.com/books?hl=en&lr=&id=-wtyN1YCI3kC&oi=fnd&pg=PA7&dq=Vital+waste+graphics+2&ots=6bqmaz_h2R&sig=c6LmdtAgmAg8eEfbNFQQlde-Djg
Boyd, C. E., Tucker, C., Mcnevin, A., Bostick, K., & Clay, J. (2007). Indicators of Resource Use Efficiency and Environmental Performance in Fish and Crustacean Aquaculture. Reviews in Fisheries Science (Vol. 15). http://doi.org/10.1080/10641260701624177
Boye, J., & Arcand, Y. (2012). Green Technologies in Food Production and Processing (Google eBook). http://doi.org/10.1007/978-1-4614-1587-9
Brack, D., & Buckrell, J. (2010). Controlling Illegal Logging: Consumer-Country Measures. Chatham House Briefing Paper.
Brainard, L. (2001). Trade Policy in the 1990s. Washington, DC.
Bramley, E. (2014). World Bank and Aid Doners Accused of Enabling Land Grabs. The Guardian.
Bringezu, S., Schutz, H., Pengue, W., O’Brien, M., Garcia, F., Sims, R., … Herrick, J. (2014). Assessing Global Land Use: Balancing Consummption with sustainable supply. UNEP.
Broom, D. M., Galindo, F. a, & Murgueitio, E. (2013). Sustainable, efficient livestock production with high biodiversity and good welfare for animals. Proceedings. Biological Sciences / The Royal Society, 280(1771), 20132025. http://doi.org/10.1098/rspb.2013.2025
Brown, D. (2000). The “recipe for disaster” that killed 80 and left a 5 billion pound bill. The Telegraph. Retrieved from http://www.telegraph.co.uk/news/uknews/1371964/The-recipe-for-disaster-that-killed-80-and-left-a-5bn-bill.html
Budge, G. E., Garthwaite, D., Crowe, A., Boatman, N. D., Delaplane, K. S., Brown, M. A., … Pietravalle, S. (2015). Evidence for pollinator cost and farming benefits of neonicotinoid seed coatings on oilseed rape. Scientific Reports, 5, 12574. http://doi.org/10.1038/srep12574
Bullied, W. J., Marginet, A. M., & Acker, R. C. Van. (2010). Conventional- and conservation-tillage systems influence emergence periodicity of annual weed species in canola. Weed Science, 51(6), 886–897. http://doi.org/10.1614/P2002-117
Cabel, J. F., & Oelofse, M. (2012). An indicator framework for assessing agroecosystem resilience. Ecology and Society, 17(1). http://doi.org/10.5751/ES-04666-170118
Caldwell, B., Sideman, E., Seaman, A., Shelton, A., & Smart, C. (2013). Resource Guide for Organic Insect and Disease Mangement. Cornell University/NYSAES\n.
Campanhola, C. (2013). Policy support guidelines for the promotion of sustainable production intensification and ecosystem services. Integrated crop management (Vol. 19).
Campbell, H. (2009). Breaking new ground in food regime theory: Corporate environmentalism, ecological feedbacks and the “food from somewhere” regime? Agriculture and Human Values, 26(4), 309–319. http://doi.org/10.1007/s10460-009-9215-8
Canning, P., Charles, A., Huang, S., Polenske, K. R., & Waters, A. (2010). Energy Use in the U. S. Food System, (94), 1–39.
Cantliffe, D. J., & Vansickle, J. J. (2009). Competitiveness of the Spanish and Dutch Greenhouse Industries With the Florida Fresh Vegetable Industry. University of Florida, IFAS Extension, HS918, 1–10.
Cao, J., Yeh, E. T., Holden, N. M., Yang, Y., & Du, G. (2013). The effects of enclosures and land-use contracts on rangeland degradation on the Qinghai-Tibetan plateau. Journal of Arid Environments, 97(OCTOBER), 3–8. http://doi.org/10.1016/j.jaridenv.2013.05.002
Cardenas, J., Janssen, M., & Bousquet, F. (1994). “Dynamics of Rules and Resources: Three New Field Experiments on Water, Forests and Fisheries.” Handbook on Experimental Economics and the Environment, 1–27.
Carlisle, L., & Miles, A. (2013). Closing the knowledge gap: How the USDA could tap the potential of biologically diversified farming systems. Journal of Agriculture, Food Systems, and Community Development, 3(4), 219–225. Retrieved from http://www.agdevjournal.com/attachments/article/380/JAFSCD_Closing_Knowledge_Gap_Commentary_Sept-2013.pdf
Carmody, R. N., Weintraub, G. S., & Wrangham, R. W. (2012). Reply to Wollstonecroft et al.: Cooking increases the bioavailability of starch from diverse plant sources. Proceedings of the National Academy of Sciences, 109(17), E992–E992. http://doi.org/10.1073/pnas.1202327109
Carter, M. R. (1994). Conservation tillage in temperate agroecosystems. Lewis Publishers Inc.
Carter, M. R., & Barrett, C. B. (2006). The economics of poverty traps and persistent poverty: An asset-based approach. Journal of Development Studies, 42(2), 178–199. http://doi.org/10.1080/00220380500405261
Cassidy, E. S., West, P. C., Gerber, J. S., & Foley, J. a. (2013). Redefining agricultural yields: from tonnes to people nourished per hectare. Environmental Research Letters, 8, 034015. http://doi.org/10.1088/1748-9326/8/3/034015
Center for Disease control and Prevention. (2013). Foodborne Diseases Active Surveillance Network. Retrieved from http://www.cdc.gov/foodnet/data/trends/tables/2013/table2a-b.html#table-2b
Center for Disease Control and Prevention. (2013). Incidence and Trends of Infection with Pathogens Transmitted Commonly Through Food — Foodborne Diseases Active Surveillance Network, 10 U.S. Sites. Retrieved from http://www.cdc.gov/mmwr/preview/mmwrhtml/mm6315a3.htm?s_cid=mm6315a3_w
Chalabi, M., & Burn-Murdoch, J. (2013). McDonald’s 34,492 Restaurants: Where are They? The Guardian. Retrieved from http://www.theguardian.com/news/datablog/2013/jul/17/mcdonalds-restaurants-where-are-they
Challinor, A., Elliott, J., Kent, C., Lewis, K., & Wuebbles, D. (2015). Climate and global crop production shocks. Global Food Security Resilience Taskforce. Retrieved from http://www.foodsecurity.ac.uk/assets/pdfs/climate-and-global-crop-production-shocks.pdf
Chantavanich, S., Laodumrongchai, S., Harkins, B., Jitpong, W., Yothinneeranath, P., Tunon, M., & Olsen, A. (2013). Employment Practices and Working Conditions in thialnds Fishing Industry.
Chappell, M. J., & LaValle, L. a. (2011). Food security and biodiversity: Can we have both? An agroecological analysis. Agriculture and Human Values, 28(1), 3–26. http://doi.org/10.1007/s10460-009-9251-4
Chhetri, N. B., Easterling, W. E., Terando, A., & Mearns, L. (2010). Modeling Path Dependence in Agricultural Adaptation to Climate Variability and Change. Annals of the Association of American Geographers, 100(4), 894–907. http://doi.org/10.1080/00045608.2010.500547
Chivenge, P. P., Murwira, H. K., Giller, K. E., Mapfumo, P., & Six, J. (2007). Long-term impact of reduced tillage and residue management on soil carbon stabilization: Implications for conservation agriculture on contrasting soils. Soil and Tillage Research, 94(2), 328–337. http://doi.org/10.1016/j.still.2006.08.006
160
Chuenpagdee, R., Morgan, L. E., Maxwell, S. M., Norse, E. A., & Pauly, D. (2003). Shifting Gears: assessing collateral impacts of fishing methods in US waters. Frontiers in Ecology and the Environment, 10, 517–524.
Clabby, C. (2010). Does Peak Phosphorus Loom? Retrieved September 7, 2015, from http://www.americanscientist.org/issues/pub/does-peak-phosphorus-loom
Clark, K., & Summers, L. (1982). The Dynamics of Youth Unemployment. Retrieved September 1, 2015, from http://www.nber.org/chapters/c7875.pdf
Connor, D. J. (2008). Organic agriculture cannot feed the world. Field Crops Research, 106(2), 187–190. http://doi.org/10.1016/j.fcr.2007.11.010
Consumers International. (2012). The relationship between supermarkets and suppliers : What are the implications for consumers ?
Convention on Biological Diversity. (2015). Programmes: Agricultural Biodiversity. What’s the Problem? Retrieved September 4, 2015, from https://www.cbd.int/agro/whatstheproblem.shtml
Copa-Cogeca. (2011). Copa-Cogeca’s position on the EU’s biofuels policy.
Cordell, D., & White, S. (2011). Peak phosphorus: Clarifying the key issues of a vigorous debate about long-term phosphorus security. Sustainability, 3(10), 2027–2049. http://doi.org/10.3390/su3102027
Cotula, L., Vermeulen, S., Keeley, J., & Leonard, R. (2009). Land Grab or Development Oportunity? Agricultural Investment and International Land Deals in Africa. London/Rome. Retrieved from http://www.fao.org/docrep/011/ak241e/ak241e00.htm
Cowan, R., & Gunby, P. (1996). Sprayed to death: path dependence, lock-in and pest control strategies. The Economic Journal, 106(436), 521–542. http://doi.org/10.2307/2235561
Cox, T. S., Glover, J. D., van Tassel, D. L., Cox, C. M., & De Haan, L. R. (2006). Prospects for Developing Perennial Grain Crops. BioScience, 56(8), 649. http://doi.org/10.1641/0006-3568(2006)56[649:PFDPGC]2.0.CO;2
Culver, L., Mauch, C., & Ritson, K. (2012). Rachel Carson’s Silent Spring - Encounters and Legacies, 7, 1–70.
Dallemand, J., Pascua, I. P., Motola, V., Banja, M., Scarlat, N., Medarac, H., … Monforti-ferrario, F. (2015). Energy use in the EU food sector : State of play and opportunities for improvement. http://doi.org/10.2790/158316
Datar, I., & Betti, M. (2010). Possibilities for an in vitro meat production system. Innovative Food Science & Emerging Technologies, 11(1), 13–22. http://doi.org/10.1016/j.ifset.2009.10.007
Dayton, P. K., Thrush, S. F., Agardy, M. T., & Hofman, R. J. (1995). Environmental effects of marine fishing. Aquatic Conservation: Marine and Freshwater Ecosystems, 5(March), 205–232. http://doi.org/10.1002/aqc.3270050305
de Benoist, B., Andersson, M., Egli, I., Takkouche, B., & Allen, H. (2004). Iodine status worldwide. WHO Global Database on Iodine Deficiency. Geneca: World Health Organization.
de Coning, E. (2013). Caught at Sea: Forced labour and Trafficking.
De Ponti, T., Rijk, B., & Van Ittersum, M. K. (2012). The crop yield gap between organic and conventional agriculture. Agricultural Systems, 108, 1–9. http://doi.org/10.1016/j.agsy.2011.12.004
De Schutter, O. (2008). Building resilience: a human rights framework for world food and nutrition security. Promotion and Protection of All Human Rights, Civil, Political, Economic, Social and Cultural Rights, Including the Right to Development., 15508, A/HRC/9/23. Retrieved from http://www2.ohchr.org/english/issues/food/ docs/A.HRC.9.23.pdf
de Schutter, O. (2009). International Trade in Agriculture and the Right to Food.
de Schutter, O. (2010). Report submitted by the Special Rapporteur on the right to food. Development, (December), 21. http://doi.org/A/HRC/16/49
Deloitte Touche Tohmatsu Limited. (2014). Global Powers of Retailing 2014: Retail Beyond begins. London. Retrieved from http://www.deloitte.com/assets/Dcom-Chile/Local Assets/Documents/Nuevos/Estudios/CB_GlobalPowersofRetailing2014.pdf
Derpsch, R., Friedrich, T., Kassam, A., & Hongwen, L. (2010). Current status of adoption of no-till farming in the world and some of its main benefits. International Journal of Agricultural and Biological Engineering, 3(1), 1–25. http://doi.org/10.3965/j.issn.1934-6344.2010.01.001-025
DESA-UN. (1995). World Summit for Social Development Copenhagen 1995. Retrieved September 1, 2015, from http://social.un.org/index/Home/WSSD1995.aspx
DESA-UN. (2010). Rethinking Poverty: Report on the World Social Situation 2010. Retrieved September 1, 2015, from http://books.google.com/books?hl=en&lr=&id=xCx4L2OWmssC&oi=fnd&pg=PA1&dq=Rethinking+Poverty:+Report+on+the+World+Social+Situation+2010&ots=wr09DuAD8F&sig=b6W-3azmzZJE5OcL_SFKsi_l_cY
Dixon, J., Gulliver, A., Gibbon, D., & Kassam, a. H. (2001). Farming Systems and Poverty: Improving Farmers’ Livelihoods in a Changing World. Experimental Agriculture (Vol. 39). Retrieved from ftp://ftp.fao.org/docrep/fao/003/y1860e/y1860e00.pdf\nftp://ftp.fao.org/docrep/fao/003/Y1860E/Y1860E00.PDF\nhttp://www.journals.cambridge.org/abstract_S0014479702211059
Doak, C. M., Adair, L. S., Bentley, M., Monteiro, C., & Popkin, B. M. (2005). The dual burden household and the nutrition transition paradox. International journal of obesity. International Journal of Obesity, 29(1), 129–136.
Dolan, C., & Sorby, K. (2003). Gender and Employment in High-value Agriculture and Rural Industries. Agriculture and Rural Development Working Paper, Series No. 7.
Donal, P. F., Gree, R. E., & Heath, M. F. (2001). Agricultural intensification and the collapse of Europe’s farmland bird populations. Proceedings. Biological Sciences / The Royal Society, 268(1462), 25–9. http://doi.org/10.1098/rspb.2000.1325
Duit, A. (2008). The Ecological State : Cross-National Patterns of Environmental Governance Regimes. Governance An International Journal Of Policy And Administration. Retrieved from http://www.ecologic.de/projekte/epigov/
Duraiappah, A. (1996). Poverty and Environmental Degradation: A literature review and analysis. CREED Working Paper Series No 8, (8), 35. Retrieved from http://pubs.iied.org/pdfs/8127IIED.pdf
Easterbrook, G. (1997). Forgotten Benefactor of Humanity. The Atlantic Monthly, 279(1), 75–82. Retrieved from http://www.theatlantic.com/past/issues/97jan/borlaug/borlaug.htm
EFSA. (2014). The European Union summary report on trends and sources of zoonoses, zoonotic agents, and food-borne outbreaks in 2010. European Food Safety Authority Journal, 12(2). Retrieved from http://www.efsa.europa.eu/en/efsajournal/pub/3547.htm
EISA. (2012). A European Definition and Characterisation of Integrated Farming (IF) as Guideline for Sustainable Development of Agriculture. European Initiative for Sustainable Development in Agriculture, (February), 1–108. Retrieved from http://www.sustainable-agriculture.org/stuff/EISA_Framework_english_new_wheel_170212.pdf
EPA. (2009). National Water Quality Inventory : Report to Congress 2004 Reporting Cycle. Water, (January), 43. http://doi.org/http://www.epa.gov/owow/305b/2004report/
Europe Innova. (n.d.). Assessment of the Bio-based Products Market Potential for Innovation. European Commission Enterprise and Industry. Retrieved from http://www.biochem-project.eu/download/toolbox/innovation/06/Bio-Based Market potential.pdf

THE GLOBAL FOOD SYSTEM: AN ANALYSIS 161
BIBLIOGRAPHY
European Commission. (1999). Health and Consumer Protection - Growth Hormones in Meat Pose Risk to Consumers - Different Levels of Evidence. Retrieved September 4, 2015, from http://ec.europa.eu/dgs/health_consumer/library/press/press24_en.html
Eurostat. (2000). Plant protection in the EU - Consumption of Plant Protection Products in the European Union. Luxembourg: Office for Official Publications of the European Communities. Retrieved from http://ec.europa.eu/eurostat/documents/3217494/5626735/K S - 3 4 - 0 0 - 3 0 2 - 3 A - E N . P D F/ d e 9 6 e c 4 9 - f 4 8 6 - 4 b d e - b b d 8 -95c6ddb74cee?version=1.0
Eurostat. (2015). Eurostat: Your Key to European Statistics. Retrieved September 17, 2015, from http://ec.europa.eu/eurostat/web/energy/data/shares
Fairlie, S. (2010). Meat: A Benign Extravagance. Chelsea Green Publishing. Retrieved from https://books.google.com/books?id=iid8mTmXZZIC&pgis=1
FAO. (1990). Roots, tubers, plantains and bananas in human nutrition. Food and Agriculture Organization of the United Nations. Retrieved from http://www.fao.org/docrep/t0207e/t0207e07.htm
FAO. (1996). World Food Summit: Rome Declaration on World Food Security and World Food Summit Plan of Action. World Food Summit, 1–32.
Fao. (2006). Spotlight: Livestock impacts on the environment. Retrieved August 9, 2015, from http://www.fao.org/ag/magazine/0612sp1.htm
FAO. (2007). FertiStat - Fertilizer use by crop statistics. Retrieved from http://www.fao.org/ag/agp/fertistat/
FAO. (2008). Poultry welfare in developing countries. Retrieved September 4, 2015, from http://www.fao.org/docrep/013/al720e/al720e00.pdf
FAO. (2009). Global Agriculture Towards 2050: The Challenge. High Level Expert Forum-How to Feed the World 2050, 1–4. Retrieved from http://www.fao.org/fileadmin/templates/wsfs/docs/Issues_papers/HLEF2050_Global_Agriculture.pdf
FAO. (2010). The State of Food Insecurity in the World.
Fao. (2011). Biodiversity for Food and Agriculture: Contributing to food security and sustainability in a changing world.
FAO. (2011). The State of the World’s land and water resources for Food and Agriculture, Managing systems at risk. http://doi.org/978-1-84971-326-9
FAO. (2012a). Coping with water scarcity An action framework for agriculture and food security. http://doi.org/http://www.fao. org/docrep/016/i3015e/i3015e.pdf
FAO. (2012b). Energy-Smart Food at FAO: An Overview, 71.
FAO. (2012c). Regional Trade Agreements and Food Security in Asia. Bangkok. Retrieved from http://www.fao.org/docrep/018/i3026e/i3026e.pdf
FAO. (2012). the State of World Fisheries and Aquaculture 2012. Aquaculture.
FAO. (2013a). Edible insects. Future prospects for food and feed security. Food and Agriculture Organization of the United Nations (Vol. 171).
FAO. (2013b). FAO Statistical Yearbook 2013.
FAO. (2013c). FAO Statistical Yearbook 2013 - Part 1 The Setting. Rome.
Fao. (2013). The state of food and agriculture, 2013. Lancet (Vol. 2). http://doi.org/ISBN: 978-92-5-107671-2 I
FAO. (2014a). The state of food and agriculture in brief: Innovation in Family Farming.
FAO. (2014b). The State of the World Fisheries and Aquaculture.
FAO. (2015a). AQUASTAT - FAO’s Information System on Water and Agriculture. Retrieved September 30, 2015, from http://www.fao.org/nr/water/aquastat/didyouknow/index2.stm
FAO. (2015b). FAOSTAT. Retrieved August 12, 2015, from http://faostat3.fao.org/home/E
FAO. (2015c). Statistics: Food security Indicators. Retrieved from http://www.fao.org/economic/ess/ess-fs/ess-fadata/en/#.VYqwa_mqpBc
FAO, IFAD, & WFP. (2015). The State of Food Insecurity in the World 2015. Meeting the 2015 international hunger targets: taking stock of uneven progress. Rome, FAO.
FAO, & ILO. (2011). Fao-Ilo Guidelines for Addressing Child Labour in Fisheries and Aquaculture : Policy and Practice. Retrieved from ftp://ftp.fao.org/fi/DOCUMENT/child_labour_FAO-ILO/child_labour_FAO-ILO.pdf
FAO Investment Center. (2014). Review of animal welfare legislation in the beef, pork, and poultry industries. Retrieved September 4, 2015, from http://www.fao.org/3/a-i4002e.pdf
FAO Term Portal. (n.d.). Definition of Fishery. Retrieved January 8, 2016, from http://www.fao.org/faoterm/en/?defaultCollId=21
Fast growth of bio-based polymers: Production capacity will triple from 5.1 million tonnes in 2013 to 17 million tonnes in 2020, representing a 2% share of polymer production in 2013 and 4% in 2020 - Bio-based News - The portal for bio-based economy and i. (2015). Retrieved August 16, 2015, from http://news.bio-based.eu/fast-growth-of-based-polymers-production/
Feeny, D., Berkes, F., McCay, B. J., & Acheson, J. M. (1990). The Tragedy of the Commons: Twenty-two years later. Human Ecology, 18(1), 1–19. http://doi.org/10.1007/BF00889070
Feldman, P. (2011). Food Processing Machinery - Market Assessment. Reston. Retrieved from http://www.pmmi.org/files/Research/ExecutiveSummaries/FoodProcessingExecSummary.pdf
Fernandez-Cornejo, J., Hallahan, C., Nehring, R., Wechsler, S., & Grube, A. (2013). ISB NEWS REPORT Conservation Tillage , Herbicide Use , and Genetically Engineered, (April). Retrieved from http://www.isb.vt.edu/news/2013/Apr/Conservation-Tillage.pdf
Fields, S. (2004). Global Nitrogen: Cycling out of Control. Environmental Health Perspectives, 112(10), 556–563. Retrieved from www.ncbi.nlm.nih.gov/pmc/articles/PMC1247398/
Finucane, M. L., & Holup, J. L. (2005). Psychosocial and cultural factors affecting the perceived risk of genetically modified food: An overview of the literature. Social Science and Medicine, 60(7), 1603–1612. http://doi.org/10.1016/j.socscimed.2004.08.007
Fischer, G., Nachtergaele, F., Prieler, S., van Velthuizen, H. T., Verelst, L., & Wiberg, D. (2008). Global Agro-ecological Zones Assessment for Agriculture (GAEZ 2008). IIAS, Laxenburg(Austria and FAO), Rome, Italy.
Fitzgerald-Moore, P., & Parai, B. J. (1996). The Green Revolution. University of Calgary. Calgary. Retrieved from http://people.ucalgary.ca/~pfitzger/green.pdf
Fleischman, F., Garcia-Lopez, G., Loken, B., & Villamayor-Tomas, S. (2013). Evaluating the utility of Common-pool resource theories for understanding large scale patterns of deforestation in Indonesia between 1965 and 2012. International Journal of the Commons, 8(2), 304–336.
162
Folke, C., Carpenter, S., Walker, B., Scheffer, M., Elmqvist, T., Gunderson, L., & Holling, C. S. (2004). Regime Shifts, Resilience, and Biodiversity in Ecosystem Management. Annual Review of Ecology, Evolution, and Systematics, 35(1), 557–581. http://doi.org/10.1146/annurev.ecolsys.35.021103.105711
Food & Water Watch. (2013). Grocery Goliaths: How Food Monopolies Impact Consumers. Washington, DC. Retrieved from http://documents.foodandwaterwatch.org/doc/grocery_goliaths_no_appnd.pdf
Food and Agriculture Organization (FAO). (2001). Fishing with Traps and Pots, 1–62.
Food and Drink Europe. (2015). Data & Trends: European Food and Drink Industry 2014-2015. Retrieved from http://www.fooddrinkeurope.eu/uploads/publications_documents/Data_and_Trends_2014-20151.pdf
Food Safety News. (2014). Four-State, 11-Person E.coli Outbreak Prompts 1.8 Million Pound Meat Recall: Cases Reported in Massachusetts, Michigan, Missouri and Ohio. Retrieved from http://www.foodsafetynews.com/2014/05/4-state-11-person-e-coli-outbreak-prompts-1-8m-pound-meat-recall/#.VUfhAyGqqkp
Forum for the Future. (2014). The Protein Challenge 2040, (September).
Frankinet, M., Roisin, C., Baumer, K., & Ehlers, W. (1989). Regional Experiences with reduced tillage in Belgium. Agriculture Energy Saving by Reduced Soil Tillage.
Fuller, R. J., Norton, L. R., Feber, R. E., Johnson, P. J., Chamberlain, D. E., Joys, a C., … Firbank, L. G. (2005). Benefits of organic farming to biodiversity vary among taxa. Biology Letters, 1(4), 431–434. http://doi.org/10.1098/rsbl.2005.0357
Galappaththi, E. K. (2015). Drama of the commons in small-scale shrimp aquaculture in northwestern Sri Lanka, 9(1), 347–368.
Gan, J., Cashore, B., & Stone, M. W. (2013). Impacts of the Lacey Act Amendment and the Voluntary Partnership Agreements on illegal logging: implications for global forest governance. Journal of Natural Resources Policy Research, 5(4), 209–226. http://doi.org/10.1080/19390459.2013.832479
Gantzer, C. J., Anderson, S. H., Thompson, a. L., & Brown, J. R. (1990a). Estimating soil erosion after 100 years of cropping on Sanborn Field. Journal of Soil and Water Conservation, 45(6), 641–644. Retrieved from http://www.jswconline.org/content/45/6/641.abstract
Gantzer, C. J., Anderson, S. H., Thompson, A. L., & Brown, J. R. (1990b). Estimating soil erosion after 100 years of cropping on Sanborn Field. Journal of Soil and Water Conservation, 45(6), 641–644. Retrieved from http://www.jswconline.org/content/45/6/641.short
Garthe, J. W., & Kowal, P. D. (2004). Managing Used Plastic Mulch Film: Degradable Versus Non-Degradable. College of Agricultural Sciences Agricultural and Biological Engineering, (814), 1–4.
Gassert, F. (2013). One-Quarter of World’s Agriculture Grows in Highly Water-Stressed Areas. Retrieved from http://www.wri.org/blog/2013/10/one-quarter-world%E2%80%99s-agriculture-grows-highly-water-stressed-areas
Gatzweiler, F. W., Baumüller, H., Ladenburger, C., & Braun, J. Von. (2011). Marginality: Addressing the Root Causes of Extreme Poverty. ZEF Working Paper Series, Center for Development Research, University of Bonn.
Geiling, N. (2015). Canada’s Largest Food Retailer to Sell Ugly Produce | ThinkProgress. Retrieved September 4, 2015, from http://thinkprogress.org/climate/2015/03/17/3634553/canada-sells-ugly-produce/
Gerbens-Leenes, P. W., Nonhebel, S., & Krol, M. S. (2010). Food consumption patterns and economic growth. Increasing affluence and the use of natural resources. Appetite, 55(3), 597–608. http://doi.org/10.1016/j.appet.2010.09.013
Gilbert, N. (2013). Case studies: A hard look at GM crops. Nature, 497(7447), 24–6. http://doi.org/10.1038/497024a
Giovannucci, D., Scherr, S., Nierenberg, D., Hebebrand, C., Shapiro, J., Milder, J., & Wheeler, K. (2012). Food and Agriculture: The future of sustanability. New York. Retrieved from http://www.un.org/esa/dsd/dsd_sd21st/21_pdf/agriculture_and_food_the_future_of_sustainability_web.pdf
Gliessman, S. (1985). Multiple Cropping Systems: A Basis for Developing an Alternative Agriculture. Innovative Technologies for Lesser Developed Countries, 69–86. Retrieved from http://www.princeton.edu/~ota/disk2/1985/8512/851207.PDF
GMO Compass. (2014). Global GM Planting 2013. Retrieved August 13, 2015, from http://www.gmo-compass.org/eng/agri_biotechnology/gmo_planting/257.global_gm_planting_2013.html
Gołaszewski, J., de Visser, C., Brodziński, Z., Myhan, R., Olba-Zięty, E., Stolarski, M., … Papadakis, G. (2012). agrEE: State of the Art on Energy Efficiency in Agriculture: Country data on energy consumption in different agro-production sectors in the European countries.
Good, A. G., & Beatty, P. H. (2011). Fertilizing nature: A tragedy of excess in the commons. PLoS Biology, 9(8), 1–9. http://doi.org/10.1371/journal.pbio.1001124
Goodman, D. (2000). Organic and conventional agriculture : Materializing discourse and agro-ecological managerialism. Agriculture and Human Values, 17, 215–219. http://doi.org/10.1023/A:1007650924982
Grace Communications Foundation. (2015). Sustainable Table | Antibiotics. Retrieved September 4, 2015, from http://www.sustainabletable.org/257/antibiotics
Graham, J. C., Jensen, G., Malagie, M., & Smith, D. L. (2011). Food Industry Processes. In International Labour Organization’s Encyclopaedia of Occupational Health and Safety. Retrieved from http://www.iloencyclopaedia.org/part-x-96841/food-industry/overview-and-health-effects/112-overview-and-health-effects/food-industry-processes
Green, R. E., Cornell, S. J., Scharlemann, J. P. W., & Balmford, A. (2005). Farming and the fate of wild nature. Science (New York, N.Y.), 307(5709), 550–5. http://doi.org/10.1126/science.1106049
Grethe, H., Dembélé, A., & Duman, N. (2011). How to feed the World´s growing Billions, (64).
GrowingBlue. (2015). What is the Future of Water? | Water in the Future | Water in 2050. Retrieved September 4, 2015, from http://growingblue.com/water-in-2050/
Gustavsson, J., Cederberg, C., & Sonesson, U. (2011). Global food losses and food waste: extent, causes, and prevention. Retrieved from http://www.fao.org/docrep/014/mb060e/mb060e.pdf
Guzman, D. R. (2014). Monoculture In Farming: The First In A Series On The Food Industry | STIR Journal. Retrieved September 5, 2015, from http://www.stirjournal.com/2014/03/31/monoculture-in-farming-the-first-in-a-series-on-the-food-industry/
Haberl, H., Erb, K. H., Krausmann, F., Gaube, V., Bondeau, A., Plutzar, C., … Fischer-Kowalski, M. (2007). Quantifying and mapping the human appropriation of net primary production in earth’s terrestrial ecosystems. Proceedings of the National Academy of Sciences of the United States of America, 104(31), 12942–12947. http://doi.org/10.1073/pnas.0704243104
Haberman, C. (2015, May 31). The Unrealized Horrors of Population Explosion - The New York Times. The New York Times. Retrieved from http://www.nytimes.com/2015/06/01/us/the-unrealized-horrors-of-population-explosion.html?_r=0
Hager, T. J., & Morawicki, R. (2013). Energy consumption during cooking in the residential sector of developed nations: A review. Food Policy, 40, 54–63. http://doi.org/10.1016/j.foodpol.2013.02.003

THE GLOBAL FOOD SYSTEM: AN ANALYSIS 163
BIBLIOGRAPHY
Hardin, G. (1968). The Tragedy of the Commons. Science, 162(June), 1243–1248. http://doi.org/10.1126/science.162.3859.1243
Harlan, J. R., & MacNeish, R. S. (1994). The Origins of Agriculture and Settled Life. Journal of Interdisciplinary History. http://doi.org/10.2307/206684
Harpending, H., & Eswaran, V. (2005). Tracing modern human origins. Science (New York, N.Y.), 309(5743), 1995–1997; author reply 1995–1997. http://doi.org/10.1126/science.309.5743.1995b
Harris, N. L., Brown, S., Hagen, S. C., Saatchi, S. S., Petrova, S., Salas, W., … Lotsch, a. (2012). Baseline Map of Carbon Emissions from Deforestation in Tropical Regions. Science, 336(6088), 1573–1576. http://doi.org/10.1126/science.1217962
Harrison, K. . (2007). When Languages Die: The Extinction of the World’s Languages and the Erosion of Human Knowledge. New York, USA: Oxford University Press.
Hasan, M. R., & Chakrabarti, R. (2009). Use of algae and aquatic macrophytes as feed in small-scale aquaculture: a review., (531). Retrieved from http://www.cabdirect.org/abstracts/20103235810.html;jsessionid=D10C1251180824A5E6257832F688115B
Heino, J., Virkkala, R., & Toivonen, H. (2009). Climate change and freshwater biodiversity: Detected patterns, future trends and adaptations in northern regions. Biological Reviews, 84(1), 39–54. http://doi.org/10.1111/j.1469-185X.2008.00060.x
Hirsch, R. L., Bezdek, R., & Wendling, R. (2007). Peaking of world oil production and its mitigation. Driving Climate Change, (February), 9–27. http://doi.org/10.1016/B978-012369495-9/50003-8
Hoek, A. C., Luning, P. a., Weijzen, P., Engels, W., Kok, F. J., & de Graaf, C. (2011). Replacement of meat by meat substitutes. A survey on person- and product-related factors in consumer acceptance. Appetite, 56(3), 662–673. http://doi.org/10.1016/j.appet.2011.02.001
Hoekstra, A. Y., Mekonnen, M. M., Chapagain, A. K., Mathews, R. E., & Richter, B. D. (2012). Global monthly water scarcity: Blue water footprints versus blue water availability. PLoS ONE, 7(2). http://doi.org/10.1371/journal.pone.0032688
Holland, J. M. (2004). The environmental consequences of adopting conservation tillage in Europe: Reviewing the evidence. Agriculture, Ecosystems and Environment, 103(1), 1–25. http://doi.org/10.1016/j.agee.2003.12.018
Holling, C. S., & Gunderson, L. H. (2002). Resilience and adaptive cycles. In Panarchy: Understanding Transformations in Human and Natural Systems (pp. 25–62).
Horrigan, L., Lawrence, R. S., & Walker, P. (2002). How sustainable agriculture can address the environmental and human health harms of industrial agriculture. Environmental Health Perspectives, 110(5), 445–56. Retrieved from http://www.pubmedcentral.nih.gov/articlerender.fcgi?artid=1240832&tool=pmcentrez&rendertype=abstract
Hotchkiss, J. H. (1997). Food-packaging interactions influencing quality and safety. Food Additives and Contaminants, 14(6-7), 601–7. http://doi.org/10.1080/02652039709374572
Hotz, C., & Gibson, R. S. (2007). Traditional food-processing and preparation practices to enhance the bioavailability of micronutrients in plant-based diets. The Journal of Nutrition, 137(4), 1097–1100.
Huang, J., Jun, Y., Xu, Z., Rozelle, S., & Li, N. (2007). Agricultural trade liberalization and poverty in China. China Economic Review, 18(3), 244–265. http://doi.org/10.1016/j.chieco.2007.02.003
Hui, S. C. M. (2011). Green roof urban farming for buildings in high-density urban cities. World Green Roof Conference, (March), 1–9. Retrieved from http://www.mech.hku.hk/bse/greenroof/110318_WGRC2011_Hainan_SamHui_fullpaper.pdf
Hulse, J. H. (2004). Systems for Food SY 5-1 : Integrated Food Systems and the Urbanization of Asia and Africa. Journal of Food Science, 69(4).
IAASTD. (2009). Agriculture at a Crossroads: IAASTD Synthesis Report. (B. D. McIntyre, H. R. Herren, J. Wakhungu, & R. T. Watson, Eds.).
ICTSD. (2011). The Challenge of Participating in WTO Dispute Settlement: Presentation to the informal group of developing countries. International Centre for Trade and Sustainable Development. Retrieved from http://www.ictsd.org/themes/trade-law/events/the-challenge-of-participating-in-wto-dispute-settlement-presentation-to-the
ICTSD. (2012). Asian Participation in the WTO Dispute Settlement System. Retrieved September 4, 2015, from www.ictsd.ch/dsu
Idel, A., Fehlenberg, V., & Reichert, T. (2013). Livestock production and food security in a context of climate change , and environmental and health challenges.
IEA. (2014). World Energy Outlook 2014. International Energy Agency.
ILO. (2001). Stopping Forced Labour: Global Report under the Follow-up to the ILO Declaration on Fundamental Principles and Rights at Work. Retrieved September 1, 2015, from http://www.ilo.org/wcmsp5/groups/public/@dgreports/@dcomm/documents/meetingdocument/kd00014.pdf
ILO. (2003). WORKING OUT OF POVERTY INTERNATIONAL LABOUR CONFERENCE 91st Session. Retrieved from http://www.ilo.org/public/english/standards/relm/ilc/ilc91/pdf/rep-i-a.pdf
ILO. (2007). The impact of global food chains on employment in the food and drink sector.
ILO. (2013a). Marking progress against child labour: global estimates and trends 2010-2012. Retrieved from http://www.ilo.org/ipec/Informationresources/WCMS_221513/lang--en/index.htm
ILO. (2013b). Tripartite Action to Protect Migrants within and from the GMS from Labour Exploitation (TRIANGLE) project (Midterm Evaluation Summary). Retrieved from http://www.ilo.org/eval/Evaluationreports/WCMS_212216/lang--en/index.htm
ILO. (2015a). Agriculture: a hazardous work. Retrieved August 24, 2015, from http://www.ilo.org/safework/areasofwork/hazardous-work/WCMS_110188/lang--en/index.htm
ILO. (2015b). Child labour in agriculture. Retrieved from http://ilo.org/ipec/areas/Agriculture/lang--en/index.htm
ILO. (2015c). Fishing and aquaculture. Retrieved September 4, 2015, from http://ilo.org/ipec/areas/Agriculture/WCMS_172419/lang--en/index.htm
ILO. (2015d). Food, drink and tobacco sector. Retrieved from http://www.ilo.org/global/industries-and-sectors/food-drink-tobacco/lang--en/index.htm
ILO. (2015e). LABORSTA Labour Statistics Database. Retrieved September 4, 2015, from http://laborsta.ilo.org/STP/guest
IMechE. (2013). Global food waste not, want not, 31.
Intergovernmental Panel on Climate Change (IPCC). (2013). Working Group I: Climate Change 2013, The Physical Science Basis.
Intergovernmental Panel on Climate Change (IPCC). (2014). Fifth Assessment Report - Mitigation of Climate Change. Retrieved September 4, 2015, from http://www.ipcc.ch/report/ar5/wg3/
International Energy Agency (IEA). (2010). IEA Sankey Diagram USA. Iea.Org. Paris, France. Retrieved from http://www.iea.org/sankey/#?c=United States&s=Balance
164
International Fund For Agricultural Development (IFAD). (2001). Rural Poverty Report 2001: The challenge of ending rural poverty. New York City, USA. Retrieved from http://www.ifad.org/gbdocs/eb/72/e/EB-2001-72-R-32.pdf
International Fund for Agricultural Development (IFAD). (2010). Rural Poverty Report 2011.
International Fund for Agricultural Development (IFAD). (2015). Access to markets: Making value chains work for poor rural people. Retrieved September 4, 2015, from http://ifad.org/english/market/index.htm
International Labour Office. (1998). The Sex Sector: The Economic and Social Bases of Prostitution in Southeast Asia. International Labour Organization. Retrieved from https://books.google.com/books?id=VFNKZbL1jWwC&pgis=1
IPCC. (2013). Climate change 2013: the physical science basis. Contribution of working group I to the fifth assessment report of the intergovernmental panel on climate change.
IUCN. (2011). Why is biodiversity in crisis? Retrieved September 4, 2015, from http://www.iucn.org/what/tpas/biodiversity/about/biodiversity_crisis/
Jackson, J. B. C. (2008). Colloquium paper: ecological extinction and evolution in the brave new ocean. Proceedings of the National Academy of Sciences of the United States of America, 105 Suppl (Supplement_1), 11458–65. http://doi.org/10.1073/pnas.0802812105
Jacques, P., & Jacques, J. (2012). Monocropping Cultures into Ruin: The Loss of Food Varieties and Cultural Diversity. Sustainability, 4(12), 2970–2997. http://doi.org/10.3390/su4112970
James, S. J., & James, C. (2010). The food cold-chain and climate change. Food Research International, 43(7), 1944–1956. http://doi.org/10.1016/j.foodres.2010.02.001
Jeebhay, M. F., Robins, T. G., & Lopata, A. L. (2004). World at work: fish processing workers. Occupational Environmental Medicine, 5(62), 471 – 474.
Jensen, M. H. (1999). Hydroponics worldwide. Acta Horticulturae, 481, 719–729.
Johnson, J. (2005). Small-scale and artisanal fisheries. FAO Fisheries and Aquaculture Department, 1–4.
Jovicich, E., Cantliffe, D. J., Simonne, E. H., & Stoffella, P. J. (2007). Comparative water and fertilizer use efficiencies of two production systems for cucumbers. In Proceedings of the IIIrd International Symposium on Cucurbits (pp. 235–241). Retrieved from <Go to ISI>://000245943900032
Kearney, J. (2010a). Food consumption trends and drivers. Philosophical Transactions of the Royal Society of London. Series B, Biological Sciences, 365(1554), 2793–2807. http://doi.org/10.1098/rstb.2010.0149
Kearney, J. (2010b). Food consumption trends and drivers. Philosophical Transactions of the Royal Society of London. Series B, Biological Sciences, 365(1554), 2793–807. http://doi.org/10.1098/rstb.2010.0149
Kiers, E. T., Leakey, R. R. B., Izac, A.-M., Heinemann, J. a, Rosenthal, E., Nathan, D., & Jiggins, J. (2008). Agriculture at a crossroads. Science (New York, N.Y.) (Vol. 320). http://doi.org/10.1126/science.1158390
Kim, K. C. (1993). Biodiversity, conservation and inventory: why insects matter. Biodiversity and Conservation, 2(3), 191–214. http://doi.org/10.1007/BF00056668
Kissinger, G., Herold, M., Sy, V. De, Angelsen, A., Bietta, F., Bodganski, A., … Wolf, R. (2012). Drivers of Deforestation and Forest Degradation. or REDD+ Policymakers.
Knudsen, M. T., Halberg, N., Olesen, J. E., Byrne, J., Iyer, V., & Toly, N. (2006). Global trends in agriculture and food systems. Global Development of Organic Agriculture: Challenges and Prospects, 1–48.
Kruger, H. S., Puoane, T., Senekal, M., & van der Merwe, M.-T. (2005). Obesity in South Africa: challenges for government and health professionals. Public Health Nutrition, 8(5), 491–500. http://doi.org/10.1079/PHN2005785
Krusche, a V, de Camargo, P. B., Cerri, C. E., Ballester, M. V, Lara, L. B. L. S., Victoria, R. L., & Martinelli, L. a. (2003). Acid rain and nitrogen deposition in a sub-tropical watershed (Piracicaba): ecosystem consequences. Environmental Pollution, 121(3), 389–99. http://doi.org/10.1016/S0269-7491(02)00235-X
Laidlaw, J., & Magee, L. (2014). Towards urban food sovereignty: the trials and tribulations of community-based aquaponics enterprises in Milwaukee and Melbourne. Local Environment, 1–18. http://doi.org/10.1080/13549839.2014.986716
Laird, B. D., Goncharov, A. B., & Chan, H. M. (2013). Body burden of metals and persistent organic pollutants among Inuit in the Canadian Arctic. Environment International, 59, 33–40. http://doi.org/10.1016/j.envint.2013.05.010
Lake, P. S. (2000). Disturbance, Patchinessm ad Diversity in Streams. Journal of American Benthological Society, 19(4), 573–592. http://doi.org/10.2307/1468118
Lamine, C., Barbier, M., Blanc, J., Buurma, J., Haynes, I., & Lehota, J. (2010). Reducing the dependence on pesticides : a matter of transitions within the whole agri- food system, (July), 1943–1954.
Lampe, M. von. (2007). Global biofuel growth: Implications for agricultural markets and policies. In OECD Regional Meeting on Agricultural Policy Reform. Bucharest, Romania.
Lawrence, M., & Wheelock, C. (2011). EXECUTIVE SUMMARY : Biofuels Markets and Technologies Global Ethanol, Biodiesel, and Feedstock Markets.
Levy, S. (2014). Reduced antibiotic use in livestock: How Denmark tackled resistance. http://doi.org/10.1289/ehp.122-A160
Lewison, R. L., Crowder, L. B., Read, A. J., & Freeman, S. a. (2004). Understanding impacts of fisheries bycatch on marine megafauna. Trends in Ecology and Evolution, 19(11), 598–604. http://doi.org/10.1016/j.tree.2004.09.004
Liebowitz, S. J., & Margolis, S. E. (1995). Path Dependence, Lock-In, and History. SSRN Electronic Journal, (September). http://doi.org/10.2139/ssrn.1706450
Liu, E. K., He, W. Q., & Yan, C. R. (2014). “White revolution” to “white pollution”—agricultural plastic film mulch in China. Environmental Research Letters, 9(9), 091001. http://doi.org/10.1088/1748-9326/9/9/091001
Lloyd, C. A., & James, S. (2008). Too much pressure? Retailer power and occupational health and safety in the food processing industry. Work, Employment and Society, 22(4), 713–730. http://doi.org/10.1177/0950017008098366
Luck, M., Landis, M., & Gassert, F. (2015). TECHNICAL NOTE AQUEDUCT WATER STRESS PROJECTIONS : DECADAL PROJECTIONS OF WATER SUPPLY AND DEMAND USING CMIP5 GCMs, (April), 1–20. Retrieved from http://www.wri.org /sites/default/files/aqueduct-water-stress-projections-technical-note.pdf
Lutter, S., Giljum, S., & Lieber, M. (2014). Global Material Flow database: Material Extraction Data Technical Report.
Ma, S., & Joachim, S. (2006). Review of History and Recent Development of Organic Farming Worldwide. Agricultural Sciences in China, 5(3), 169–178. http://doi.org/10.1016/S1671-2927(06)60035-7
THE GLOBAL FOOD SYSTEM: AN ANALYSIS 165
BIBLIOGRAPHY
Madani, K., & Dinar, A. (2013). Exogenous regulatory institutions for sustainable common pool resource management: Application to groundwater. Water Resources and Economics, 2-3, 57–76. http://doi.org/10.1016/j.wre.2013.08.001
Madlener, R., & Sunak, Y. (2011). Impacts of urbanization on urban structures and energy demand: What can we learn for urban energy planning and urbanization management? Sustainable Cities and Society, 1(1), 45–53. http://doi.org/10.1016/j.scs.2010.08.006
Maqsood, S., Benjakul, S., & Shahidi, F. (2013). Emerging role of phenolic compounds as natural food additives in fish and fish products. Critical Reviews in Food Science and Nutrition, 53(2), 162–79. http://doi.org/10.1080/10408398.2010.518775
Market Research Reports. (2015). Food Processing Market Research Reports. Retrieved August 30, 2015, from http://www.marketresearchreports.com/food-processing
Maron, D. F., Smith, T. J. S., & Nachman, K. E. (2013). Restrictions on antimicrobial use in food animal production: an international regulatory and economic survey. Globalization and Health, 9(1), 48. http://doi.org/10.1186/1744-8603-9-48
Marsh, K., & Bugusu, B. (2007). Food packaging - Roles, materials, and environmental issues: Scientific status summary. Journal of Food Science, 72(3). http://doi.org/10.1111/j.1750-3841.2007.00301.x
Marx, A. (2015). The State of Food Insecurity in the World: Meeting the 2015 international hunger targets: taking stock of uneven progress. FAO, IFAD, and WFP. FAO. Retrieved from http://www.fao.org/3/a4ef2d16-70a7-460a-a9ac-2a65a533269a/i4646e.pdf
Matson, P. a, Parton, W. J., Power, a G., & Swift, M. J. (1997). Agricultural intensification and ecosystem properties. Science (New York, N.Y.), 277(5325), 504–509. http://doi.org/10.1126/science.277.5325.504
McDonough, S., Gallardo, W., Berg, H., Trai, N. V., & Yen, N. Q. (2014). Wetland ecosystem service values and shrimp aquaculture relationships in Can Gio, Vietnam. Ecological Indicators, 46(September 2015), 201–213. http://doi.org/10.1016/j.ecolind.2014.06.012
McGuire, S. J. (2008). Path-dependency in plant breeding: Challenges facing participatory reforms in the Ethiopian Sorghum Improvement Program. Agricultural Systems, 96(1-3), 139–149. http://doi.org/10.1016/j.agsy.2007.07.003
Meadows, D. H., & Wright, D. (2008). Thinking in Systems: A Primer. Chelsea Green Publishing. Retrieved from https://books.google.com/books?hl=en&lr=&id=CpbLAgAAQBAJ&pgis=1
Meghani, Z., & Kuzma, J. (2010). The “Revolving Door” between Regulatory Agencies and Industry: A Problem That Requires Reconceptualizing Objectivity. Journal of Agricultural and Environmental Ethics, 24(6), 575–599. http://doi.org/10.1007/s10806-010-9287-x
Mekonnen, M. M., & Hoekstra, A. Y. (2011). The green, blue and grey water footprint of crops and derived crop products. Hydrology and Earth System Sciences, 15(5), 1577–1600. http://doi.org/10.5194/hess-15-1577-2011
Mekonnen, M. M., & Hoekstra, A. Y. (2012). A Global Assessment of the Water Footprint of Farm Animal Products. Ecosystems, 15(3), 401–415. http://doi.org/10.1007/s10021-011-9517-8
Mertens, F., Fillion, M., Saint-charles, J., Mongeau, P., Távora, R., José, C., … Mergler, D. (2015). The role of strong-tie social networks in mediating food security of fish resources by a traditional riverine community in the Brazilian Amazon, 20(3).
Miglio, C., Chiavaro, E., Visconti, A., Fogliano, V., & Pellegrini, N. (2008). Effects of different cooking methods on nutritional and physicochemical characteristics of selected vegetables. Journal of Agricultural and Food Chemistry, 56(1), 139–147. http://doi.org/10.1021/jf072304b
Millennium Ecosystem Assessment. (2005). Ecosystems and Human Well-being: Synthesis. Ecosystems (Vol. 5). http://doi.org/10.1196/annals.1439.003
Millennium Institute. (2013). Global Food and Nutrition Scenarios, 2013(2).
Miller, G. T. (2004). Sustaining the Earth: An Integrated Approach. Brooks/Cole. Retrieved from https://books.google.com/books?id=0GMCPwAACAAJ&pgis=1
Mirle, C. (2007). The industrialization of animal agriculture : Implications for small farmers , rural communities , the environment , and animals in the developing world, 2006(Fao).
Monteiro, C. A., Levy, R. B., Claro, R. M., Castro, I. R. R. de, & Cannon, G. (2010). A new classification of foods based on the extent and purpose of their processing. Cadernos de Saúde Pública, 26(11), 2039–2049. http://doi.org/10.1590/S0102-311X2010001100005
Monteiro, C. A., Levy, R. B., Claro, R. M., de Castro, I. R. R., & Cannon, G. (2011). Increasing consumption of ultra-processed foods and likely impact on human health: evidence from Brazil. Public Health Nutrition, 14(1), 5–13. http://doi.org/10.1017/S1368980010003241
Montgomery, D. R. (2007). Soil erosion and agricultural sustainability. Proceedings of the National Academy of Sciences of the United States of America, 104(33), 13268–13272. http://doi.org/10.1073/pnas.0611508104
Mood, A. (2010). Worse things happen at sea: the welfare of wild-caught fish.
Mortazavi, M. D. (2011). Are Food Subsidies Making Our Kids Fat ? Tensions Between the Healthy Hunger-Free Kids Act and the Farm Bill. The Washington and Lee Legal Review, 1771(amended 2010).
Moss, B. (2008). Water pollution by agriculture. Philosophical Transactions of the Royal Society of London. Series B, Biological Sciences, 363(1491), 659–666. http://doi.org/10.1098/rstb.2007.2176
Moubarac, J.-C., Martins, A. P. B., Claro, R. M., Levy, R. B., Cannon, G., & Monteiro, C. A. (2013). Consumption of ultra-processed foods and likely impact on human health. Evidence from Canada. Public Health Nutrition, 16(12), 2240–8. http://doi.org/10.1017/S1368980012005009
Moyer, J. R., Roman, E. S., Lindwall, C. W., & Blackshaw, R. E. (1994). Weed management in conservation tillage systems for wheat production in North and South America. Crop Protection, 13(4), 243–259. http://doi.org/10.1016/0261-2194(94)90012-4
Muir, P. (2014). SALINIZATION. Retrieved September 4, 2015, from http://people.oregonstate.edu/~muirp/saliniz.htm
Mullin, C. A., Frazier, M., Frazier, J. L., Ashcraft, S., Simonds, R., Vanengelsdorp, D., & Pettis, J. S. (2010). High levels of miticides and agrochemicals in North American apiaries: implications for honey bee health. PloS One, 5(3), e9754. http://doi.org/10.1371/journal.pone.0009754
Murphy, C. E., & Lemerle, D. (2006). Continuous cropping systems and weed selection. Euphytica, 148(1-2), 61–73. http://doi.org/10.1007/s10681-006-5941-9
Murphy, S., Burch, D., & Clapp, J. (2012). Cereal Secrets: The World’s Largest Grain Traders and Global Agriculture. Retrieved August 17, 2015, from https://www.oxfam.org/sites/www.oxfam.org/files/file_attachments/rr-cereal-secrets-grain-traders-agriculture-30082012-en_4.pdf

166
Murphy, S. P., & Allen, L. H. (2003). Animal source foods to improve micronutrient nutrition and human function in developing countries. Proceedings of a conference. June 24-26, 2002. Washington, DC, USA. The Journal of Nutrition, 133(11 Suppl 2), 3875S–4061S. http://doi.org/0022-3166/03
Mushtaq, S., Maraseni, T. N., & Reardon-Smith, K. (2013). Climate change and water security: Estimating the greenhouse gas costs of achieving water security through investments in modern irrigation technology. Agricultural Systems, (September 2015). http://doi.org/10.1016/j.agsy.2012.12.009
Naeem, S., Håkansson, K., Lawton, J. H., Crawley, M. J., Lindsey, J., Hakansson, K., & Thompson, L. J. (2013). Biodiversity and Plant Productivity in a Model Assemblage of Plant Species in a model assemblage Biodiversity and plant productivity of plant species, 76(2), 259–264.
Najam, A., & Robins, N. (2001). Seizing the future: the south, sustainable development and international trade. International Affairs, 77, 49–68. http://doi.org/10.1111/1468-2346.00177
National Farm Worker Ministry. (2015). Low Wages : National Farm Worker Ministry. Retrieved September 5, 2015, from http://nfwm.org/education-center/farm-worker-issues/low-wages/
National Veterinary Institute. (2008). Welfare of Fish in Aquaculture.
Naylor, R. L., Hardy, R. W., Bureau, D. P., Chiu, A., Elliott, M., Farrell, A. P., … Nichols, P. D. (2009). Feeding aquaculture in an era of finite resources. Proceedings of the National Academy of Sciences of the United States of America, 106(36), 15103–10. http://doi.org/10.1073/pnas.0905235106
Nesme, T., Colomb, B., Hinsinger, P., & Watson, C. a. (2014). Organic Farming, Prototype for Sustainable Agricultures, 439–452. http://doi.org/10.1007/978-94-007-7927-3
Nielsen. (2015). THE FUTURE Of GROCERY: E-COMMERCE, DIGITAL TECHNOLOGY AND CHANGING SHOPPING PREFERENCES AROUND THE WORLD. New York. Retrieved from http://www.nielsen.com/content/dam/nielsenglobal/vn/docs/Reports/2015/Nielsen Global E-Commerce and The New Retail Report APRIL 2015 (Digital).pdf
Northwest Farm Credit Services. (2007). Industry Perspective: Feedlot. Retrieved from http://agr.wa.gov/fof/docs/feedlot.pdf
Noussair, C. N., Soest, D. Van, & Stoop, J. (2014). Cooperation in a dynamic fishing game : A framed field experiment, 1–14.
OECD. (2010). Agricultural Policies in OECD Countries 2010. Panorama. http://doi.org/10.1787/agr_oecd-2010-en
OECD Competition Committee. (2013). Competition Issues in the Food Chain. Roundtable on Competition Issues in the Food Chain Industry. Retrieved from http://www.oecd.org/daf/competition/CompetitionIssuesintheFoodChainIndustry.pdf
OECD-FAO. (2015). OECD-FAO Agricultural Outlook 2015-2024. OECD Publishing. Paris, France. Retrieved from http://dx.doi.org/10.1787/agr_outlook-2015-en
Olesen, J. E., & Bindi, M. (2002). Consequences of climate change for European agricultural productivity, land use and policy. European Journal of Agronomy, 16(4), 239–262. http://doi.org/10.1016/S1161-0301(02)00004-7
Ongley, E. D. (1996). FAO Irrigation and Drainage Paper 55: Control of Water Pollution from Agriculture, 101.
Ostrom, E. (1990). Governing the Common: The Evolution of Institutions for Collective Action. http://doi.org/10.1017/CBO9780511807763
Ostrom, E. (2011). Background on the Institutional Analysis and Development Framework, 39(1), 7–27.
Pannekoek, L., van Kooten, O., Kemp, R., & Omta, S. W. F. (2007). Entrepreneurial innovation in chains and networks in Dutch greenhouse horticulture. Journal on Chain and Network Science, 5(1), 39–50. http://doi.org/10.3920/JCNS2005.x053
Pardey, P. G., & Beintema, N. M. (2001). Slow magic: Agricultural R&D a century after Mendel. International Food Policy Research Institute. Washington, DC, USA.
Parente, S., & van de Weerd, H. (2012). Food Security and Farm Animal Welfare, 1–19.
Parris, K. (2011). Impact of Agriculture on Water Pollution in OECD Countries: Recent Trends and Future Prospects. International Journal of Water Resources Development, 27(1), 33–52. http://doi.org/10.1080/07900627.2010.531898
Pasha, I., Saeed, F., Sultan, M. T., Khan, M. R., & Rohi, M. (2014). Recent developments in minimal processing: a tool to retain nutritional quality of food. Critical Reviews in Food Science and Nutrition, 54(3), 340–51. http://doi.org/10.1080/10408398.2011.585254
Paul, B. G., & Vogl, C. R. (2011). Impacts of shrimp farming in Bangladesh: Challenges and alternatives. Ocean and Coastal Management, 54(3), 201–211. http://doi.org/10.1016/j.ocecoaman.2010.12.001
Paull, J. (2011). The Uptake of Organic Agriculture: A Decade of Worldwide Development. Journal of Social and Development Sciences, 2(3), 111–120. Retrieved from http://orgprints.org/19517/1/Paull2011DecadeJSDS.pdf
Pearson, A. M., & Gillett, T. A. (1996). Processed Meats. Processed Meats (3rd ed.). Springer US. http://doi.org/10.1007/978-1-4615-7685-3
Pfeiffer, D. A. (2013). Eating fossil fuels: oil, food and the coming crisis in agriculture. New Society Publishers. New Society Publishers.
Pham, C. K., Diogo, H., Menezes, G., Porteiro, F., Braga-Henriques, A., Vandeperre, F., & Morato, T. (2014). Deep-water longline fishing has reduced impact on Vulnerable Marine Ecosystems. Scientific Reports, 4, 1–6. http://doi.org/10.1038/srep04837
Phelps, J., Carrasco, L. R., Webb, E. L., Koh, L. P., & Pascual, U. (2013). Agricultural intensification escalates future conservation costs. Proceedings of the National Academy of Sciences of the United States of America, 110(19), 7601–6. http://doi.org/10.1073/pnas.1220070110
Piketty, T. (2014). Capital in the Twenty-First Century. Harvard University Press. Retrieved from http://www.hup.harvard.edu/catalog.php?isbn=9780674430006
Pimentel, D., & Burgess, M. (2013). Soil Erosion Threatens Food Production. Agriculture, 3(3), 443–463. http://doi.org/10.3390/agriculture3030443
Pimentel, D., & Lehman, H. (1993). The Pesticide Question: Environment, Economics, and Ethics. Springer Science and Business Media.
Pimentel, D., & Pimentel, M. (2008). Food, Energy, and Society, Third Edition - CRC Press Book. Retrieved from https://www.crcpress.com/Food-Energy-and-Society-Third-Edition/Pimentel-PhD-Pimentel-MS/9781420046670
Pingali, P. L. (2012). Green revolution: impacts, limits, and the path ahead. Proceedings of the National Academy of Sciences of the United States of America, 109(31), 12302–8. http://doi.org/10.1073/pnas.0912953109
Pittelkow, C. M., Liang, X., Linquist, B. a., van Groenigen, K. J., Lee, J., Lundy, M. E., … van Kessel, C. (2014). Productivity limits and potentials of the principles of conservation agriculture. Nature, 517(7534), 365–368. http://doi.org/10.1038/nature13809
Ponisio, L. C., Gonigle, L. K. M., Mace, K. C., Palomino, J., Valpine, P. De, & Kremen, C. (2014). Diversification practices reduce organic to conventional yield gap. The Royal Society Publishing.
THE GLOBAL FOOD SYSTEM: AN ANALYSIS 167
BIBLIOGRAPHY
Ponisio, L. C., Gonigle, L. K. M., Mace, K. C., Palomino, J., Valpine, P. De, & Kremen, C. (2015). Diversification practices reduce organic to conventional yield gap.
Powell, L., Chriqui, J., Khan, T., Wada, R., & Chaloupka, F. (2013). Assessing the potential effectiveness of food and beverage taxes and subsidies for improving public health: a systematic review of prices, demand and body weight outcomes. Obesity Reviews, 14(2), 110–128.
Power, A. G. (2010). Ecosystem services and agriculture: tradeoffs and synergies. Philosophical Transactions of the Royal Society of London. Series B, Biological Sciences, 365(1554), 2959–2971. http://doi.org/10.1098/rstb.2010.0143
Prager, D., Virdin, J., Hammond, A., Angell, P., Mcneill, C., & Evans, J. W. (2005). The Wealth of the Poor: Managing Ecosystems to Fight Poverty. World.
Puustinen, M., Koskiaho, J., & Peltonen, K. (2005). Influence of cultivation methods on suspended solids and phosphorus concentrations in surface runoff on clayey sloped fields in boreal climate. Agriculture, Ecosystems and Environment, 105(4), 565–579. http://doi.org/10.1016/j.agee.2004.08.005
Rahman, M. M., Salleh, M. A. M., Rashid, U., Ahsan, A., Hossain, M. M., & Ra, C. S. (2014). Production of slow release crystal fertilizer from wastewaters through struvite crystallization - A review. Arabian Journal of Chemistry, 7(1), 139–155. http://doi.org/10.1016/j.arabjc.2013.10.007
Ramírez, C. a., Patel, M., & Blok, K. (2006). How much energy to process one pound of meat? A comparison of energy use and specific energy consumption in the meat industry of four European countries. Energy, 31(12), 1711–1727. http://doi.org/10.1016/j.energy.2005.08.007
Ray, D. K., Mueller, N. D., West, P. C., & Foley, J. a. (2013). Yield Trends Are Insufficient to Double Global Crop Production by 2050. PLoS ONE, 8(6). http://doi.org/10.1371/journal.pone.0066428
Reardon, T., Barrett, C. B., Berdegué, J. a., & Swinnen, J. F. M. (2009). Agrifood Industry Transformation and Small Farmers in Developing Countries. World Development, 37(11), 1717–1727. http://doi.org/10.1016/j.worlddev.2008.08.023
Reeds, P. J., & Garlick, P. J. (2003). Protein and amino acid requirements and the composition of complementary foods. J Nutr, 133(9), 2953S–61S.
Regattieri, A., & Gamberi, R. M. (2007). Traceability of food products: General framework and experimental evidence. Journal of Food Engineering, (81), 347 – 356. Retrieved from http://www.researchgate.net/profile/Alberto_Regattieri/publication/222694728_Traceability_of_food_products_General_framework_and_experimental_evidence/links/00b7d51a7736e54cbd000000.pdf
Regmi, A. (2001). Changing structure of global food consumption and trade: An introduction. Changing Structure of Global Food Consumption and Trade.
Rickman, J. C., Barrett, D. M., & Bruhn, C. M. (2007). Nutritional comparison of fresh, frozen and canned fruits and vegetables. Part 1. Vitamins C and B and phenolic compounds. Journal of the Science of Food and Agriculture, 87(2), 930–944. http://doi.org/10.1002/jsfa
Rigg, J. (2006). Land, farming, livelihoods, and poverty: Rethinking the links in the Rural South.
Roberts, C. A. (2001). The food safety information handbook. Greenwood Publishing Group.
Robinson, T., Thornton, P., Francheschini, G., Kruska, R., Chiozza, F., Notenbaert, A., … See, L. (2011). Global livestock production systems. Retrieved August 9, 2015, from http://www.fao.org/docrep/014/i2414e/i2414e.pdf
Robson, J., Davidson-Hunt, J., Delaney, a, Lichtenstein, G., Magole, L., & Mead, a. (2014). Remebering Elinor Ostrom. Policy Matters, (19).
Rolle, R. S. (2006). Improving postharvest management and marketing in the Asia-Pacific region: issues, challenges, and trends in the fruit and vegetable sector. Tokyo, Japan.
Rong, H., Hai-Yan, H., Dongfang, C., Xingrong, J., & Aluko, R. (2013). Effects of High Pressure and Heat Treatments on Physicochemical and Gelation Properties of Rapeseed Protein Isolate. Food Bioprocessing Technology, 7(5), 1344 – 1354. Retrieved from http://www.researchgate.net/profile/He_Rong2/publication/255731098_Effects_of_High_Pressure_and_Heat_Treatments_on_Physicochemical_and_Gelat ion_Propert ies_of_Rapeseed_Protein_Isolate/links/0046352379c95d4a3d000000.pdf
Ruppanner, V., & Mulle, E. (2010). Exploring the Global Food Supply Chain. Markets, Companies, Systems. THREAD. Retrieved from http://www.felixpena.com.ar/contenido/negociaciones/anexos/2010-06-exploringtheglobalfoodsupplychain.pdf
Sans, F. X., Berner, a., Armengot, L., & Mäder, P. (2011). Tillage effects on weed communities in an organic winter wheat-sunflower-spelt cropping sequence. Weed Research, 51(4), 413–421. http://doi.org/10.1111/j.1365-3180.2011.00859.x
Schutter, O. De. (2014). General Assembly. Environment (Vol. 11759). Retrieved from http://www.srfood.org/images/stories/pdf/officialreports/20140310_finalreport_en.pdf
Seafood Choices Alliance. (2005). Introducing “It’s All About Salmon,” 2004–2005.
Seaman, P., & Eves, A. (2006). The management of food safety-the role of food hygiene training in the UK service sector. International Journal of Hospitality Management, 25(2), 278–296. http://doi.org/10.1016/j.ijhm.2005.04.004
Seaquist, J. W., Li Johansson, E., & Nicholas, K. A. (2014). Architecture of the global land acquisition system: applying the tools of network science to identify key vulnerabilities. Environmental Research Letters, 9(11), 114006. http://doi.org/10.1088/1748-9326/9/11/114006
Searchinger, T., Hanson, C., Ranganathan, J., Lipinski, B., Waite, R., Winterbottom, R., … Heimlich, R. (2013). The great balancing act, (May), 1–16.
Searchinger, T., & Heimlich, R. (2015). AVOIDING BIOENERGY COMPETITION FOR FOOD CROPS AND LAND. Creating a Sustainable Food Future, Installmen(January).
Sen, A. (2014). Issues in the Measurement of Poverty. http://doi.org/10.2307/3439966
Serpukhov, M. . (2013). Hidden Protectionism as an Instrument of Modern International Trade Policy, 27(3), 2012–2013.
Serpukhov, M. . (2013). (n.d.). Hidden Protectionism as an Instrument of Modern International Trade Policy, 27(3), 2012–2013.
Shafiee, S., & Topal, E. (2009). When will fossil fuel reserves be diminished? Energy Policy, 37(1), 181–189. http://doi.org/10.1016/j.enpol.2008.08.016
Silici, L. (2014). Agroecology. What It Is And What It Has To Offer. International Institute for Environment and Development, London.
Silva Dias, J. C. (2010). Impact of improved vegetable cultivars in overcoming food insecurity. Euphytica, 176(1), 125–136. http://doi.org/10.1007/s10681-010-0237-5
Sims, R. (2009). Food, place and authenticity: local food and the sustainable tourism experience. Journal of Sustainable Tourism, 17(3), 321–336. http://doi.org/10.1080/09669580802359293

168
Singh, P., Pongkanjana, A., & Pradesh, A. (2006). Potential Productivity and Yield Gap of Selected Crops in the Rainfed Regions of India. SAT eJournal, 2(1), 1–33.
Smil, V. (2002). Nitrogen and food production: proteins for human diets. AMBIO: A Journal of the Human Environment, 31(2), 126–131. http://doi.org/10.1579/0044-7447-31.2.126
Soane, B. D., Ball, B. C., Arvidsson, J., Basch, G., Moreno, F., & Roger-Estrade, J. (2012). No-till in northern, western and south-western Europe: A review of problems and opportunities for crop production and the environment. Soil and Tillage Research, 118, 66–87. http://doi.org/10.1016/j.still.2011.10.015
Sofos, J. N. (2008). Challenges to meat safety in the 21st century. Meat Science, 78(1-2), 3–13. http://doi.org/10.1016/j.meatsci.2007.07.027
Sommer, R., Piggin, C., Haddad, a., Hajdibo, a., Hayek, P., & Khalil, Y. (2012). Simulating the effects of zero tillage and crop residue retention on water relations and yield of wheat under rainfed semiarid Mediterranean conditions. Field Crops Research, 132, 40–52. http://doi.org/10.1016/j.fcr.2012.02.024
State Government of Victoria. (2014). Food processing and nutrition. Better Health Channel. Retrieved from http://www.betterhealth.vic.gov.au/bhcv2/bhcarticles.nsf/pages/Food_processing_and_nutrition?open
Statista. (2015). Share of the global packaging market 2012, by end market | Statistic. Retrieved September 4, 2015, from http://www.statista.com/statistics/258960/share-of-the-global-packaging-market-by-end-market/
Stavi, I., & Lal, R. (2013). Agriculture and greenhouse gases, a common tragedy. A review. Agronomy for Sustainable Development, 33(2), 275–289. http://doi.org/10.1007/s13593-012-0110-0
Steffen, W., Richardson, K., Rockstrom, J., Cornell, S. E., Fetzer, I., Bennett, E. M., … Sorlin, S. (2015). Planetary boundaries: Guiding human development on a changing planet. Science, 347(6223). http://doi.org/10.1126/science.1259855
Steffen, W., Richardson, K., Rockström, J., Cornell, S., Fetzer, I., Bennett, E., … Sörlin, S. (2015). Planetary Boundaries: Guiding human development on a changing planet. In Prep, XXX(January). http://doi.org/10.1126/science.1259855
Steinfeld, H., Gerber, P., Wassenaar, T., Castel, V., Rosales, M., & De Haan, C. (2006). Livestock’s long shadow: environmental issues and options. Food and Agriculture Organization of the United Nations, 3(1), 1–377. http://doi.org/10.1007/s10666-008-9149-3
Stern, N. (2007). Stern Review: The Economics of Climate Change. Retrieved from https://books.google.com/books?hl=nl&lr=&id=U-VmIrGGZgAC&pgis=1
Strayer, D. L. (2010). Alien species in fresh waters: Ecological effects, interactions with other stressors, and prospects for the future. Freshwater Biology, 55(SUPPL. 1), 152–174. http://doi.org/10.1111/j.1365-2427.2009.02380.x
Strayer, D. L., & Dudgeon, D. (2010). Freshwater biodiversity conservation: recent progress and future challenges. Journal of the North American Benthological Society, 29(1), 344–358. http://doi.org/10.1899/08-171.1
Stuart, T. (2009). Waste: Uncovering the Global Food Scandal. The true cost of what the global food industry throws away. W.W. Norton & Company.
Stuckler, D., & Nestle, M. (2012). Big food, food systems, and global health. PLoS Medicine, 9(6), 7. http://doi.org/10.1371/journal.pmed.1001242
Sutton M.A., Bleeker A., Howard C.M., Bekunda M., Grizzetti B., de Vries W., V., Grinsven H.J.M., Abrol Y.P., Adhya T.K., Billen G.,. Davidson E.A, Datta A., D. R., Erisman J.W., Liu X.J., Oenema O., Palm C., Raghuram N., Reis S., Scholz R.W., S., T., Westhoek H. & Zhang F.S., with contributions from Ayyappan S., B. A. F., Bustamante M., Fowler D., Galloway J.N., Gavito M.E., Garnier J., G. S., Hellums D.T., Holland M., Hoysall C., Jaramillo V.J., Klimont Z., Ometto J.P., P., … Singh B., Singh U., Y. X. Y. & Z. Y. (2013). Our Nutrient World: The
challenge to produce more food and energy with less pollution. Global Overview of Nutrient Management. Centre for Ecology and Hydrology, Edinburgh on Behalf of the Global Partnership on Nutrient Management and the International Nitrogen Initiative. Retrieved from http://nora.nerc.ac.uk/500700/1/N500700BK.pdf
Suuronen, P., Chopin, F., Glass, C., Løkkeborg, S., Matsushita, Y., Queirolo, D., & Rihan, D. (2012). Low impact and fuel efficient fishing- looking beyond the horizon. Fisheries Research, 119, 135–146.
Tallontire, A., Dolan, C., Smith, S., & Barrientos, S. (2005). Reaching the marginalised? Gender value chains and ethical trade in African horticulture. Development in Practice, 15(3-4), 559–571. http://doi.org/10.1080/09614520500075771
TESCO. (2015). Annual Report and Financial Statements 2015.
The Hague Global Child Labour Conference on 11 May 2010. (2010). Roadmap for achieving the elimination of the Worst Forms of Child Labour by 2016. Retrieved from http://www.ilo.org/ipec/Informationresources/l a n g - - e n /d o c N a m e - - WC M S _ 1 2 7 0 1 8 / i n d e x . h t m \ n h t t p : / / w w w.childlabourconference2010.com/images/stories/downloads/roadmap/adopted roadmap to 2016.doc\nhttp://www.ilo.org/wcmsp5/groups/public/---dgreports/---dcomm/docu
The Rodale Institute. (2011). The Farming Systems Trial: Celebrating 30 Years. Culture, -(19), 13. http://doi.org/10.1525/cag.1983.-.19.1
The World Bank. (2014a). 3.2 World Development Indicators : Agricultural inputs. Washington, DC: The World Bank.
The World Bank. (2014b). Food Price Watch.
The World Bank. (2014c). World DataBank: World Development Indicators. Washington, DC: The World Bank. Retrieved from http://databank.worldbank.org/data/views/reports/tableview.aspx
Thomaier, S., Specht, K., Henckel, D., Dierich, A., Siebert, R., Freisinger, U. B., & Sawicka, M. (2014). Farming in and on urban buildings : Present practice and specific novelties of Zero-Acreage Farming ( ZFarming ). Renewable Agriculture and Food Systems, (URBAN AGRICULTURE), 1–12. http://doi.org/10.1017/S1742170514000143
Tilman, D., Cassman, K. G., Matson, P. A., Naylor, R., & Polasky, S. (2002). Agricultural sustainability and intensive production practices. Nature, 418(6898), 671–7. http://doi.org/10.1038/nature01014
Tittonell, P. a. (2013). Towards ecological intensification of world agriculture. Retrieved September 4, 2015, from http://www.wageningenur.nl/nl/show/Towards-ecological-intensification-of-world-agriculture.htm
Tittonell, P., & Giller, K. E. (2013). When yield gaps are poverty traps: The paradigm of ecological intensification in African smallholder agriculture. Field Crops Research, 143, 76–90. http://doi.org/10.1016/j.fcr.2012.10.007
Topouzis, D. (1990). Feminization of poverty. Africa Report, 35(3), 60–63. Retrieved from http://www.cabdirect.org/abstracts/19901882816.html
Townsend, A. R., & Howarth, R. W. (2010). Fixing the Global--Nitrogen Problem. Scientific American, 32–39.
Tubiello, F. N., Salvatore, M., Cóndor Golec, R. D., Ferrara, A., Rossi, S., Biancalani, R., … Flammini, A. (2014). Agriculture , Forestry and Other Land Use Emissions by Sources and Removals by Sinks. FAO - Food and Agriculture Organization of the United Nations, 2, 4–89. Retrieved from http://www.fao.org/docrep/019/i3671e/i3671e.pdf
Tuomisto, H. L., Hodge, I. D., Riordan, P., & Macdonald, D. W. (2012). Comparing global warming potential, energy use and land use of organic, conventional and integrated winter wheat production. Annals of Applied Biology, 161(2), 116–126. http://doi.org/10.1111/j.1744-7348.2012.00555.x
U.S. Congress Office of Technology Assessment (OTA). (1985). Innovative Biological Technologies for Lesser Developed Countries. Retrieved September 5, 2015, from http://ota.fas.org/reports/8512.pdf
THE GLOBAL FOOD SYSTEM: AN ANALYSIS 169
BIBLIOGRAPHY
U.S. Energy Information Administration. (2012). Biofuels Issues and Trends, (October), 1–48. Retrieved from papers2://publication/uuid/24B1B2ED-7BD8-41CB-9215-E749DD9CA356
U.S. Food and Drug Administration (FDA). (2015). All About BSE. Retrieved from http://www.fda.gov/AnimalVeterinary/ResourcesforYou/AnimalHealthLiteracy/ucm136222.htm
UNCTAD. (2013a). Implications of global value chains for trade, investment, development and jobs .
UNCTAD. (2013b). Trade and Environment Review 2013.
UNCTAD. (2013c). Trade and Environment Review 2013: Wake up before it is too late. Retrieved from http://unctad.org/en/pages/PublicationWebflyer.aspx?publicationid=666
UNEP. (2010). Assessing the environmental impacts of consumption and production. Environment.
UNEP. (2012). The Critical Role of Global Food Consumption Patterns in Achieving Sustainable Food Systems and Food for All, 12–16.
UNESCO. (2003). Water for People Water for Live: The United Nations World Water Development Report.
UNESCO. (2006). Non-Renewable Groundwater Resources. A Guidebook on Socially Sustainable Management for Water Policy Makers. Arid Lands Water Evaluation and Management.
UNICEF. (2013). Improving Child Nutrition: The Achievable Imperative for Global Progress. United Nations’ Childrens Fund (UNICEF). Retrieved from http://www.unicef.org/gambia/Improving_Child_Nutrition_-_the_achievable_imperative_for_global_progress.pdf
United Nations. (2015). World Population Prospects 2015 Key_Findings_WPP_2015.
United Nations Convention to Combat Desertification (UNCCD). (2012). Background Information on Desertification and Land Degradation for World Day to Combat Desertification - 17 June. World Day to Combat Desertification, 1. Retrieved from http://www.un.org/en/events/desertificationday/background.shtml
United Nations Environmental Programme. (2007). Global Environment Outlook: GEO4 Environment for Development. Retrieved September 5, 2015, from http://www.unep.org/geo/geo4/report/geo-4_report_full_en.pdf
United Nations Environmental Programme. (2011). Waste: investing in energy and resource efficiency.
United States Bureau of Labour Statistics. (2011). Employment, Hours, and Earnings from the Current Employment Statistics survey. Retrieved from http://data.bls.gov/pdq/querytool.jsp?survey=ce
United States Department of Agriculture. (2007). USDA table of nutrient retention factors: release 6. Retrieved from http://www.ars.usda.gov/SP2UserFiles/Place/80400525/Data/retn/retn06.pdf
United States Department of Agriculture. (2012). USDA Economic Research Service - Global Food Industry. Retrieved August 9, 2015, from http://www.ers.usda.gov/topics/international-markets-trade/global-food-markets/global-food-industry.aspx
United States Department of Health and Human Services. (2011). Fish and Fishery Products Hazards and Controls Guidance. Fish and Fishery Products Hazard and Control Guidance Fourth Edition.
USDA. (2014a). CRIS Funding Trend - ARS Sponsored - by Portfolio. Retrieved August 17, 2015, from https://portal.nifa.usda.gov/lmd4/portfolios/trends/7-cris-funding-trend-ars-sponsored-by-portfolio/public
USDA. (2014b). CRIS Funding Trend - NIFA Funding Source - by Portfolio. Retrieved August 17, 2015, from https://portal.nifa.usda.gov/lmd4/portfolios/trends/8-cris-funding-trend-nifa-funding-source-by-portfolio/public
USDA Economic Research Service - Adoption of Genetically Engineered Crops in the U.S. (n.d.). Retrieved from http://www.ers.usda.gov/data-products/adoption-of-genetically-engineered-crops-in-the-us.aspx
Van Boeckel, T. P., Brower, C., Gilbert, M., Grenfell, B. T., Levin, S. A., Robinson, T. P., … Laxminarayan, R. (2015). Global trends in antimicrobial use in food animals. Proceedings of the National Academy of Sciences of the United States of America, 112(18), 5649–5654. http://doi.org/10.1073/pnas.1503141112
van der Werf, G. R., Morton, D. C., DeFries, R. S., Olivier, J. G. J., Kasibhatla, P. S., Jackson, R. B., … Randerson, J. T. (2009). CO2 emissions from forest loss. Nature Geoscience, 2(11), 737–738. http://doi.org/10.1038/ngeo671
Van Wart, J., Kersebaum, K. C., Peng, S., Milner, M., & Cassman, K. G. (2013). Estimating crop yield potential at regional to national scales. Field Crops Research, 143, 34–43. http://doi.org/10.1016/j.fcr.2012.11.018
Vanloqueren, G., & Baret, P. V. (2008). Why are ecological, low-input, multi-resistant wheat cultivars slow to develop commercially? A Belgian agricultural “lock-in” case study. Ecological Economics, 66(2-3), 436–446. http://doi.org/10.1016/j.ecolecon.2007.10.007
Vanloqueren, G., & Baret, P. V. (2009). How agricultural research systems shape a technological regime that develops genetic engineering but locks out agroecological innovations. Research Policy, 38(6), 971–983. http://doi.org/10.1016/j.respol.2009.02.008
Vanloqueren, G., & Baret, P. V. (2009). (n.d.). How agricultural research systems shape a technological regime that develops genetic engineering but locks out agroecological innovations. Research policy, 38(6), 971-983.
Verma, M. (2015). Energy Use in Global Food Production Considerations for Sustainable Food Security in the 21st Century. (R. W. Hartel, P. J. Clark, J. F. Finley, D. Rodriguez-Lazaro, Y. Roos, & D. Topping, Eds.) (SpringerBr). Adelaide: Springer International Publishing. http://doi.org/10.1007/978-3-319-16781-7
Veron, G., Patterson, B. D., & Reeves, R. (2008). Freshwater Animal Diversity Assessment. Freshwater Animal Diversity Assessment, 198(APRIL), 607–617. http://doi.org/10.1007/978-1-4020-8259-7
Vetter, S. (2013). Development and sustainable management of rangeland commons – aligning policy with the realities of South Africa’s rural landscape. African Journal of Range & Forage Science, 30(1-2), 1–9. http://doi.org/10.2989/10220119.2012.750628
Vicard, V. (2012). Trade, conflict, and political integration: Explaining the heterogeneity of regional trade agreements. European Economic Review, 56(1), 54–71. http://doi.org/10.1016/j.euroecorev.2011.06.003
Vitousek, P. M., Aber, J. D., Howarth, R. W., Likens, G. E., Matson, P. A., Schindler, D. W., … Tilman, D. G. (1997). HUMAN ALTERATION OF THE GLOBAL NITROGEN CYCLE: SOURCES AND CONSEQUENCES. Ecological Applications, 7(3), 737–750. http://doi.org/10.1890/1051-0761(1997)007[0737:HAOTGN]2.0.CO;2
Vogt, R. D., Guo, J. H., Luo, J. H., Peng, X. Y., Xiang, R. J., Xiao, J. S., … Zhao, Y. (2007). Water chemistry in forested acid sensitive sites in sub-tropical Asia receiving acid rain and alkaline dust. Applied Geochemistry, 22(6), 1140–1148. http://doi.org/10.1016/j.apgeochem.2007.03.005
Wagner, K. (2014). Revealing the truth about nutrition labelling: The age of the confused consumer. Studies by Undergraduate Researchers at Guelph, 7(3).
170
Walker, B. (2006). The Ecology of Ainu Autonomy and Dependence. (R. Maaka & C. Andersen, Eds.). Toronto, Canada: Canadian Scholars Press.
Walker, M., Diez-Leon, M., & Mason, G. (2014). Animal Welfare Science: Recent Publication Trends and Future Research Priorities. International Journal of Comparative Psychology, 27(1). Retrieved from http://escholarship.org/uc/item/1vx5q0jt
Ward, D., Ngairorue, B. T., Kathena, J., Samuels, R., & Ofran, Y. (1998). Land degradation is not a necessary outcome of communal pastoralism in arid Namibia. Journal of Arid Environments, 40(4), 357–371. http://doi.org/10.1006/jare.1998.0458
Weaver, C. M., Dwyer, J., Fulgoni, V. L., King, J. C., Leveille, G. A., MacDonald, R. S., … Schnakenberg, D. (2014). Processed foods: contributions to nutrition. The American Journal of Clinical Nutrition, 99(6), 1525–42. http://doi.org/10.3945/ajcn.114.089284
Weinbaum, S. a., Johnson, R. S., & Dejong, T. M. (1992). Causes and Consequences of Overfertilization in Orchards. HortTechnology, 2(1972), 112–120. http://doi.org/<p></p>
White, P. A. (2014). The Growing Business of Cover Crops, (August).
Willer, H., & Lernoud, J. (2014). Organic Agriculture Worldwide: Current Statistics. The World of Organic Agriculture., 23 – 46.
Wirsenius, S., Azar, C., & Berndes, G. (2010). How much land is needed for global food production under scenarios of dietary changes and livestock productivity increases in 2030? Agricultural Systems, 103(9), 621–638. http://doi.org/10.1016/j.agsy.2010.07.005
Wolff, H., & Recke, G. (2000). Path dependence and implementation strategies for integrated pest management. Quarterly Journal of International Agriculture, 39(2), 149–171.
World Animal Net (WAN). (2015). Animal Welfare and Development :The Role and Responsibility of Development Organisations and the World Organisation for Animal Health ( OIE ) Collaborating Partners.
World Health Organization (WHO). (2015). WHO | Obesity and overweight. Retrieved from http://www.who.int/mediacentre/factsheets/fs311/en/index.html
World Hunger Education Service. (2015). 2015 World Hunger and Poverty Facts and Statistics. Retrieved August 15, 2015, from http://www.worldhunger.org/articles/Learn/world hunger facts 2002.htm#Does_the_world_produce_enough_food_to_feed_everyone
World Resources Institute. (2013a). Creating a Sustainable Food Future.
World Resources Institute. (2013b). Reducing Food Loss and Waste. Retrieved from http://unep.org/wed/docs/WRI-UNEP-Reducing-Food-Loss-and-Waste.pd
World Resources Institute. (2015). Sources of Eutrophication: where do nutrients come from. Retrieved September 4, 2015, from http://www.wri.org/our-work/project/eutrophication-and-hypoxia/sources-eutrophication
World Wildlife Fund. (2014a). Living Planet Report 2014.
World Wildlife Fund. (2014b). Soil Erosion and Degradation Threats. Retrieved September 4, 2015, from https://worldwildlife.org/threats/soil-erosion-and-degradation
Wrigley, N., & Lowe, M. (2010). The Globalization of Trade in Retail Services. Retrieved from http://eprints.soton.ac.uk/169193/
Yoon, B.-S. (2006). Who Is Threatening Our Dinner Table? The Power of Transnational Agribusiness. Monthly Review, 58(6), 56–64. Retrieved from http://search.proquest.com.ezproxy.lib.rmit.edu.au/docview/213160269/fulltextPDF?accountid=13552
Young, O. R. (2010). Institutional dynamics: Resilience, vulnerability and adaptation in environmental and resource regimes. Global Environmental Change, 20(3), 378–385. http://doi.org/10.1016/j.gloenvcha.2009.10.001
Zacune, J. (2012). Combatting Monsanto: Grassroots Resistance to the Corporate Power of Agribusiness in the Era of the“ green Economy” and a Changing Climate. Retrieved from http://scholar.google.com/

THE GLOBAL FOOD SYSTEM: AN ANALYSIS 171
GLOSSARY
GLOSSARYAdaptabilityResilience Alliance defines adaptability as the capacity of actors in a system to manage change by moving towards a more desirable configuration either via innovation, persistence or transfor-mation.
Agricultural holding An agricultural holding is a single unit under a single management that undertakes agricultural activity either as its primary or secondary activity.
Agricultural income The income derived from agricultural activities. The main indicator for agricultural income is ‘factor income per labour input’, where labour input is expressed in annual work units (AWUs).
Agri-environmental indicators A set of 28 agri-environmental indicators used by the European Commission to monitor the integration of environmental aspects into the Common Agricultural Policy (CAP)
Agro-ecologyA scientific discipline that uses an ecological approach to agriculture in terms of study, design, management and evaluation so as to ensure that agricultural systems are not only productive but also conserve environmental resources
Animal output Output of animal products that includes ownership, sales and changes in stock levels by producers
Annual work unit (AWU)One annual work unit corresponds to the work performed by one person on a full-time basis, where full-time refers to the minimum hours as defined by relevant national governments that oversee employment contracts. Where this information is unavailable, it usually refers to 1 800 hours of minimum work annually broken up to in 8 hour work days for 225 days.
Annuals (Plants)Annual plants are plants that last for one season (year) and need to be planted each year.
AquacultureAquaculture refers to the farming of aquatic organisms, both aquatic animals and plants for human use or consumption
AquaponicsRefers to a closed system where the waste produced by farmed fish is used as nutritional input for plants and where the plants purify water for the fish
Arable land Arable land includes land defined by the FAO as land under temporary crops (double-cropped areas are counted once), temporary meadows for mowing or for pasture, land under market or kitchen gardens, and land temporarily fallow. Land abandoned as a result of shifting cultivation is excluded. “Arable land” does not indicate the amount of land that is potentially cultivable.
Biodiversity Biodiversity, or biological diversity, refers to the number, variety and variability of all living organisms (plants and animals) within a given area.
BiomassBiomass refers to the total quantity or weight of all living organisms within a given area. In terms of energy production, it refers to any organic material of biological origin that can be used for heat production or electricity generation.
Bovine A bovine refers to a domestic animal of the species Bos taurus (cattle) or Bubalus bubalis (water buffalo), and also includes hybrids like Beefalo.
Concentrated Animal Feeding Operation (CAFO)A Concentrated Animal Feeding Operation is an animal feeding operation where animals are confined for more than 45 days per year.
Cage FreeCage free refers to a housing system for birds that are raised without cages. The term is often used interchangeably with ‘Free range’ and the exact

172
definition varies by operation and country and this does not guarantee that birds were allowed access to the outdoors or pasture.
Capacity BuildingRefers to the process of strengthening or enhancing the ability of individuals, organizations or communities to address their own long term needs.
Carbon footprintA representation of the effect human activities have on the climate in terms of the total amount of greenhouse gases produced by an individual, organization or country. It is measured in units of carbon dioxide equivalents.
Carrying CapacityIn ecological terms, Carrying capacity is defined as the maximum sustainable population size of people, animals, or crops that can be supported indefinitely into the future without degrading the environment for future generations.
Cereals Cereals include wheat (common wheat and spelt and durum wheat), rye, maslin, barley, oats, mixed grain other than maslin, grain maize, sorghum, triticale, and other cereal crops such as buckwheat, millet, canary seed and rice.
Certified OrganicCertified Organic or USDA Organic is a term used in the US to ascertain that a product is “organic” as defined by the USDA (US Department of Agriculture). It requires at least 95% of the food or ingredients listed in the product to be free from synthetic chemicals or additives
Climate change A change in global or regional climate patterns mainly due to man-made or anthropogenic activities, which increase the concentration of greenhouse gases such as carbon dioxide and methane, in the atmosphere.
Common Agricultural Policy The Common Agricultural Policy (CAP) is the EU’s agricultural policy. Under Article 33 of the Treaty establishing the European Community, its aims are to ‘ensure reasonable prices for Europe’s consumers and fair incomes for farmers, in particular through the common organisation of agricultural markets and by enforcing compliance with the principles
adopted at the Stresa Conference in 1958, namely single prices, financial solidarity and Community preference’.
Common Fisheries Policy (CFP)The Common Fisheries Policy is the EU’s policy for managing fisheries in the waters of the EU Member States with the objective of increasing productivity, ensuring a secure supply at reasonable prices to the consumer and maintaining stable markets for the fisheries industry within Europe. Although a Common Fisheries Policy was already provided for in the Treaty of Rome in 1957, it did not become a common policy in the full sense of the term until 1983. The CFP has the same legal basis (Articles 32–38 of the EC Treaty) as the Common Agricultural Policy and like the CAP, the CFP is a shared responsibility of the EU and its Member States.
Common land Common land is the land that does not directly belong to any agricultural holding but on which common rights apply. It can consist of pasture, horticultural or other land.
Community CapacityThe knowledge, skills, participation, leadership and other resources needed by a community to ef-fectively address local issues and concerns.
Community Food Assessment (CFA)A Community Food Assessment is a collaborative and participatory process that systematically examines a broad range of community food issues and assets with the goal of making the community more food secure
Community Food Security (CFS)Refers to a state within a community where all residents have access to safe, culturally acceptable, and nutritionally adequate food by making the respective food system environmentally sustainable and socially just.
Community GardenA community garden is a plot of urban or rural land that is gardened collectively by a group of people to produce fruits, vegetables, flowers, or animal products.
Community Supported Agriculture (CSA)A network of individuals consisting of growers and consumers who pledge support to a farm operation and share the risks and benefits of food production.
THE GLOBAL FOOD SYSTEM: AN ANALYSIS 173
GLOSSARY
Community-Based Participatory Research (CBPR)Research that is conducted as an equal partnership between traditionally trained “experts” and members of a community. In CBPR projects, the community participates fully in all aspects of the research process.
Controlled Environment Agriculture (CEA) CEA is an intensive form of (hydroponically-based) agriculture where plants are grown within a controlled environment so that horticultural practices can be optimized.
ConsumingConsuming or consumption is a step in the food system. It refers to the act of obtaining, purchasing, and eating food. A consumer is a person who has access to food via a store or market and is able to select the food product of choice and purchase it.
Crop rotation Crop rotation on arable land is a practice to preserve the productive capacity of land by alternating crops in a planned pattern or sequence so that crops of the same species are not grown sequentially on the same plot of land.
Dietary Guidelines Dietary Guidelines provide advice about making informed food choices that promote health and prevent disease
DistributionDistribution refers to the process of dividing up, spreading out, and delivering food to various places with or without intermediate steps where transformation or processing of food that alters the food in some form.
Eco-labelA seal or logo indicating that a product has met a set of environmental standards.
Ecological Footprint (EF)Ecological Footprint is a term introduced by William Rees and Mathis Wackernagel in 1992 that measures how much land and water is needed to produce the resources we consume and to dis-pose of the waste we produce.
Economically active populationThe economically active population, or the active population, includes persons of a certain age group, both employed and unemployed that can potentially contribute to the labour supply of the nation or region
EquityIn the context of a food system, equity refers to a fair and just distribution of food in all communities, regardless of socioeconomic status, geography, race, ethnicity, gender, or immigration status
Eutrophication Eutrophication is a process by which a body of water acquires a high concentration of nutrients, especially phosphates and nitrates that result in excessive algae growth which eventually leads to the depletion of dissolved oxygen and potentially the death of other organisms such as fish
ExternalitiesAn externality in economic terms refers to benefits or costs that are not included in the market price of goods or services. For example, the pollution generated by transporting food is not paid for by the trucking company in the price of the fuel, or by the consumer in the price of the food. Similarly, a beekeeper is not compensated when his/her bees pollinate surrounding orchards
Fair TradeMerriam Webster defines fair trade as a movement whose goal is to help producers in developing countries to get a fair price for their products so as to reduce poverty, provide for the ethical treatment of workers and farmers, and promote environmentally sustainable practices
Family labour The family labour force of the agricultural holding in the context of the farm structure survey (FSS) refers to persons who carry out farm work on the holding and are classified either as a holder or the members of the sole holder’s family.
Farm labour force The farm labour force refers to all persons who carry out farm work on the an agricultural holding with or without pay.
Farmers’ MarketA market where local growers and producers of food sell their goods directly to the public
Feed (animal feed)Feed, animal feed or feeding stuff) refers to any substance or product that is used for feeding animals. It can include additives and can vary from processed or partially processed to unprocessed products

174
Fertiliser A fertiliser is a farm input used in agriculture to provide crops with vital nutrients to grow. The three main nutrients provided by fertilizers are nitrogen (N), phosphorus (P) and potassium (K). Fertilisers can be inorganic fertilisers (also called mineral, synthetic or manufactured) or organic fertilizers (includes manure, compost, sewage sludge and industrial waste).
Fish catch Fish catch (or simply catch) refers to catches of any fish or marine products in the wild for commercial or recreational purposes. Fish catch is normally expressed in live weight and derived by the application of conversion factors to the actual landed or product weight.
Fishing fleet A fishing fleet refers to a collection of fishing vessels either by geographical area, purpose or commercial ties that engages in the catching of wild fish
Food AccessThe availability of healthy and affordable food that is a part of the local culture or heritage.
Food DesertA food desert usually refers to a geographic area that lacks convenient and affordable access to a healthy food
Food EnvironmentA local system or community context associated with all aspects of food, from distribution to con-sumption. It includes places such as grocery stores, super markets, farmers markets, community gardens, food shelters, restaurants, schools, and worksites.
Food GroupThe grouping of foods that share nutrient or biological properties. The USDA Food Guide Pyramid defines 6 primary food groups: Cereals and carbohydrates: Bread, cereal, pasta, tortillas, whole grains; Vegetables; Fruits; Proteins: dry beans, nuts, eggs, poultry, fish, meats; Dairy: milk, yogurt, cheese; and Confections: fats, oils, sweets.
Food Guide A nutrition education tool that gives graphical recommendations on the type and quantity of food intake based on food groups in order to get a nutritionally adequate and wholesome diet.
Food InsecurityThe lack of reliable access to sufficient, healthy, and affordable food
Food LabelsThe label on a food package that provides information about its manufacturer and its nutritional content. Usually countries have food labelling guides that set minimum requirements for labelling of food or food products.
Food LiteracyThe ability to know the story of where one’s food comes from, usually described as from seed-to-table or farm-to-fork
Food MilesThe distance food travels from where it is grown or raised to where it is ultimately purchased by the consumer.
Food MovementA broad term describing individuals and groups taking initiative to ensure a resilient, safe, fair, and healthy food system for all
Food Policy Councils (FPC) Food policy councils are officially sanctioned bodies that are involved in improving local food systems by providing recommendations. They contain all relevant stakeholders from citizens to government officials
Food PolicyOfficial principles and guidelines covering food production, distribution, and consumption
Food ProductionConsists of all the relevant activities related to the growing food in farms, orchards, greenhouses, fish farms, or water bodies. Includes natural input, human labour, technology, energy, and other man-made inputs
Food Securitythe World Food Summit of 1996 defined food security as existing “when all people at all times have access to sufficient, safe, nutritious food to maintain a healthy and active life”.
THE GLOBAL FOOD SYSTEM: AN ANALYSIS 175
GLOSSARY
Food SovereigntyLa Via Campesina defines achieving food sovereignty when communities democratically control what they eat, how it is raised and by whom, and how profits in the food system are distributed. Food sovereignty encompasses the rights to food, adequate nutrition and resources necessary for each person to be able to feed him or herself with dignity and in culturally appropriate ways. Fulfilling these rights requires community action to overcome barriers imposed on some people be-cause of gender, income, race, religion and class. Under conditions of food sovereignty, food is produced using sustainable practices and never used as a weapon or denied because of social conflict.
Food SystemA holistic term that includes all the parts of the system that provides food to a community, including growing, harvesting, storing, transporting, processing, packaging, marketing, retailing, and consuming the product. The different parts of the system can be local, regional or global depending on where the food comes from.
Food Systems Council (FSC)Food Systems Council are a grassroots network consisting of non-profit organizations, grassroots groups and activists focused on educating the public, coordinating activities and influencing institutional practices and policies on food systems. They differ from Food Policy Councils in the sense that are not official advisory bodies
Forest Forest Forest Forest mimics the ecological aspects of a real forest with the exception that most of the plants, shrubs and trees contained in a food forest provide edible food for humans
Fossil fuel Fossil fuel is a generic term for carbon based, non-renewable natural energy sources such as coal, natural gas and oil
Free RangeFree-range, free-roaming, and pastured are terms used for cattle, pigs and chicken and imply that a product comes from an animal that was raised unconfined and free to roam. However, free-range claims on beef and eggs are unregulated as the USDA requires that animals have access to the outdoors but no regulations on the amount of time actually spent outdoors
Genetically Modified Organisms (GMOs)Living organisms including both plants and animals whose genetic make-up has been altered to exhibit traits that they normally do not have, such as drought resistance, addition of vitamins or minerals, changes in colour, or resistance to herbicides. Genetic modification is currently allowed in conventional farming. FAO/ WHO have guidelines for the risk assessment of all genetically modified food before they are allowed on the market.
Global Food SystemSimilar to a Food System, a global food system incorporates all aspects of food production to consumption, but focuses on the influences of trade and globalization worldwide on the availability and affordability of food.
Good agricultural and environmental conditions Good agricultural and environmental conditions refer to a set of EU standards (described in Annex III of Council Regulation 73/2009) defined at national or regional level, aimed at promoting sustainable agriculture.
Good Agricultural Practices (GAP) GAP is an approach based on general sustainability principles and best practices that apply locally available knowledge to on-farm production and post-production processes, with the goal of producing safe and quality food and non-food agricultural products.
Global warming potential (GWP) Global warming potential is a term used to describe the overall climate impacts of a greenhouse gas in terms of carbon dioxide equivalents
Grass Farming/Grass-based FarmingGrass-based production relies on pasture or rangeland to supply the food requirements of live-stock. Producers that use this practice replace part of or the entire diet of the animal to grazing or forage feeding.
Greenhouse gas Greenhouse gases are a group of heat trapping gases that contribute to climate change. The Kyoto Protocol, an environmental agreement adopted by many of the parties to the United Nations Framework Convention on Climate Change (UNFCCC) in 1997 to curb global warming, covers six greenhouse gases: carbon dioxide (CO2); methane (CH4); nitrous oxide (N2O); hydrofluorocarbons (HFCs); perfluorocarbons (PFCs); sulphur hexafluoride (SF6)
176
Gross domestic product (GDP) GDP is a quantitative measure of a country’s overall economic activity. It measures the monetary value of goods and services produced in the country over a year including taxes and minus subsidies
Gross value added Gross value added is the difference between the monetary values of a product at output versus intermediate consumption. It a term to balance a nation’s accounts
GrowingIn the food system, growing refers to growing plants, fish or animals for di-rect or indirect human consumption. For plants, it includes the process of pre-paring the soil, sowing, and maintaining the crop to be harvested in a healthy state. Growing techniques vary depending on the region, culture and climate.
Growing SeasonThe period of time required by a plant to grow from sowing to harvesting
HarvestingHarvesting is a process of reaping a plant or plant product (such as fruits, vegetables or grains) from the soil. A variety of harvesting methods are used across the world from hand picking to large machinery that can harvest large tracts of land simultaneously.
Health claimsAny statement made about food related to human health
HealthThe World Health Organization defines health as a state of complete physical, mental, and social well-being, not merely just the absence of disease or infirmity.
HeirloomHeirloom crop varieties, also known as farmers’ varieties or traditional varieties, are edible plants that have been developed by farmers over the last 50 years or more by cultivation, selection, and seed saving, and are passed down through generations.
HydroponicsGrowing vegetables and fruits without soil with nutrients added in water washing over the roots of the plants.
Industrialized Food SystemA modern, commercial food production system that usually represents large-scale farming and vertically integrated food production businesses. It is often criticized for its undesirable effects on the environment, on food quality, human health and society.
Input An input is something introduced into a system or expended in its operation to attain a result or output.
Institutional Decision-makersIn the food system, this refers to individuals with power over food and food related systems, be-longing usually to a public, educational or charitable organization
Integrated pest managementIntegrated pest management is an ecologically based approach to pest (animal and weed) control that is effective and environmentally sensitive. It includes practices such as: use of resistant or certified seed varieties; crop rotation; optimal use of biological control organisms; protective seed treatments; disease-free transplants or rootstock; timeliness of crop cultivation; improved timing of pesticide applications; and removal or ‘plow down’ of infested plant material.
Land use Land use refers to the use of land for social or economic purposes, such as residential, industrial, agricultural, forestry, recreational, and transport purposes.
Life Cycle Assessment (LCA) A quantification of the amount of inputs (energy and raw materials) as well as outputs (solid, liq-uid and gaseous wastes) produced at every stage of a product – from manufacturing to disposal. LCAs can be conducted for part of a process , the whole process, or an entire organization.
THE GLOBAL FOOD SYSTEM: AN ANALYSIS 177
GLOSSARY
Liquid manure Liquid manure is urine, dung or other organic or chemical material obtained from domestic animals that is used to fertilize soil
Live weight of fishery products Live weight of fishery products is the actual weight of all marine catch before being subjected to any processing or other operations. Livestock density index
The livestock density index measures the number of animals per hectare of land. It is an indicator that helps analyse the pressure of livestock farming on the environment. However, as the actual impact of livestock on the environment depends not only on the amount of livestock but also on the farming practices used, the livestock density index is not sufficient in measuring the amount of environmental degradation.
Livestock unit Eurostat defines livestock unit as a reference unit which facilitates the aggregation of livestock from various species and age as per convention, via the use of specific coefficients established initially on the basis of the nutritional or feed requirement of each type of animal. The reference unit used for the calculation of livestock units (=1 LSU) is the grazing equivalent of one adult dairy cow producing 3 000 kg of milk annually, without additional concentrated foodstuffs.
Livestock-specialist holding An agricultural holding mainly focusing livestock production, and where livestock provide a minimum of two thirds of the production or the business size of an agricultural holding, as defined by Eurostat.
Locally-GrownA broad term referring in general to the proximity of the production and processing of food and other agricultural products. There are no guidelines that define the distance of locally grown and thus it can cover a city, nation or region depending on the particular context.
Meat production Meat production refers to the slaughter of animals for human consumption, such as cows, pigs, sheep and goats. It is usually carried out in slaughterhouses and farms,
Milk Farms Milk farms are farms that produce milk to distribute to dairies as well as for domestic consumption, direct sale and cattle feed.
Mixed-farming holding A mixed-farming holding is an agricultural holding that is equally involved in livestock and crop production. A farm is known as a mixed farm if both activities are less than two thirds of the production or business size.
Natural ResourcesNatural resources are inputs derived from the earth that are used for human activities (basic sur-vival or commercial). They include soil, water, air, and fossil fuels
Non-family labourThe non-family labour force of an agricultural holding consists of all people other than the holder and his or her family members that perform work on the farm for monetary or other compensa-tion.
Organic FarmingOrganic farming in general refers to an agricultural process that avoids or largely excludes the use of synthetically produced chemical inputs for food and animal production. It is a term that lacks a consistent definition and can include some or all of the following: compounded fertilizers, pesti-cides, growth regulators, and livestock feed additives.
OutputAn output is something that is produced by a system. Within the food system, outputs can be desirable products, such as crops from a farm system, or unde-sirable, such as nitrogen run-off from fertilizers used on a farm.
Packaging Packaging refers to a step in the food system where food is wrapped or put into containers for protection during transportation and for distribution to stores and markets.
PermacultureBill Mollison defines permaculture as a philosophy of working with, rather than against nature; of protracted & thoughtful observation rather than protracted & thoughtless labour; & of looking at plants & animals in all their functions, rather than treating any area as a single-product system.
Perennial
A plants that lives for more than two years

178
Permanent crops Permanent crops are trees or shrubs that occupy a given piece of land for a long time (usually more than five) consecutive years. They usually consist of fruit trees, bushes, vines and olive trees
Permanent grassland and meadow Permanent grassland and meadow is land used to grow herbaceous forage crops, through cultivation (sown) or naturally (self-seeded) for a minimum period of five years. This land is usually used for livestock grazing or fodder
ProcessingProcessing is a step in the food system where a series of operations are per-formed on food in order to change it or preserve it. Food processing is a broad definition and includes a variety of methods such as, cutting, freezing, boil-ing, canning, etc and is performed for a variety of uses. For example, a pro-cessing plant may receive apples to process into applesauce or apple juice, or milk is pasteurized and standardized before being sold in the supermarket.
RetailingRetailing is a step in the food system where food and food products are made available to the consumers in a store or market.
Serving sizeServing size refers to the amount of food people actually eat. It is a uniform term often used for reporting a food’s nutrient content and suggested portion.
Shelf life The amount of time a food will remain fit for human consumption and/or sellable
Slurry Slurry is manure in liquid form, that is to say a mixture of excrements and urine of domestic animals, including possibly also water and/or a small amount of litter.
Solid dung Solid dung, including farmyard manure, is excrement, with or without litter, of domestic animals including possibly a small amount of urine.
Sustainable AgricultureAn agricultural practice that addresses the ecological, economic and social aspects of agriculture. It has three main goals: ensuring that agricultural activities protect the environment and ensure animal welfare; the farm operates profitably and produces goods (food) that are good for public health.
System System is an interdependent group of items that form a unified whole. A system is a group of in-teracting, interrelated, and oftentimes interdependent elements that function together as a com-plex, unified whole. A core concept is that a change in one element of a system has an impact, ei-ther directly or indirectly, on one or more additional elements in that system. Systems theory pro-vides a holistic perspective for examining the boundaries of a related set (or sets) of elements, de-lineating subsystems, considering relationships among subsystems, and exploring the tendency toward a stable state of equilibrium (Sobal et al, 1998). Systems theory rejects the idea that com-ponents of any system should be, indeed can be, treated or considered in isolation from other re-lated components or elements of the system. The focus is on relationships or processes at various levels within a system (Buckley, 1967).
Transporting or TransportationTransportation is an intermediate step in the food system that refers to moving food or food products from one area to another. Transportation can be done by air (airplanes), land ( truck or train) or sea (ships and barges).
Value-Added ProductIn an agricultural context, it refers to change in the physical state or form of a raw agricultural product by converting it into a product with a higher market value or longer shelf life. For exam-ple, fruits made into pies or jams
THE GLOBAL FOOD SYSTEM: AN ANALYSIS 179
GLOSSARY
AEI agri-environmental indicators
CAP Common Agricultural Policy
CFP Common Fisheries Policy
CH4 methane
CO2 carbon dioxide
COM Communication
CMO Common Market Organisation
EAA economic accounts for agriculture
EC 1 .European Community 2. European Commission
EEA European Environment Agency
EEC European Economic Community
EFTA European Free Trade Association
EU European Union
ESOEU Eurostat Statistical office of the European Union
FAO Food and Agriculture Organization
FAOSTAT Food and Agriculture Organization Statistics Department
FCR Feed Conversion Ratio
GDP Gross Domestic Product
HICP harmonised index of consumer prices
INGO International Non-Governmental Organization
IPPC integrated pollution prevention and control
IMF International Monetary Fund
IPCC Intergovernmental Panel on Climate Change
LDC Least Developed Countries
MSC Marine Stewardship Council
N2 nitrogen
N2O nitrous oxide
NH3 ammonia
NH4 ammonium
NL Netherlands
NO3 nitrate
NGO Non-Governmental Organization
NUTS classification of territorial units for statistics (NUTS levels 1, 2 and 3) SAPM survey on agricultural production methods
SAP Structural Adjustment Program
SME Small and Medium Enterprises
TTIP Transatlantic Trade and Investment Partnership
UNDP United Nations Development Programme
UNECE United Nations Economic Commission for Europe
UNEP United Nations Environment Programme
UNFCCC United Nations Framework Convention on Climate Change
US United States of America
WFP World Food Programme
WHO World Health Organization
WTO World Trade Organization
WWF World Wide Fund for Nature
ABBREVIATIONS