metabolic disturbances identified in plasma are associated with ... · manuscript received november...
TRANSCRIPT
J O U R N A L O F T H E AM E R I C A N C O L L E G E O F C A R D I O L O G Y V O L . 6 5 , N O . 1 5 , 2 0 1 5
ª 2 0 1 5 B Y T H E AM E R I C A N C O L L E G E O F C A R D I O L O G Y F O U N DA T I O N I S S N 0 7 3 5 - 1 0 9 7 / $ 3 6 . 0 0
P U B L I S H E D B Y E L S E V I E R I N C . h t t p : / / d x . d o i . o r g / 1 0 . 1 0 1 6 / j . j a c c . 2 0 1 5 . 0 2 . 0 1 8
Metabolic Disturbances Identified inPlasma Are Associated With Outcomesin Patients With Heart Failure
Diagnostic and Prognostic Value of MetabolomicsMei-Ling Cheng, PHD,*yz Chao-Hung Wang, MD, PHD,x Ming-Shi Shiao, PHD,*yz Min-Hui Liu, MSN,xkYu-Yen Huang, MS,x Cheng-Yu Huang, BS,* Chun-Tai Mao, MD,x Jui-Fen Lin, MS,* Hung-Yao Ho, PHD,*{Ning-I Yang, MDx
ABSTRACT
Fro
Gu
Ta
Ke
Mi
sit
Gu
EM
Lis
Yo
Ma
BACKGROUND Identification of novel biomarkers is needed to improve the diagnosis and prognosis of heart failure
(HF). Metabolic disturbance is remarkable in patients with HF.
OBJECTIVES This study sought to assess the diagnostic and prognostic values of metabolomics in HF.
METHODS Mass spectrometry–based profiling of plasma metabolites was performed in 515 participants; the discovery
phase study enrolled 51 normal control subjects and 183 HF patients, and the validation study enrolled 63 control
subjects and 218 patients with stage C HF. Another independent group of 32 patients with stage C HF who recovered to
New York Heart Association functional class I at 6 and 12 months was profiled as the “recovery” group.
RESULTS A panel of metabolites, including histidine, phenylalanine, spermidine, and phosphatidylcholine C34:4, has a
diagnostic value similar to B-type natriuretic peptide (BNP). In the recovery group, the values of this panel significantly
improved at 6 and 12 months. To evaluate the prognostic values, events were defined as the combined endpoints of
death or HF-related re-hospitalization. A metabolite panel, which consisted of the asymmetric methylarginine/arginine
ratio, butyrylcarnitine, spermidine, and the total amount of essential amino acids, provided significant prognostic values
(p < 0.0001) independent of BNP and traditional risk factors. The prognostic value of the metabolite panel was better
than that of BNP (area under the curve of 0.85 vs. 0.74 for BNP) and Kaplan-Meier curves (log rank: 17.5 vs. 9.95). These
findings were corroborated in the validation study.
CONCLUSIONS Metabolomics demonstrate powerful diagnostic value in estimating HF-related metabolic distur-
bance. The profile of metabolites provides better prognostic value versus conventional biomarkers. (J Am Coll Cardiol
2015;65:1509–20) © 2015 by the American College of Cardiology Foundation.
A complex clinical syndrome, heart failure (HF)represents the end stage of various cardiacdiseases. In the past few decades, substantial
advances have been made in understanding the un-derlying pathophysiology and hemodynamics of HF,
m the *Healthy Aging Research Center, Chang Gung University, Tao-Yu
ng University, Tao-Yuan, Taiwan; zDepartment of Biomedical Sciences, Co
iwan; xHeart Failure Research Center, Division of Cardiology, Department o
elung, Taiwan, and Chang Gung University College of Medicine, Taoyua
ng University, Taipei, Taiwan; and the {Department of Medical Biotechn
y, Tao-Yuan, Taiwan. This study was supported in part by the National Sc
ng Memorial Hospital (CMRPG2C0312, CMRPD1A0522), and the Mini
RPD1D0941). The authors have reported that they have no relationships
ten to this manuscript’s audio summary by JACC Editor-in-Chief Dr. Vale
u can also listen to this issue’s audio summary by JACC Editor-in-Chief D
nuscript received November 4, 2014; revised manuscript received Januar
leading to the development of novel pharmaceu-ticals and interventional therapies. Nevertheless,short- and long-term, HF-related hospitalizationand mortality remain high, requiring substantialamounts of health care resources (1). The limited
an, Taiwan; yMetabolomics Core Laboratory, Chang
llege of Medicine, Chang Gung University, Tao-Yuan,
f Internal Medicine, Chang Gung Memorial Hospital,
n, Taiwan; kDepartment of Nursing, National Yang-
ology and Laboratory Science, Chang Gung Univer-
ience Council of Taiwan (102-2314-B-182-037), Chang
stry of Education of Taiwan (EMRPD1C0331 and
relevant to this paper to disclose.
ntin Fuster.
r. Valentin Fuster.
y 20, 2015, accepted February 8, 2015.

ABBR EV I A T I ON S
AND ACRONYMS
ACC = American College of
Cardiology
AHA = American Heart
Association
AUC = areas under the curve
BNP = B-type natriuretic
peptide
HF = heart failure
NO = nitric oxide
OPLS-DA = orthogonal-
projection-to-latent-structure–
discriminant-analysis
VIP = variable importance in
the projection
Cheng et al. J A C C V O L . 6 5 , N O . 1 5 , 2 0 1 5
Metabolomics-Based Biomarkers in Heart Failure A P R I L 2 1 , 2 0 1 5 : 1 5 0 9 – 2 0
1510
effectiveness of current treatments for late-stage HF necessitates novel interventionalmeasures to curb maladaptive molecularprocesses and avoid the progression of HFto advanced stages.
A variety of HF biomarkers have beenidentified, with B-type natriuretic peptide(BNP) and the N-terminal fragment of theproprotein, emerging as clinically usefulmarkers for the diagnosis and prognosis of HF(2,3). Natriuretic peptides also have prog-nostic value for individuals atmoderate risk ofcardiovascular disease without overt symp-toms (4). Unfortunately, these biomarkersdo not provide additional information onmolecular targets for therapeutic interven-
tions. In addition, application of a single biomarkermay be insufficient for evaluating patients with HF; acombination of multiple molecules may be better forsuch an evaluation.
SEE PAGE 1521
The etiology of a substantial proportion of HF pa-tients remains unexplained according to the currentknowledge of cardiovascular risk factors. Regardlessof the heterogeneous etiologies, HF development iscausally related to the heart’s inability to meet themetabolic demands of the body. The accompanyingchanges in global metabolism—sometimes referred toas a “metabolic storm”—suggest a clinical applicationof an HF-specific metabolome for diagnostic andprognostic purposes. The current staging of HF is onthe basis of the consensus developed by the AmericanCollege of Cardiology (ACC) and the American HeartAssociation (AHA), instead of pathogenic mechanisms(5). Taking advantage of the high throughput and thepotential of developing multiple biomarkers, metab-olomics is a platform for identifying metabolic sig-natures in patients with pre-HF to those withadvanced HF, independent of traditional risk factors.A thorough understanding of HF-associated meta-bolic perturbation, together with advances in nutri-genomic research, might permit the development ofpersonalized preventive measures.
Previously, on the basis of analysis of urine sam-ples from a limited number of patients, Kang et al. (6)showed that concentrations of 1-methylnicotinamide,2-oxoglutarate, and pyruvate were lower in pa-tients with ischemic HF, but that concentrations ofacetate, ketone bodies, cytosine, methylmalonate,and phenylacetylglycine were all higher. Anotherstudy identified pseudouridine and 2-oxoglutarate as2 biomarkers of HF (7). In the present study, werecruited more HF patients and examined the clinical
applicability and significance of plasma metabolomicanalysis in the diagnosis and prognosis of HF. We alsosought to determine whether metabolomic analysisprovides sensitive evaluation of HF at differentstages and in disease regression after therapeuticinterventions.
METHODS
PATIENTS AND STUDY DESIGN. For the discoveryphase study, patients at HF stages B and C wereenrolled from January 2011 to December 2012. Pa-tients at stage A HF and normal control subjects werethen enrolled from October 2011 to December 2012.HF stages A, B, and C were classified according to theACC/AHA HF classification system (5). Stage C pa-tients were those hospitalized due to acute ordecompensated chronic HF and ages 20 to 85 years.Exclusion criteria included the following: 1) thepresence of systemic disease, such as hypothyroid-ism, decompensated liver cirrhosis, and systemiclupus erythematosus; 2) the presence of disordersother than HF that might compromise 6-month sur-vival; 3) patients who were bedridden for >3 monthsand/or unable to stand alone; 4) patients with a serumcreatinine of >3 mg/dl; and 5) patients with severecoronary artery disease without complete revascu-larization therapy. Informed consent was obtainedfrom all patients. The study was designed and carriedout in accordance with the principles of the Declara-tion of Helsinki and with approval from the EthicsReview Board of Chang Gung Memorial Hospital.
The validation phase study set was composed ofanother independent population that included 63normal control subjects and 218 patients at stage C HFwho were recruited from July 2011 to May 2013.(Online Figure 1 depicts the study flow).
UNTARGETED METABOLIC ANALYSIS. Liquid chro-matographic separation for processed plasma wasachieved on a 100 � 2.1 mm Acquity 1.7-mm C8 column(Waters Corp., Milford, Massachusetts) using anACQUITY TM UPLC system (Waters Corp.). The eluentwas analyzed via high-definition, time-of-flight massspectrometry (MS) (SYNAPT G1, Waters Corp.) oper-ating in electrospray ionization-positive ion mode.Raw mass spectrometric data were processed usingMassLynx V4.1 and MarkerLynx software (WatersCorp.). The multivariate data matrix was analyzed bySIMCA-P software (version 13.0, Umetrics AB, Umea,Sweden).
STATISTICAL ANALYSES. Results are expressed asthe mean � SD for continuous variables and as thenumber (percent) for categorical variables. Data werecompared by 2-sample or paired Student’s t tests,

J A C C V O L . 6 5 , N O . 1 5 , 2 0 1 5 Cheng et al.A P R I L 2 1 , 2 0 1 5 : 1 5 0 9 – 2 0 Metabolomics-Based Biomarkers in Heart Failure
1511
analysis of variance, and chi-square test, whenappropriate. Metabolomics analysis was performedusing several software programs. Data import andpre-processing steps for targeted MS data weredone using TargetLynx (Waters Corp.). The integratedMetIDQ software (Biocrates, Innsbruck, Austria)was applied to streamline data analysis by auto-mated calculation of metabolite concentrations. Tomaximize identification of differences in metabolicprofiles between groups, the orthogonal-projection-to-latent-structure–discriminant-analysis (OPLS-DA)model was applied using the SIMCA-P software(version 13.0, Umetrics AB). The variable importancein the projection (VIP) value of each variable in themodel was calculated to indicate its contributionto the classification. A higher VIP value representeda stronger contribution to discrimination amonggroups. VIP values >1.0 were considered significantlydifferent. Logistic regression analysis was used fordiagnosis of HF. Odds ratios and 95% confidenceintervals were calculated.
Follow-up data were collected as scheduled or atthe last available visit. Cox proportional hazardmodels were used to determine independent pre-dictors of the first defined events (death or HF-relatedre-hospitalization) after controlling for covariates.Hazard ratios and 95% confidence intervals were alsocalculated. All statistical analyses were 2-sided andperformed using SPSS software (version 15.0, SPSS,Chicago, Illinois). A p value of <0.05 was consideredsignificant.
Detailed methods are provided in the OnlineAppendix.
RESULTS
A total of 515 participants included 114 normal controlsubjects and 401 patients. The discovery phase in-cluded 234 participants, including 51 normal controlsubjects and 183 HF patients at stages A (n ¼ 43), B(n ¼ 67), and C (n ¼ 73) (Online Figure 1). Baselinecharacteristics and laboratory data are shown inTable 1. A significant trend of changes was noted inmost of the variables for the normal control subjectsto patients at HF stages A, B, and C. Compared withthe normal control subjects, stage C patients hadremarkably higher BNP levels and a wider QRS com-plex, but they also had lower levels of total choles-terol, low- and high-density lipoprotein cholesterol,sodium, hemoglobin, albumin, and in the estimatedglomerular filtration rate. Although there were nosignificant differences in age among the patientgroups, HF patients were older than the normal con-trol subjects. In addition, the percent of men was
higher in the patient groups. Coronary artery diseasewas the major HF etiology for study patients. Thevalidation phase study included 63 normal controlsubjects and 218 stage C HF patients; the related de-mographic characteristic data are shown in OnlineTable 1.
Initially, for the untargeted metabolomics analysis,119 plasma samples, from 51 normal control subjectsand 68 stage C HF patients from the 234 discoveryphase participants, were examined (Online Figure 1).In the metabolomic profiling, 897 positive-mode fea-tures were identified and applied for SIMCA-P anal-ysis. The OPLS-DA score plot and loading plot showedremarkable separation between the control subjectsand stage C HF patients (Online Figure 2). The resultsof untargeted analysis revealed amino acids andphospholipids to be important discriminators be-tween the normal control subjects and stage C HFpatients. Therefore, stable isotope dilution-multiplereaction monitoring MS was performed in all 234participants to quantify amino acids, biogenicamines, acylcarnitines, and phospholipids in both thediscovery phase and validation groups.
To test whether metabolites could discriminate pa-tients from control subjects, plasma from 51 normalcontrol subjects and from 73 stage C HF patients inthe discovery phase study were subject to targetedmetabolite analysis, and datasets were analyzed by theOPLS-DA model. The OPLS-DA score plots demon-strated considerable separation between the normalcontrol subjects and the stage C HF patients in the firstprincipal component (Figure 1A; x-axis, called t[1]),which probably reflected the HF-related pathologicalvariations between the subjects. The metabolites res-ponsible for the discrimination between these 2 groups(those with VIP >1.5) are listed in Table 2 and OnlineTable 2. This model (i.e., the “training set”) was thenused to estimate HF status in the following analyses.The calculated value of this model is called tPS[1].
Figure 1B is the score plot of data corresponding tothe age-matched control subjects (n ¼ 51) and stage CHF patients (n ¼ 50) in the discovery phase study,whose demographic characteristic data are shown inOnline Table 3. The distribution of the data in thescore plots was similar to that shown in Figure 1A,suggesting that discrimination of the 2 groups wasindependent of age. On the basis of this training set,patients at stage A (n ¼ 43) and stage B (n ¼ 67) werecalculated by tPS[1] (Figures 1C and 1D, respectively).The score plots of stage B patients showed that thedata spanned the regions over the stage C HF patientsand the normal control subjects, suggesting the het-erogeneity of stage B as defined by the AHA/ACCcriteria.

TABLE 1 Patient Characteristics in the Discovery Phase Study
Control Subjects(n ¼ 51)
Stage A(n ¼ 43)
Stage B(n ¼ 67)
Stage C(n ¼ 73) p Value for Trend
Age, yrs 55.2 � 4.4 60.1 � 10.8 59.9 � 12.8 64.1 � 12.8 <0.001
Male 19 (37.3) 35 (81.4) 57 (85.1) 41 (56.2) 0.073
LVEF 72.3 � 8.0 70.1 � 8.9 50.5 � 14.1 37.2 � 15.6 <0.001
Blood pressure, mm Hg
Systolic 125.7 � 15.7 124.3 � 16.8 123.4 � 19.9 124.7 � 19.7 0.742
Diastolic 75.6 � 12.1 76.7 � 11.8 77.1 � 12.8 72.0 � 12.5 0.156
Heart rate, beats/min 72.3 � 11.3 76.7 � 11.3 73.6 � 9.2 79.5 � 14.1 0.006
Comorbidity
Diabetes mellitus 0 (0) 18 (41.9) 22 (32.8) 38 (52.1) <0.001
Chronic kidney disease 0 (0) 11 (25.6) 16 (23.9) 27 (37) <0.001
Hypertension 0 (0) 31 (72.1) 48 (71.6) 54 (74.0) <0.001
Atrial fibrillation 0 (0.) 3 (7.0) 7 (10.4) 21 (28.8) <0.001
COPD 0 (0) 3 (7.0) 2 (3.0) 12 (16.4) 0.002
Ischemic 0 (0) 31 (72.1) 59 (88.1) 44 (60.3) <0.001
Body mass index, kg/m2 24.4 � 3.3 26.1 � 4.2 25.8 � 4.3 24.9 � 4.6 0.601
Medication
ACEI or ARB 0 (0) 15 (34.9) 48 (71.6) 62 (84.9) <0.001
Beta-blocker 0 (0) 18 (41.9) 53 (79.1) 51 (69.9) <0.001
Digoxin 0 (0) 0 (0) 5 (7.5) 21 (28.8) <0.001
Diuretic agent 0 (0) 4 (9.3) 15 (22.4) 49 (67.1) <0.001
Statins 0 (0) 21 (48.8) 40 (59.7) 27 (37.0) <0.001
Fenofibrate 0 (0) 4 (9.3) 1 (1.5) 0 (0) 0.325
Statins/fenofibrate 0 (0) 23 (53.5) 41 (61.2) 27 (37.0) <0.001
OHA/insulin 0 (0) 15 (34.9) 21 (31.3) 29 (39.7) <0.001
Laboratory data
BNP, pg/ml 9.2 � 8.8 43.0 � 69.4 209.2 � 359.7 851.6 � 793.8 <0.001
Log (BNP) 0.88 � 0.23 1.34 � 0.49 1.94 � 0.60 2.71 � 0.52 <0.001
Cholesterol, mg/dl 214.7 � 35.5 175.1 � 43.0 182.3 � 41.9 169.2 � 58.6 <0.001
Triglyceride, mg/dl 99.2 � 55.9 186.3 � 110.3 138.4 � 100.6 120.2 � 68.6 0.762
LDL-C, mg/dl 139.2 � 30.1 104.3 � 37.8 112.9 � 39.8 108.1 � 52.1 0.001
HDL-C, mg/dl 55.3 � 12.9 39.5 � 11.3 42.2 � 13.3 38.6 � 17.8 <0.001
Serum sodium, mEq/l 140.4 � 1.3 138.5 � 3.0 139.3 � 2.2 138.6 � 4.1 0.006
Hemoglobin, g/dl 13.9 � 1.2 13.9 � 1.6 13.8 � 1.9 12.6 � 2.1 <0.001
Total bilirubin, mg/dl 0.8 � 0.3 0.8 � 0.3 0.8 � 0.4 1.1 � 0.6 0.001
Albumin, g/dl 4.4 � 0.2 4.1 � 0.3 3.9 � 0.3 3.5 � 0.6 <0.001
Hemoglobin A1c, % 5.7 � 0.3 6.6 � 1.4 6.5 � 1.4 6.7 � 1.5 <0.001
eGFR, ml/min/1.73 m2* 99.1 � 19.2 78.6 � 24.6 79.7 � 32.2 65.6 � 27.9 <0.001
QRS complex, ms 89.6 � 8.6 94.3 � 15.6 96.9 � 19.4 106.3 � 24.9 <0.001
Values are mean � SD or n (%). *Chronic kidney disease ¼ eGFR <60 ml/min/1.73 m2.
ACEI ¼ angiotensin-converting enzyme inhibitor; ARB ¼ angiotensin receptor blocker; BNP ¼ B-type natriuretic peptide; COPD ¼ chronic obstructive pulmonary disease;eGFR ¼ estimated glomerular filtration rate; HDL-C ¼ high-density lipoprotein cholesterol; LDL-C ¼ low-density lipoprotein cholesterol; LVEF ¼ left ventricular ejectionfraction; OHA ¼ oral hypoglycemic agents.
Cheng et al. J A C C V O L . 6 5 , N O . 1 5 , 2 0 1 5
Metabolomics-Based Biomarkers in Heart Failure A P R I L 2 1 , 2 0 1 5 : 1 5 0 9 – 2 0
1512
To discriminate between the patients at stage C HFand normal control subjects (diagnostic value), thereceiver-operating characteristic curves were plottedfor both BNP and t[1] (by taking all metabolites intothe principal component analysis) (Figure 1E). Theareas under the curves (AUCs) were 0.99 and 1.0,respectively. Notably, there were 4 important me-tabolites that significantly contributed to the diag-nostic value for HF, namely, histidine, phenylalanine,spermidine, and phosphatidylcholine C34:4 (onceknown as “lecithin”) (Table 3). These 4 metabolitesgave rise to an AUC of 0.99, which was better than
that of each metabolite alone (Figure 1E). On the basisof the training set composed of these 4 metabolites,the score plot (tPS[2]) distribution of the normalcontrol subjects and the stage C HF patients areshown in Figure 1F. The odds ratio of the BNP andtPS[2] levels for identifying stage C HF (vs. normalcontrol subjects) are presented in Table 3. The diag-nostic value of tPS[2] was independent of diabetesmellitus and other comorbidities. The targeted quan-titative analysis of the validation set revealed similardiagnostic levels for the 4-metabolite panel as observedin the discovery samples (Table 3, Online Table 4).
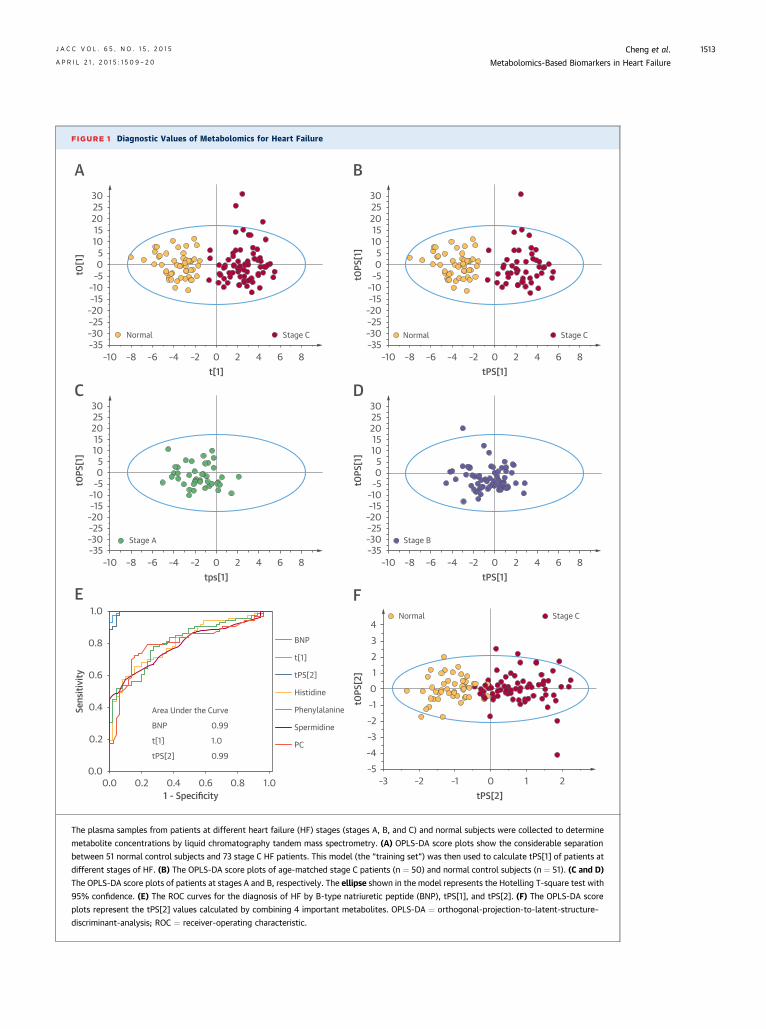
FIGURE 1 Diagnostic Values of Metabolomics for Heart Failure
3025201510
50
–5–10–15
–20–25–30–35
–10 –8 –6 –4 –2 0 2 4 6 8
t0[1
]
t[1]
Normal Stage C
A3025201510
50
–5–10–15
–20–25–30–35
–10 –8 –6 –4 –2 0 2 4 6 8t0
PS[1
]tPS[1]
Normal Stage C
B
3025201510
50
–5–10–15
–20–25–30–35
–10 –8 –6 –4 –2 0 2 4 6 8
t0PS
[1]
tps[1]
Stage A
C3025201510
50
–5–10–15
–20–25–30–35
–10 –8 –6 –4 –2 0 2 4 6 8
t0PS
[1]
tPS[1]
Stage B
D
4321
0–1–2–3–4–5
–3 –2 –1 0 21
t0PS
[2]
tPS[2]
Normal Stage C
F1.0
0.8
0.6
0.4
0.2
0.00.0 0.2 0.4 0.6 0.8 1.0
1 - Specificity
Sens
itivi
ty
Area Under the Curve
BNP
t[1]
tPS[2] 0.99
1.0
0.99
BNP
t[1]
tPS[2]
Histidine
Phenylalanine
Spermidine
PC
E
The plasma samples from patients at different heart failure (HF) stages (stages A, B, and C) and normal subjects were collected to determine
metabolite concentrations by liquid chromatography tandem mass spectrometry. (A) OPLS-DA score plots show the considerable separation
between 51 normal control subjects and 73 stage C HF patients. This model (the “training set”) was then used to calculate tPS[1] of patients at
different stages of HF. (B) The OPLS-DA score plots of age-matched stage C patients (n ¼ 50) and normal control subjects (n ¼ 51). (C and D)
The OPLS-DA score plots of patients at stages A and B, respectively. The ellipse shown in the model represents the Hotelling T-square test with
95% confidence. (E) The ROC curves for the diagnosis of HF by B-type natriuretic peptide (BNP), tPS[1], and tPS[2]. (F) The OPLS-DA score
plots represent the tPS[2] values calculated by combining 4 important metabolites. OPLS-DA ¼ orthogonal-projection-to-latent-structure–
discriminant-analysis; ROC ¼ receiver-operating characteristic.
J A C C V O L . 6 5 , N O . 1 5 , 2 0 1 5 Cheng et al.A P R I L 2 1 , 2 0 1 5 : 1 5 0 9 – 2 0 Metabolomics-Based Biomarkers in Heart Failure
1513

TABLE 2 Statistical Analysis of Targeted Metabolites* Between Control Subjects and Stage C Heart Failure Patients in the
Discovery Phase Study
Metabolite, mM VIP ScoreControl Subjects
(n ¼ 51)Stage C(n ¼ 73) p Value
Histidine 2.47 99.3 � 18.0 77.7 � 18.4 <0.001
Phenylalanine 2.29 57.4 � 8.9 76.9 � 22.6 <0.001
Ornithine/arginine 2.27 1.02 � 0.23 2.11 � 1.32 <0.001
Phosphatidylcholine diacyl C34:4 2.26 0.97 � 0.36 0.59 � 0.35 <0.001
Ornithine 2.13 56.9 � 18.7 84.0 � 32.5 <0.001
Phosphatidylcholine diacyl C36:2 2.12 226.4 � 58.4 172.9 � 52.4 <0.001
Octadecadienyl carnitine 1.99 0.053 � 0.034 0.105 � 0.070 <0.001
Phosphatidylcholine diacyl C36:1 1.98 44.8 � 11.1 35.3 � 10.2 <0.001
Log (glutamate) 1.95 1.28 � 1.03 1.68 � 1.12 <0.001
Phosphatidylcholine diacyl C36:0 1.89 4.98 � 1.16 3.85 � 1.43 <0.001
Spermidine 1.87 0.25 � 0.03 0.37 � 0.17 <0.001
Log (spermine) 1.84 –0.93 � 0.21 –0.63 � 0.39 <0.001
Phosphatidylcholine diacyl C40:5 1.83 9.32 � 3.25 6.97 � 2.60 <0.001
Phosphatidylcholine diacyl C36:6 1.83 0.91 � 0.46 0.56 � 0.39 <0.001
Phosphatidylcholine diacyl C33:3 1.80 0.23 � 0.06 0.17 � 0.07 <0.001
Citrulline/Ornithine 1.79 1.16 � 0.73 0.67 � 0.51 <0.001
Phosphatidylcholine diacyl C38:5 1.77 44.2 � 12.6 33.6 � 14.0 <0.001
Creatinine 1.72 103.9 � 41.6 185.3 � 135.5 <0.001
Phosphatidylcholine diacyl C36:3 1.69 94.0 � 21.5 78.1 � 21.1 <0.001
Sphingomyelin C20:2 1.68 1.12 � 0.29 0.87 � 0.35 <0.001
Phosphatidylcholine diacyl C38:3 1.68 31.1 � 8.5 24.9 � 8.2 <0.001
Phosphatidylcholine acyl-alkyl C38:6 1.65 7.10 � 2.28 5.52 � 2.14 <0.001
Putrescine/ornithine 1.64 0.008 � 0.005 0.005 � 0.003 0.001
Phosphatidylcholine acyl-alkyl C34:2 1.64 8.30 � 2.46 6.56 � 2.37 <0.001
Aromatic amino acids 1.62 163.9 � 24.6 193.3 � 49.8 <0.001
Hydroxybutyrylcarnitine 1.61 0.030 � 0.015 0.049 � 0.032 <0.001
Phosphatidylcholine diacyl C40:4 1.61 2.76 � 0.83 2.22 � 0.71 <0.001
Phosphatidylcholine acyl-alkyl C36:2 1.57 9.79 � 2.23 8.09 � 2.63 <0.001
Hexose 1.57 5,285 � 1,986 6,993 � 2,814 <0.001
Phosphatidylcholine acyl-alkyl C36:3 1.56 6.4 � 1.8 5.2 � 1.7 <0.001
Octadecenoylcarnitine 1.54 0.12 � 0.07 0.18 � 0.10 <0.001
Butrylcarnitine 1.52 0.23 � 0.06 0.35 � 0.23 <0.001
Values are mean � SD. *Includes metabolites with a VIP score >1.5.
VIP ¼ variable importance in the projection.
TABLE 3 Univariable and Multivariable Analyses of the Associations of BNP and Metabolites With Heart Failure Diagnosis
Discovery Phase Validation
Odds Ratio 95% CI p Value Odds Ratio 95% CI p Value
Univariable analysis
Log (BNP) (� 10–2) 1.09 1.03–1.14 0.001 1.04 1.03–1.06 <0.0001
Histidine, mM 0.93 0.91–0.96 <0.0001 0.88 0.84–0.92 <0.0001
Phenylalanine, mM 1.11 1.06–1.16 <0.0001 1.20 1.12–1.26 <0.0001
PC aa C34:4, mM � 10–1 0.76 0.67–0.85 <0.0001 0.78 0.71–0.85 <0.0001
Spermidine, mM � 10–1 6.64 2.98–14.79 <0.0001 22.74 6.94–74.49 <0.0001
tPS[2] (4 metabolites: histidine, phenylalanine,PC aa C34:4, spermidine) (� 10–1)
2.72 1.44–5.14 <0.0001 2.71 2.09–3.50 <0.0001
Multivariable analysis*
Log (BNP) (� 10–2) 1.16 1.01–1.34 0.048 1.08 1.03–1.12 <0.0001
tPS[2] (4 metabolites: histidine, phenylalanine,PC aa C34:4, spermidine) (� 10–1)
4.19 1.23–14.34 0.02 2.88 2.01–4.13 <0.0001
The range of tPS[2], values calculated by the combination of 4 metabolites, is from –2.5 to 2.65 (on the basis of logistic regression model). *Multivariable analysis adjustingfor age, sex, diabetes mellitus, chronic kidney disease, and hypertension.
CI ¼ confidence interval; PC aa ¼ phosphatidylcholines diacyl; other abbreviations as in Table 1.
Cheng et al. J A C C V O L . 6 5 , N O . 1 5 , 2 0 1 5
Metabolomics-Based Biomarkers in Heart Failure A P R I L 2 1 , 2 0 1 5 : 1 5 0 9 – 2 0
1514

J A C C V O L . 6 5 , N O . 1 5 , 2 0 1 5 Cheng et al.A P R I L 2 1 , 2 0 1 5 : 1 5 0 9 – 2 0 Metabolomics-Based Biomarkers in Heart Failure
1515
The metabolites that changed at different stagesare shown in Table 2 and Online Table 2. Thesemetabolites included amino acids, biogenic amines,and phospholipids. Compared with the control sub-jects, several plasma metabolites related to argi-nine metabolism, such as glutamine and citrulline,were lowered in stage C HF patients, but levelsof glutamate, ornithine, spermine, and spermidinewere elevated. Aromatic amino acids, such as tyro-sine and phenylalanine, were elevated in stageC HF patients, although levels of several phospha-tidylcholines were decreased, whereas taurine wasincreased. The metabolites with significant changeswere mapped onto 7 biochemical pathways (CentralIllustration).
To estimate the prognostic value of metabolomicsand BNP, the following analyses focused on HF pa-tients at stages B and C (n ¼ 140). During a follow-upof 1.3 � 0.8 years, there were 18 all-cause deaths and29 HF-related re-hospitalizations. To identify anypotential metabolic predictors of a composite ofall-cause death and HF-related re-hospitalization,extensive analyses on the whole metabolite datasetwere conducted. A combination of 4 metabolitecomponents (dimethylarginine/arginine ratio, sper-midine, butyrylcarnitine, and total essential aminoacid amount) gave rise to an optimal prognostic valuethat was remarkably better than BNP. The tPS[3] wascalculated from these 4 metabolite components andthe AUCs of receiver-operating characteristics curvesfor tPS[3], tPS[1], and BNP levels were 85%, 78%, and74%, respectively (Figure 2A). Table 4 and OnlineTable 5 show the Cox univariable and multivariableanalyses for these parameters on the prognosis. Theprognostic value of tPS[3] was still highly significanteven after adjusting for BNP levels, age, left ventric-ular ejection fraction, diabetes mellitus, chronic kid-ney disease, and hypertension. The validation studyreconfirmed these findings (Table 4, Online Table 5,Figure 2D).
The mean of tPS[3] (2.9, range 0.04 to 5.63) was setas the cutoff value for the prognostic prediction. InFigure 2B, the Kaplan-Meier curves revealed that atPS[3] of $2.9 at pre-discharge was associated witha higher composite of HF-related re-hospitalizationand all-cause death (log rank ¼ 17.5; p < 0.0001 ). Incomparison, the Kaplan-Meier curves of patientscategorized according to BNP (cutoff value set at 350pg/ml) (8) are shown in Figure 2C (log rank ¼ 9.9;p ¼ 0.002). The targeted quantitative analysis for the4 metabolite components of the validation phase setrevealed better prognostic levels than BNP thanthat observed in the discovery samples (Figures 2Dto 2F).
The correlation between tPS[2] and BNP levels wasmodest (r ¼ 0.53; p < 0.001) (Figure 3A). To verify thediagnostic value of tPS[2], metabolomics analysis,together with BNP measurement, was also performedin 32 patients (22 men and 10 women; age 54 �11 years) who were recruited earlier than thisstudy’s enrollment period. These patients, named the“recovery” group, were initially hospitalized due toacute or decompensated chronic HF, but then theyimproved to New York Heart Association functionalclass I and survived for >1 year. Plasma was analyzedbefore discharge and again at 6 and 12 months post-discharge. The serial changes in tPS[2] and BNPvalues are shown in Figure 3B. The tPS[2] values forthe 32 patients at pre-discharge stage were signifi-cantly higher than those of the normal control sub-jects (p < 0.001). Compared with pre-discharge levels,both the values of tPS[2] and BNP remarkablydecreased at 6 months and remained steady at 12months after discharge (p < 0.001).
DISCUSSION
In the present study, we demonstrated that metab-olomics is a promising tool for the diagnosis andprognosis of HF. Plasma concentrations of metabo-lites, such as histidine, phenylalanine, ornithine,spermine, spermidine, phosphatidylcholines, andtaurine, show significant differences among patientsat different stages of HF. Combinations of metabolitesare as good as the conventional biomarker BNP fordiagnosis and better than BNP for prognosis. Thevalue of estimating metabolic profiles in HF is farbeyond diagnosis only, as demonstrated in the vali-dation study. In contrast, the common changes inplasma metabolites identified in HF patients withdifferent etiologies suggest that HF development mayinvolve a universal metabolic disturbance relatedto HF-associated dysfunction in multiple organs(9). A number of pathways, namely, the glutamate-ornithine-proline pathway, polyamine synthesis,and phosphatidylcholines synthesis, may be spe-cifically affected during HF progression (CentralIllustration).
The key metabolites that show significant differ-ences in abundance between stages C and A HF,between stage C HF and normal control subjects, andbetween the acute phase and 6 or 12 months laterin the recovery group are histidine, phenylalanine,spermidine, and phosphatidylcholine C34:4. Thesemetabolites are mapped to biochemical pathways(Central Illustration). Anomalous fluxes through thesemetabolic pathways may show the interplay be-tween metabolism in multiple tissues and organs and

CENTRAL ILLUSTRATION Metabolic Pathways Implicated in HF Pathogenesis
Proline
Krebscycle
Fumarate
NO
Spermine
Taurine
Arginine
Ornithine
Spermidine
Citrulline
GlycinePhosphatidylcholine
MethionineSAM
Tyrosine
Phenylalanine
Glutamate
HistidineArginineGlutamine
-KG
BH4
GAA
Hcy
NH4
Urea
Pathways Up-RegulatedPathways Down-Regulated
Frames of Pathways Involved
Metabolites IncreasedMetabolites DecreasedMetabolites Not ChangedMetabolites Not Measured
Cardiac Output DeclineVenous Congestion
Responses of Body Cellsand Organs
Disturbed MetabolicPathways
Specific Pattern ofMetabolites in Blood
Biomarkers for Heart Failure
Blood
Heart Failure
d e
c
f
a
b
g
Cheng, M-L. et al. J Am Coll Cardiol. 2015; 65(15):1509–20.
(Top) The proposed scheme indicates that the decrease in cardiac output leads to disturbances of the metabolic pathways and the appearance of specific metabolites in
the circulation of heart failure (HF) patients. These metabolites probably serve as biomarkers for HF. (Bottom) Disturbances occur in the following metabolic pathways:
(a) urea cycle, (b) biopterin cycle, (c) MTA/methionine cycle, (d) ornithine-proline-glutamate, (e) polyamine synthesis, (f) methylation (phosphatidylcholine), and
(g) transsulfuration (taurine) in HF patients. Metabolites marked in salmon, blue, black, and gray indicate metabolites, the abundance of which significantly increased,
significantly decreased, remained unchanged, and were not measured, respectively. a-KG ¼ alpha-ketoglutarate; BH4 ¼ tetrahydrobiopterin; GAA ¼ guanidinoacetate;
Hcy ¼ homocysteine; MTA ¼ 5-methylthioadenosine; NO ¼ nitric oxide; PE ¼ phosphatidylethanolamine; SAM ¼ S-adenosylmethionine.
Cheng et al. J A C C V O L . 6 5 , N O . 1 5 , 2 0 1 5
Metabolomics-Based Biomarkers in Heart Failure A P R I L 2 1 , 2 0 1 5 : 1 5 0 9 – 2 0
1516

TABLE 4 Univariable Analysis on Prognostic Value in HF Patients
Discovery Phase Validation
HR 95% CI p Value HR 95% CI p Value
Log (BNP) (� 10–1) 1.12 1.06–1.21 0.003 1.06 1.01–1.12 0.034
t[1] (� 10–1) 1.86 1.30–2.65 0.001
tPS[2] (� 10–1) 1.98 1.43–2.74 <0.0001
Total DMA/arginine ratio, mM 1.85 1.49–2.29 <0.0001 1.42 1.05–1.94 0.02
Spermidine, mM � 10–1 1.32 1.03–1.69 0.02 2.38 1.22–4.76 0.01
C4, mM 1.36 1.08–1.71 0.01 6.23 2.51–15.49 <0.0001
Total essential amino acids (mM) 0.66 0.45–0.97 0.03 0.93 0.91–0.94 0.001
tPS[3] (4 metabolites: total DMA/arginine ratio, spermidine, C4,total essential amino acids) (� 10–1)
2.78 2.04–3.78 <0.0001 3.08 2.19–4.33 <0.0001
The ranges of t[1] and tPS[2] are from –2.64 to 2.5 and from –2.5 to 2.65, respectively. The ranges of tPS[3]s are from 0.04 to 5.6 and from 1.2 to 6.3 for the discovery phaseand validation studies, respectively (on the basis of regression models).
C4 ¼ butyrylcarnitine; DMA ¼ dimethylarginine; HR ¼ hazard ratio; t[1] ¼ values calculated by all metabolomics analysis; tPS[2] ¼ values calculated by 4 metabolites fordiagnosis; other abbreviations as in Tables 1 and 3.
FIGURE 2 Prognostic Values of Metabolomics
Death + HF-readmission
Death + HF-readmission
Discovery phase study
Validation study
1 – Specificity
BNP
BNP < 350 pg/ml
BNP < 350 pg/ml
BNP ≥ 350 pg/ml
BNP ≥ 350 pg/ml
BNP
0.740.780.790.85
0.630.81
1.0
1.0
0.8
0.8
0.6
0.6
0.4
0.4
0.2
0.2
0.0
1.00.80.60.40.20.0
0.0
1.0
0.8
0.6
0.4
0.2
0.0
1.0
0.8
0.6
0.4
0.2
0.0
1.0
0.8
0.6
0.4
0.2
0.0
1.0
0.8
0.6
0.4
0.2Log rank = 17.5
Log rank = 30.2
P < 0.0001
P < 0.0001
Log rank = 3.92
P =0.048
Log rank = 9.95
P =0.0020.00
200
400
600
800
1000
1200
1400 0
200
400
600
800
1000
1200
1400
0 200 400 600 800 10000 200 400 600 800 1000
1.0
0.8
0.6
0.4
0.2
0.0
tPS[1]
BNP
tPS[2]tPS[3]
tPS[3] <2.9
tPS[3] ≥2.9
tPS[3] <2.9
tPS[3] ≥2.9
tPS[3]
BNP
tPS[3]
tPS[1]tPS[2]tPS[3]
Days Days
DaysDays1 – Specificity
Sens
itivi
tySe
nsiti
vity
Even
t–Fr
ee S
urvi
val
Even
t–Fr
ee S
urvi
val
Area Under the Curve
Area Under the Curve
A B C
FED
(A and D) The ROC curves for comparing the prognostic values of BNP, tPS[1], tPS[2], and tPS[3] in the discovery phase study; and BNP and tPS[3] in the validation
studies. (B, C, E, and F) The Kaplan-Meier curves of tPS[3] and BNP for predicting a composite event of all-cause death and HF-related re-hospitalization in the discovery
phase and the validation studies. Abbreviations as in Figure 1.
J A C C V O L . 6 5 , N O . 1 5 , 2 0 1 5 Cheng et al.A P R I L 2 1 , 2 0 1 5 : 1 5 0 9 – 2 0 Metabolomics-Based Biomarkers in Heart Failure
1517

FIGURE 3 Serial Follow-Up After Acute HF
10000.00
A B
r = 0.533p < 0.0001
2.5Metabolomics BNP
3.5
2.5
1.5
0.5
1.5
0.5
–0.5
–1
–1.5
–2
–2.5
–3N M0 M6 M12 N M0 M6 M12
1
0
2
4
3
2
1
0
BNP
(pg/
ml)
tPS[2]tP
S[2]
Log
(BNP
)
1000.00
100.00
10.00
1.00
–2.00 0.00 2.00 4.00
0.001
3.5
2.5
1.5
0.5
4
3
2
1
Log
(BNP
)
(A) The correlation between BNP levels and tSP[2] is significant. (B) BNP and tPS[2] levels are shown in another group of 32 patients who
survived >12 months and improved significantly (New York Heart Association functional class I) at the end of 12 months. M0 ¼ pre-discharge
values; M6 ¼ 6-month values; M12 ¼ 12-month values; N ¼ normal control subjects; other abbreviations as in Figure 1.
Cheng et al. J A C C V O L . 6 5 , N O . 1 5 , 2 0 1 5
Metabolomics-Based Biomarkers in Heart Failure A P R I L 2 1 , 2 0 1 5 : 1 5 0 9 – 2 0
1518
the inadequate cardiac output in HF patients,together with the impact of systemic congestion.Plasma metabolomics represent the metabolic view ofthe so-called cardio–hepatic interaction, cardiorenalsyndrome, and catabolic status in the muscular sys-tem. Keeping in line with the main findings,levels of histidine and phosphatidylcholine C34:4increased, whereas levels of phenylalanine and sper-midine decreased in patients whose medical condi-tion improved.
Application of tracer-based metabolic flux analysison patients is associated with technical feasibility andethical issues. Despite the lack of flux analysis, ourmetabolomics data still provided an excellent accountof metabolic changes in patients.
Mitochondrial dysfunction and a shift from fattyacid to glucose utilization for energy productionare the main metabolic changes seen in the failingheart. Histidine, which is capable of being convertedto glutamate, enters the glutamate-ornithine-prolinepathway or Krebs cycle as alpha-ketoglutarate, whichsupplies ornithine and energy for cardiac tissues.Glucose can be converted to phosphoribosyl pyro-phosphate, which is essential to histidine biosyn-thesis. Over-consumption of glucose as an energysource may impair the cellular ability to replenishhistidine deficiency, which is probably causedby inadequate intake. Uncoupling of nitric oxide
synthase may involve the pathogenesis of HF (10).Induction of nitric oxide synthase-2 and concurrenttetrahydrobiopterin depletion in the myocardiumcontribute to HF in animal models and humansubjects (10,11). Consistent with such notions, accu-mulation of phenylalanine and tyrosine in HFpatients during progression from stage A to C HFare indicative of tetrahydrobiopterin depletion. Thisoccurs in parallel with a significant decrease inarginine levels, which may disturb nitric oxide (NO)production and lead to cardiac dysfunction (12). Incontrast, the increased phenylalanine and tyrosinelevels may also be associated with the accumula-tion of aromatic amino acids caused by increasedmuscular protein breakdown and impaired liverfunction.
Our study showed the stage-specific elevation ofplasma polyamine metabolites, namely, spermidineand spermine. The polyamine and NO pathwaysare inter-regulated in several experimental models.NO inhibits ornithine decarboxylase and polyaminesproduction (13,14). Ornithine, the upstream precursorto polyamines formation, can be produced fromarginine by arginase or by arginine:glycine amidino-transferase. The decrease in arginine and the accu-mulation of ornithine in stage C HF patients maybe associated with impaired NO synthesis andenhanced polyamine synthesis. The ornithine level

J A C C V O L . 6 5 , N O . 1 5 , 2 0 1 5 Cheng et al.A P R I L 2 1 , 2 0 1 5 : 1 5 0 9 – 2 0 Metabolomics-Based Biomarkers in Heart Failure
1519
can be further increased as a result of a dysfunc-tional urea cycle in the liver. The involvement ofpolyamines in the pathogenesis of cardiac diseasesis not unprecedented. Polyamines increase in car-diac tissue after ascending aortic stenosis and invarious models of experimentally-induced cardiachypertrophy (15,16). Moreover, spermidine has beenshown to be detrimental to cardiomyocytes underhypoxic stress (17).
Reduction in plasma levels of most phosphatidyl-cholines in HF patients is intriguing. Previous studiesreported alteration of lipid homeostasis, includingchanges in metabolism of phosphatidylcholines, inassociated cardiomyopathies (18,19). Disturbances inthe ratio of phosphatidylcholine to phosphatidyl-ethanolamine and anomalies in membrane phos-pholipid homeostasis alter the membrane-associatedprotein complexes interactions that regulate myo-cardial metabolism and cell signaling (20). In con-trast, because the liver plays a major role inphosphatidylcholine metabolism and lipoproteinsecretion, anomalous phosphatidylcholine meta-bolism may be associated with abnormal hepaticfunctions in the failing heart (21). A congested liver iscommon in patients with congestive HF; it remainsto be elucidated whether abnormal liver functionplays an active role in HF pathogenesis or theliver merely responds passively to the remarkablyincreased metabolic input from nonhepatic tissuesand organs.
Plasma metabolome is indicative of HF-associatedglobal changes in metabolism rather than that of theheart alone, and likely involves interactions betweenvarious tissues and organs. As shown in our study,the limited correlation between BNP and tPS[2] sug-gests either novel HF-related metabolic pathways orgeneral markers of poor status. Previous studiesidentified a few specific metabolic profiles of liverdysfunction, including elevated bile acids anddecreased lysophosphatidylcholines and a decreasedFischer ratio, which is the molar ratio of plasmabranched chain amino acids levels to aromatic aminoacids levels (22).
Although some of these changes were also noted inour patients (Online Table 2), the main metabolicprofile discovered in our study is distinct. Meta-bolic signatures are different between HF andnon-HF cachexia. Cachexia related to chronic lungdisease and cancer, for example, has been asso-ciated with increases in very low- and low-densitylipoproteins (23), glutamine, aspartate, arginine, andasparagine, as well as decreases in aminoadipate,beta-aminoisobutyrate, and 1-methylhistidine (24).Comparison of these reports and our findings suggest
that the metabolic profiles described in our studyare specific to HF. However, the specificity of ourprofiles for both diagnostic and prognostic valuesneeds to be assessed in patients with non-HF diseasesor dyspnea. In contrast, the same AUCs of BNP andtPS[2] suggest that metabolomics is highly valuablefor evaluating HF-related metabolic disturbances. Itopens a new avenue for assessing patient response tonutritional interventions.
Our metabolomic findings demonstrate impor-tant clinical applications beyond diagnosis. Anothermetabolite set consisting of 4 metabolite componentsprovides a better prognostic value than the conven-tional biomarker, BNP. This metabolic profile coversdifferent aspects of pathogenesis. For instance, thetotal dimethylarginine/arginine ratio is indicative ofendothelial dysfunction (25), spermidine is probablyindicative of rescuing compensation or toxicity tocardiomyocytes, butyrylcarnitine is indicative ofanomalous lipid and energy metabolism, and totalessential amino acids is indicative of malnutrition.These findings raise the possibility of adjunctivenutritional therapy to improve the prognosis of pa-tients with severe HF.
STUDY LIMITATIONS. Because systemic and myo-cardial metabolism can shift rapidly in responseto HF-related pathophysiology and stress, the pre-sent study did not address the changes in patientmetabolic profiles at different time points within ashort period after hospital discharge. For better datainterpretation and clinical applications in the future,the dynamics and stability of metabolomic profilesneed to be established.
CONCLUSIONS
HF is associated with a variety of abnormalities inmultiple metabolic pathways and subsequent occur-rence of a complex “metabolic storm.” Apart from theunderstanding of pathogenesis, the profile of metab-olites provides a more sensitive and better evaluationfor HF staging than that defined by current classifi-cation schemes, paving the way for monitoring theoutcome of therapeutic interventions.
ACKNOWLEDGMENT The authors thank Dr. Li-TangKuo for recruiting the patients in the validation study.
REPRINTS AND CORRESPONDENCE: Dr. Chao-HungWang, Heart Failure Research Center, Division ofCardiology, Department of Internal Medicine, ChangGung Memorial Hospital, 222 Mai Chin Road, Keelung20401, Taiwan. E-mail: [email protected] [email protected].
PERSPECTIVES
COMPETENCY IN MEDICAL KNOWLEDGE:
Plasma biomarkers that identify abnormalities of cardiac
metabolism in patients with HF have prognostic value
beyond that of natriuretic peptide levels or conventional
clinical risk factors.
TRANSLATIONAL OUTLOOK: Additional clinical
studies are needed to examine the effects of nutritional
and other interventions that target specific cardiac
metabolic disturbances on clinical outcomes in patients
with HF and their correlations with plasma levels of
metabolic biomarkers.
Cheng et al. J A C C V O L . 6 5 , N O . 1 5 , 2 0 1 5
Metabolomics-Based Biomarkers in Heart Failure A P R I L 2 1 , 2 0 1 5 : 1 5 0 9 – 2 0
1520
RE F E RENCE S
1. Riegel B, Moser DK, Anker SD, et al. State ofthe science: promoting self-care in persons withheart failure: a scientific statement from theAmerican Heart Association. Circulation 2009;120:1141–63.
2. Berger R, Moertl D, Peter S, et al. N-terminalpro-B-type natriuretic peptide-guided, intensivepatient management in addition to multidisci-plinary care in chronic heart failure a 3-arm, pro-spective, randomized pilot study. J Am Coll Cardiol2010;55:645–53.
3. Maisel AS, Clopton P, Krishnaswamy P, et al.Impact of age, race, and sex on the ability ofB-type natriuretic peptide to aid in the emergencydiagnosis of heart failure: results from theBreathing Not Properly (BNP) multinational study.Am Heart J 2004;147:1078–84.
4. Daniels LB, Clopton P, Jiang K, Greenberg B,Maisel AS. Prognosis of stage A or B heart failurepatients with elevated B-type natriuretic peptidelevels. J Card Fail 2010;16:93–8.
5. Hunt SA, Abraham WT, Chin MH, et al. ACC/AHA2005 guideline update for the diagnosis andmanagement of chronic heart failure in the adult.J Am Coll Cardiol 2005;46:e1–82.
6. Kang SM, Park JC, Shin MJ, et al. 1H nuclearmagnetic resonance based metabolic urinaryprofiling of patients with ischemic heart failure.Clin Biochem 2011;44:293–9.
7. Dunn WB, Broadhurst DI, Deepak SM, et al.Serum metabolomics reveals many novel meta-bolic markers of heart failure, including pseu-douridine and 2-oxoglutarate.Metabolomics 2007;3:413–26.
8. Logeart D, Thabut G, Jourdain P, et al. Predis-charge B-type natriuretic peptide assay for iden-tifying patients at high risk of re-admission afterdecompensated heart failure. J Am Coll Cardiol2004;43:635–41.
9. Rame JE. Chronic heart failure: a reversiblemetabolic syndrome? Circulation 2012;125:2809–11.
10. Nishijima Y, Sridhar A, Bonilla I, et al. Tetra-hydrobiopterin depletion and NOS2 uncouplingcontribute to heart failure-induced alterationsin atrial electrophysiology. Cardiovasc Res 2011;91:71–9.
11. Ziolo MT, Maier LS, Piacentino V 3rd, Bossuyt J,Houser SR, Bers DM. Myocyte nitric oxide synthase2 contributes to blunted beta-adrenergic responsein failing human hearts by decreasing Ca2þ tran-sients. Circulation 2004;109:1886–91.
12. Takarada S, Imanishi T, Goto M, et al. Firstevaluation of real-time nitric oxide changes in thecoronary circulation in patients with non-ischaemicdilated cardiomyopathy using a catheter-typesensor. Eur Heart J 2010;31:2862–70.
13. Hu J, Mahmoud MI, el-Fakahany EE. Poly-amines inhibit nitric oxide synthase in rat cere-bellum. Neurosci Lett 1994;175:41–5.
14. Bauer PM, Buga GM, Fukuto JM, Pegg AE,Ignarro LJ. Nitric oxide inhibits ornithine decar-boxylase via S-nitrosylation of cysteine 360 in theactive site of the enzyme. J Biol Chem 2001;276:34458–64.
15. Pegg AE, Hibasami H. Polyamine metabolismduring cardiac hypertrophy. Am J Physiol 1980;239:E372–8.
16. Bartolome J, Huguenard J, Slotkin TA. Role ofornithine decarboxylase in cardiac growth andhypertrophy. Science 1980;210:793–4.
17. Tantini B, Fiumana E, Cetrullo S, et al.Involvement of polyamines in apoptosis of cardiacmyoblasts in a model of simulated ischemia. J MolCell Cardiol 2006;40:775–82.
18. Maekawa K, Hirayama A, Iwata Y, et al. Globalmetabolomic analysis of heart tissue in a hamster
model for dilated cardiomyopathy. J Mol CellCardiol 2013;59:76–85.
19. Wende AR, Abel ED. Lipotoxicity in the heart.Biochim Biophys Acta 2010;1801:311–9.
20. Jenkins CM, Cedars A, Gross RW. Eicosanoidsignalling pathways in the heart. Cardiovasc Res2009;82:240–9.
21. Killip T 3rd, Payne MA. High serum trans-aminase activity in heart disease. Circulatory fail-ure and hepatic necrosis. Circulation 1960;21:646–60.
22. Dejong CH, van de Poll MC, Soeters PB,Jalan R, Olde Damink SW. Aromatic amino acidmetabolism during liver failure. J Nutr 2007;137:1579S–85.
23. O’Connell TM, Ardeshirpour F, Asher SA, et al.Metabolomic analysis of cancer cachexia revealsdistinct lipid and glucose alterations. Metab-olomics 2008;4:216–25.
24. Ubhi BK, Cheng KK, Dong J, et al. Targetedmetabolomics identifies perturbations in aminoacid metabolism that sub-classify patients withCOPD. Mol Biosyst 2012;8:3125–33.
25. Fard A, Tuck CH, Donis JA, et al. Acute ele-vations of plasma asymmetric dimethylarginineand impaired endothelial function in responseto a high-fat meal in patients with type 2 dia-betes. Arterioscler Thromb Vasc Biol 2000;20:2039–44.
KEY WORDS B-type natriuretic peptide,diagnosis, liquid chromatography-massspectrometry, prognosis
APPENDIX For supplemental text, figures,and tables, please see the online version of thisarticle.