metabolic classification of herb plants by nmr-based...
TRANSCRIPT
Journal of the Korean Magnetic Resonance Society 2012, 16, 91-102
a These authors contributed equally to this work. Department of Chemistry and Research Institute of Natural Science, Gyeongsang National University, Jinju, 660-701, Republic of Korea. email : [email protected] Journal of the Korean Magnetic Resonance Society 2012 December; 16(2): 91-102 http://dx.doi.org/10.6564/JKMRS.2012.16.2.091
Metabolic classification of herb plants by NMR-based metabolomics
Hee-Eun Kim,1,a Ye Hun Choi,2,a Kwang-Ho Choi,1,a Ji Su Park,2 Hyeon Su Kim,2 Jun Hyeok Jeon,2 Min Soo Heu,3 Dong-Seon Shin,2 and Joon-Hwa Lee1,*
1Department of Chemistry and Research Institute of Natural Science, Gyeongsang National University,
Jinju, Gyeongnam 660-701, Korea. 2Gyeongnam Science High School, Jinju, Gyeongnam 660-851, Korea.
3Department of Food and Nutrition and Institute of Marine Industry, Gyeongsang National University, Jinju, Gyeongnam 660-701, Korea.
(Received Aug 10, 2012; Revised Sep 15, 2012; Accepted Sep 25, 2012)
Abstract : Metabolomics is the systematic identification and quantification of all metabolites in an organism or biological sample. NMR has been used as a major application tool in plant metabolomics such as quality control, chemotaxonomy, and analysis of genetically modified plants. Herbal medicines are the important therapeutics and are used to manage common diseases such as cold, inflammation, pain, heart diseases, liver cirrhosis, diabetes and central nerve system diseases. Herb plants include various kinds of species such as geranium, mint, and thyme and so on and contain different kinds of metabolites. We performed NMR-based metabolomics study on the seven different species of herb plants using 1H NMR experiments and OPLS-DA to understand the correlation between the classification of herb plants and their metabolite contents. This study showed clear metabolic discrimination among various herb plants. This metabolmics study found several diagnostic NMR signals which are able to be used as bio-markers for identification of the specific herb plants among various species. Clear metabolic discrimination of herb plants suggests three chemotaxonomic groups of herb species. Keywords : NMR, metabolomics, herb, plant, classification, chemotaxonomy
92 Metabolic classification of herb plants
INTRODUCTION
Metabolomics is the systematic identification and quantification of all metabolite in an organism
or biological sample.1,2 NMR is a very suitable method to allow the detection of a wide range of
metabolites with high robustness.2,3 1H NMR has been used as a major application tool in plant
metabolomics such as quality control,4 chemotaxonomy,5 and analysis of genetically modified
plants.6 NMR-based metabolic profiling also could be applied to classification, characterization, and
identification of plant-derived products.2,3
Herbal medicines are the important therapeutics and are used to manage chronic diseases.7 Most
people in Asian countries use herbal medicines for promoting health and managing common diseases
such as cold, inflammation, pain, heart diseases, liver cirrhosis, diabetes and central nerve system
diseases.7 Herb plants include various kinds of species such as geranium, mint, and thyme and so on.
Because each herb plant contains different kinds of metabolites, they should be used for a suitable
purpose as herbal medicine.7 However, despite the importance of metabolite contents of herbal
medicine, the chemotaxonomy of the herb species to identify the metabolic similarities between
species are not clear yet.
We performed NMR-based metabolomics study on the seven different species of herb plants
(Table 1) to understand the correlation between the classification of herb plants and their metabolite
contents. Clear metabolic discrimination of herb plants in this study makes the chemotaxonomic
Hee-Eun Kim et al / J. Kor. Magn. Reson., Vol. 16, No. 2, 2012 93
classification of herb species possible.
EXPERIMENTAL METHODS
All herbal plants were purchased from Herb Web-mart (http://www.herb5.co.kr, Korea). The
leaves of herb plants were well ground under liquid N2 condition and lyophilized. 0.75 mL of
CH3OH-d4 and 0.75 mL of 10 mM KH2PO4 buffer in D2O (pH 6.0) containing 2-2-dimethyl-2-
silapentane-5-sulfonate (DSS) were added to 50 mg of well-ground herb leaves. The mixture was
ultrasonicated for 20 min at room temperature and centrifugated at 12,000 rpm for 10 min. Each
NMR sample consisted of 0.5 mL of supernatant, which was stored at 4 °C.
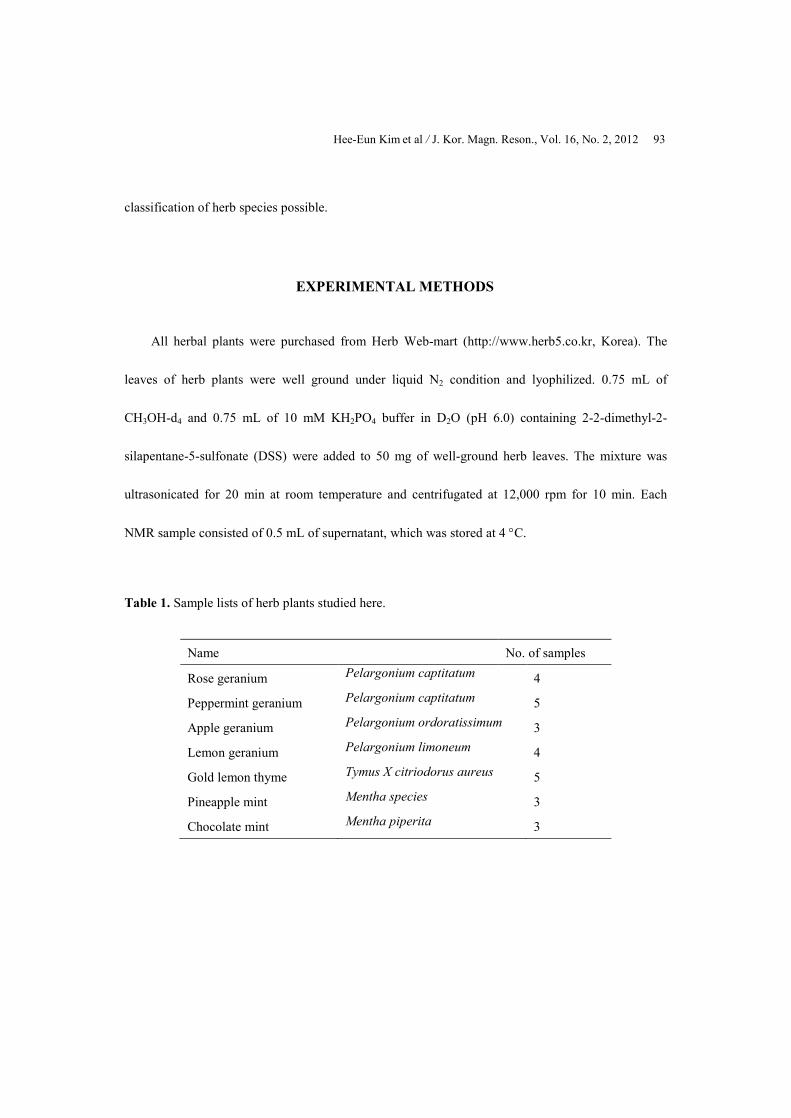
Table 1. Sample lists of herb plants studied here.
Name No. of samples
Rose geranium Pelargonium captitatum 4
Peppermint geranium Pelargonium captitatum 5
Apple geranium Pelargonium ordoratissimum 3
Lemon geranium Pelargonium limoneum 4
Gold lemon thyme Tymus X citriodorus aureus 5
Pineapple mint Mentha species 3
Chocolate mint Mentha piperita 3
94 Metabolic classification of herb plants
All NMR experiments were performed on an Agilent DD2 700MHz NMR spectrometer (GNU,
Jinju, Korea) equipped with a triple resonance probe at 25 °C. Residual water signal of one-
dimensional (1D) NMR spectra was suppressed by using a pre-saturation water suppression pulse
sequence and these data were processed with the program Chenomx NMR Suite 7.1 (Chenomx,
Alberta, Canada) or FELIX2004 (Accelrys, San Diego, CA). DSS was used for the 1H reference. All
NMR spectra were phased and baseline-corrected with the program Chenomx NMR Suite 7.1
(Chenomx, Alberta, Canada). Principal component analysis (PCA) was carried out in SIMCA P+
version 12 (Umetrics, Kinnelon, NJ). Furthermore, orthogonal projection on latent
structure-discriminant analysis (OPLS-DA) was used to analyze the NMR binning data with class
informations.8,9
RESULTS AND DISCUSSION
The NMR data binning was performed from 0 to 10 ppm with a bin size of 0.04 ppm. The
spectral region of the suppressed water (4.60 ~ 5.00 ppm) and DSS (2.80 ~ 2.88, 1.72 ~ 1.82, 0.54 ~
0.64, and 0 ~ 0.04 ppm) signals were excluded from the binning process. PCA was applied to the 1D
NMR binning data in order to obtain the maximum variation between the samples. PCA with first
seven components explaining 85 % of the variance did not show clear differentiation among the herb
samples from different classes, although some herb samples showed separation from other samples
(Fig. 1). For example, the score plot (PC1 vs. PC2) in Fig. 1A shows that Apple geranium is clearly
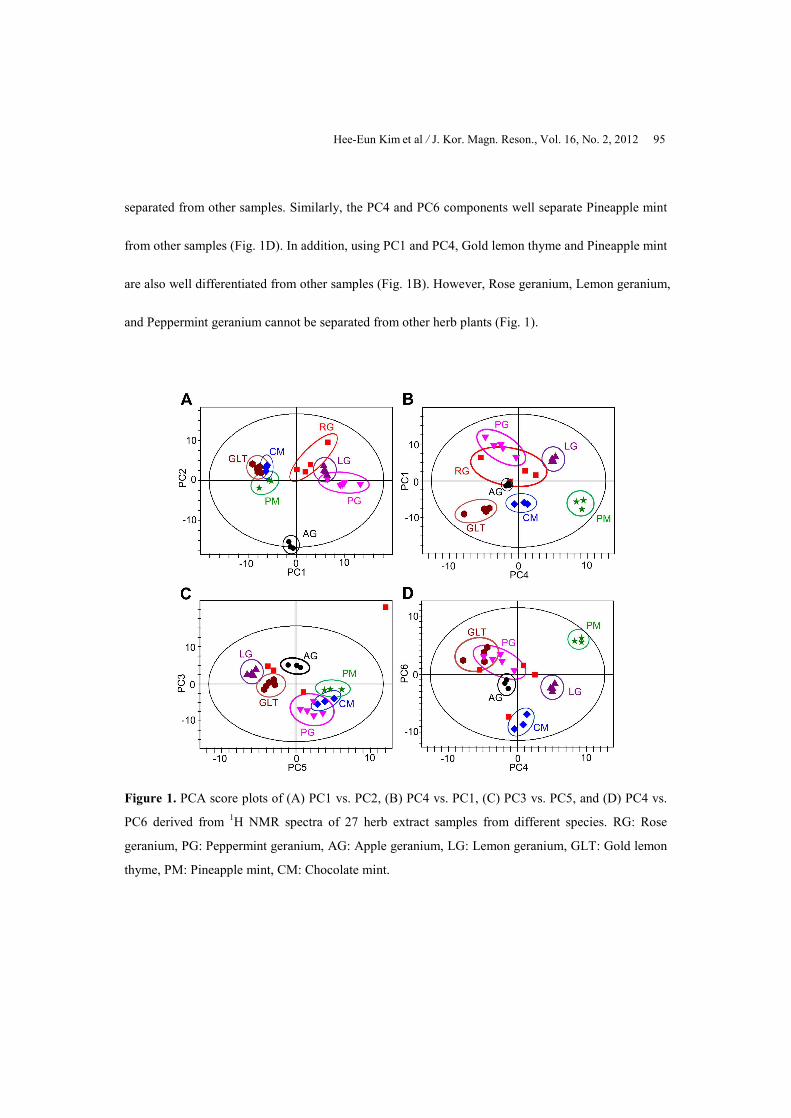
Hee-Eun Kim et al / J. Kor. Magn. Reson., Vol. 16, No. 2, 2012 95
separated from other samples. Similarly, the PC4 and PC6 components well separate Pineapple mint
from other samples (Fig. 1D). In addition, using PC1 and PC4, Gold lemon thyme and Pineapple mint
are also well differentiated from other samples (Fig. 1B). However, Rose geranium, Lemon geranium,
and Peppermint geranium cannot be separated from other herb plants (Fig. 1).
Figure 1. PCA score plots of (A) PC1 vs. PC2, (B) PC4 vs. PC1, (C) PC3 vs. PC5, and (D) PC4 vs.
PC6 derived from 1H NMR spectra of 27 herb extract samples from different species. RG: Rose
geranium, PG: Peppermint geranium, AG: Apple geranium, LG: Lemon geranium, GLT: Gold lemon
thyme, PM: Pineapple mint, CM: Chocolate mint.
96 Metabolic classification of herb plants
To maximize the differences between species, OPLS-DA model was constructed with six PLS
components and two orthogonal components. R2x values of six PLS components (OPLS1 ~ OPLS6)
are 19.8, 16.9, 12.0, 9.5, 7.3, and 5.8 %, respectively. Similar to PCA, Apple geranium is clearly
separated from other samples using OPLS1 and OPLS2 components (Fig. 2A). The loading plot
obtained from OPLS-DA using OPLS1 and OPLS2 indicated that some NMR signals were
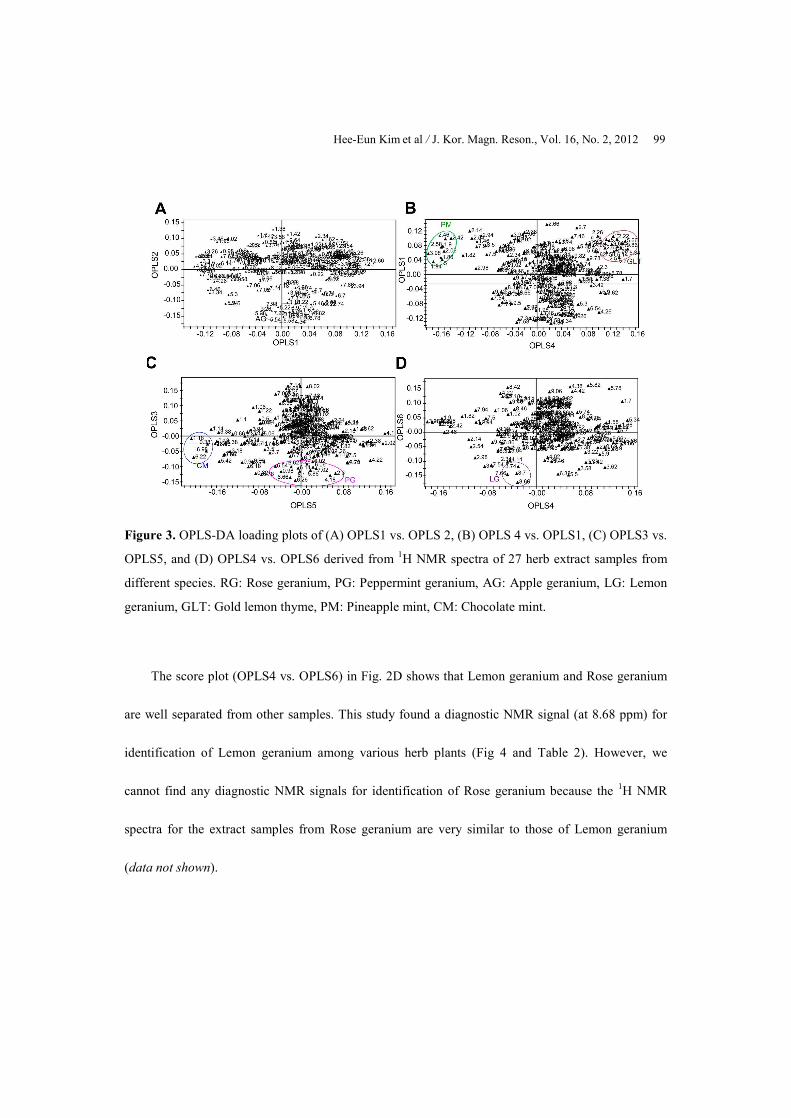
diagnostics for identification of Apple geranium among various herb plants (circle in Fig. 3A). For
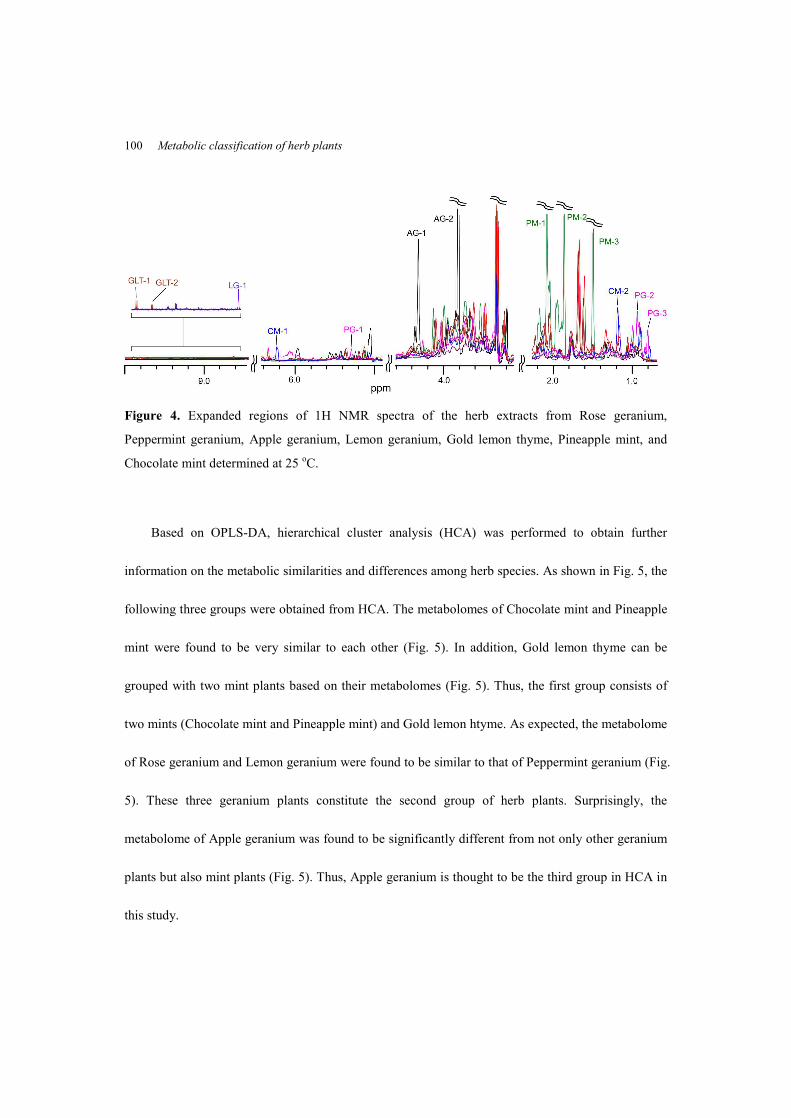
example, the 1H NMR peaks at 3.81 and 4.32 ppm in Apple geranium have much stronger intensities
compared to those in other herb samples (Fig. 4). The relative peak intensities of these two
resonances centered at 3.81 and 4.32 ppm in Apple geranium are 6-times higher than those in other
herb samples (Table 2).
Table 2. Relative proton amounts (%)a of bio-markers of herb extracts.
Marker Chemical shift (ppm)
Rose geranium
Pepper-mint geranium
Apple geranium
Lemon geranium
Gold lemon time
Pineapple mint
Chocolate mint
GLT-1 9.87 0 0 0 0 0.02 0 0
GLT-2 9.68 0 0 0 0 0.01 0 0
LG-1 8.68 0.01 0 0 0.05 0 0 0
CM-1 6.21 0.03 0.22 0.04 0.04 0.10 0.02 1.16
PG-1 5.27 0.16 0.43 0.21 0.08 0.06 0.06 0.08
AG-1 4.32 0.97 0.51 5.18 0.61 1.22 0.98 0.88
AG-2 3.81 1.25 1.81 11.05 1.57 2.36 1.52 1.49
PM-1 2.07 0.76 0.38 0.37 0.46 1.00 4.86 0.96

Hee-Eun Kim et al / J. Kor. Magn. Reson., Vol. 16, No. 2, 2012 97
PM-2 1.85 0.45 0.43 0.26 0.33 0.52 4.33 0.53
PM-3 1.48 1.22 0.89 0.57 1.01 1.21 4.85 1.11
CM-2 1.18 2.01 0.79 0.55 1.67 1.55 0.74 5.06
PG-2 0.98 0.83 1.78 0.35 0.74 0.55 0.77 1.21
PG-3 0.92 2.56 4.11 1.07 2.20 1.18 1.02 3.26 a Relative proton amounts (%) = peak intensity / S(peak intensities) ´ 100.
The score plot (OPLS4 vs. OPLS1) in Fig. 2B shows that Pineapple mint and Gold lemon thyme
are clearly separated from other samples. The OPLS-DA loading plot using OPLS4 and OPLS1
indicated that some NMR signals were diagnostics for identification of Pineapple mint and Gold
lemon thyme among various herb plants (circles in Fig. 3B). The three 1H NMR peaks centered at
1.50, 1.85, and 2.07 ppm in Pineapple mint show relatively stronger than those of other herb samples
(Fig. 4 and Table 2). Similarly, the two 1H NMR peaks centered at 9.68 and 9.87 ppm in Gold lemon
thyme have significantly stronger intensities compared to those of other herb samples (Fig. 4 and
Table 2).
In contrast to PCA, Chocolate mint and Peppermint geranium are also able to be separated from
other samples using OPLS5 and OPLS3 components (Fig. 2C). The OPLS-DA loading plot using
OPLS5 and OPLS3 provides diagnostic NMR signals for identification of Chocolate mint and
Peppermint geranium among various herb plants (circles in Fig. 3C). The 1H NMR peaks at 1.18 and
6.21 ppm in Chocolate mint show much stronger intensities than those of other herb samples (Fig. 4

98 Metabolic classification of herb plants
and Table 2). The extracts from Peppermint geranium exhibit relatively stronger 1H NMR peaks at
0.92, 0.98, and 5.27 ppm compared to other herb plants (Fig. 4 and Table 2).
Figure 2. OPLS-DA score plots of (A) OPLS1 vs. OPLS 2, (B) OPLS 4 vs. OPLS1, (C) OPLS3 vs.
OPLS5, and (D) OPLS4 vs. OPLS6 derived from 1H NMR spectra of 27 herb extract samples from
different species. RG: Rose geranium, PG: Peppermint geranium, AG: Apple geranium, LG: Lemon
geranium, GLT: Gold lemon thyme, PM: Pineapple mint, CM: Chocolate mint.
Hee-Eun Kim et al / J. Kor. Magn. Reson., Vol. 16, No. 2, 2012 99
Figure 3. OPLS-DA loading plots of (A) OPLS1 vs. OPLS 2, (B) OPLS 4 vs. OPLS1, (C) OPLS3 vs.
OPLS5, and (D) OPLS4 vs. OPLS6 derived from 1H NMR spectra of 27 herb extract samples from
different species. RG: Rose geranium, PG: Peppermint geranium, AG: Apple geranium, LG: Lemon
geranium, GLT: Gold lemon thyme, PM: Pineapple mint, CM: Chocolate mint.
The score plot (OPLS4 vs. OPLS6) in Fig. 2D shows that Lemon geranium and Rose geranium
are well separated from other samples. This study found a diagnostic NMR signal (at 8.68 ppm) for
identification of Lemon geranium among various herb plants (Fig 4 and Table 2). However, we
cannot find any diagnostic NMR signals for identification of Rose geranium because the 1H NMR
spectra for the extract samples from Rose geranium are very similar to those of Lemon geranium
(data not shown).
100 Metabolic classification of herb plants
Figure 4. Expanded regions of 1H NMR spectra of the herb extracts from Rose geranium,
Peppermint geranium, Apple geranium, Lemon geranium, Gold lemon thyme, Pineapple mint, and
Chocolate mint determined at 25 oC.
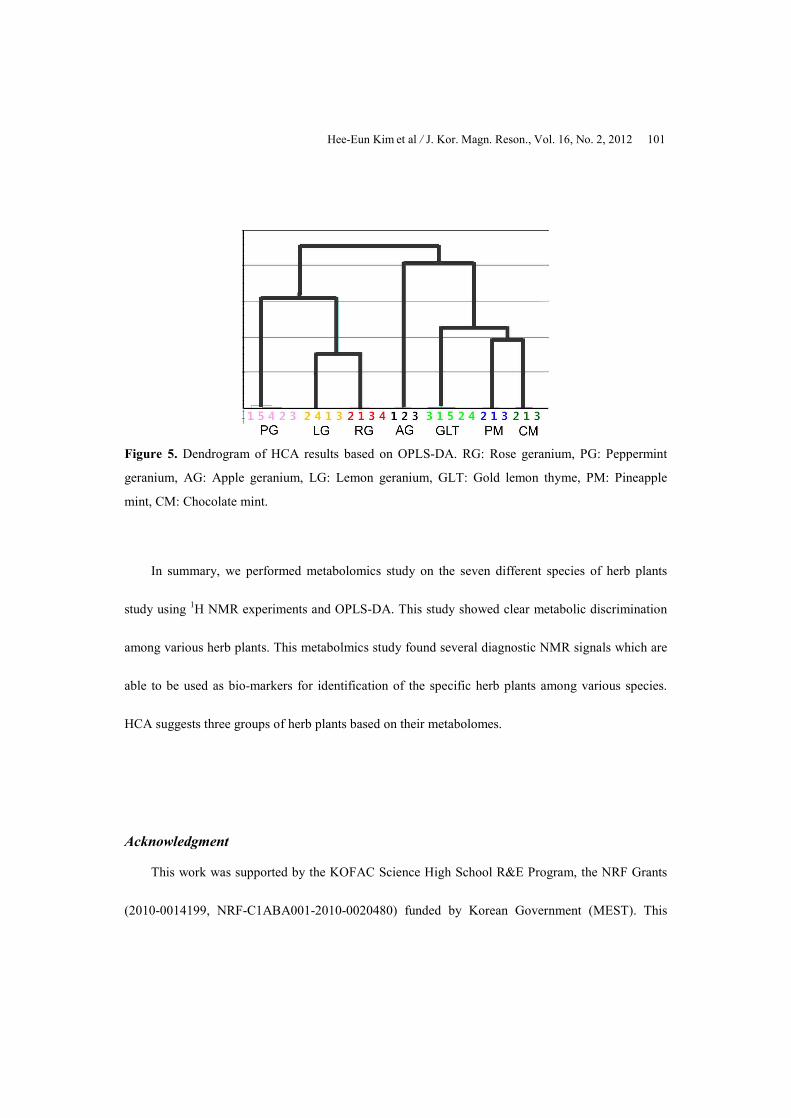
Based on OPLS-DA, hierarchical cluster analysis (HCA) was performed to obtain further
information on the metabolic similarities and differences among herb species. As shown in Fig. 5, the
following three groups were obtained from HCA. The metabolomes of Chocolate mint and Pineapple
mint were found to be very similar to each other (Fig. 5). In addition, Gold lemon thyme can be
grouped with two mint plants based on their metabolomes (Fig. 5). Thus, the first group consists of
two mints (Chocolate mint and Pineapple mint) and Gold lemon htyme. As expected, the metabolome
of Rose geranium and Lemon geranium were found to be similar to that of Peppermint geranium (Fig.
5). These three geranium plants constitute the second group of herb plants. Surprisingly, the
metabolome of Apple geranium was found to be significantly different from not only other geranium
plants but also mint plants (Fig. 5). Thus, Apple geranium is thought to be the third group in HCA in
this study.
Hee-Eun Kim et al / J. Kor. Magn. Reson., Vol. 16, No. 2, 2012 101
Figure 5. Dendrogram of HCA results based on OPLS-DA. RG: Rose geranium, PG: Peppermint
geranium, AG: Apple geranium, LG: Lemon geranium, GLT: Gold lemon thyme, PM: Pineapple
mint, CM: Chocolate mint.
In summary, we performed metabolomics study on the seven different species of herb plants
study using 1H NMR experiments and OPLS-DA. This study showed clear metabolic discrimination
among various herb plants. This metabolmics study found several diagnostic NMR signals which are
able to be used as bio-markers for identification of the specific herb plants among various species.
HCA suggests three groups of herb plants based on their metabolomes.
Acknowledgment
This work was supported by the KOFAC Science High School R&E Program, the NRF Grants
(2010-0014199, NRF-C1ABA001-2010-0020480) funded by Korean Government (MEST). This

102 Metabolic classification of herb plants
work was also supported by a grant from Next-Generation BioGreen 21 Program (SSAC, No.
PJ009041), Rural Development Administration, Korea. This work was also supported by
Interdisciplinary Research Promotion Program of College of Natural Science, GNU. We thank the
GNU Central Instrument Facility for performing NMR experiments.
REFERENCES
1. J. Schipsema, Phyrochem. Anal. 21, 14. (2009).
2. H. K. Kim, Y. H. Choi, R. Verpoorte, Nat. Protoc. 5, 536. (2010).
3. H. K. Kim, Y. H. Choi, R. Verpoorte, Trends. Biotechnol. 29, 267. (2011).
4. B. Rasmussen, O. Cloarec, H. Tang, D. Staerk, J. W. Jaroszewski, Planta Med. 72, 556. (2006).
5. H. K. Kim, Saifullah; S. Khan, E. G. Wilson, S. D. P. Kricun, A. Meissner, S. Goraler, A. M.
Deelder, Y. H. Choi, R. Verpoorte, Phytochemistry 71, 773. (2010).
6. E. Barros, S. Lezar, M. J. Anttonen, J. P. van Dijk, R. M.;Rohlig, E. J. Kok, K.-H. Engel, Plant
Biotechnol. J. 8, 436. (2010).
7. Y. H. Choi, Y.-W. Chin, Y. G. Kim, Arch. Pharm. Res. 34, 1843. (2011).
8. Y. Jung, Y.-S. Jung, G.-S. Hwang, J. Korean Magn. Reson. Soc. 15, 90. (2011).
9. J. Kim, J. Park, S.-S. Park, G.-S. Hwang, J. Korean Magn. Reson. Soc. 16, 54. (2012).