(meta-)stability and core-shell dynamics of gold
TRANSCRIPT

(Meta-)stability and Core-Shell Dynamics of Gold
Nanoclusters at Finite Temperature
Supplementary Materials
Diego Guedes-Sobrinho,∗,† Weiqi Wang,∗,‡ Ian Hamilton,∗,¶ Juarez L. F. Da
Silva,∗,† and Luca M. Ghiringhelli∗,‡
†Sao Carlos Institute of Chemistry, University of Sao Paulo, PO Box 780, 13560-970, Sao Carlos,
Sao Paulo, Brazil
‡Fritz-Haber-Institut der Max-Planck-Gesellschaft, 14195 Berlin-Dahlem, Germany
¶Department of Chemistry, Wilfrid Laurier University, Waterloo, N2L 3C5 Ontario, Canada
E-mail: [email protected]; [email protected]; [email protected];
juarez [email protected]; [email protected]
Phone: +49 30 8413 4802
S1

I Computational details
We employed the all-electron full potential method as implemented in the Fritz-Haber-Institute -
ab initio molecular simulations (FHI-AIMS) package,1 from which the electrons are treated in the
“atomic” scalar-relativistic approximation (atomic ZORA)2 with atom-centered numerical atomic
orbitals describing the Kohn-Sham orbitals. For all geometry relaxations, the basis set tight-tier21,
as defined in the standard distribution of the FHI-AIMS package, was used. All the structures
obtained by revised basin-hopping Monte Carlo (RBHMC) and the putative global-minimum clus-
ter configurations (pGMC) form Ref. 3 were optimized using the modified Broyden–Fletcher–
Goldfard–Shanno (BFGS) algorithm without symmetry constraints, to obtain the atomic forces
on every atom smaller than 1.0×10⁻⁵ eV/A and using a self-consistency of 10−6 eV for the to-
tal energy. For Au25, all the calculations were performed by using the spin-polarized mode. For
Au38 and Au40, the spin polarized mode were investigated for few structures with non zero and
zero local initial spin for the core and surface atoms separately, from which still were observed no
spin density. Thus, for Au38 and Au40 all the calculations were performed using the non-polarized
mode. Spin-orbit coupling was not considered.
The BO-MD simulations were performed with the basis set light-tier11, as defined in the stan-
dard distribution of the FHI-AIMS package. The temperature schemes for the MD runs are shown
in detail in Table S1.
Table S1 −MD schemes for the trajectories labeled by T1, T2, and T3 for the Aun nanoclusters(n = 25, 38, and 40) and the time span for each temperature. The structures Au38 and Au40
as indicated by the trajectories J38, J40,1, and J40,2 are the pGMC for the nanoclusters foundby Jiang and Walter3 at 0 K.
System Trajectory Temperature (Time) Total time
Aun
T1 400 K (50 ps)→ 300 K (50 ps) 100 psT2 500 K (50 ps)→ 300 K (50 ps) 100 psT3 600 K (50 ps)→ 300 K (50 ps) 100 ps
Au38 J38 600 K (50 ps)→ 300 K (50 ps) 100 ps
Au40J40,1 600 K (50 ps)→ 300 K (50 ps) 100 psJ40,2
S2

Figure S1 − On the top, relative total energies values of all structures generated using RBHMC4 withthe embedded-atom method (EAM), then locally optimized with PBE+MBD. The relative energiesfor Au38 and Au40 systems obtained with RBHMC are indicated with respect the pGMC3, i.e., Au J
38 ,Au J1
40 , and Au J240 . On the bottom, the number of atom for the core and surface regions are showed,
matching to the relative structures above them. On the right side, the lowest energy configuration fromthe set of structures are represented, in which the core atoms are indicated by the blue color.
0 1 2 3 4 5 6 7 8r (Å)
(arb
. uni
t.)
400 K300 K
0 1 2 3 4 5 6 7 8r (Å)
500 K300 K
0 1 2 3 4 5 6 7 8r (Å)
600 K300 K
22
24
26
Num
ber
of a
tom
s Surf Surf Surf
20 40 60 80 100Time (ps)
0
1
2Core
20 40 60 80 100Time (ps)
Core
20 40 60 80 100Time (ps)
Core
300 K 300 K 300 K400 K 500 K 600 K
Au25 Au25 Au25
Au25 Au25 Au25
Figure S2 − Radial distribution function, g(r), and number of atoms for core and surface regions, forthe MD simulations at 300, 400, 500, and 600 K, starting from Au25 obtained via RBHMC.
S3

0 1 2 3 4 5 6 7 8r (Å)
(arb
. uni
t.)400 K300 K
0 1 2 3 4 5 6 7 8r (Å)
500 K300 K
0 1 2 3 4 5 6 7 8r (Å)
600 K300 K
283236
Num
ber
of a
tom
s
Shell Shell Shell
0 1 2 3 4 5 6 7 8r (Å)
(arb
. uni
t.)
400 K300 K
0 1 2 3 4 5 6 7 8r (Å)
500 K300 K
0 1 2 3 4 5 6 7 8r (Å)
600 K300 K
283236
Num
ber
of a
tom
s
Shell Shell Shell
20 40 60 80 100Time (ps)
02468
Core
20 40 60 80 100Time (ps)
Core
20 40 60 80 100Time (ps)
Core
20 40 60 80 100Time (ps)
02468
Core
20 40 60 80 100Time (ps)
Core
20 40 60 80 100Time (ps)
Core
02468
Protrusions Protrusions Protrusions
02468
Protrusions Protrusions Protrusions
400 K 300 K 500 K 300 K 600 K 300 K
300 K600 K300 K500 K300 K400 K
Au38Au38 Au38
Au40Au40Au40
Au38
Au38
Au38
Au40
Au40 Au40
Figure S3 − Radial distribution function, g(r), and number of atoms for core (blue), shell (orange), andprotrusions (green), for the MD simulations at 300, 400, 500, and 600 K, starting from Au38 and Au40obtained via RBHMC.
S4

0 1 2 3 4 5 6 7r (Å)
(arb
. uni
t.)600 K300 K
0 1 2 3 4 5 6 7r (Å)
600 K300 K
0 1 2 3 4 5 6 7r (Å)
600 K300 K
02468
Num
ber
of a
tom
s
Protrusions Protrusions Protrusions
28
32
36
Shell Shell Shell
20 40 60 80 100Time (ps)
0
2
4
6
Core
20 40 60 80 100Time (ps)
Core
20 40 60 80 100Time (ps)
Core
600 K 300 K 600 K 300 K 600 K 300 K
Au38 pGMC Au40 pGMC Au40
Au38
Au40 pGMC Au40J2
J2
Figure S4 − Radial distribution function, g(r), and number of atoms for core (blue), shell (orange), andprotrusions (green), for the MD simulations at 300 and 600 K, starting from Au38 and Au40 pGMC fromRef. 3.
II Sketch-map parameters
For Au25, the projection with sketch-map was done from of the minimization of the stress func-
tion for 500 landmark points randomly selected over all temperatures, by using the sketch-map
parameters in σ = 3, A = 12, B = 4, a = 1, and b = 2. For Au38 and Au40 the sketch-maps
projections were created from 500 landmark points randomly selected for both systems over all
temperatures. The sketch-map parameters for each were σ = 3.5, A = 12, B = 10, a = 1, and
b = 2 for Au38, and σ = 3.2, A = 12, B = 6, a = 1, and 2 for Au40. The values of σ were chosen
to match approximatively the maximum of the pair distribution function in the high-dimensional
coordination-histogram representation.
S5

-0.10
-0.05
0.00
0.05
0.10∆
QH
irsh
(e)
Core
Surf
Core
Surf
Core
Surf
-0.40
-0.20
0.00
0.20
0.40
∆Q
Hir
sh(e
)
Core
Surf
Core
Surf
Core
Surf
-0.40
-0.20
0.00
0.20
0.40
∆Q
Hir
sh(e
)
Core
Surf
Core
Surf
Core
Surf
0 20 40 60 80 100
Time (ps)
-0.40
-0.20
0.00
0.20
0.40
∆Q
Hir
sh(e
)
Core
Surf
20 40 60 80 100
Time (ps)
Core
Surf
20 40 60 80 100
Time (ps)
Core
Surf
Au25
Au25
Au25
Au38
Au38
Au38
Au40
Au40
Au40
400 K 300 K 500 K 300 K 600 K 300 K
300 K600 K300 K500 K300 K400 K
400 K 300 K 500 K 300 K 600 K 300 K
Au38
pGMC
600 K 300 K 600 K 300 K 600 K 300 K
pGMCAu
40
Au40
J2
Figure S5 − Total Hirshfeld charge population for surface (orange lines), i.e., shell+protrusions, and core(blue lines) regions at all temperature schemes for Au25, Au38 and Au40 nanoclusters. The sequence oftemperatures is indicated for each MD run scheme.
1 2 3 4 5 6 7 8 9 10 11 12Pair distance (Å)
Au40
: 300 K
Au40
: 600 K
1 2 3 4 5 6 7 8 9 10 11Pair distance (Å)
Au38
: 300 K
Au38
: 600 K
0 1 2 3 4 5 6 7 8 9 10Pair distance (Å)
(arb
. uni
t.)
Au25
: 300 K
Au25
: 600 K
Figure S6 − Pair-distribution function for the Au25, Au38, and Au40 nanoclusters at 300 and 600 K.
S6

Table S2 − Average bond life time in picoseconds for core-core (τcc), shell-shell (τss), core-shell(τcs), and shell-protrusions (τsp) for the Au25, Au38, and Au40 nanoclusters at all temperatures.The bond life time for the pGMC are presented for the MD with 600 K → 300 K temperaturesby Au J
38 and Au J140 , which correspond to the structures with tetrahedral core with 4 atoms,
and Au J240 for the structure with triangular core with 3 atoms. In parentheses are indicated
each standard deviation for the bond life times.
Au25 − RBHMC
400 K→ 300 K 500 K→ 300 K 600 K→ 300 K
τss 18.06 (6.61)→ 20.02 (6.65) 14.78 (6.07)→ 19.31 (6.00) 10.15 (6.69)→ 22.89 (6.96)
τcs 14.98 (6.26)→ 15.45 (6.34) 6.02 (4.60)→ 15.41 (5.87) 6.53 (6.35)→ 17.75 (7.01)
Au38 − RBHMC
τcc 22.07 (7.62)→ 23.54 (6.78) 19.76 (7.31)→ 22.20 (6.40) 20.98 (6.30)→ 23.80 (0.01)
τcs 3.92 (5.26)→ 6.47 (5.98) 2.72 (3.61)→ 10.18 (6.53) 2.40 (4.40)→ 7.03 (6.52)
τss 19.58 (6.30)→ 21.16 (5.98) 17.05 (6.45)→ 20.35 (6.35) 15.11 (6.74)→ 22.90 (4.99)
τsp 17.83 (5.45)→ 23.52 (7.71) 16.27 (4.10)→ 20.26 (5.83) 14.94 (4.23)→ 24.29 (7.79)
Au J38 − pGMC
τcc 15.70 (6.46)→ 16.12 (6.75)
τcs 1.86 (4.37)→ 3.36 (6.04)
τss 9.09 (6.65)→ 9.59 (7.05)
τsp 7.57 (4.47)→ 7.02 (6.88)
Au40 − RBHMC
τcc 21.54 (7.29)→ 22.16 (0.12) 18.21 (5.96)→ 18.87 (6.92) 15.31 (5.54)→ 21.13 (7.26)
τcs 7.35 (5.11)→ 9.34 (5.98) 3.06 (3.79)→ 5.96 (5.37) 2.28 (3.09)→ 5.89 (5.59)
τss 18.33 (6.35)→ 18.81 (5.80) 14.08 (5.51)→ 19.66 (4.56) 13.26 (5.93)→ 20.71 (6.28)
τsp 19.33 (6.42)→ 25.01 (5.12) 14.79 (3.24)→ 20.42 (6.06) 10.07 (3.07)→ 19.75 (6.79)
Au J140 − pGMC: 4 atoms in the core
τcc 21.80 (7.22)→ 24.91 (7.78)
τcs 2.65 (3.97)→ 6.80 (6.93)
τss 15.58 (6.03)→ 23.65 (6.80)
τsp 16.42 (4.82)→ 23.61 (7.63)
Au J240 − isomer: 3 atoms in the core
τcc 18.46 (4.51)→ 23.36 (7.36)
τcs 3.53 (4.86)→ 8.76 (6.59)
τss 17.35 (6.28)→ 22.68 (6.19)
τsp 18.65 (6.87)→ 23.44 (6.67)
S7

Figure S7 − Histograms of coordination of a Au40 nanocluster with truncated-octahedron structure, inwhich the 4-fold atoms are in red, 6-fold in black, 7-fold in green, 9-fold in yellow, and 12-fold in blue.
Figure S8 − Probabilities calculated at 300 K via MBAR for all Au25 structures sampled all temperaturesas a function of the sketch-map coordinates, based on a total 300 ps MD sampling. The representedstructures and their respective coordination number histograms were selected from the regions indicatedon the sketch-map coordinates. The central atom in each structure is indicated by the blue color, whilesurface atoms remaining are represented in yellow. Circles and stars with the same color represent initialand final point of geometry relaxations. The pink star is also the pGMC, as found by us.
S8

Figure S9 − Probabilities at 300 K calculated via MBAR for all Au25 (left side) with error bar (rightside) for the structures sampled at all temperatures as a function of the sketch-map coordinates.
Figure S10 − Probabilities at 300 K calculated via MBAR for all Au38 (left side) with error bar (rightside) for the structures sampled at all temperatures as a function of the sketch-map coordinates.
S9

Figure S11 − Probabilities at 300 K calculated via MBAR for all Au40 (left side) with error bar (rightside) for the structures sampled at all temperatures as a function of the sketch-map coordinates.
Figure S12 − Sketch-map projection by each 10 MD steps for the Au25 structures for all temperaturesas summarized at Table 1S. The temperatures are in matching with the Table 1S, from the coloursreference as indicated on the labels at 400 K → 300 K of T1 (black and green points), 500 K → 300 Kof T2 (orange and brown points), and 600 K → 300 K of T3 (red and violet points). The starting pointfrom the structure obtained via EAM-RBHMC is indicated by the square.
S10

Figure S13 − Sketch-map projection by each 10 MD steps for the Au38 structures in each temperatureas summarized at Table 1S. The temperatures are in matching with the Table 1S, from the coloursreference as indicated on the labels at 400 K → 300 K of T1 (black and green points), 500 K → 300 Kof T2 (orange and brown points), 600 K → 300 K of T3 (red and violet points), and 600 K → 300 K(marron and blue points) for MD of the Jiang’s pGMC for the trajectory J38. The starting points fromthe structures obtained via EAM-RBHMC and pGMC are indicated by the white square and diamondsymbols, respectively.
Figure S14 − Sketch-map projection by each 10 MD steps for the Au40 structures in each temperatureas summarized at Table 1S. The temperatures are in matching with the Table 1S, from the coloursreference as indicated on the labels at 400 K → 300 K of T1 (black and green points), 500 K → 300 Kof T2 (orange and brown points), 600 K → 300 K of T3 (red and violet points). For the MD of theJiang’s pGMCs for the trajectories, J40,1 (with core made by 4 atoms) and J40,2 (with core made by3 atoms), 600 K → 300 K (marron and blue points) and 600 K → 300 K (yellow and pink points),respectively. The starting points from the structures obtained via EAM-RBHMC, pGMC, and isomerwith 3-core atoms are indicated by the white square, circle, and diamond symbols, respectively.
S11

Table S3 − Radius of gyration (Rg) as defined by Rg = ∑Ni si/N (where si is the atom distances
from the center of mass and N is the number of atoms), number of core-surface (c-s) bonds,effective coordination number (ECN), and PBE+MBD relative energy for the (unrelaxed) Au25,Au38, and Au40 structures selected from the sketch-map basins and relaxed counterparts. Inbold face are the new proposed pGMC for Au25 and Au38, shown in Fig. S15.
Rg [A] # c-s bonds ECN Relative Energy [eV]
Au25
Aua25 unrelaxed 17.71 13 6.01 0.751
Aua25 relaxed 17.48 14 6.31 −0.203
Auc25 unrelaxed 17.56 13 6.03 0.832
Auc25 relaxed 17.43 13 6.30 −0.046
RBHMC relaxed 17.38 12 6.30 0.000
Au38
Aua38 unrelaxed 24.93 35 6.50 1.341
Aua38 relaxed 24.82 34 6.75 −0.062
Aub38 unrelaxed 24.98 33 6.20 2.643
Aub38 relaxed 24.84 34 6.61 0.203
Auc38 unrelaxed 25.08 35 6.19 1.880
Auc38 relaxed 24.91 38 6.62 0.051
Aud38 unrelaxed 24.95 33 6.37 1.710
Aud38 relaxed 24.85 38 6.57 0.300
pGMC-Jiang3 relaxed 24.76 36 6.82 0.000
RBHMC relaxed 24.62 37 6.82 0.722
Au40
Aua40 unrelaxed 26.06 33 6.51 2.001
Aua40 relaxed 26.13 35 6.61 0.750
Aub40 unrelaxed 26.05 42 6.52 2.255
Aub40 relaxed 25.88 44 6.85 0.790
Auc40 unrelaxed 27.01 30 6.35 1.990
Auc40 relaxed 26.72 30 6.55 0.265
Aud40 unrelaxed 26.71 36 6.26 3.104
Aud40 relaxed 26.22 39 6.92 0.000
Aue40 unrelaxed 26.30 32 6.24 2.636
Aue40 relaxed 26.16 31 6.59 0.706
Au f40 unrelaxed 26.15 38 6.67 1.637
Au f40 relaxed 26.08 38 6.91 0.198
pGMC-Jiang3 relaxed 26.22 39 6.92 0.000
RBHMC relaxed 25.82 39 6.85 0.897
S12
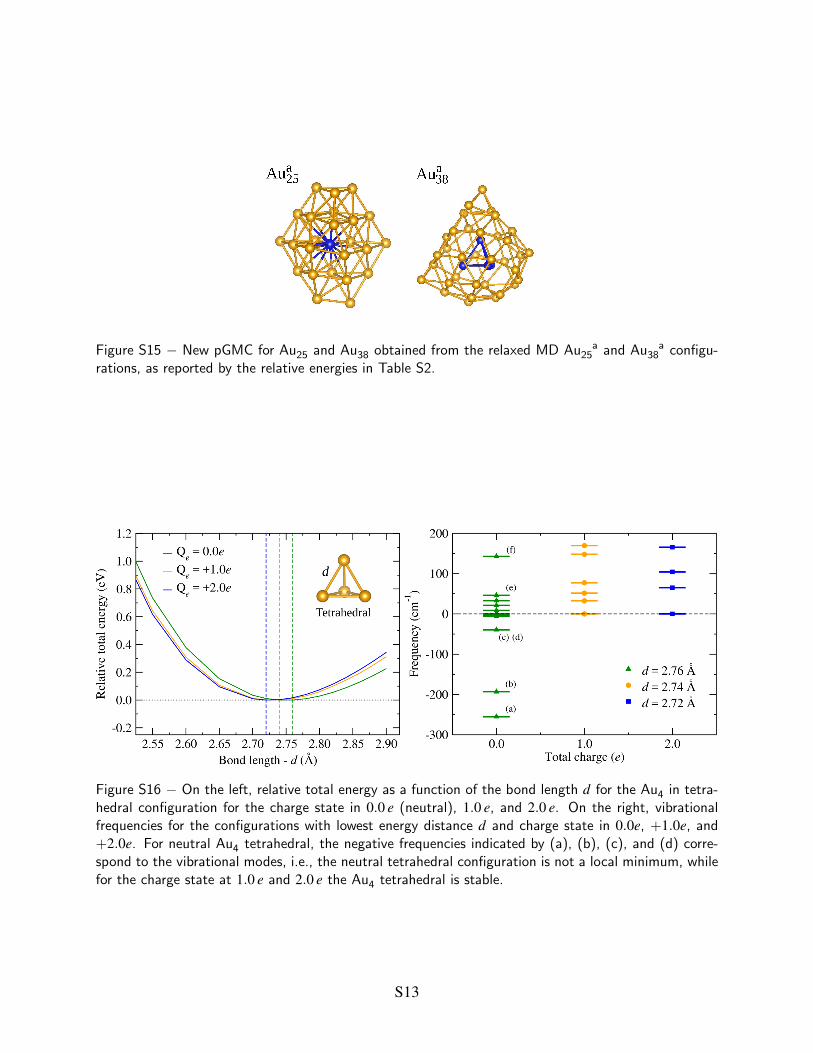
Figure S15 − New pGMC for Au25 and Au38 obtained from the relaxed MD Au a25 and Au a
38 configu-rations, as reported by the relative energies in Table S2.
Figure S16 − On the left, relative total energy as a function of the bond length d for the Au4 in tetra-hedral configuration for the charge state in 0.0 e (neutral), 1.0 e, and 2.0 e. On the right, vibrationalfrequencies for the configurations with lowest energy distance d and charge state in 0.0e, +1.0e, and+2.0e. For neutral Au4 tetrahedral, the negative frequencies indicated by (a), (b), (c), and (d) corre-spond to the vibrational modes, i.e., the neutral tetrahedral configuration is not a local minimum, whilefor the charge state at 1.0 e and 2.0 e the Au4 tetrahedral is stable.
S13

0.0 0.2 0.4 0.6 0.8 1.0 1.2 1.4 1.6 1.8 2.0Total charge (e)
0
50
100
150
200F
req
uen
cies
(cm
-1)
Au4: Tetrahedral
0.0 0.3 0.6 0.9 1.2 1.5 1.8 2.1 2.4 2.7 3.0Total charge (e)
Au5: T-BipyramidalAu
4: Planar Au
5: Trapezoidal
Figure S17 − Vibrational frequencies for the Au4 as planar and tetrahedral and Au5 as trigonal-bipyramidal (T-bipyramidal) configurations relaxed as a function of the positive total charge of thecluster. For Au4 the tetrahedral (blue lines) configuration stabilizes from 0.7e through the relaxationwithout symmetry constraint via BFGS algorithm. For neutral and positive charges up to 0.6e the struc-tures adopt a perfectly planar configuration or slightly distorted (red lines). For Au5 both trapezoidaland trigonal-bipyramidal are stables for the positive charges between 0.0 and 3.0e.
III Data avalability
All the MD-trajectory and geometry-relaxation files are uploaded in the NOMAD Repository,
https://repository.nomad-coe.eu/NomadRepository-1.1 and can be inspected and down-
loaded directly via the DOI: http://dx.doi.org/10.17172/NOMAD/2018.10.30-1.
References
(1) Blum, V.; Gehrke, R.; Hanke, F.; Havu, P.; Havu, V.; Ren, X.; Reuter, K.; Scheffler, M. Ab
Initio Molecular Simulations with Numeric Atom-Centered Orbitals. Comput. Phys. Commun.
2009, 180, 2175–2196.
(2) Van Lenthe, J. H.; Faas, S.; Snijders, J. G. Gradients in the Ab Initio Scalar Zeroth-Order
Regular Approximation (ZORA) Approach. Chem. Phys. Lett. 2000, 328, 107–112.
(3) Jiang, D.; Walter, M. Au40: A Large Tetrahedral Magic Cluster. Phys. Rev. B 2011, 84.
S14

(4) Rondina, G. G.; Da Silva, J. L. F. A Revised Basin-Hopping Monte Carlo Algorithm for Struc-
ture Optimization of Clusters and Nanoparticles. J. Chem. Inf. Model 2013, 53, 2282–2298.
S15