meta-analysis of constitutive qtls for disease resistance ... · meta-analysis of constitutive qtls...
TRANSCRIPT
©FUNPEC-RP www.funpecrp.com.brGenetics and Molecular Research 14 (1): 961-970 (2015)
Meta-analysis of constitutive QTLs for disease resistance in maize and its synteny conservation in the rice genome
L. Zhao1, H.J. Liu2, C.X. Zhang2, Q.Y. Wang1 and X.H. Li2
1College of Plant Science, Jilin University, Changchun, China2Institute of Crop Germplasm Resources, Jilin Academy of Agricultural Sciences, Gongzhuling, China
Corresponding authors: Q.Y. Wang / X.H. LiE-mail: [email protected] / [email protected]
Genet. Mol. Res. 14 (1): 961-970 (2015)Received May 16, 2014Accepted November 4, 2014Published February 3, 2015DOI http://dx.doi.org/10.4238/2015.February.3.3
ABSTRACT. We collected data regarding 340 disease resistance quantitative trait loci (QTLs) from the maize genomic database (MaizeGDB). We constructed an integrated linkage map and analyzed this map by using the BioMercator 2.1 software with IBM2 2008 Neighbors genetic linkage map as a reference. We used a meta-analysis method to identify five “consensus” synthetic resistance QTLs located on maize chromosomes 1, 3, 6, and 10, with map intervals of 5.14, 9.00, 28.50, 1.73, and 33.34 cM, respectively. The gene and marker sequences within the five “consensus” QTLs were downloaded from the MaizeGDB website. We identified eight resistance gene analogs (RGAs), through comparison of these sequences with the resistance genes of other members of Poaceae by using the online BLASTx software. On the basis of comparative mapping between the maize genetic map and the rice physical map, 54 rice and 44 maize resistance genes were projected onto the maize IBM2 2008 Neighbors genetic linkage map by using a synteny conservation approach. Additionally, 15 resistance genes in the “consensus” QTL regions were found in
962
©FUNPEC-RP www.funpecrp.com.brGenetics and Molecular Research 14 (1): 961-970 (2015)
L. Zhao et al.
two “consensus” QTLs on chromosomes 3 and 6; these resistance genes included rp3, scmv2, wsm2, RG3, RG16, RG36, RG51, RG53, scmv1, mdm1, RG5, RG8, RG10, RG14, and RG29. Our results provide valuable information for fine-mapping QTL, gene cloning, and molecular breeding for resistance in maize.
Key words: Maize; QTL for disease resistance; Meta-analysis; Integrated linkage map; Comparative mapping; Genetic map
INTRODUCTION
The development of molecular marker techniques has enhanced our ability to map loci involved in disease and insect resistance in maize and other plant species (Bernardo et al., 1992; Ahn and Tanksley, 1993; Bubeck et al., 1993; Pe et al., 1993; Zaitlin et al., 1993; Frey-mark et al., 1994; Lübberstedt et al., 1999; Welz et al., 1999a). McMullen and Simcox (1995) reported that genes involved in resistance to disease and insects were not randomly distributed on a chromosome, but were located in a cluster-chromosome arm or in a specific region. With the exception of chromosomes 7 and 9, disease resistance genes showed a clustered distribu-tion. Studies to determine whether crops use the same regulatory mechanism, such as regula-tory proteins (trans-acting factor), or the same cis-element to modify resistance, are required.
The launch of the maize genome project and the development of bioinformatics have led to a rapid increase in the identification of quantitative trait loci (QTLs). However, few identical QTLs have been identified in the same experimental population or the same environ-ment by different researchers or during different years (Welz et al., 1999b). Goffinet and Ger-ber (2000) developed a meta-analysis approach to combine the results of several studies that address a set of related research hypotheses. This method provides a modified Akaike criterion that can be used to determine the number of QTLs that are actually represented by the QTLs detected during different experiments. The modified Akaike criterion is computed to select between models with one, two, three, or more QTLs. Simulations are conducted to investigate the quality of the model obtained by using this method in various situations. According to Goffinet and Gerber (2000), the method allows the length of the confidence interval (CI) of QTLs to be consistently reduced when there were very few “actual” QTL locations. Moreover, integrated QTL analysis may facilitate the identification of “actual” QTLs, and is therefore of considerable interest to researchers. All of the inferred QTLs led to improved resistance to disease and insects in maize. The meta-analysis method has been used to construct integrated QTL maps for resistance to sugarcane mosaic virus, gray leaf spot, and head smut in maize, by compiling the total number of available QTL loci and using the IBM2 2008 Neighbors genetic linkage map as a reference (Chardon et al., 2004; Yan et al., 2004; Li et al., 2005; Ji et al., 2007; Shi et al., 2007; Lü et al., 2008).
In the present study, we collected data regarding 340 disease resistance QTLs in maize, from the literature publications cited above, and also from internal research programs. We projected these data onto a single reference map. We developed an “overview” statistic to highlight “hot spots” of resistance QTLs. Next, for each linkage group, we used the meta-analysis approach of Goffinet and Gerber (2000) to estimate the number of QTLs underlying the synthesized results, and also their consensus positions. We compared these consensus po-sitions with the few currently available positions of candidate genes for resistance in maize.

963
©FUNPEC-RP www.funpecrp.com.brGenetics and Molecular Research 14 (1): 961-970 (2015)
Analysis of constitutive disease resistance QTLs in maize
Our objectives were 1) to provide valuable information for mapping, isolating, and cloning QTLs in large-genome crops, such as maize, by using rice genome data and 2) to understand the evolutionary forces that have structured the organization of maize genomes.
MATERIAL AND METHODS
We searched the MaizeGDB website (http://www.maizegdb.org/) and Google Scholar (http://scholar.google.co.uk/) for QTL data and published literature reports relating to dis-ease resistance. We collected data regarding 340 disease resistance QTLs. For each of these QTLs, we reviewed the names of the parental lines, the size, the type of plant populations (F2, backcross, near isogenic lines, etc.), the investigated traits, and the calculation methods for phenotypic values (Table 1).We defined an “experimental” QTL for one of the investigated populations and a given trait in a given environment (a single location or the mean of several locations, depending on the information available from the published literature reports). The original QTL location maps used in each study were downloaded from the MaizeGDB web-site. Each QTL was characterized according to its map position (most likely position and CI around this position) and the proportion of phenotypic variance (R2). We did not consider QTL allelic effects in the present study. In cases where the CI for the QTL position was not available in the published literature report, we estimated a 5%CI by using the approach described by Darvasi and Soller (1997) as follows:
where N is the size of the population and R2 is the explained phenotypic variance.
(Equation 1)
QTL Loci L-markera R-markerb Adjacent IBM L- IBM R- IBM locus Trait Reference marker markerc markerd
qgls1 65.8 php20640 php20682 - 146.9 524.5 - Gray leafspot Bubeck et al. (1993)qnclb2 22.00 umc53a umc78 - 50.9 - - Northern leaf blight Welz et al. (1999a)qspo6 162 - - csg7 - - 538.27 Sporisorium reiliana Lübberstedt et al. (1999)qrust8 6.00 - - n585 - - 25.7 Common rust Brown et al. (2001)
Table 1. Locations of the resistance QTLs used in this study.
aLeft marker; bright marker; cIBM left marker; dIBM right marker; “-” = not present.
The results collected from the QTL mapping experiments involved different genetic maps, which shared only a few common markers. The QTLs were projected on the IBM2 2008 Neighbors genetic linkage map, in which 237 RFLP and SSR markers were selected to provide an unambiguous locus order. All of these markers were subsequently located on the refer-ence map based on their relative distances to flanking framework markers, while maintaining constant distances between the framework markers. Finally, we projected the most probable position for each QTL, and the left and right flanking ends of the CI, by using a homothetic function, based on common markers between the reference map and the QTL map. In a few cases, we found discrepancies in these common markers between the initial QTL and the refer-ence map. When possible, we discarded inverted markers from the projection process and used the next flanking markers. Otherwise, the QTL was not projected.

964
©FUNPEC-RP www.funpecrp.com.brGenetics and Molecular Research 14 (1): 961-970 (2015)
L. Zhao et al.
To quantify the contribution of a given genomic region to phenotypic trait variation, we calculated a statistical parameter, hereinafter termed overview, which estimated the prob-ability that a given genome segment comprised a QTL in one of the experiments considered. When the estimated position of the input QTL (QTLi) was projected on the reference map, we considered that the true position of the QTLi was normally distributed around the most likely location pi of the QTL, with a variance Si
2: N (pi, Si2) (Visscher et al., 1996). In most of
the investigated experiments, the limits of the CI of the QTL position were estimated as the positions where the lower limit of detection (LOD) value decreased by one unit relative to the value of the most likely position. This interval approximately corresponded to a 5% CI (Lynch and Walsh, 1998); hence, Si
2 was estimated as follows:
For each QTL of a given linkage group, we calculated (every 0.5 cM) the probability that the true position lay between positions x and x - 0.5. Next, we used the following expression to estimate the average probability that segment x, x - 0.5 comprised a QTL in an experiment:
where nbQTL is the number of QTLs and nbE is the total number of experiments. This pa-rameter was plotted along the reference map. To highlight regions where the density showed a notable peak, we plotted the average value of the parameter on the same graph. This average value was equivalent to the uniform probability that segment(x, x + 0.5) comprised a QTL in an experiment, for a known average number of QTLs per experiment (nbQTL/nbE), without information on QTL positions:
We used the QTL meta-analysis algorithm developed by Goffinet and Gerber (2000) to determine whether N QTLs linked to a same trait or related ones, or detected in independent experiments and located in the same region, were consistent with 1-, 2-, 3-, 4-, or N-QTL models (N-QTL model being the case where there are as many “real” QTLs as there are QTLis). For each of the five models, we determined the most likely QTL arrangement, assuming a Gaussian distribution, by using the maximum likelihood method. Thereafter, we used an Akaike-type statistical criterion to indicate the best among the five models.
For each model, we determined the consensus QTL positions by using the mean of the QTL distribution maximizing the likelihood. We estimated the variance of QTL consensus position as follows:
(Equation 2)
(Equation 3)
(Equation 4)
(Equation 5)
965
©FUNPEC-RP www.funpecrp.com.brGenetics and Molecular Research 14 (1): 961-970 (2015)
Analysis of constitutive disease resistance QTLs in maize
where δi2 is the variance of the position of the QTLi of the distribution. The 95%CI of the
consensus QTL position was approximately deduced from the previous variance as follows:
Meta-analysis computing was based on the position of each QTLi, and on the variance of this position, which was assessed through CI values.
To construct a comparative map of the maize and rice genomes, we downloaded 95 re-sistance genes mapped on chromosomes of rice (R-genes) from http://www.gramene.org/. The maize contigs and their BAC tags, which were homologous with R-genes, were determined by using the homothetic function (http://ensembl.gramene.org/Zea_mays/Info/Index); these R-genes were in silico mapped on the physical map of maize, based on gene sequence syn-teny conservation between maize and rice. The R-genes were also located on the IBM2 2008 Neighbors genetic linkage map based on map position coordinate analysis between maize BAC tags and markers. The maize resistance genes were downloaded from the MaizeGDB website and projected onto the IBM2 2008 Neighbors genetic linkage map.
We selected the disease QTL markers within the “consensus QTL” on the IBM2 2008 Neighbors genetic linkage map, and searched for any associated sequences of the DNA and EST information on the MaizeGDB website. We conducted multiple sequence comparisons of maize against rice by using TBLASTX; we considered sequences with an E-value of <1e-6 and a sequence identity of >75% over a minimum150-bp high-scoring segment pair. To avoid spurious associations between sequences that were identical only in terms of a small com-mon domain, we defined significant overlap between two sequences as an overlap of ≤60% of the sequence length. In some cases, the sequence of a given species showed a high identity with two or more sequences of another species. We used the DNAMAN protein-translation software to deduce the open reading frame. We identified and verified the resistance candidate genes by analyzing the overlapping regions of the gene positions and QTLs.
RESULTS
We obtained 340 resistance QTLs, accounting for 12 types of maize disease. We constructed a “consensus” map by using the high-density IBM2 2008 Neighbors genetic linkage map (Figure S1) and the adjacent markers to each QTL. We used the meta-analysis approach to identify five common “consensus” resistance QTL intervals, located on chromosomes 1, 3, 6, and 10 (Table 2).
(Equation 6)
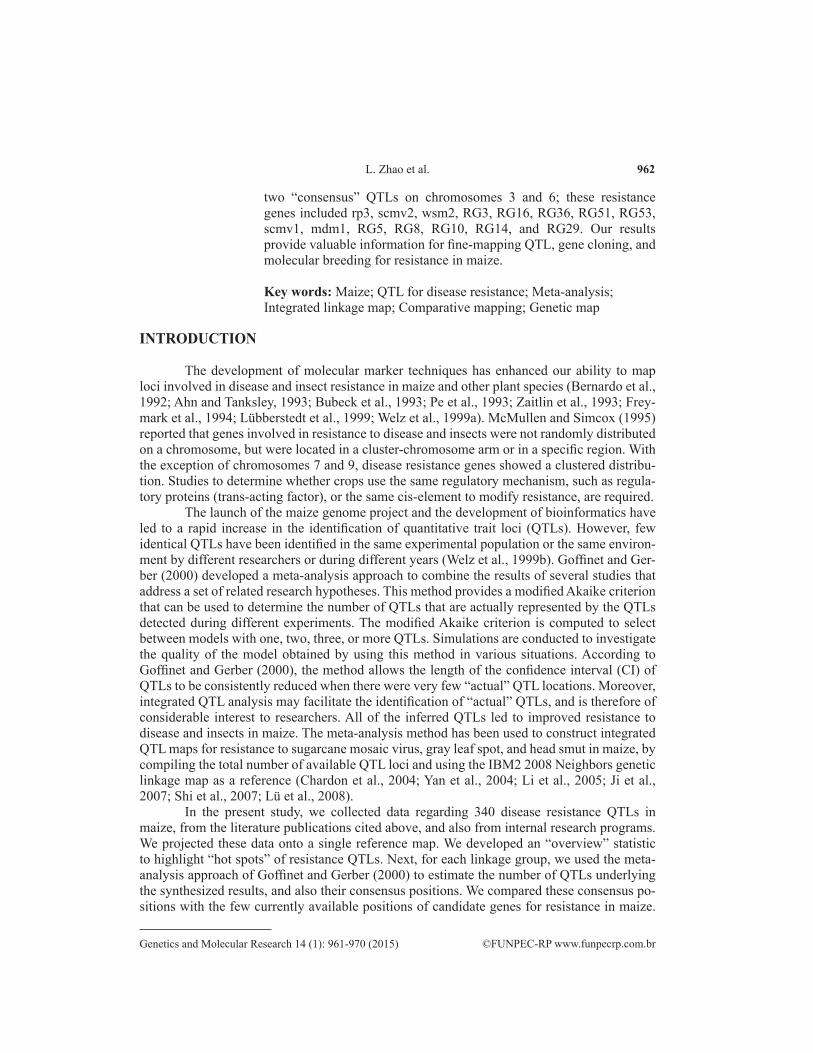
Table 2. Results of QTL meta-analysis associated with maize resistance, conducted by using the BioMercator2.1 software.
Chr.a AIC valueb Map position CIc Map distanced L-markere Coordinate R-markerf Coordinate
1 801.71 204.87 202.3-207.44 5.14 gpm518 202.87 umc1073 208.51 801.71 654.9 644.02-653.02 9 csu374b 642.3 umc1358 653.43 668.7 292.06 277.81-306.31 28.5 IDP1693 276.67 cdo689b 306.46 1500.83 60.1 59.24-60.97 1.73 gpm308b 57.96 Gpm396 61.2510 185.59 223.99 207.32-240.66 33.34 IDP439 206.84 umc64a 242.3aChromosome; bvalue of the Akaike criterion; cconfidence interval; dlength of hot-spot loci; eleft marker; fright marker.
966
©FUNPEC-RP www.funpecrp.com.brGenetics and Molecular Research 14 (1): 961-970 (2015)
L. Zhao et al.
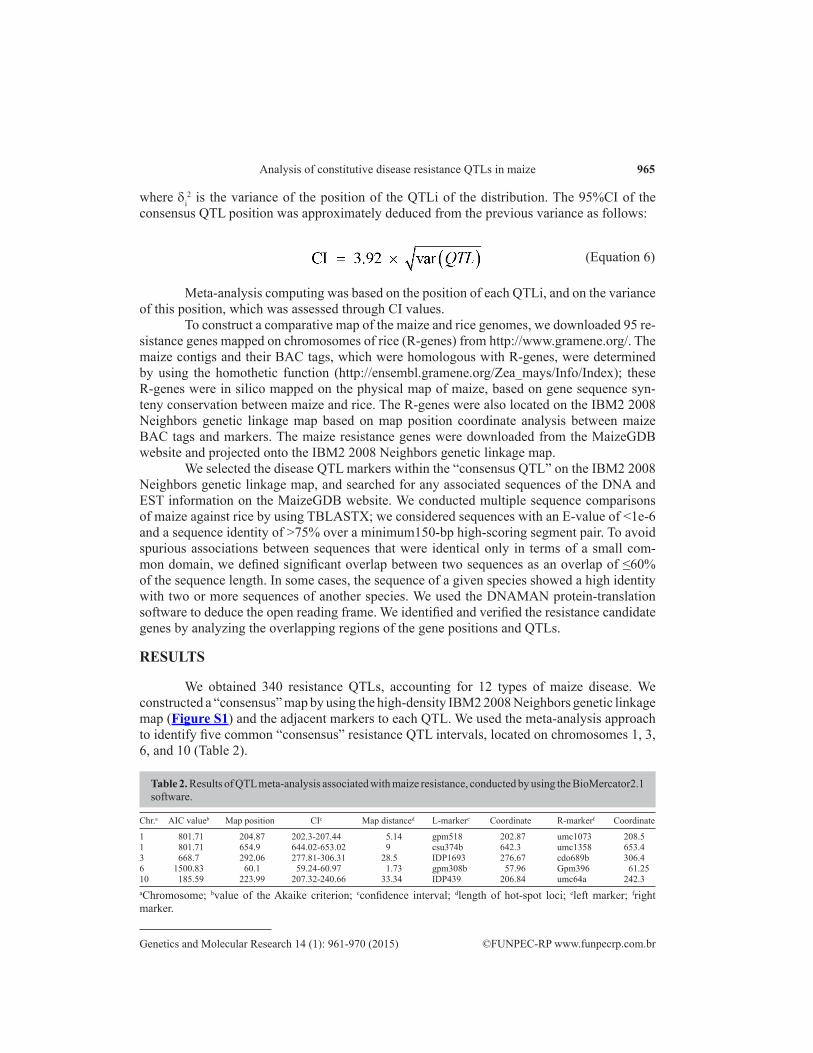
Figure 1. QTL meta-analysis for maize disease resistance. The initial QTLs and their confidence interval are represented along the chromosome as gray horizontal lines; the results of meta-analysis are represented in red.
The resistance QTL and the linked or adjacent markers were localized on the left and right of the chromosome, respectively. The different colored lines on the left of the chromo-some indicate the resistance QTL to 12 different diseases of maize. The left vertical line and horizontal line of the chromosome indicate the QTL confidence interval and LOD, respec-tively.
Figure 1 shows the results of the overview statistic for QTL repartition along the maize genome. The value of the density curve was 69 times higher than the average value, indicating that several tens of regions were involved in disease resistance in maize disease. The curve showed close peaks located on chromosomes 1, 3, 6, and 10. Five re-gions displayed higher values (empirically determined as five times the average value of the curve).
By using meta-analysis, we initially detected 340 QTLs located in “consensus” loci. In accordance with the overview method, these loci were widely distributed throughout the maize genome. Meta-analysis comprised a powerful tool for estimating a larger number of QTLs in real regions, which displayed the complex patterns of the overview curve. For ex-ample, the meta-analysis results for the hot-spot region on the chromosome are shown in Table 2.
On the basis of statistical analysis of disease resistance genes and markers in “con-sensus” QTL regions, we found 232 sequence fragments containing disease resistance genes (Table 3). We identified five positional candidate resistance genes within the “consensus QTL” on chromosomes 1 and 3 (Table 4). Specifically, sequence CF025181 contained the GIST-C-DHAR conserved domain related to the hydroa protein gene; sequence CF025181 contained the conserved domain related to the hydroa protein gene; sequence CC824988 contained the SMC conserved domain related to the virus gene; sequence BM335300 contained the con-served domain related to the virus gene; sequence CG366993 contained the NB-ARC con-served domain related to the pathogenesis-related protein; and sequence AY106058 contained the SMC conserved domain related to the pathogenesis-related protein.

967
©FUNPEC-RP www.funpecrp.com.brGenetics and Molecular Research 14 (1): 961-970 (2015)
Analysis of constitutive disease resistance QTLs in maize
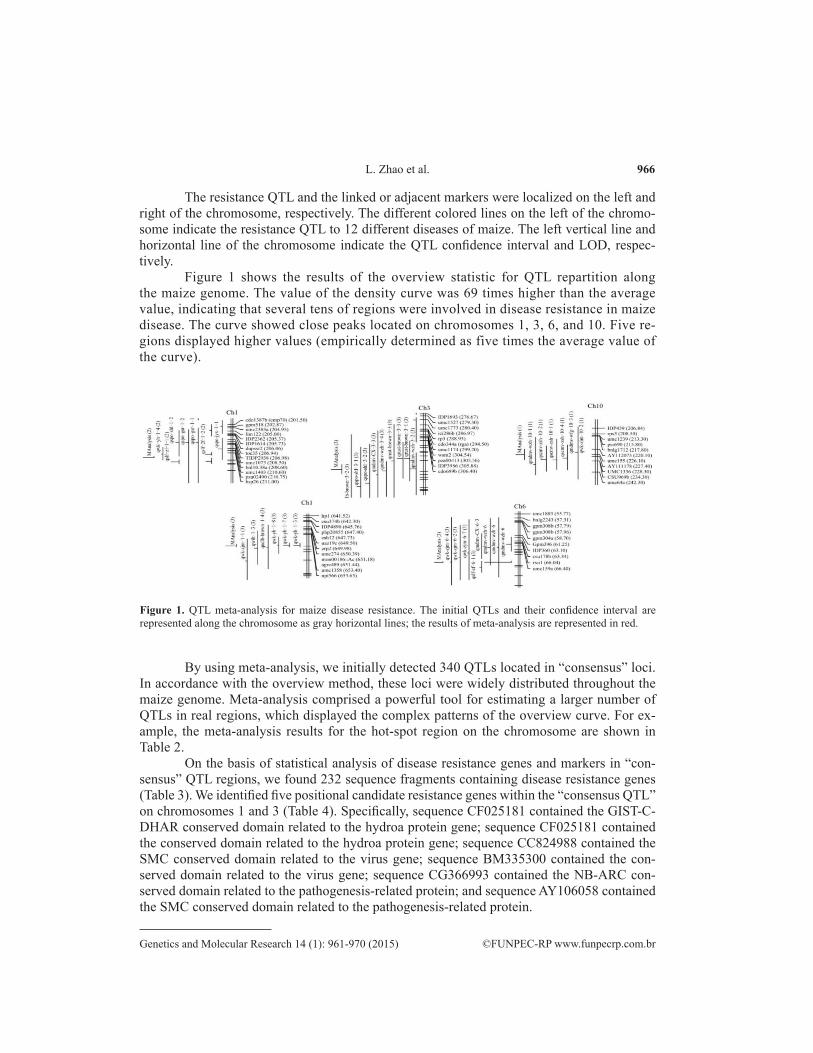
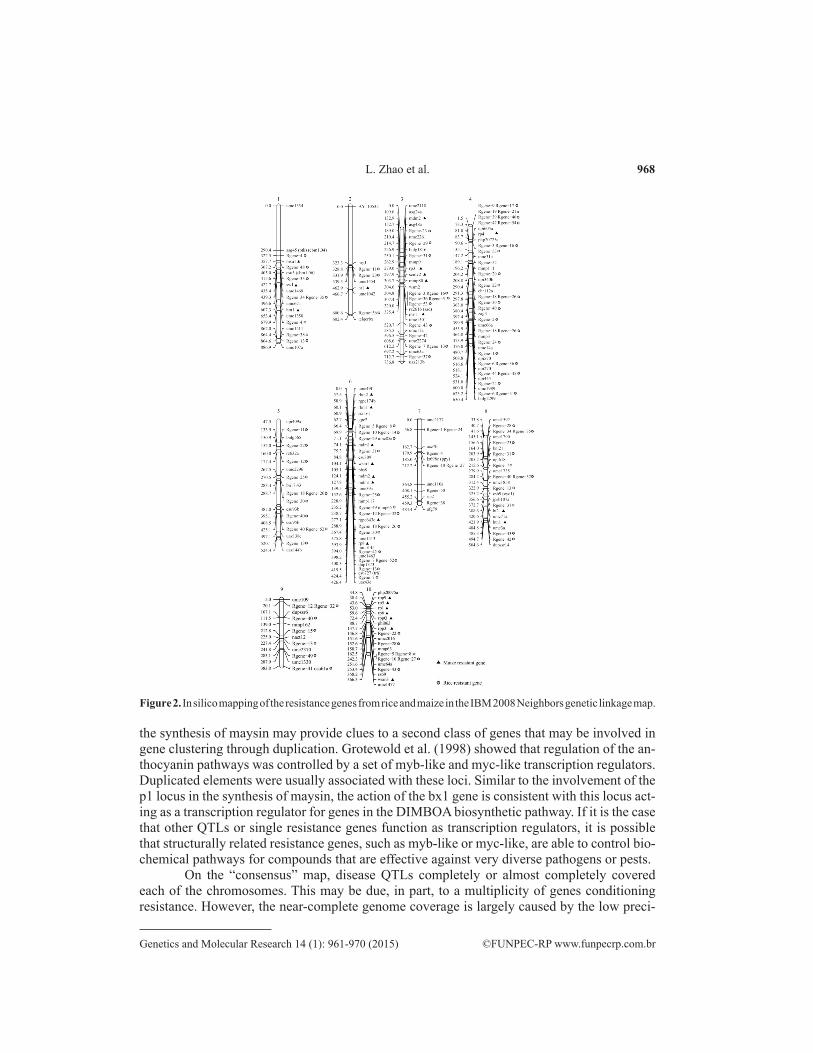
We downloaded data regarding 130 resistance genes of rice, e.g., rust resistance ki-nase, disease resistance protein, and resistance protein homolog, from http://www.gramene.org. We determined the contigs and clones of maize, which were homologous with the R-genes, by using gene sequence homologous analysis with the homothetic function (http://ensembl.gramene.org/Zea_mays/Info/Index). Among 130 R-genes of rice, 54 genes were re-localized on the maize physical map and were further mapped on the IBM2 2008 Neighbors genetic linkage map (Figure 2). We constructed and analyzed the integrated linkage map by using a map chart that included 98 R-genes in maize and rice. Comparison of the location of rice and maize R-genes revealed that 15 rice R-genes were located within the “consensus” QTL regions; these genes included rp3, scmv2, wsm2, RG3, RG16, RG36, RG51, RG53, scmv1, mdm1, RG5, RG8, RG10, RG14, and RG29.
Table 3. Homologous sequence analysis within the “consensus” QTL interval.
Chr. Map distance CI Sequence type Total
ESTa GSSb HTGc STSd DNA cDNA
1.03 5.37 200.88-206.25 9 9 3 0 0 0 21 1.07 9.00 644.02-653.02 6 10 9 2 1 0 28 3.04 26.28 273.98-300.26 16 39 13 1 4 1 74 6.00 1.36 59.24-60.97 5 3 5 0 0 0 1310.03 33.34 224.6-265.38 22 39 28 2 0 5 96Total - - 58 100 58 5 5 6 232aExpressed sequence tags; bgenome survey sequences; chigh throughput genomic sequences; dsequence tagged sites.
Table 4. Homologous genes relevant to disease resistance within the “consensus” QTL interval.
Chr. Marker Sequence Coded homologous gene Conserved domain Coded protein
1 gpm569 CF025181 ABS79343 GST-C-DHAR Hydroa protein gene pco147635a CC824988 ABZ11028 SMC Viral protein gene IDP2385 BM335300 BAE98672 Gamma-COP Viral protein gene3 Mmp80 CG366993 AP008218 NB-ARC Pathogenesis-related protein IDP1433 AY106058 001581403 SMC Pathogenesis-related protein
DISCUSSION
The “consensus” QTL map presented here has implications for maize breeding. For instance, the QTL for virus resistance was relatively tightly clustered, suggesting that a limited number of loci are involved in conditioning virus resistance. Thus, pedigree breeding may represent the most appropriate strategy for transferring virus resistance; moreover, marker-assisted selection may be feasible. For northern corn leaf blight, the reported QTL distribution was much more diffused. Therefore, to improve resistance to this disease, it may be appropri-ate to bring together diverse sources of resistance alleles. Recurrent selection may be the most effective way of achieving this. Ceballos (1991) reported that recurrent selection dramatically enhanced resistance to northern corn leaf blight.
On the basis of the diversities of organisms and resistance responses of loci mapping within a particular cluster, it is unlikely that all genes in clusters are involved in signal trans-duction. The bx1 locus controlling the synthesis of DIMBOA, and the p1 locus controlling
968
©FUNPEC-RP www.funpecrp.com.brGenetics and Molecular Research 14 (1): 961-970 (2015)
L. Zhao et al.
the synthesis of maysin may provide clues to a second class of genes that may be involved in gene clustering through duplication. Grotewold et al. (1998) showed that regulation of the an-thocyanin pathways was controlled by a set of myb-like and myc-like transcription regulators. Duplicated elements were usually associated with these loci. Similar to the involvement of the p1 locus in the synthesis of maysin, the action of the bx1 gene is consistent with this locus act-ing as a transcription regulator for genes in the DIMBOA biosynthetic pathway. If it is the case that other QTLs or single resistance genes function as transcription regulators, it is possible that structurally related resistance genes, such as myb-like or myc-like, are able to control bio-chemical pathways for compounds that are effective against very diverse pathogens or pests.
On the “consensus” map, disease QTLs completely or almost completely covered each of the chromosomes. This may be due, in part, to a multiplicity of genes conditioning resistance. However, the near-complete genome coverage is largely caused by the low preci-
Figure 2. In silico mapping of the resistance genes from rice and maize in the IBM 2008 Neighbors genetic linkage map.
969
©FUNPEC-RP www.funpecrp.com.brGenetics and Molecular Research 14 (1): 961-970 (2015)
Analysis of constitutive disease resistance QTLs in maize
sion of QTL localization. (Lee et al., 2002) reported that low precision resulted in very high estimates of disease QTL size. In principle, QTL interval estimates could be refined by meta-analysis. To ensure a sufficient sample size for meta-analysis, the QTLs for multiple diseases must be used. This would rely on the questionable assumption that these multiple diseases were conditioned by the same genes. More accurate estimations of QTL locations and im-proved characterization of maize genome duplications will offer the opportunity to examine the way in which QTLs and their specificities evolve after duplication events.
ACKNOWLEDGMENTS
Research supported by the Breeding Program of Agricultural Department of Jilin Province “Research on germplasm resources, breeding methods, and seed production of the main crops in Jilin Province” and the Key Project of Science and Technology Department of Jilin Province “The creation of maize lines for alkali tolerance by GWAS and QTL mapping”.
Supplementary material
REFERENCES
Ahn S and Tanksley SD (1993). Comparative linkage maps of the rice and maize genomes. Proc. Natl. Acad. Sci. U. S. A. 90: 7980-7984.
Bernardo R, Bourrier M and Olivier JL (1992). Generation means analysis of resistance to head smut in maize. Agronomie 12: 303-306.
Brown AF, Juvik JA and Pataky JK (2001). Quantitative trait loci in sweet corn associated with partial resistance to Stewart’s wilt, northern corn leaf blight, and common rust. Phytopathology 91: 293-300.
Bubeck DM, Goodman MM, Beavis WD and Grant D (1993). Quantitative trait loci controlling resistance to gray leaf spot in maize. Crop Sci. 33: 838-847.
Ceballos H, Deutsch JA and Gutiérrez H (1991). Recurrent selection for resistance to Exserohilum turcicum in eight subtropical maize populations. Crop Sci. 31: 964-971.
Chardon F, Virlon B, Moreau L, Falque M, et al. (2004). Genetic architecture of flowering time in maize as inferred from quantitative trait loci meta-analysis and synteny conservation with the rice genome. Genetics 168: 2169-2185.
Darvasi A and Soller M (1997). A simple method to calculate resolving power and confidence interval of QTL map location. Behav. Genet. 27: 125-132.
Freymark PJ, Lee M and Woodman WL (1994). Molecular-marker-facilitated investigation of host-plant response to Exserohilum turcicum in maize (Zea mays L.): Components of resistance. Theor. Appl. Genet. 88: 305-313.
Goffinet B and Gerber S (2000). Quantitative trait loci: A meta-analysis. Genetics 155: 463-473.Grotewold E, Chamberlin M, Snook M, Siame B, et al. (1998). Engineering secondary metabolism in maize cells by
ectopic expression of transcription factors. Plant Cell 10: 721-740.Ji HL, Li XH, Xie CX, Hao ZF, et al. (2007). Comparative QTL mapping of resistance to Sporisorium reiliana in maize
based on meta-analysis of QTL locations. J. Plant Genet. Resour. 8: 132-139. Lee M, Sharopova N, Beavis WD, Grant D, et al. (2002). Expanding the genetic map of maize with the intermated B73 x
Mo17 (IBM) population. Plant Mol. Biol. 48: 453-461.Li XH, Li XH, Hao ZF,Tian QZ, et al. (2005). Consensus map of the QTL relevant to drought tolerance of maize under
drought conditions. Sci. Agric. Sin. 38: 882-890.Lü XL, Li XH, Xie CX, Hao ZF, et al. (2008). Comparative QTL mapping of resistance to sugarcane mosaic virus in maize
based on bioinformatics. Hereditas 30: 101-108.Lübberstedt T, Xia XC and Tan G (1999). QTL mapping of resistance to Sporisorium reiliana in maize. Theor. Appl.
Genet. 99: 593-598.Lynch M and Walsh B (1998). Genetics and analysis of quantitative traits. Sinauer Associates, SunderlandMcMullen MD and Simcox KD (1995). Genomic organization of disease and insect resistance genes in maize. Mol. Plant
Microbe Interact. 8: 811-815.
970
©FUNPEC-RP www.funpecrp.com.brGenetics and Molecular Research 14 (1): 961-970 (2015)
L. Zhao et al.
Pe ME, Gianfranceschi L, Taramino G, Tarchini R, et al. (1993). Mapping quantitative trait loci (QTL) for resistance to Gibberella zeae infection in maize. Mol. Gen. Genet. 241: 11-16.
Shi LY, Li XH, Hao ZF and Xie CX (2007). Comparative QTL mapping of resistance to gray leaf spot in maize based on bioinformatics. Agric. Sci. China 6: 1411-1419.
Visscher PM, Thompson R and Haley CS (1996). Confidence intervals in QTL mapping by bootstrapping. Genetics 143: 1013-1020.
Welz HG, Schechert AW and Geiger HH (1999a). Dynamic gene action at QTLs for resistance to Setosphaeria turcica in maize. Theor. Appl. Genet. 98: 1036-1045.
Welz HG, Xia XC, Bassetti P, Melchinger AE, et al. (1999b). QTLs for resistance to Setosphaeria turcica in an early maturing Dent x Flint maize population. Theor. Appl. Genet. 99: 649-655.
Yan JB, Tang H, Huang YQ, Zheng YL, et al. (2004). Comparative analyses of QTL for important agronomic traits between maize and rice. Acta Genet. Sin. 31: 1401-1407.
Zaitlin D, DeMars S and Ma Y (1993). Linkage of rhm, a recessive gene for resistance to southern corn leaf blight, to RFLP marker loci in maize (Zea mays) seedlings. Genome 36: 555-564.