merging f inancial m arkets and e arly u.s. … · led” growth in the u.s. case. ... and the...
TRANSCRIPT

EMERGING FINANCIAL MARKETS AND EARLY U.S. GROWTH
by
Peter L. Rousseau and Richard Sylla
Working Paper No. 00-W15
May 2000
DEPARTMENT OF ECONOMICS VANDERBILT UNIVERSITY
NASHVILLE, TN 37235
www.vanderbilt.edu/econ

Emerging Financial Markets and Early U.S. Growth
by
Peter L. Rousseaua
Richard Syllab
May 2000
Abstract
Studies of early U.S. growth traditionally have emphasized real-sector explanations for anacceleration that by many accounts became detectable between 1815 and 1840. Interestingly, theestablishment of the nation's basic financial structure predated by three decades the canals, railroads,and widespread use of water and steam-powered machinery that are thought to have triggeredmodernization. We argue that this innovative and expanding financial system, by providing debt andequity financing to businesses and governments as new technologies emerged, was central to thenation's early growth and modernization. The analysis includes a set of multivariate time series modelsthat relate measures of banking and equity market activity to measures of investment, imports andbusiness incorporations from 1790 to 1850. The findings offer support for our hypothesis of “finance-led” growth in the U.S. case. By implication, the interest today in improving financial systems as ameans of fostering sustainable growth is not misplaced.
Keywords: financial markets, securities markets, growth, early national period, VAR.
JEL categories: E44, G10, N11, N21
a - Department of Economics, Vanderbilt University, Box 1819 Station B, Nashville, TN 37235, USAand NBER. E-mail to [email protected].
b - Department of Economics, Leonard N. Stern School of Business, New York University, 44 West 4th Street, New York, NY 10012, USA and NBER. E-mail to [email protected].

Emerging Financial Markets and Early U.S. Growth
Abstract
Studies of early U.S. growth traditionally have emphasized real-sector explanations for an
acceleration that by many accounts became detectable between 1815 and 1840. Interestingly, the
establishment of the nation's basic financial structure predated by three decades the canals, railroads,
and widespread use of water and steam-powered machinery that are thought to have triggered
modernization. We argue that this innovative and expanding financial system, by providing debt and
equity financing to businesses and governments as new technologies emerged, was central to the
nation's early growth and modernization. The analysis includes a set of multivariate time series models
that relate measures of banking and equity market activity to measures of investment, imports and
business incorporations from 1790 to 1850. The findings offer support for our hypothesis of “finance-
led” growth in the U.S. case. By implication, the interest today in improving financial systems as a
means of fostering sustainable growth is not misplaced.
Keywords: financial markets, securities markets, growth, early national period, VAR.
JEL categories: E44, G10, N11, N21

1 Early contributions include John G. Gurley and Edward S. Shaw (1955), Raymond W. Goldsmith(1969), and Ronald I. McKinnon (1973). More recent analytical treatments include JeremyGreenwood and Boyan Jovanovic (1990) and Valerie R. Bencivenga and Bruce D. Smith (1991).
2 For example, Robert G. King and Ross Levine (1993) and Levine and Sara Zervos (1998) take across-sectional approach and Peter L. Rousseau and Paul Wachtel (1998, 2000) use modern timeseries techniques.
1
I. Introduction
Debate over the importance of financial institutions and markets in promoting long-run
economic growth has almost always been one of degree. Few today would contend that the
development of a vibrant financial structure has little to do with growth prospects. Reaching this
consensus is due in large part to economic-theoretical insights that provide reasons for thinking that
good finance is central to ameliorating informational asymmetries between savers and entrepreneurs,
and to mobilizing resources and applying them to their most productive uses.1 But solid empirical
support for these channels having large real effects has been elusive. Recent studies applying both
cross-sectional and time series techniques to groups of countries suggest that financial development is
at least a good predictor of future economic performance.2 Yet both the data employed and conceptual
limitations make it difficult to determine decisively whether good finance actually leads to growth.
Further, such studies were not designed to consider the detailed effects of changing financial structures
within an individual country on its real sector over the long-term. Hence, currently available evidence,
though supportive of the thesis that good finance promotes economic growth, remains unable to
persuade skeptics to abandon the view that finance, to borrow Raymond Goldsmith’s (1969, p. 49)
words, “reflects economic growth whose mainsprings must be sought elsewhere.”
Even the most determined skeptic, however, must come to grips with the case of the early
United States, which rose from effective bankruptcy in the mid-1780s to become a world-class
economy within a half century and arguably history’s most successful emerging market. Studies of the

2
new republic’s early growth, such as those by Douglass C. North (1961), Paul A. David (1967),
Robert E. Gallman (1986), and Thomas Weiss (1994), do tend to emphasize real explanations for what
has come to be accepted as a gradual acceleration in the rate of output growth between 1790 and 1840.
Such factors as increases in the productivity of labor, the adoption of manufacturing and transportation
technologies, the expansion of foreign commerce, and the growth of cotton exports in particular or
westward agricultural expansion in general are central to these accounts. Economists are becoming
increasingly aware, however, that the emergence of the nation's modern financial structure predated by
several decades major investments in canals and railroads and the widespread use of water and steam-
powered machinery. Within five years of the ratification of the Federal constitution, the nation had
restructured its War of Independence debts, introduced the U.S. dollar as a convertible currency,
formed both a banking system and a national bank with branches, established and linked securities
markets in major cities, and gained the confidence of European investors.
As state governments proceeded to charter more than 800 new banks and securities markets
grew over the next half century, the financial sector provided short- and long-term debt and equity
financing to businesses and governments for purposes of economic expansion and the implementing of
new technologies (Richard Sylla 1998, 1999). Securities markets in New York, Boston, Philadelphia
and other cities grew apace with the banking system, promoting the mobilization of both domestic and
foreign capital and infusing the new financial claims with liquidity. Such financial development, having
occurred on such a scale only in the 17th-century Dutch Republic and in 18th-century England, was
rare in history. And nowhere did it occur as rapidly as in the young United States.
That the impressive record of early U.S. financial development has only recently come into
clearer focus may explain why it has heretofore been neglected or regarded as a relatively unimportant
element in the expansion of a largely agrarian economy. Existing studies of early U.S. growth look

3
primarily at macroeconomic aggregates such as GNP, and its dominant agricultural as well as “non-
agricultural” components. Such an emphasis on broad aggregates, however, masks the role of the
financial system in the rapid development of the initially small commercial, manufacturing, and service
sectors. More than agriculture, these were the sectors that began to expand rapidly after 1790.
Eventually, we know, their expansion came to dominate the U.S. economy's overall growth. Hence, if
we pay little attention to these “modern” sectors until their impact on macroeconomic aggregates
becomes detectable, we will miss some crucial early aspects of economic modernization. And we are
likely to miss as well, or to minimize, the importance of the financial development that made this
modernization possible.
Our paper investigates the hypothesis that U.S. economic growth and development were
"finance led." We begin by demonstrating that the United States, which in the 1780s lacked nearly all
the elements of a modern financial system, by the 1820s had a financial system in place that was both
innovative, large, and perhaps the equal of any in the world. What one of us has termed "the Federalist
financial revolution," led by Secretary of the Treasury Alexander Hamilton in the early 1790s, was at
the heart of these developments (Sylla 1998). History rightly credits Hamilton and his allies in the first
Congresses with putting the new government's finances on a solid footing and establishing its credit.
Less appreciated is the articulated and rapidly expanding financial system that emerged in response to
the strengthening of the nation's public finances.
Next, we make an empirical case for, and test the hypothesis of, finance-led U.S. growth.
Although earlier work has presented evidence favoring this hypothesis for the latter half of the 19th
century (Rousseau 1998; Rousseau and Wachtel 1998), limitations of the available data make it
challenging to offer empirical support for the nation’s early years. For example, until the ones
presented here, time-series estimates of the U.S. money stock for years prior to 1820 have not been
3 Because the full dimensions of financial change in the early United States are only now becomingclear, comparisons with England are rare. In the 1830s, the American economist Henry Carey and theEnglish banker James Gilbart debated the relative merits of the two countries’ banking systems (seeSylla 1985). In the modern literature, for comparative discussions pertaining to later periods of the19th century, see Lance E. Davis (1966), Davis and Robert J. Cull (1994), Davis and Gallman(forthcoming), and R. C. Michie (1987).
4
available. Moreover, the wealth of information contained in newspapers and other private sources
about the extent and sophistication of the antebellum securities markets is only now being uncovered
(Sylla 1998; Sylla, Jack W. Wilson, and Robert E. Wright 1997; Jeremy Atack and Rousseau 1999;
Rousseau 1999; Wright 1999). Our paper synthesizes the progress made to date in collecting such
quantitative information to offer a cohesive, if still sketchy, view of the early U.S. financial system and
how it compared with that of contemporary England.3
After presenting some of the new financial data, we explore the size and nature of dynamic
interactions between activity in the real sector and the scope of financial-system development. The
main results derive from multivariate time series models that include measures of activity in banks, the
money market, and equity markets, as well as indicators of output, investment, imports and business
incorporations from 1790 until 1850. Block exogeneity tests examine whether developments in the
financial sector precede increases in real activity, and impulse responses functions quantify the absolute
and relative sizes of these effects. These tests shed light on an important case in any argument for
"finance led" growth.
II. The Emergence of U.S. Financial Markets, 1790-1850
By any standard, modern or otherwise, the speed and success with which a banking system and
capital markets emerged in the United States after 1790 is nothing short of remarkable. In the 1780s,
the Confederation government was burdened by huge debts left over from the Revolutionary War.
Because it lacked taxing powers, it could not service, much less pay down, these debts. Evidences of

4 One of these institutions, the Bank of New York, failed repeatedly to obtain a state charter ofincorporation from 1784, when it was organized, until 1791. Another, Philadelphia's Bank of NorthAmerica, had its 1782 Pennsylvania charter revoked in 1785, obtained a new one from Delaware in1786, and then had the Pennsylvania charter re-instituted in 1787.
5
debts–essentially junk bonds in default–traded for small fractions of par value in unorganized and
illiquid markets. The states were in a similar position but at least had revenues to service their debts.
The entire intermediating sector consisted of but three just-organized banks (one each in
Philadelphia, New York and Boston) that supported local commercial interests and could not yet be
considered a banking system.4 The nation's money stock, if it could be described as such, consisted of
foreign coins and specie, fiat paper moneys issued by each of the thirteen states with varying rates of
exchange among them, and the notes and deposits of the three banks having only local circulation.
Against this background, a sense of urgency arose among the nation’s leaders to facilitate the
development of an institutional structure that could mobilize the resources needed to link the nation’s
land mass, promote domestic and foreign trade, and build a productive modern sector. The new
Constitution hammered out at the Philadelphia convention of 1787 spoke to these issues.
Hamilton, appointed as the new federal government's Treasury Secretary in 1789, became the
architect of U.S. financial strategy. Congress implemented the federal taxation allowed by the
Constitution and Hamilton built the system of revenue collection. That system became the basis for a
restructuring of old Confederation and assumed state debts via fresh issues of federal securities that
paid interest quarterly in hard money. These features raised the value of the new securities to domestic
investors and their appeal to foreign investors. He next persuaded Congress to charter a Bank of the
United States (BUS), a mixed (publicly and privately owned) corporation whose shares the private
investors could purchase by tendering the new federal debt. The Bank helped to achieve the dual
purposes of raising the nation’s credit standing and establishing a more uniform currency. Finally, he

5 Our estimates of paid-in capital extend backward the series for 1837-1850 that appears inHistorical Statistics of the United States (Bureau of the Census, 1975, series X587). This was doneby using the total number of state banks to “blow up” the paid-in capital for reporting state banks ineach year from 1803-1837 (Fenstermaker, 1965b, p. 406, and Fenstermaker 1965a, pp. 66-68) andthen joining the result to the Census series. Fluctuations in the authorized capital of all state banks for1790-1802 (Fenstermaker, 1965a, p. 13) were then used to approximate the series through 1790. Weconvert to constant 1860 dollars using the index of consumer prices developed by David and PeterSolar (1977, p. 16).
6
drew up the plans for the dollar, defined in terms of both gold and silver, as the nation's monetary unit
and base, and called for establishing a federal mint to make U.S. coins.
Hamilton's plans, formulated and adopted in a two-year burst of activity from 1789 to 1791,
worked. By 1792, in rapidly emerging securities markets the new 6 percent securities sold at or above
par, and the national bank was fully subscribed. State governments began to retire their fiat currencies,
which were replaced by a monetary base of specie dollars and bank note and deposit liabilities
convertible to the specie base. The financial revolution launched with these measures in the early
1790s was to continue vigorously for decades.
A. The Rise of State Banking
Starting with only three banks in 1789, 28 new banks obtained state charters in the 1790s and
another 73 were chartered in the decade that followed (see J. Van Fenstermaker, 1965a, p. 13). The
profitability of these early banks, for which annual dividends of more than 8 percent were common,
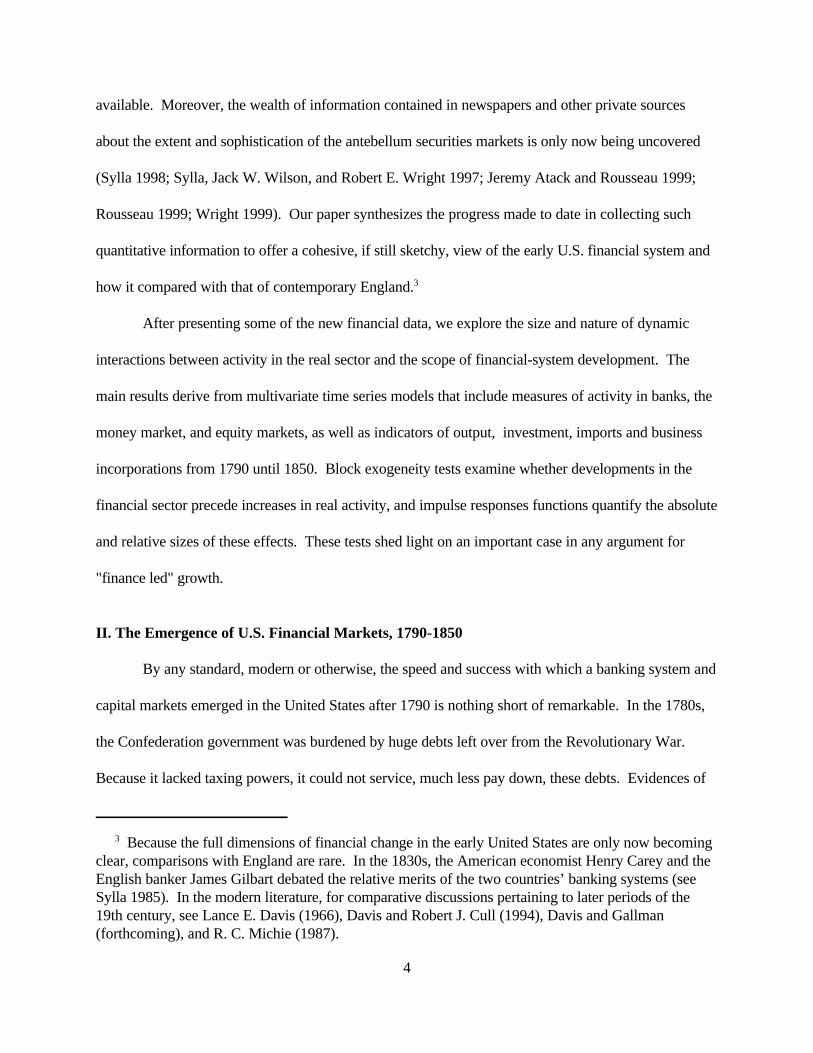
sparked a rapid expansion that reached a high-water mark of 834 state banks by 1840. Then, after a
brief decline in the depression of the early 1840s, the number of state banks nearly doubled again by
1860. Figure I shows the evolution of the number of chartered banks and our estimates of their real
paid-in capital before 1850.5 Like the rise in the number of banks, the increase in capital from a mere
$3 million in 1790 to $426 million by 1840 (in current dollars) reflects their growing role in mobilizing
resources and providing credit and other financial services.
7
Year
1790 1795 1800 1805 1810 1815 1820 1825 1830 1835 1840 1845 18500
100
200
300
400
500
600
700
800
900
Number of State Banks
Paid in Capital (mil. 1860 US$)
Figure I. The Rise of State Banking, 1790-1850.
The state-chartered banks, like the federally chartered BUS, were corporations with limited
liability, which is a major reason why they were able to attract so much capital. The early Americans
did not invent the banking corporation, but as of 1790 the world had seen few examples of it, and these
were privileged monopolies such as the Bank of England. What the Americans did, uniquely when
they did it, was charter so many banking corporations that they had to compete with one another rather
than enjoy monopolistic privileges. From the 1790s to the middle of the nineteenth century, nowhere
else in the world was the banking corporation as a competitive business enterprise developed to the
extent that it was in the United States (see Anna Jacobson Schwartz 1947). Only then, six or seven
decades after the American innovation, did the old nations of the world begin to emulate the United
States by allowing competitive corporate banking (Sylla 1985).
The significance of these developments is underscored by a comparison with England. It is a
stylized fact among economic historians that England was the financial leader of the 19th century. The

6 Our estimate of the paid-in capital of U.S. state banks in 1825 (in current dollars) is $106.9million. This is somewhat higher than the estimate of Sylla (1998), which likely underestimated paid-incapital by using a conservative estimate of 0.6 for the ratio of paid-in to authorized capital. The Englishestimates are rougher still, but are based on a generous estimate of the capital of the typical bankingpartnership. So, if anything, they may overstate the amount of English bank capital.
8
pound sterling was the world's leading currency, London and the Bank of England were at the center of
the world's finances, and the London capital market intermediated the international flow of capital.
Much less known is that as early as 1825, the United States, with a population still smaller than that of
England and Wales (11.1 versus 12.9 million), had roughly 2.4 times the banking capital of the latter
(Sylla 1998, p.93).6 This was not entirely the result of the U.S. financial revolution. English policy,
and in particular the monopoly privileges of the Bank of England and the restriction of all other banks
to unlimited-liability partnerships of six or fewer people, retarded banking development in that country
until 1825, when the policy was altered to allow joint-stock banking with unlimited liability.
B. The Emergence of Securities Markets
The precocity of U.S. banking development was duplicated in the development of securities
markets. Following the debt refinancing of 1790 and the launching of the BUS a year later, securities
markets sprang up virtually overnight in the major cities (Philadelphia, New York, Boston and
Baltimore) to provide regularized trading opportunities for the new claims. The "national market"
securities, which then included the U.S. debt issues and Bank stock, traded in each city and were joined
by steadily growing lists of "local" securities. Even a securities market crash in early 1792 could not
for long arrest the rapid deepening of these markets, where ever more securities could be liquidated at
prices that were more consistently fair than those which would have obtained otherwise. This leap in
asset liquidity allowed investors, both domestic and foreign, to overcome their reluctance to hold U.S.
securities. By 1803, more than half of the government's debt and the stock of the Bank, and fully half

7 The sources for New York include the New York Daily Advertiser, the New York Shipping andCommercial List, and New York Prices Current. For Philadelphia, the sources include the New YorkShipping and Commercial List, Philadelphia Prices Current, Grotjan’s Philadelphia Public SaleReport, Poulson’s American Daily Advertiser, and the Gazette of the United States. Listings forBoston were compiled from data in Martin (1873). Early newspaper listings of securities quotationsappear to be samples rather than complete populations of the securities available for trading. Thelistings, it seems, captured the larger and more actively traded issues. Smaller issues and issues ofcorporations located at some distance from the urban centers of securities trading did not make it intothe newspaper listings, even though they may have occasionally traded in the urban centers.
8 Though not included in Table I, it is interesting to note that listings rose at an average annual rateof nearly 11 percent between 1795 and 1804. There is some double counting in the totals of securitieslistings from newspapers, as issues of U.S. debt and Bank stock were traded in all cities and were notconsolidated in the totals reported here. Our view is that these issues were the blue-chip securities ineach market, and that consolidation would result in underestimating the size of the market that emergedin each of the cities.
9
of all American securities issued to that date were held by European investors (Sylla, Wilson, and
Wright 1997, Sylla 1998). For the United States, capital market globalization arrived early in the
nation’s history, long before the more celebrated capital market globalizations of the late 19th and late
20th centuries.
A rough measure of the size of securities markets is the number of claims listed therein. The
early government documents that left behind a wealth of information about banks and their condition
are, however, virtually silent on the topic of securities markets. Fortunately, the newspapers of the time
contain the raw material that is needed to build a view of the early U.S. securities markets. Figure II
depicts the number of securities that appeared in the New York, Philadelphia and Boston newspapers
on or around June 30 of each year from 1790 to 1850.7 Table I includes the corresponding average
growth rates by decade. Though a sharp rise in the number of securities listed in newspapers is evident
from Figure II for the 1820s in all three markets, it is less obvious from the figure but apparent in Table
I that the 1790s and 1800s were also decades of active market growth.8
The breakdown of total listings for government, financial, transportation and other (including

10
Year1790 1795 1800 1805 1810 1815 1820 1825 1830 1835 1840 1845 18500
50
100
150
200
250
300
350
400
450
3 CitiesBostonNew YorkPhiladelphia
Figure II. Number of Listed Securities in Three Cities, 1790-1850.
Table IAverage Annual Growth Rates of Listed Securities by Decade, 1790-1860
Period Total Listed Governments Financial Transport
1790-1799 7.9% 4.6% 18.0% 0.0%
1800-1809 7.4 -1.1 11.6 18.0
1810-1819 4.8 9.0 4.1 0.2
1820-1829 8.5 4.2 8.9 18.7
1830-1839 6.0 6.5 3.8 18.0
1840-1849 3.8 11.6 0.3 7.4
1790-1849 6.4 5.8 7.7 10.4
The table includes securities listed in New York, Philadelphia and Boston.

11
Year
1790 1795 1800 1805 1810 1815 1820 1825 1830 1835 1840 1845 18500
25
50
75
100
125
150
GovernmentsBanksInsuranceTransportOther
Figure III. Breakdown of Listed Securities in Three Cities, 1790-1850.
manufacturing) securities shown in Figure III sheds some light on the sectoral sources of securities-
market growth. The number of government securities shows the most variation among the categories,
but a sharp increase in level occurs for all categories in the 1820s. Table I shows, however, that
listings for financial institutions–banks and insurance companies–grew at an average annual rate of 18
percent in the 1790s, which is double their growth rate in the 1820s, and at a rate of nearly 12 percent
per year in the decade 1800-1809. This suggests that a fundamental transformation in the way that the
nation mobilized and allocated capital resources began long before the 1830s, a period more often
associated with the rapid expansion of banking. Listings of transportation securities also grew rapidly
between 1800 and 1809, suggesting that the early capital markets met with some success in raising
funds for internal improvement projects such as turnpike roads and bridges.
As with bank capital, we can make a rough comparison of the size of the U.S. and English

9 The English source, Course of the Exchange, covers the London market, whereas the U.S.sources cover several city markets. Our 1825 comparison of the two countries is valid, however,because English newspapers record no listings of securities traded outside London before 1830, andEnglish provincial stock exchanges did not appear until the late 1830s and 1840s (W. A. Thomas1973).
10 The national debt of the U.K., comprising some 27 of the 320 English securities listed inWetenhall’s Course of the Exchange, and including Bank, South Sea, and India stock since thesecompanies were capitalized by government debt, was vastly larger ( £820 million, or nearly $4 billion)than the U.S. government debt ($84 million) and indeed all U.S. public debts in 1825. England hadfought many more wars over a far longer period than had the young United States. If we look just atequity markets, a different sort of comparison emerges. For most of the 293 English securities thatwere not part of the national debt, Course of the Exchange lists the par value of shares and the numberof company shares, as well as the par value of a small number of non-national debt issues (which cameto £7.2 million or $34.3 million dollars at $4.8 to the pound sterling). The total value of English equityissues that can be calculated came to £32.79 million. For 42 of the 293 issues, or about 14 percent ofthe listings, there was insufficient information to calculate par value capitalization. Some of these,perhaps most, were new issues just beginning to be traded, but if we assume that they were on averageof the same capitalization as issues whose par value capitalization could be measured, a likely liberalestimate of the total size of the English equity market in 1825 is some £38 million or $183 million.
12
securities markets in 1825. For the three large cities whose markets are portrayed in Figure II, 187
securities entered the 1825 listings. Adding in the Baltimore (33 securities) and Charleston (12
securities) markets, we arrive at a total of 232 securities listings in 1825. The newspaper of record for
the English market, Wetenhall's Course of the Exchange, lists 320 English securities as well as a
number of foreign issues in mid 1825. On that reckoning, the U.S. markets were smaller than the
English, but already in the same league.9
Course of the Exchange also provides sufficient information to make a rough estimate of the
size of the English equity market in 1825. Our calculations put it at £38 million, or $183 million.10
This estimate of English equity in 1825 is not all that much larger than the equity of U.S. banks alone in
that year, which including the Bank of the United States and state-chartered banks came to $138
million. The total U.S. equity market was, of course, larger, but how much larger is not yet known. A
rough estimate can be derived from the data of Goldsmith (1985), indicating that the U.S. equity

13
market came to $40 million around 1803 and $890 million in 1850. If we assume constant continuous
growth (which works out to be 6.6 percent per year over the period), we derive an estimate of $171
million as the size of the U.S. equity market in 1825.
The conclusion we draw from these exercises is both obvious and perhaps surprising: By
1825, the size of the U.S. and English equity markets was virtually the same. And this despite the fact
that the English had been developing their market for fully a century before the Americans got started
on developing theirs. Thus, when the two nation’s financial systems are compared, conventional views
that the English were far and away the financial leaders of the 19th century, and that the United States
circa 1825 was just beginning to develop in modern ways, would seem to require some revision.
That the United States had an equity market capitalization virtually the same as England's in
1825, but with fewer equity securities listed, implies that the average U.S. equity was more highly
capitalized than the average English equity. This likely was a consequence of the United States taking
the lead in chartering corporations, particularly banks in the early period, with limited liability. In a
number of ways the U.S. and English equity markets were similar. Both listed insurance and
transportation companies, a variety of utilities, and miscellaneous companies including manufacturing
enterprises. The great difference between the two markets was banks. The Americans had them in
spades. The English market in 1825 listed but two, one the Bank of England–more a government
security than a private equity, and treated by the English as such–and the other, in the "Miscellaneous"
category, was not an English bank at all, but the Provincial Bank of Ireland.
C. The Stock of Money
Still another way to measure financial development is through growth in liquid assets, or the
money stock. This includes obligations of banks to the public and specie outside of banks. Increases in
the real value of these assets reflect more widespread use of the market economy. As the United States

14
modernized, expanded its international trade and gained the confidence of foreign investors, an inflow
of specie and the expansion of bank credits arising from these activities encouraged imports, modern
production activities, and the start of internal improvements.
Any estimate of the money stock before 1850 must necessarily be based on sketchy and
incomplete data. This is primarily because the most important component in the early years, specie in
the hands of the public, is difficult to determine with confidence. Here, we start with Peter Temin’s
(1969) estimates of the money stock for 1820-1850 and replicate his method as closely as possible to
extend the series backward to 1790. The result is the first attempt to provide a continuous view of
money growth before 1820, and to our knowledge makes the best possible use of available data.
Although it is an approximation, we expect that the series captures fluctuations in the money stock
well. Appendix A offers a detailed description of its construction.
Figure IV presents the series, which indicates a threefold increase in the money stock between
1790 and 1820, indicating an average annual growth rate of about 3.7 percent. During the next one
and one-half decades, to the mid 1830s, the money stock rose at a rate of more than 7 percent per year.
From 1837 to 1842 occurred a major collapse, comparable with that of the Great Depression of the
1930s, as the money stock shrank to less than three-fifths of the 1836 level before recovering rapidly at
a rate of 8 percent per year in the late antebellum era (1842-1858). Over the six decades, 1790-1850,
portrayed in Figure IV, the money stock grew at an annual rate of 4.3 percent.
The tripling of the U.S. money stock from 1790 to 1820 can be compared with the behavior of
the English money stock in approximately the same era. According to Cameron, a narrow version of
the money stock of England and Wales doubled in size between 1800/1801 and 1831, while a broader
version including bills of exchange barely grew at all (Cameron et al. 1967, Table II.2, p. 42). So the
U.S. money stock, along with the U.S. population and economy, was growing faster than England's in

15
Year1790 1795 1800 1805 1810 1815 1820 1825 1830 1835 1840 1845 18500
50
100
150
200
250
300
350
400
Figure IV. The Stock of Money, 1790-1850.
the early 19th century. But the English money stock, even the narrow version of it, was about four
times larger than the U.S. stock in 1820/21. England's population and economy were larger than those
of the United States at that time, and the English economy was rather fully commercialized and
monetized, something that the U.S. economy was still becoming. America's corporate banks also had
large capitals in relation to their liabilities, whereas for England's small-partnership banks the opposite
was the case (see Sylla 1985 and Naomi R. Lamoreaux 1994). Moreover, the striking U.S. financial
developments of the early decades were largely confined to the New England and Middle Atlantic
states. In commercialization and monetization, the Northeast region of the U.S. by the 1820s had, it
appears, become rather like England.
III. Indicators of Economic Growth in the Early U.S.
If we are to test quantitatively the hypothesis that financial developments jump-started U.S.

16
modernization in the nation’s early decades, we need to have some measures of modernization for that
period. Such measures are not numerous, but there are a few. The ones that we consider here are
estimates of GNP and its investment component, trade data, and data on business incorporations.
A. National Accounts Aggregates
Much of what is now known about the growth rate of output (or income) in the pre-1840 U.S.
"statistical dark age" is the result of discussions in recent decades among economic historians that have
led to Weiss's (1994) refinements of David's (1967) conjectural estimates. The consensus view now
abandons any notion of a "take off" in favor of a gradual acceleration in the trend rate of output growth
over the 1800-1840 period, although it remains uncertain whether waves of more active growth
occurred in such periods as 1790-1807, 1820-1835, and 1845-1855. Table II summarizes the David
and Weiss estimates of growth rates, as well as those derived from the GNP estimates of Thomas
Senior Berry (1988). The pre-1840 estimates, particularly Weiss's, are modest by later standards, but
they offer a sharp contrast to the picture of stagnation before 1840 posited earlier by Robert F. Martin
(1939) and George Rogers Taylor (1964).
The differences between the David and Weiss estimates for 1820-1840 derive primarily from
assumptions that underlie their agricultural basis, such as the number of acres under cultivation, the
number of workers per acre, and the productivity of an average worker. Berry's GNP estimates, which
we used to compute the period averages attributed to him in Table II, are from his published annual
series, which extrapolated the Kuznets-Kendrick-U.S. Department of Commerce estimates backward
from 1875. Though the annual series is built upon a statistical rather than theoretical model and uses
extrapolators which become less numerous the farther back the series runs, the results are broadly
consistent with David's conjectures and may well reflect, at a minimum, fluctuations in the level of
economic activity. We would note in particular that Berry's series of real GNP per capita in Figure V

17
Year
1790 1795 1800 1805 1810 1815 1820 1825 1830 1835 1840 1845 185050
60
70
80
90
100
110
120
130
Figure V. Real Per Capita GNP, 1790-1850.
Table IIEstimates of Annual Growth in Real Per Capita GNP, 1790-1860
Period David Berry Weiss
1790-1806 1.30% 1.70% NA
1800-1820 0.27 1.27 0.28
1820-1840 1.96 1.63 0.84
1840-1860 1.60 1.58 1.60
1800-1840 1.13 1.45 0.56
1800-1860 1.29 1.41 0.90
The table presents average rates of annual growth in per capita GNPover the subperiods listed at the left. Sources are the averages publishedin David (1967) and in Weiss (1994), and averages computed from theannual series in Berry (1988).

11 Berry uses from 10 to 26 extrapolators for his GNP and investment series between 1789 and1850, with 18 extrapolators available by 1804. His methodology averages the growth rates of a set ofmedian extrapolators in each year (using 3 series in the 1790s and 6 series after 1800) to compute thegrowth rate of a “consensus pattern.” The pattern is then linked with the Department of Commerceconcept of annual GNP for 1876. The technique thus omits in each year those series that exhibit thewidest and narrowest fluctuations. The authorized capital and deposits of U.S. banks are the onlyfinancial variables among the extrapolators, and are thus unlikely to have had a large effect on theevolution of the aggregates. Indeed, an earlier version of Berry’s GNP series (1968) that does notinclude financial variables until 1816 has a correlation coefficient of 0.989 for 1790-1850 and 0.955 for1790-1815 with the final (1988) series. See Berry (1968, 1988) for a complete discussion.
18
shows a gradual acceleration before 1807 and from 1825 to 1835.11
The inclusiveness of existing GNP estimates, which perforce reflect the dominance of
agriculture in the early economy, makes their fluctuations unlikely to reflect activity in the relatively
small and presumably more productive "modern" sector. For example, the panic of 1837 and the
subsequent downturn do not produce a sharp decline in the series. Nevertheless, the use of modern
technologies in commerce, transportation, and manufacturing was well underway by the 1820s and had
already dramatically changed the complexion of the U.S. economy. Thus, GNP estimates might not
indicate, but would not preclude, a "take off" in the modern sector at some time prior to 1820.
As a narrower concept, investment, is likely to reflect developments in the modern sector more
effectively than aggregate output and be responsive to a financial sector that is able to mobilize savings.
As a measure of modern activity, however, investment is still flawed as it would, or could, mostly
reflect traditional investment activities of the dominant agricultural sector. Nonetheless, Berry (1988)
provides us with an annual series for per capita real investment by subtracting the consumption, net
foreign investment and government expenditure components from GNP, and we will use it in our
empirical investigation. This series, presented in Figure VI, shows a vigorous rise between 1799 and
1807, a rise that is not nearly as pronounced in his GNP series, as well as similar increases in the War
of 1812 era and in the decade after 1825. The series falls more than 25 percent between 1837 and

19
Year1790 1795 1800 1805 1810 1815 1820 1825 1830 1835 1840 1845 18500
5
10
15
20
25
Gross Private Domestic InvestmentImports
Figure VI. Real Per Capita Investment and Imports, 1790-1850.
1843, suggesting that the panic of 1837 and its aftermath may have affected the modern sector more
sharply than the agriculturally-oriented general economy upon which the GNP estimates are based.
International trade data may reflect developments in the modern sector still better than broad
aggregates such as GNP and investment. North (1961) made this argument forcefully by characterizing
foreign demand for U.S. exports as a stimulus to business innovation and expansion between 1790 and
1840. Stanley L. Engerman (1977) and others have pointed out, however, that export data alone cannot
fully capture the internal impact of such "export-based" expansions. Imports, on the other hand, may
reflect demand-side growth more effectively since they are sensitive to incomes rising from exports, re-
export services, and inflows of foreign capital. Most importantly, imports also reflect changes in
income arising from additional export-induced production that finds its way into domestic markets.
Figure VI includes the annual level of real per capita imports using North's (1961, pp. 229,

20
280) index of import prices as a deflator. The period between 1790 and 1802 saw rapid growth, while
the period 1808-1820, marked by the embargo and non-intercourse policies as well as by war and
postwar adjustments, was one of sharper fluctuations. Imports revived after 1820 and gradually rose
through the mid-1830s, before falling by nearly 50 percent from 1837-43. The sharpest growth came
early on and may well have reflected, along with opportunities arising from European wars, the
existence of adequate financial resources to take advantage of these opportunities. The decline in real
imports that followed the Panic of 1837, as well as the fall in real investment, coming as they did at a
time when the financial system was stressed by banking failures and a seizing up of securities markets,
lends support to our view that good (and bad) finance matters for real economic performance.
B. Business Incorporations
A different and underutilized approach to studying the development of the modern sector is
through the activities of its most fundamental units–entrepreneurs, broadly construed to include
enlightened statesmen. These individuals recognized early in the nation's history the potential of the
corporate form of enterprise for promoting projects that would otherwise remain unstarted or stunted in
development because of indivisibilities and inadequate opportunities for diversifying risks. Historians,
such as Oscar Handlin and Mary F. Handlin (1945) and Pauline Maier (1993), have called attention to
the uniqueness of corporate development in the United States after the Revolution. Maier (p. 83) notes
that the corporation was moribund in 18th-century England, when it was “salvaged” or “rescued” by
Americans who “utilized its capacity to empower individuals whose resources were unequal to their
imaginations.”
As the corporate form facilitated the subscription of large amounts of capital, incorporated
firms also provided a stimulus from which smaller unincorporated businesses could arise. Thus,
widespread incorporations of businesses had an influence on the modern sector that extended well

12 Some precursors of general incorporation laws were enacted by states for non-business entitiesand for special purpose businesses such as the provision of aqueducts, yet the only general lawsenacted for businesses over the period of our study were by New York in 1811 and New Jersey in1846. In New York, 317 of 1,436 incorporations (22.1 percent) between 1811 and 1846 fell under the1811 act. In New Jersey, 22 of 142 charters (15.5 percent) between 1846 and 1850 were taken outunder the general law (Evans, 1948, p. 12).
13 Davis's totals include renewals and incorporations of a single entity by more than one state. Figure VII adjusts these figures for multiple charters (see Davis, 1917, Table V, p. 30) to reflect thenumber of business units that actually received corporate status. The corporate form was controversial. The nation's first bank, the Bank of North America, for example, was chartered by Congress in 1781and by the legislatures of three states that had doubts about Congress's authority to enact such acharter. In the 1780s, as mentioned earlier in the text, Pennsylvania rescinded its charter, and thenenacted a new one for the bank after Delaware had granted it a charter in the interim. It was only onecompany, but Davis counted and reported it as having five state charters from four states.
21
beyond firms actually chartered by state governments. Since the vast majority of charters granted by
states before 1850 were by special acts rather than general laws, the legislative nature of the
incorporation process encouraged examination of applicants, which may have led to chartered
enterprises of higher quality than might have otherwise arisen.12
Individual state archives are rich sources of information about the granting of early corporate
charters. Much of the formidable task of organizing this information was completed decades ago by
Joseph Stancliffe Davis (1917) and George Heberton Evans, Jr. (1948). Davis's account, which covers
the period from 1781 through 1800 on a sectoral basis for sixteen states, is the most comprehensive,
covering ostensibly all incorporations. Figure VII presents the number of annual financial and non-
financial incorporations from Davis's survey.13 Most striking are the sharp increases in incorporations
after 1790 and the degree to which financial and non-financial incorporations exhibited similar
fluctuations over time. The controversial granting of a federal charter to the First BUS in 1791
encouraged individual states to exercise their incorporation-granting authority more liberally and may
well account for some of the increases. The federal bank could (and did) open branches in several
states, and the states did not want to cede banking authority by default to the federal institution.

22
Year
1781 1786 1791 17960
5
10
15
20
25
30
35
40
45
TotalNon-FinancialFinancial
Figure VII. Annual Business Incorporations, 1781-1800.
Evans (1948) organizes incorporations on a sectoral basis for as many as seven states prior to
1850. The coverage includes Maryland 1800-1850, New Jersey 1800-1850, Pennsylvania 1800-1850,
New York 1800-1845, Ohio 1803-1850, Maine 1820-1850, and Connecticut 1837-1850. The lack of
representation for the New England states before 1820 is unfortunate, as Davis shows them to be the
most active in chartering corporations prior to 1800. Evans admits (1948, p. 10) that his coverage is
incomplete but notes that the sample included states in which incorporations were numerous. If so, it is
interesting and likely no coincidence that the largest numbers of incorporations occurred in states such
as New York, Pennsylvania, and Maryland that hosted rapidly developing securities markets.
Since the number of incorporations is available continuously for only three states between 1800
and 1850, we must use an index to provide an overall view of incorporation activity. The index is
constructed by summing the number of incorporations available in each year and dividing the sample

14 Since Evans's descriptions do not indicate those instances under which firms were incorporatedby more than one state, the index cannot be adjusted for these occurrences.
15 Given that both the total and non-financial incorporations indices are set to unity in the startingyear and have differential growth rates, it is natural that the two series occasionally cross.
23
Year
1800 1805 1810 1815 1820 1825 1830 1835 1840 1845 18500
10
20
30
40
50
60
TotalNon-Financial
Figure VIII. Index of Annual Business Incorporations, 1800-1850.
into segments for which the composition by state is steady. We then join the segments and set 1800 as
the base, giving the index a value of unity in that year.14 The resulting indices, presented in Figure VIII
for both all incorporations and non-financial ones only, rise sharply between 1800 and 1814, 1820 and
1835, and after 1843.15 These waves track David's periods of faster economic growth fairly closely,
although the first of them extends beyond David's dating. The relative importance of individual sectors
in the non-financial series varies over time, being dominated by turnpikes and manufacturing firms
during the first wave and by railroad and mining firms during the second.
Figures VII and VIII present data on the flow of incorporations, but not on the evolution of the

16 Little is known about the life span of corporations prior to 1840. Ruth Gillette Hutchinson,Arthur R. Hutchinson and Mabel Newcomer (1938), in an examination of business life inPoughkeepsie, New York indicate that 54.6 percent of firms incorporated between 1844 and 1927survived more than five years and only 29.3 percent survived for more than ten years. Since the
24
Year
1790 1795 1800 1805 1810 1815 1820 1825 1830 1835 1840 1845 18500.1
1
10
100
1000
Total
Non-Financial
Figure IX. Index of Cumulative Business Incorporations, 1790-1850.
stock of existing corporations over time. Figure IX approximates this stock in index form by joining
the incorporations series based on the Davis and Evans samples and then cumulating the annual
changes. The resulting series (presented in logs) makes clear the rapid growth of our stock measures
between 1790 and 1815. If business incorporations can be taken as an index of modernization, the
evidence of Figure IX could be construed as indicative of a “take off” in this early period, fully half a
century before W. W. Rostow’s (1960) much disputed “take off” began in the 1840s.
The cumulation in Figure IX can only approximate the stock of corporate entities in any year
because the fragmentary nature of information on corporate failures and non-starts makes a correction
for such happenstances virtually impossible.16 Nevertheless, the index of cumulative incorporations
timeline of these figures is not given and the period covered is one during which New Yorkincorporations were accomplished primarily by general law, it is uncertain how well these figuresreflect business failures in earlier years.
25
perhaps captures a concept broader than businesses that actually succeed–namely, the stock of ideas or
projects arising from America's entrepreneurs. Long-run trends and fluctuations of such a measure
perhaps reveal something about the evolving business climate of the times. Growing access to financial
resources, for example, may have provided incentives to develop corporations as productive outlets for
funds. In the context of this study, where emphasis is on the long-run impact of financial market
development, we think that the stock of ideas reflected in corporate chartering, as it cumulates over
time, could well be related to the size and depth of financial markets (also stock measures) more
closely than year-to-year fluctuations in the flow of incorporations. For this reason, our econometric
models use cumulative measures of incorporation activity.
IV. Identifying Links Between Financial Markets and Early U.S. Growth
A. Overview
The preceding sections indicate that the foundations of the U.S. financial system were largely in
place by 1800 and that facilities for banking and securities trading had already begun to see regular
use. U.S. securities markets grew steadily in the decades that followed despite varied and sometimes
severe shocks associated with business cycles and geopolitics, and a modern sector emerged and
flourished in the midst of these developments. We now more formally examine the hypothesis that
growth of the financial sector, and securities markets in particular, played a leading role in promoting
this modernization between 1790 and 1850.
The theoretical literature offers strong foundations for a general version of our hypothesis,
namely that financial factors can exert a first-order influence on macroeconomic outcomes. Gurley and
Shaw (1955), for example, argue that financial institutions decrease individual demands for

26
precautionary money balances by offering diversification services and the promise of higher returns
through professional management. Their “debt accumulation” channel, as further developed by
Bencivenga and Smith (1991) and Rousseau (1998), seems especially applicable to the early United
States, where fragmentation in the capital markets often skewed the size distribution of new
investments toward those that could be funded through personal resources and kinship. In turn, much
of investment remained within traditional sectors such as agriculture and home production. The rise of
chartered banks throughout the nation and securities markets in the major cities helped to overcome
these indivisibilities and to satisfy the demand for liquidity among savers, thereby organizing the large
blocks of capital that modernization would require.
McKinnon (1973) and Shaw (1973) reinforce these themes, stressing the importance of
resource pooling and the screening and monitoring of projects on overall economic efficiency. This
“total factor productivity channel,” as formalized by Greenwood and Jovanovic (1990) and King and
Levine (1993a), was also made operable by a deepening U.S. capital market that quickly developed
liquid secondary markets. These in turn provided an environment conducive to business starts and
offered a cost-effective mechanism for reallocating resources among investments. The discipline of the
capital market also increased the extent to which managements were accountable to stakeholders.
Diamond (1984) focuses on the role of intermediaries and markets in striking effective risk-sharing
arrangements between the users and suppliers of funds. The transport and manufacturing projects that
characterized the early United States involved considerable risk, and many would have surely remained
in the drawer without the arrangements that banks and securities markets made possible.
Other models, both theoretical and empirical, have focused on complementarities between
banks and securities markets in mobilizing capital as an economy grows rather than treating them as
substitutes (e.g., Goldsmith 1969; Greenwood and Smith 1995; Levine and Zervos 1998; Rousseau

27
and Wachtel 2000). In the case of the early United States, banks served to finance smaller and more
information-intensive investments until they achieved a size for which direct public investment was
possible. In addition, banks were able to attract deposits and capital through their ability to diversify
and were thus instrumental in fueling the early securities markets directly.
All of the channels described above were likely to have operated in the early United States, yet
the broad nature of the available aggregates render our empirical investigation unable to distinguish
cleanly among them. Nevertheless, by separately considering both aggregate investment and the stock
of entrpreneurial ideas as measures of macroeconomic outcomes, we offer evidence that supports our
view that the financial sector played a central role in the nation’s early growth by encouraging the
accumulation of debt and the diffusion of productivity-enhancing technologies.
B. Model Selection and Analytical Framework
Our approach begins with the selection of multivariate systems for quantifying the effects of
financial markets on real activity. The annual frequency of our series and their availability for sixty
years facilitate investigation in a vector autoregressive (VAR) framework. VARs are reduced forms
that are often useful for characterizing statistical relationships among a set of time series and exploring
issues of cause and effect. To be meaningful, however, it is critical that economic theory drives the
selection of variables for each system. And although our data are not rich enough to distinguish
decisively among the individual channels of finance-led growth identified in the recent theoretical
literature, they do permit the construction of reduced forms for testing the joint hypothesis that financial
markets operated through these channels to have positive effects on the real sector.
We begin our investigation with the broadest measures of economic activity and proceed to
those which more closely capture our concept of the modern sector. To this end, the first tri-variate
system examines the potential role of financial markets in the most general of macroeconomic

28
x1, t ' a1,0 % jk
i'1a1, i x1 , t& i % j
k
i'1b1 , i x2, t& i % j
k
i'1c1, i x3 , t& i % u1, t
x2 , t ' a2 ,0 % jk
i'1a2, i x1 , t& i % j
k
i'1b2, i x2 , t& i % j
k
i'1c2 , i x3, t& i % u2 , t
x3 , t ' a3 ,0 % jk
i'1a3, i x1 , t& i % j
k
i'1b3, i x2 , t& i % j
k
i'1c3 , i x3, t& i % u3 , t
performance measures, real per capita output. The numbers of listed securities per capita in three
(Boston, New York, Philadelphia) and then four (adding Baltimore) cities indicate the breadth of early
U.S. securities markets. As fluctuations in output may be plausibly linked to the availability of both the
circulating medium and the resources of the banking system, our estimate of the real per capita stock of
money is included as a control variable.
Real per capita measures of gross private domestic investment and imports replace output in
the second set of systems. These specifications allow us to examine the degree to which the data are
consistent with the mechanisms for early growth driven by investment and outward orientation
proposed respectively by Gallman (1986) and North (1961).
We then focus on measures that may reflect activity in the modern sector even more closely,
namely our indices of cumulative total and non-financial business incorporations. As business
incorporations before 1850 are more likely to be influenced by the possibilities for external finance than
the stock of money, we choose the number of state chartered banks as a control that reflects the
importance of the banking sector in promoting new businesses. This choice also allows us to shed
some light on the nature of interactions between banks and securities markets.
The VAR methodology permits an investigation of dynamic interactions in a multivariate
system without imposing a priori structural restrictions. It involves estimating a separate regression
equation for each variable on its own lags and those of the other variables in the system. For example,
the first VAR described above has the form
(1a,b,c)

17 This method starts with a sufficiently large lag length and then tests successively that thecoefficients on the final lag are zero, stopping when the restrictions are rejected.
18 Tests for Granger causality are used frequently when examining interrelationships amongmacroeconomic time series and are easily computed from a VAR model. Their statistical interpretationis simple. For example, if we reject a set of restrictions in (2) for the number of listed securities whenestimating (1a), this implies explanatory power for its lags in current output beyond that which can beattributed to past values of output and money alone.
19 Augmented Dickey-Fuller tests for unit roots suggest non-stationarity in levels and stationarity infirst differences in each case. After determining the order of cointegration in each of our multivariatesystems, Johansen’s test rejects the null hypothesis of stationarity for all individual variables. Appendix B includes these results and details of the test regressions.
20 Inferences about the cointegration space in each system are based on the technique developed in Johansen (1991). Appendix B describes this technique and presents the full set of results.
29
l̂ j ,i ' l̂ j , i%1 ' . . . ' l̂ j ,k ' 0 l ' a ,b ,c ; j ' 1,2 ,3 .
where x1 is income, x2 is the money stock, x3 is the number of listed securities, and k is the number of
lags. We use a series of nested likelihood ratio tests to select the lag order.17
Stationarity of a VAR is critical in building exact tests for Granger non-causality, that is, the
hypothesis that past values of one variable do not jointly improve one-step ahead forecasts of another.18
Specifically, the null hypothesis implies the following joint restrictions on the coefficients in (1):
(2)
In general, the distributions of these tests are nonstandard when a VAR contains variables with unit
roots, and differencing these variables is usually required to ensure stationarity. However, Sims, Stock,
and Watson (1990) show that Granger tests conform to standard distributions in tri-variate VARs with
unit roots so long as a single cointegrating relationship exists among the system variables. This result
is important for many of the tri-variate VARs that we estimate here because unit root tests for all of the
series in our analysis do not reject a null hypothesis of non-stationarity and firmly reject a null of
stationarity,19 and there appears to be single cointegrating relationship in all but two of the systems.20
Levels specifications with the automatically-selected lag order are thus appropriate for drawing

30
Granger-causal inferences in most cases.
The exceptions arise with GNP as the measure of macroeconomic performance because there
is only weak evidence of cointegration in these systems. For cases in which the order of cointegration in
a system with unit roots is uncertain, Toda and Yamamoto (1995) show the asymptotic consistency of
tests for block exclusion can still be ensured, albeit with some loss in efficiency, by estimating an
“augmented VAR.” This levels specification uses one additional lag for each possible cointegrating
relationship in the system. Tests for block exclusion then include only the number of lags that would
be selected with cointegration imposed. For the systems with GNP, we discuss results which employ
both standard and augmented VARs.
The ability to construct valid tests for Granger causality from a levels specification of the VAR
is advantageous in this study since it permits the joint evaluation of both short- and long-run effects of
the system variables upon one another. Indeed, as persistent yet gradual increases in market size might
be expected to have real effects on the performance of the modern sector that accumulate over time, the
implicit inclusion of long-run effects in the cointegrated VARs makes them particularly well suited for
our analysis. The tests must be interpreted cautiously, however, since as a statistical device a rejection
of the null hypothesis does not necessarily imply causality in the economic sense. In particular, the
validity of the tests is predicated on the inclusion of the full information set in the VAR. Since this
condition is violated in any finite regression framework, the results presented in the following
subsections can only be interpreted as strongly suggestive of linkages operating within each system.
When an investigator can specify a reasonable causal ordering for the variables (based on
economic theory and perhaps the results of Granger tests), the nonlinear responses of each variable in
the system to one-time shocks in the other variables can be traced through time via orthogonalized
impulse responses. This facilitates an evaluation of the economic significance (or size) of the dynamic

31
effects. For this reason, the results of the Granger tests are augmented with a graphical examination of
the impulse responses for those systems in which financial factors matter.
C. The Effects of Securities Markets on National Accounts Aggregates
We begin with VAR systems that use Berry’s (1988) annual estimates of real GNP per capita
as a measure of macroeconomic performance. When combined with per capita measures of the real
money stock and the number of listed securities in either three or four cities, a series of nested
likelihood ratio tests select four lags for the systems in logs. Since Johansen tests indicate that these
systems have at most one cointegrating vector but that the presence of cointegration is uncertain (i.e.,
the null hypothesis of no cointegration is rejected at only the 15 percent level), we estimate a standard
VAR with four lags which imposes the long-run relationship as well as an “augmented” VAR with five
lags. Table III presents F-statistics and p-values for each block of coefficients. There is no evidence of
Granger causality from the number of listed securities to output in any of the four specifications (see
the entries for equation 1a under the columns labeled “No. Listed Securities”), though there is some
evidence of bidirectional Granger causality between money and output. Neither money nor output
appears to influence the size of securities markets.
These findings suggest a non-pivotal role for the U.S. financial sector in promoting the growth
of general living standards before 1850, yet such an interpretation should be resisted. The U.S.
financial revolution in its earlier phases did not affect all sectors of the economy equally. Initially, it was
an urban development having its greatest impact on the commercial and industrial groups that were a
small part of the population. A large majority of the country's population was engaged in agriculture,
much of it traditional and self-sufficient. Agricultural production dominated the nation's GNP, but the
agricultural sector would only gradually come to be affected by the new financial system as it extended
itself beyond cities and spread its influences beyond its urban roots. When seen in this light, our

32
Table IIIF-statistics for Granger-Causality in VARs with Real Per Capita GNP, 1790-1850
Three Major Markets Four Major Markets
Estimation Eq. GNP MoneyStock
No. ListedSecurities
Ra2 GNP Money
StockNo. ListedSecurities
Ra2
Cointegrated VAR(K=4)
1a 23.05(0.000)
3.682(0.011)
1.683(0.171)
0.973 20.79(0.000)
3.277(0.020)
0.862(0.494)
0.971
1b 5.660(0.001)
23.83(0.000)
0.824(0.517)
0.893 6.968(0.000)
22.65(0.000)
1.617(0.187)
0.900
1c 0.724(0.580)
0.782(0.543)
47.24(0.000)
0.971 0.183(0.946)
0.494(0.740)
59.29(0.000)
0.970
Augmented VAR(K=5)
1a 4.445(0.005)
3.242(0.021)
1.320(0.279)
0.971 3.843(0.010)
2.905(0.033)
0.392(0.813)
0.968
1b 5.347(0.002)
11.89(0.000)
1.443(0.238)
0.899 6.389(0.000)
11.60(0.000)
2.133(0.095)
0.909
1c 0.721(0.583)
0.828(0.515)
25.34(0.000)
0.969 0.274(0.893)
0.981(0.429)
26.54(0.000)
0.968
The VARs include GNP, the money stock, and the number of listed securities in three (left panel) or four (right panel) major markets.The three markets are Boston, New York, and Philadelphia, while the right panel also includes Baltimore. All variables are in per capitalog levels and represent real quantities. Equation numbers correspond to the text, with (a), (b) and (c) employing GNP, money, and listedsecurities as the respective dependent variables. The columns report the F statistic for Granger non-causality on each variable block withthe p-value in parentheses. The VAR system in the upper panel imposes a single cointegrating relationship and includes four lags. Thesystem in the lower panel allows for uncertainty in the order of integration by adding an additional lag to the specification and computingthe Granger causality tests based on only the first four lags.

21 The estimated responses are nearly identical with the number of securities listed in four marketsfor this system, as well as those which we consider in section IV.D below. To avoid redundancy in ourpresentation and discussion, we limit explicit examinations of impulse responses to systems withsecurities listings from three markets. The full set of impulse responses is available from the authors.
33
statistical results with finance and GNP are quite consistent with the consensus view that a gradual
acceleration in the trend of U.S. output growth in the country's early decades was too smooth to be
explained by the time path of any single economic factor. Only after an innovation such as organized
finance diffuses to multiple facets of economic life should we expect to find its effects detectable in
broad macroeconomic aggregates such as GNP.
We next examine systems which include real per capita private investment in place of output.
As a narrower measure that reflects expenditure on or improvement of durable factors in the
production process, investment is more likely than output to be affected directly by the availability of
external finance. Likelihood ratio tests again select specifications with four lags. The results reported
in the upper left panel of Table IV indicate that the number of securities in three cities Granger-causes
investment at the 1 percent level and that the money stock Granger-causes investment at the 10 percent
level, with no evidence of feedback from either investment or the money stock to the number of listed
securities. Similar results obtain for the system which includes securities listed in four cities, with the
money stock in this case Granger-causing investment at the 5 percent level. Thus, although financial
development seems at best to have only a slight influence on GNP, its impact on the investment
component is more pronounced.
We can be more precise in characterizing this influence. Figure X presents impulse responses
from the system with securities listings from three cities.21 Impulse responses isolate the effects of a
unit change in a given variable on the other system variables and trace their evolution over subsequent
periods using the estimated coefficients from the VAR. These nonlinear functions allow us to explore

34
Table IVF-statistics for Granger-Causality in VARs with Investment and Total Imports, 1790-1850
Three Major Markets Four Major Markets
Macroeconomic Indicator
Eq. Macro MoneyStock
No. ListedSecurities
Ra2 Macro Money
StockNo. ListedSecurities
Ra2
Gross PrivateDomestic Investment
1a 1.621(0.186)
2.223(0.082)
4.028(0.007)
0.845 1.311(0.281)
2.900(0.032)
4.409(0.004)
0.848
1b 1.835(0.139)
21.15(0.000)
0.724(0.580)
0.861 2.661(0.045)
24.87(0.000)
1.346(0.268)
0.868
1c 0.792(0.537)
0.758(0.558)
61.88(0.000)
0.971 1.001(0.417)
0.731(0.576)
77.90(0.000)
0.972
Imports 1a 7.151(0.000)
4.445(0.004)
2.411(0.063)
0.536 6.548(0.001)
4.217(0.006)
2.058(0.103)
0.523
1b 0.140(0.966)
13.89(0.000)
1.177(0.334)
0.840 0.139(0.967)
18.82(0.000)
1.047(0.394)
0.839
1c 0.515(0.725)
0.610(0.658)
120.38(0.000)
0.970 0.766(0.553)
0.877(0.486)
163.72(0.000)
0.971
Each VAR system includes four lags of the macroeconomic indicator listed at the left, the money stock, and the number of listed securitiesin three (left panel) or four (right panel) major markets. All variables are in per capita log levels and represent real quantities. Equationnumbers correspond to the text, with (a), (b) and (c) employing investment or imports, money, and listed securities as the respectivedependent variables. The columns report the F statistic for Granger non-causality on each variable block with the p-value in parentheses.
35
Effect of Securities Listings on Investment
1 3 5 7 9 11 13 15-0.4
-0.2
0
0.2
0.4
0.6
0.8Effect of the Money Stock on Investment
1 3 5 7 9 11 13 15-0.4
-0.2
0
0.2
0.4
0.6
0.8
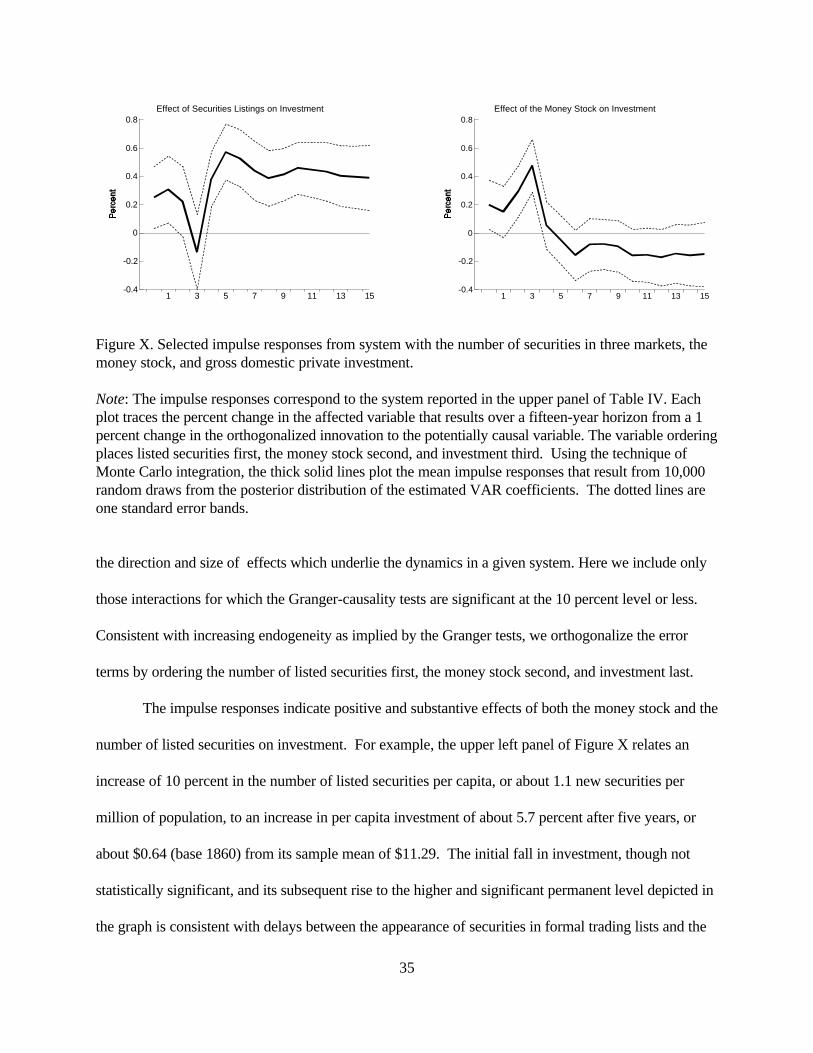
Figure X. Selected impulse responses from system with the number of securities in three markets, themoney stock, and gross domestic private investment.
Note: The impulse responses correspond to the system reported in the upper panel of Table IV. Eachplot traces the percent change in the affected variable that results over a fifteen-year horizon from a 1percent change in the orthogonalized innovation to the potentially causal variable. The variable orderingplaces listed securities first, the money stock second, and investment third. Using the technique ofMonte Carlo integration, the thick solid lines plot the mean impulse responses that result from 10,000random draws from the posterior distribution of the estimated VAR coefficients. The dotted lines areone standard error bands.
the direction and size of effects which underlie the dynamics in a given system. Here we include only
those interactions for which the Granger-causality tests are significant at the 10 percent level or less.
Consistent with increasing endogeneity as implied by the Granger tests, we orthogonalize the error
terms by ordering the number of listed securities first, the money stock second, and investment last.
The impulse responses indicate positive and substantive effects of both the money stock and the
number of listed securities on investment. For example, the upper left panel of Figure X relates an
increase of 10 percent in the number of listed securities per capita, or about 1.1 new securities per
million of population, to an increase in per capita investment of about 5.7 percent after five years, or
about $0.64 (base 1860) from its sample mean of $11.29. The initial fall in investment, though not
statistically significant, and its subsequent rise to the higher and significant permanent level depicted in
the graph is consistent with delays between the appearance of securities in formal trading lists and the

36
ability to raise funds through the capital market and apply the proceeds to tangible investments. The
right panel relates a 10 percent increase in the real per capita money stock, or about $0.90 from its
sample mean of $8.98, to a rise of 4.7 percent in investment after three years, or about $0.53 from its
sample mean. This response reflects the rapidity with which productive capacity can expand when
encouraged by demand-led forces.
The lower panel of Table IV includes systems with real per capita imports as a measure of real
activity. Imports should also reflect the progress of the modern sector more effectively than output,
since they are related to the availability of foreign exchange arising from income from the production of
goods for the organized market, as well as the nation’s success in mobilizing foreign capital. The
results are not as strong for imports as those obtained with investment. Nevertheless, the numbers of
securities listed in three and four markets still Granger-cause imports at the 6 and 10 percent levels
respectively, and the stock of real money per capita Granger-causes imports at the 1 percent level.
There is no feedback from either imports or the money stock to the securities market variables.
Figure XI presents selected impulse responses, again based upon the statistically significant
Granger tests and the system with securities listings in three cities. The plots indicate that increases in
both money and the number of securities have a sharp effect on imports after two years that decays
after five years. Specifically, the left panel of Figure XI relates a 10 percent rise in the number of listed
securities to an increase in per capita imports of 11.3 percent after two years, or about $1.11 from its
sample mean of $9.84. The right panel relates a 10 percent increase in the real per capita money stock
to a rise of 16.1 percent in per capita imports after three years, or about $1.58 from its sample mean.
D. The Effects of Securities Markets on the Stock of Entrepreneurial Ideas
We now shift attention to the effects of banks and securities markets on the stock of
entrepreneurial ideas as captured by the number of total and non-financial business incorporations. The

37
Effect of Securities Listings on Imports
1 3 5 7 9 11 13 15-0.8
-0.4
0
0.4
0.8
1.2
1.6
2
2.4Effect of the Money Stock on Imports
1 3 5 7 9 11 13 15-0.8
-0.4
0
0.4
0.8
1.2
1.6
2
2.4
Figure XI. Selected impulse responses from system with the number of securities in three markets, themoney stock, and imports.
Note: See note for Figure X. The impulse responses correspond to the system reported in the lowerpanel of Table IV. The variable ordering places listed securities first, the money stock second, andimports third.
systems reported in Table V include cumulative incorporations, the number of state chartered banks,
and the number of securities listed in three or four cities. All systems show clear effects of expansion
in banks and securities markets upon the granting of corporate charters. The systems that include non-
financial incorporations also suggest that expanded use of the corporation encouraged new banks to
form, perhaps to meet the needs of new businesses for additional finance.
Because the number of state-chartered banks is included in the total number of incorporations,
problems of collinearity may arise in the systems presented in the upper panel of Table V. We
therefore focus attention on the impulse responses that arise from the system with non-financial
incorporations, which do not include banks, and the number of securities listed in three markets. The
responses (Figure XII) indicate that the effects of financial development on incorporations were
positive, incremental, and permanent. For example, the left panel relates a 10 percent increase in the
number of securities, or an increase of about 11.6 securities from the sample mean, to a rise of 2.1

38
Table VF-statistics for Granger-Causality in VARs with Measures of Modern Sector Activity, 1790-1850
Three Major Markets Four Major Markets
Modern Sector Indicator
Eq. Incs. No. StateBanks
No. ListedSecurities
Ra2 Incs. No. State
BanksNo. ListedSecurities
Ra2
BusinessIncorporations
1a 285.33(0.000)
3.849(0.015)
2.581(0.065)
0.999 278.31(0.000)
4.242(0.010)
3.266(0.030)
0.999
1b 2.829(0.048)
24.38(0.000)
0.392(0.759)
0.994 0.464(0.709)
24.52(0.000)
2.645(0.060)
0.994
1c 1.004(0.399)
2.114(0.111)
157.41(0.000)
0.992 1.442(0.243)
3.113(0.035)
126.57(0.000)
0.993
Non-FinancialIncorporations
1a 346.06(0.000)
3.771(0.017)
3.384(0.026)
0.999 341.17(0.000)
4.196(0.010)
3.992(0.013)
0.999
1b 2.730(0.055)
29.88(0.000)
0.670(0.575)
0.994 2.723(0.055)
29.74(0.000)
0.902(0.448)
0.994
1c 1.479(0.233)
2.094(0.114)
154.99(0.000)
0.992 2.291(0.091)
3.247(0.030)
138.42(0.000)
0.994
Each VAR system includes three lags of cumulative business incorporations, the number of state chartered banks, and the numberof listed securities in three (left panel) or four (right panel) major markets. All variables are in log levels. Equation numberscorrespond to the text, with (a), (b) and (c) employing the number of cumulative incorporations, state chartered banks and listedsecurities as the respective dependent variables. The columns report the F statistic for Granger non-causality on each variable blockwith the p-value in parentheses.

39
Effect of Securities Listings on Non-Financial Incorporations
1 3 5 7 9 11 13 15-0.8
-0.6
-0.4
-0.2
0
0.2
0.4
0.6
0.8
1 Effect of State Banks on Non-Financial Incorporations
1 3 5 7 9 11 13 15-0.8
-0.6
-0.4
-0.2
0
0.2
0.4
0.6
0.8
1
Effect of State Banks on Securities Listings
1 3 5 7 9 11 13 15-0.8
-0.6
-0.4
-0.2
0
0.2
0.4
0.6
0.8
1 Effect of Non-Financial Incorporations on State Banks
1 3 5 7 9 11 13 15-0.8
-0.6
-0.4
-0.2
0
0.2
0.4
0.6
0.8
1
Figure XII. Selected impulse responses from system with the number of securities in three markets, thenumber of state chartered banks, and the number of non-financial business incorporations.
Note: See note for Figure X. The impulse responses correspond to the system reported in the lower left panel of Table V. The variable ordering places listed securities first, the number of banks second,and incorporations third.
percent after 10 years in the index of non-financial incorporations. In the right panel, a 10 percent
increase in the number of state chartered banks, or the establishment of about 22 new banks from its
sample mean, is related to a rise in the index of non-financial incorporations of 2.8 percent after only
two years. Although these effects are not large, the narrow standard error bands suggest that they are
estimated precisely. It is also important to recognize that the number of securities rose 45-fold

40
between 1790 and 1850, so that cycles of impulses and permanent responses such as those depicted in
Figure XII would have occurred many times over the sample period, with resulting large cumulative
effects on the number of business incorporations. Thus, financial development had a persistent
influence on this measure of real-sector activity.
V. Conclusion
Our paper describes in some detail the rather remarkable financial development that took place
in the United States in its earliest decades, starting with the Federalist financial revolution of the 1790s.
In the four decades thereafter, and starting virtually from scratch–although there were, to be sure,
colonial precedents that had to be abandoned as much as amplified (see Perkins, 1994, for a discussion
of these)–the United States built an articulated, innovative, and modern financial system that equaled
that of any other country. One consequence of financial development and innovation was that the
United States became history's most successful emerging market, attracting the capital of investors of
older nations seeking higher returns. Another was that a wide range of American entrepreneurs,
business enterprises, and governments enjoyed more access to financing, domestic and foreign, than
did those of other countries. These developments, it seems, placed the United States of the early 19th
century on a trajectory of economic growth higher than that of other nations. The die was cast early,
perhaps earlier than most economic historians have thought. As its financial system continued to
develop (with occasional setbacks) and promote growth over the course of the 19th century, the United
States became the world's largest and, in many dimensions, most advanced economy.
We do not merely state this case and document it with traditional historical evidence. We also
treat it as a hypothesis and subject it to the sorts of statistical tests that macro economists now apply to
rich contemporary, multinational data sets in order to make similar arguments about the effects of
financial development on economic growth (e.g., King and Levine 1993b; Levine and Zervos 1998;
41
Rousseau and Wachtel 2000). Our historical data sets are far more limited than contemporary ones.
But our test results are consistent with modern findings on the key role of financial development in
accounting for differences in the economic growth performance of today's countries. The remarkable
economic growth of the United States, we think, may very well have been "finance led." Judging by
U.S. history, then, the widespread contemporary interest in developing and improving financial systems
within and between countries to foster economic growth is not misplaced.
References
Atack, Jeremy, and Peter L. Rousseau, “Business Activity and the Boston Stock Market, 1835-1869,”
Explorations in Economic History 36 (1999), 144-179.
Bencivenga, Valerie R., and Bruce D. Smith, "Financial Intermediation and Endogenous Growth,"
Review of Economic Studies 58 (1991), 195-209.
Berry, Thomas Senior, "Estimated Annual Variations in Gross National Product, 1789 to 1909"
(Richmond VA: The Bostwick Press, 1968).
Berry, Thomas Senior, "Production and Population Since 1789: Revised GNP Series in Constant
Dollars," Bostwick Paper No. 6 (Richmond VA: The Bostwick Press, 1988).
Blodget, Samuel Jr., Economica (Washington, printed for the author, 1806).
Cameron, Rondo et al., Banking in the Early Stages of Industrialization–A Study in Comparative
Economic History, (New York: Oxford University Press, 1967).
David, Paul A., "The Growth of Real Product in the United States Before 1840: New Evidence,
Controlled Conjectures," Journal of Economic History 27 (1967), 151-197.
David, Paul A., and Peter Solar, "A Bicentenary Contribution to the History of the Cost of Living in the
United States,” Research in Economic History 2 (1977), 1-80.
Davis, Joseph S., Essays in the Earlier History of American Corporations (Cambridge MA: Harvard

42
University Press, 1917).
Davis, Lance E., "The Capital Markets and Industrial Concentration: The U.S. and U.K., a
Comparative Study," Economic History Review, second series 58 (1966), 255-272.
Davis, Lance E. and Robert J. Cull, International Capital Markets and American Economic Growth,
1820-1914 (Cambridge: Cambridge University Press, 1994).
Davis, Lance E. and Robert E. Gallman, Evolving Financial Markets and International Capital
Flows: Britain, the Americas, and Australia, 1865-1914 (Cambridge: Cambridge University Press,
forthcoming).
Diamond, Douglas W., "Financial Intermediation and Delegated Monitoring," Review of Economic
Studies 51 (1984), 393-414.
.Engerman, Stanley L., "Douglass C. North’s The Economic Growth of the United States, 1790-1860
Revisited," Social Science History 1 (1977), 248-257.
Evans, George Heberton Jr., Business Incorporations in the United States, 1800-1943 (New York:
National Bureau of Economic Research, 1948).
Fenstermaker, J. Van, The Development of American Commercial Banking: 1782-1837 (Kent, OH:
Kent State University Press, 1965) (a).
Fenstermaker, J. Van, “The Statistics of American Commercial Banking, 1782-1818,” Journal of
Economic History 25 (1965), 400-413 (b).
Fenstermaker, J. Van, Filer, John E. and Robert Stanley Herron “Money Statistics of New England,
1785-1837,” Journal of Economic History 44 (1984), 441-453.
Fuller, Wayne A., Introduction to Statistical Time Series (New York: John Wiley, 1976).
Gallman, Robert E., "American Economic Growth before the Civil War: The Testimony of the Capital
Stock Estimates," in Stanley L. Engerman and Robert E. Gallman (eds.) Long-Term Factors in

43
American Economic Growth (Chicago: University of Chicago Press, 1986), 79-120.
Goldsmith, Raymond W., Comparative National Balance Sheets–A Study of Twenty Countries, 1688-
1978 (Chicago: University of Chicago Press, 1985).
Goldsmith, Raymond W., Financial Structure and Development (New Haven: Yale University Press,
1969).
Gras, N. S. B., The Massachusetts First National Bank of Boston, 1784-1934 (Cambridge MA:
Harvard University Press, 1937).
Greenwood, Jeremy, and Boyan Jovanovic, "Financial Development, Growth, and the Distribution of
Income," Journal of Political Economy 98 (1990), 1076-1107.
Greenwood, Jeremy, and Bruce D. Smith, "Financial Markets in Development, and the Development
of Financial Markets," Journal of Economic Dynamics and Control 21 (1997), 145-181.
Gurley, John G., and Shaw, Edward S., "Financial Aspects of Economic Development," American
Economic Review 45 (April 1955), 515-538.
Handlin, Oscar and Mary F. Handlin, "Origins of the American Business Corporation," Journal of
Economic History 5 (May 1945), 1-23.
Hutchinson, Ruth Gillette, Arthur R. Hutchinson and Mabel Newcomer, "A Study of Business
Mortality: Length of Life of Business Enterprises in Poughkeepsie, New York, 1843-1936,"
American Economic Review 3 (September 1938), 497-514.
Johansen, Soren, "Estimation and Hypothesis Testing of Cointegration Vectors in Gaussian Vector
Autoregressive Models," Econometrica 59 (1991), 1551-80.
King, Robert G., and Ross Levine, "Finance, Entrepreneurship and Growth: Theory and Evidence,"
Journal of Monetary Economics 32 (December 1993), 513-42.
King, Robert G., and Ross Levine, "Finance and Growth: Schumpeter Might Be Right,"Quarterly

44
Journal of Economics 108 (August 1993), 717-37.
Lamoreaux, Naomi R., Insider Lending: Banks, Personal Connections, and Economic Development
in Industrial New England (New York: Cambridge University Press, 1994).
Levine, Ross and Sara Zervos, "Stock Markets, Banks, and Economic Growth," American Economic
Review 88 (June 1998), 537-558.
Maier, Pauline, "The Revolutionary Origins of the American Corporation," William and Mary
Quarterly 50 (January 1993), 51-84.
Martin, Joseph G., Seventy-Three Years History of the Boston Stock Market (Boston: published by the
author, 1873).
Martin, Robert F., National Income in the United States, 1799-1938 (New York: National Industrial
Conference Board, 1939).
McKinnon, Ronald I., Money and Capital in Economic Development (Washington, DC: Brookings
Institution, 1973).
Michie, R. C., The London and New York Stock Exchanges, 1850-1914 (London: Allen and Unwin,
1987).
North, Douglass C., The Economic Growth of the United States, 1790-1860 (Englewood Cliffs, NJ:
Prentice Hall, 1961).
Osterwald-Lenum, Michael, A Note with Fractiles of the Asymptotic Distribution of the Maximum
Likelihood Cointegration Rank Test Statistics: Four Cases. Oxford Bulletin of Economics and
Statistics 54 (1992), 461-78.
Perkins, Edwin J., American Public Finance and Financial Services, 1700-1815 (Columbus: Ohio
State University Press, 1994).
Rostow, W. W., The Stages of Economic Growth (Cambridge: Cambridge University Press, 1960).
45
Rousseau, Peter L., "The Permanent Effects of Innovation on Financial Depth: Theory and U.S.
Historical Evidence From Unobservable Components Models," Journal of Monetary Economics 42
(October 1998), 387-425.
Rousseau, Peter L., "Share Liquidity and Industrial Growth in an Emerging Market: The Case of New
England 1854-1897," National Bureau of Economic Research, Working Paper Series on Historical
Factors in Long Run Growth, no. 117 (Cambridge, MA, March 1999).
Rousseau, Peter L., and Paul Wachtel, "Financial Intermediation and Economic Performance:
Historical Evidence From Five Industrialized Countries." Journal of Money, Credit and Banking 30
(November 1998), 657-678.
Rousseau, Peter L. and Paul Wachtel, "Equity Markets and Growth: Cross Country Evidence on
Timing and Outcomes 1980-1995," Journal of Banking and Finance 24 (2000, forthcoming).
Schwartz, Anna Jacobson, "The Beginning of Competitive Banking in Philadelphia, 1782-1809,"
Journal of Political Economy 55 (October 1947), 417-431.
Shaw, Edward S., Financial Deepening in Economic Development (New York: Oxford University
Press, 1973).
Sims, Christopher A., James H. Stock and Mark W. Watson, "Inference in Time Series Models with
Some Unit Roots," Econometrica 58 (1990), 113-44.
Sylla, Richard, "Shaping the U.S. Financial System, 1690-1913: The Dominant Role of Public
Finance," in Richard Sylla, Richard Tilly, and Gabriel Tortella (eds.), The State, the Financial
System, and Economic Modernization (Cambridge: Cambridge University Press, 1999), 249-270.
Sylla, Richard, "U.S. Securities Markets and the Banking System, 1790-1840," Federal Reserve Bank
of St. Louis Review, 80 (May/June 1998), 83-98.
Sylla, Richard, "Early American Banking: The Significance of the Corporate Form," Business and

46
Economic History, Second Series, 14 (1985), 105-23.
Sylla, Richard, Jack W. Wilson and Robert E. Wright, "America's First Securities Markets:
Emergence, Development, and Integration." Working paper presented at the Cliometric Society
Meetings, Toronto (May 1997) and the NBER Summer Institute (July 1997).
Taylor, George Rogers, "American Economic Growth Before 1840: An Exploratory Essay," Journal of
Economic History, 24 (December 1964), 427-444.
Temin, Peter, The Jacksonian Economy (New York: W. W. Norton and Company, 1969).
Thomas, W. A., The Provincial Stock Exchanges (London: Frank Cass, 1973).
Toda, Hiro Y., and T. Yamamoto, "Statistical Inference in Vector Autoregressions with Possibly
Integrated Processes," Journal of Econometrics 66 (1995), 225-250.
U.S. Bureau of the Census, Historical Statistics of the United States, Colonial Times to 1970
(Washington, DC: Bureau of the Census, 1975).
Weiss, Thomas, "Economic Growth Before 1860: Revised Conjectures," in Thomas Weiss and Donald
Schaefer (eds.), American Economic Development in Historical Perspective (Stanford: Stanford
University Press, 1994), 11-27.
Wettereau, James O., Statistical Records of the First Bank of the United States, edited by Stuart
Bruchey (New York: Garland Publishing, 1985).
Wright, Robert E., "Bank Ownership and Lending Patterns in New York and Pennsylvania 1781-
1831," Business History Review 73 (1999), 40-60.

47
Appendix A. Construction of Series for the Money Stock, 1790-1820
This appendix explains the methods used to construct a series for the stock of money over the
period from 1790 to 1820 and presents the new figures. We begin with the estimates for 1820-1850
that Peter Temin compiled for his 1969 book The Jacksonian Economy, and then replicate his
technique as closely as possible to extend the estimates backward to 1790. Our measure of the broad
stock of money sums the total liabilities of banks to the public and specie in the hands of the public. At
the time, the banking sector included a central bank (the BUS 1790-1811 and the Second BUS 1817-
1839), banks chartered by individual states, as well as private (non-chartered) banks. Total liabilities
for the latter are generally unavailable before 1850 but considered to be small. We discuss each of
these components below.
A.1 Obligations of Chartered Banks to the Public
These obligations are estimated by summing notes in circulation, deposits, and amounts due to other
banks, and then subtracting amounts due from other banks and holdings of notes of other banks.
Fenstermaker (1965a, Table 10, pp. 66-7) includes these items from 1819 to 1837 for a reasonably
broad subset of banks, and also provides the total number of banks in each year. Temin used the ratio
of total state banks to those reporting in each year to “blow up” the bank liabilities for Fenstermaker's
subset to reflect the nation as a whole. We compute state bank obligations to the public for 1803-1820
by applying this technique to balance sheet items from Fenstermaker (1965b). This source is less
representative. In 1818, coverage includes 43 percent of the state banks, but this falls to 29 percent by
1810, 24 percent by 1805, and only 13 percent by 1803. For 1803-1804, the sample includes only
state banks in Massachusetts. Other states enter the sample as follows: Virginia 1805; Mississippi
1811; Pennsylvania, South Carolina, the District of Columbia, and New Hampshire 1814; New York
1817; Kentucky 1818. The article does not break down the balance sheet items or the number of banks

48
by state. We again “blow up” these figures using the actual number of chartered banks to estimate
obligations.
We then use the amount of bills discounted at the Massachusetts First National Bank of Boston
(from Gras, 1937, pp. 650-651) to extend bank liabilities and specie inside banks backward through
1790. Under the strong assumption that the amount of bills discounted by the few banks that had
obtained charters over this period fluctuated similarly to the Massachusetts Bank’s obligations to the
public and specie, we then use the ratio of the capital of the Massachusetts Banks and total banking
capital in the US in each year to “blow up” bills and discounts to a national level. We then splice this
item onto both the obligations and specie series in 1803. This places much emphasis on fluctuations in
a single bank's balance sheet, yet these records are the only ones available prior to 1803. It is also
important to note that only three banks had obtained state charters as late as 1790, and that the
obligations of state banks thus account for only a small portion of the money stock at this time.
A.2. Obligations of the First and Second Banks of the United States to the Public
The 1985 reprint of James Wettereau's Statistics of the First Bank of the United States includes
observations for specie holdings, notes in circulation, individual and government deposits, notes of
other banks, and balances due to and from other banks at (or around) the end of each year from 1792 to
1801 from balance sheets of the BUS. This allows computation of total BUS obligations to the public
until 1802. Records for 1802-1807 do not appear to have survived, and when observations again
become available in 1808 they include only specie, notes in circulation, and deposits. It so happens that
the sum of individual and government deposits in 1801 is the same as that for total deposits in 1808.
We fill in the intervening years by repeating the 1801 estimates for 1802-1807.
Notes in circulation are 5.08 in 1801 and 4.5 in 1808. Blodget (1806) includes a series for total
bank notes for 1801-1807. One way to back out figures for 1801-1807 is to treat BUS notes as a

49
residual obtained by subtracting state bank notes from total notes. Here, data on notes in circulation
from Fenstermaker (1965a, 1984) can be used to estimate those notes attributable to state banks, and
the residual should approximate BUS notes. Since there is an overlapping observation in 1801, it can
be used to splice the constructed series (1802-1807) to Wettereau's figure for 1801. The manipulation
of Fenstermaker's data is similar to that described above for total obligations of state banks. Since
notes of other banks and balances due to and from other banks are not available for the BUS after
1801, these cannot be included in the total BUS obligations. Rather, we compute obligations without
them from 1802-1808 and ratio splice the result to the total for 1801.
Senate Document 128 (35th Congress, 2nd Session, 1838, pp. 208-211) includes all items required
to compute obligations of the second BUS and its branches to the public for 1817-39.
A.3. Specie in the Hands of the Public
Temin obtains official estimates of specie in the hands of the public from 1830 onward, and uses net
specie flows to extrapolate the series backward to 1820. Temin’s estimate of the specie stock for 1820
(at $41 mil.) is 64 percent higher than that provided by Ezra Seaman for September of that year. We
use North's net specie flows to extend Temin's estimates back to 1807, where Blodget's continuous
series (1792-1807) ends. By then, the constructed estimates are 101.5 percent higher than those of
Blodget. Lacking a more acceptable technique for estimating specie from 1808 to 1820, however, we
apply it back to 1808, and then ratio splice Blodget’s series to the result. This probably overstates the
level of specie, but the series exhibits the fluctuations of Blodget's series for 1792-1807. Note that
continuing to use specie flows before 1807 produces a series which is much less variable than
Blodget's series and the later estimates. From this series for specie stock we subtract specie holdings
by state banks (constructed with Fenstermaker's data as above) and specie in the first BUS to obtain an
estimate of specie in the hands of the public.

50
Table A.1The Stock of Money, 1790-1820 (millions of current dollars)
1790 29.1 1806 62.2 1791 26.4 1807 60.1 1792 35.6 1808 62.8 1793 41.4 1809 56.6 1794 46.0 1810 64.1 1795 42.7 1811 45.9 1796 39.1 1812 63.4 1797 40.8 1813 61.8 1798 39.6 1814 81.9 1799 49.0 1815 75.1 1800 55.5 1816 86.4 1801 53.0 1817 94.1 1802 52.0 1818 84.4 1803 45.0 1819 86.0 1804 70.0 1820 85.0 1805 54.2
Appendix B. Time Series Properties of Data Used in the Empirical Analysis
This section presents results of tests for unit roots and cointegration for the series and systems used
in the analysis. We begin with a set of augmented Dickey-Fuller (ADF) tests, which take the presence
of a unit root as the null hypothesis. If ADF tests are unable to reject the unit root for a series in levels,
yet reject after differencing, there is some justification for treating the series as I(1) in subsequent
modeling. The univariate representations for the ADF tests include four lags, which conforms with the
“Akaike plus two” criterion. The trending nature of all series make both constant and trend terms
necessary in the levels specifications, while a constant-only regression is used for the first differences.
The log transformation is applied to all series prior to testing. Table B.1 reports test statistics and
significance levels. The test rejects the null of a unit root for the data in levels and fails to reject for
first differences.
We next test for cointegration in each of the ten VAR systems that we consider. A system with
non-stationary variables is classified as cointegrated if a linear combination exists which yields a

51
)x t ' µ % jk&1
i'1' i)x t&i % A x t&k % e t ,
stationary series when applied to the data. In the tri-variate case, a single cointegrating vector also
implies that the error terms of the system are stationary. The technique developed in Johansen (1991)
provides a regression-based test for determining both the presence of cointegration and the number of
linear stationary combinations which span the space. Each system is modeled as a VAR of the form
(B.1)
where xt is a vector containing the three potentially endogenous variables and k is adequately large both
to capture the short-run dynamics of the underlying VAR and to generate residuals that approximate
the normal distribution. The lag order for each system is chosen with a series of nested likelihood ratio
tests. The presence of trends in the data suggest the inclusion of an unrestricted intercept. The
Johansen methodology tests whether the AA matrix in (B.1) is of less than full rank via the trace and
maximum eigenvalue statistics.
Table B.2 reports these test statistics for the relevant tri-variate combinations. Rejection of the null
hypothesis of no cointegration ® = 0) coupled with a failure to reject the null of at most one
cointegrating vector ® = 1) provides evidence of a single long-run relationship in a given system. This
result obtains in all but the first two systems, with rejections of the r = 0 hypothesis at the 10% level or
less.
The Johansen regressions also facilitate a test for stationarity of the variables in those systems for
which the number of cointegrating vectors is clear. These tests (not shown here) are able to reject the
null of stationarity at the 1 percent level for the series which comprise the eight systems that can be
characterized by a single cointegrating vector. Since ADF tests are unable to reject the unit root for a
given series and the Johansen test rejects stationarity in these cases, our decision to treat all variables as
I(1) processes is a reasonable one.

52
Table B.1Augmented Dickey-Fuller Test Statistics for MacroeconomicIndicators and Measures of Market Development, 1790-1850
Levels 1st Difference
Macroeconomic Indicators
Real GNP Per Capita (GNP)
-3.13 -3.73**
Real Private Domestic Investment Per Capita (INV)
-2.50 -4.32**
Real Imports Per Capita (IMP)
-1.83 -3.95**
Cumulative Business Incorporations (INC)
-2.39 -2.39
Cumulative Non-Financial Business Incorporations (NFINC)
-2.81 -2.73*
Financial Variables
Real Per Capita Money Stock (MSTOCK)
-2.38 -3.65**
Number of State Chartered Banks (NOB)
-1.44 -3.67**
Number of Listed Securities, Three Markets (3MKT)
-1.58 -3.61**
Number of Listed Securities Per Capita, Three Markets (3MKTP)
-1.55 -3.63**
Number of Listed Securities, Four Markets (4MKT)
-0.97 -2.95**
Number of Listed Securities Per Capita, Four Markets (4MKTP)
-0.89 -2.96**
All variables are in logs. The test regressions use four lags, and include constant and trendfor the levels variables and constant only for first differences. * and ** denote rejection ofthe unit root hypothesis at the 10% and 5% levels respectively, using finite sample criticalvalues are from Fuller (1976), Table 8.5.2.

53
Table B.2Johansen Test Statistics for Cointegration, 1790-1850
Trace Max. Eigenvalue
System r=0 r#1 r=0 r#1 r#2
GNP, MSTOCK, and
3MKTP (K=4) 24.68 11.03 13.65 9.22 1.81
4MKTP (K=4) 24.13 12.68 11.44 10.82 1.86
GPDI, MSTOCK, and
3MKTP (K=4) 28.72* 9.30 19.42* 6.98 2.31
4MKTP (K=4) 32.45** 8.95 23.50** 6.29 2.65
IMPORT, MSTOCK, and
3MKTP (K=4) 29.35* 9.63 19.71* 7.77 1.86
4MKTP (K=4) 31.72** 12.21 19.51* 10.19 2.02
INC, NOB, and
3MKT (K=3) 36.15** 10.95 25.19** 9.01 1.95
4MKT (K=3) 37.16** 11.29 25.87** 9.25 2.04
NFINC, NOB, and
3MKT (K=3) 41.69** 12.25 29.44** 10.03 2.22
4MKT (K=3) 42.85** 12.90 29.94** 10.55 2.35
K is the lag at which the levels terms enter the test regressions. The columns labeled r=0 testa null hypothesis of no cointegration, while the r#1 (r#2) columns test a null of at most one(two) cointegrating vectors. * and ** denote rejections of the null at the 10% and 5% levelsrespectively, with critical values from Osterwald-Lenum (1992), Table 1.