mergers and acquisitions – an architectural perspective ... za download/sybase_pd... · mergers...
TRANSCRIPT
white paper
www.sybase.com
Mergers and Acquisitions – an Architectural Perspective
David DichmannSybase PowerDesigner Senior Product Manager

taBLe OF CONteNtS 1 The Value of Enterprise Architecture in effective IT Integration in Mergers and Acquisitions 1 Successful Integration of Organizations 2 Enterprise and Information Architecture for M&A 2 Asset Discovery – Taking Inventory 3 Discovering Data Assets 6 Discovering Process Assets 8 Discovering Application and Technology Assets 10 Discovering the Enterprise Architecture 12 Integration and Consolidation 13 Mergers and Acquisitions – A Model Approach 13 Sybase PowerDesigner for Mergers and Acquisitions 13 Summary
1
the VaLue OF eNterpriSe arChiteCture iN eFFeCtiVe it iNtegratiON iN MergerS aNd aCquiSitiONSAs a senior manager or executive responsible for planning IT response to a merger or acquisition, you will be faced
with considerable challenges, and with those challenges comes considerable risk. In IT planning, the knowledge you need to be successful comes from the information about your architecture itself, the business, information, application and technology architectures and how they are related. This knowledge is often badly defined, compartmentalized and disconnected. In merger or acquisition scenarios, this problem is further compounded by a disconnected knowledge across the borders between the former organizations. The more “unplanned” the merger or acquisition, the more chaos will be encountered, as there will have been no real investigation on how to integrate the business and IT architectures between the newly joined organizations.
SuCCeSSFuL iNtegratiON OF OrgaNizatiONSThe truth of the matter is that many organizations cannot successfully integrate merged organizations and
business operations fast enough to maximize the return on investment of the merger or acquisition. This failure means many organizations are finding themselves either less efficient or no more efficient than when they were separate entities. According to a recent Bloor Report:
More than 50% of companies were not able to provide any integration within 3 months of acquisition: so how were they able to provide consolidated financial reporting?Poor documentation of systems, a lack of metadata, diverse and uncontrolled data sources and poor data quality were all reported as significant problem areas by more than 50% of companies.Poor planning of the IT integration process was cited as a significant problem by 54% of respondents1.
In order to begin the consolidation of systems, it is necessary to have a complete understanding of the current environments that are going to be brought together. One of the key challenges in doing the discovery work in a post-merger environment is that each of the organizations will have documentation and models in different formats using different tools. The challenge is trying to incorporate all of these different sources of knowledge into a single version of the truth, and do so in a way that provides easy access to all involved.
A new breed of tools has emerged which allows companies to effectively support the discovery of assets, of various sorts, and manage them together in a single integrated environment. This is making the task of knowing and understanding what you have in the combined organizations far easier to do. Using these tools and techniques provides the best possible information needed to make decisions quickly and effectively. It also allows you to see the, “what, how and when” so you can take specific integration steps to consolidate and integrate business and technology services; driving the execution of proposed changes in a controlled, predictable, reliable and efficient manner.
•
•
•
1 Mergers and Acquisitions – Secrets to Success: Eric Offenberg, September/October 2007
2
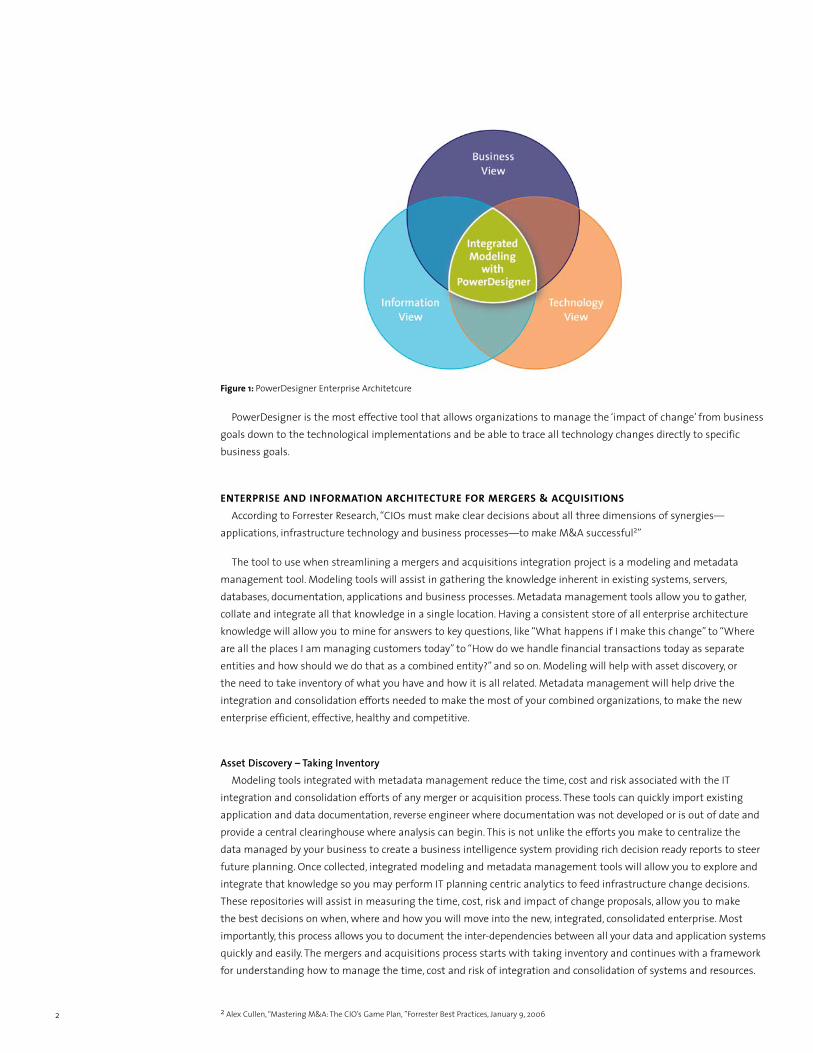
Figure 1: PowerDesigner Enterprise Architetcure
PowerDesigner is the most effective tool that allows organizations to manage the ‘impact of change’ from business goals down to the technological implementations and be able to trace all technology changes directly to specific business goals.
eNterpriSe aNd iNFOrMatiON arChiteCture FOr MergerS & aCquiSitiONSAccording to Forrester Research, “CIOs must make clear decisions about all three dimensions of synergies—
applications, infrastructure technology and business processes—to make M&A successful2”
The tool to use when streamlining a mergers and acquisitions integration project is a modeling and metadata management tool. Modeling tools will assist in gathering the knowledge inherent in existing systems, servers, databases, documentation, applications and business processes. Metadata management tools allow you to gather, collate and integrate all that knowledge in a single location. Having a consistent store of all enterprise architecture knowledge will allow you to mine for answers to key questions, like “What happens if I make this change” to “Where are all the places I am managing customers today” to “How do we handle financial transactions today as separate entities and how should we do that as a combined entity?” and so on. Modeling will help with asset discovery, or the need to take inventory of what you have and how it is all related. Metadata management will help drive the integration and consolidation efforts needed to make the most of your combined organizations, to make the new enterprise efficient, effective, healthy and competitive.
Asset Discovery – Taking InventoryModeling tools integrated with metadata management reduce the time, cost and risk associated with the IT
integration and consolidation efforts of any merger or acquisition process. These tools can quickly import existing application and data documentation, reverse engineer where documentation was not developed or is out of date and provide a central clearinghouse where analysis can begin. This is not unlike the efforts you make to centralize the data managed by your business to create a business intelligence system providing rich decision ready reports to steer future planning. Once collected, integrated modeling and metadata management tools will allow you to explore and integrate that knowledge so you may perform IT planning centric analytics to feed infrastructure change decisions. These repositories will assist in measuring the time, cost, risk and impact of change proposals, allow you to make the best decisions on when, where and how you will move into the new, integrated, consolidated enterprise. Most importantly, this process allows you to document the inter-dependencies between all your data and application systems quickly and easily. The mergers and acquisitions process starts with taking inventory and continues with a framework for understanding how to manage the time, cost and risk of integration and consolidation of systems and resources.
2 Alex Cullen, “Mastering M&A: The CIO’s Game Plan, ”Forrester Best Practices, January 9, 2006
3
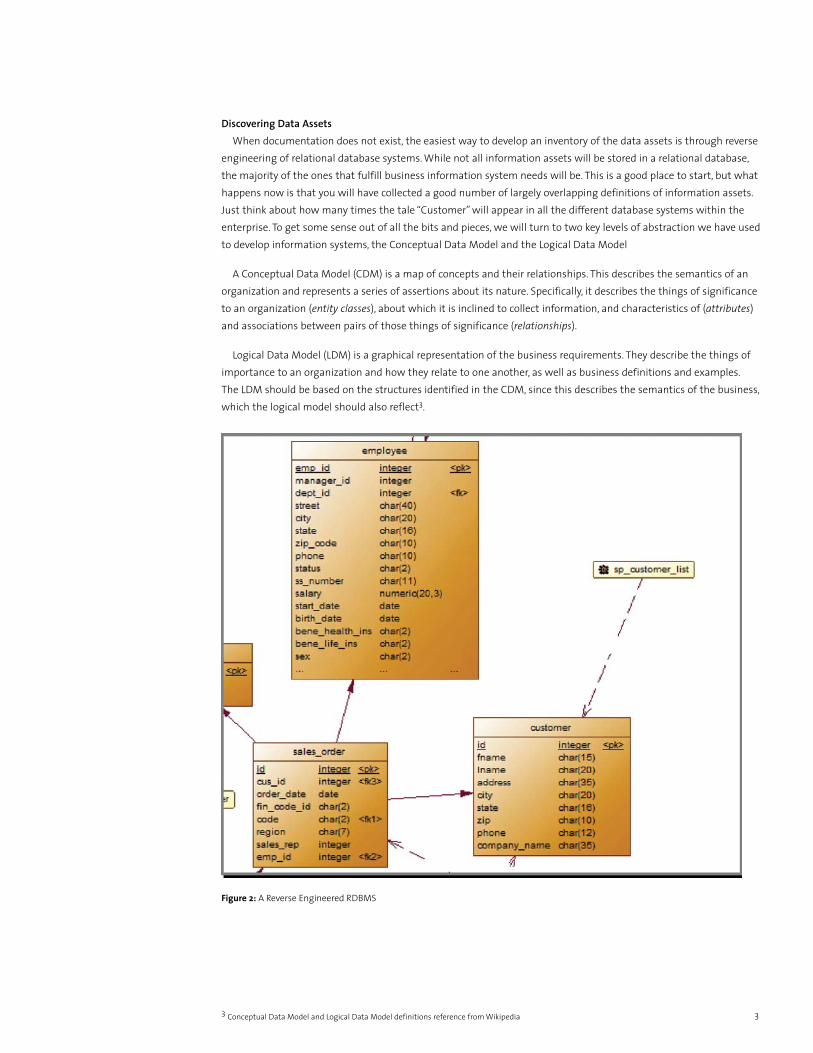
Discovering Data AssetsWhen documentation does not exist, the easiest way to develop an inventory of the data assets is through reverse
engineering of relational database systems. While not all information assets will be stored in a relational database, the majority of the ones that fulfill business information system needs will be. This is a good place to start, but what happens now is that you will have collected a good number of largely overlapping definitions of information assets. Just think about how many times the tale “Customer” will appear in all the different database systems within the enterprise. To get some sense out of all the bits and pieces, we will turn to two key levels of abstraction we have used to develop information systems, the Conceptual Data Model and the Logical Data Model
A Conceptual Data Model (CDM) is a map of concepts and their relationships. This describes the semantics of an organization and represents a series of assertions about its nature. Specifically, it describes the things of significance to an organization (entity classes), about which it is inclined to collect information, and characteristics of (attributes) and associations between pairs of those things of significance (relationships).
Logical Data Model (LDM) is a graphical representation of the business requirements. They describe the things of importance to an organization and how they relate to one another, as well as business definitions and examples. The LDM should be based on the structures identified in the CDM, since this describes the semantics of the business, which the logical model should also reflect3.
Figure 2: A Reverse Engineered RDBMS
3 Conceptual Data Model and Logical Data Model definitions reference from Wikipedia
4
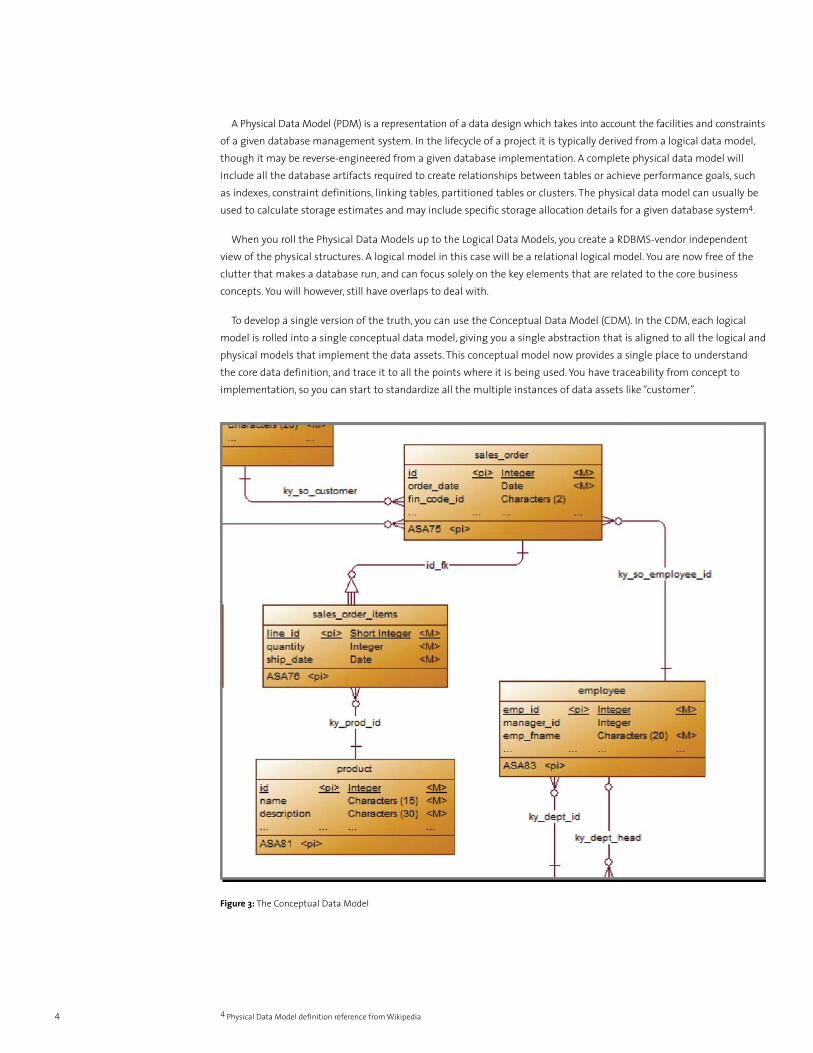
A Physical Data Model (PDM) is a representation of a data design which takes into account the facilities and constraints of a given database management system. In the lifecycle of a project it is typically derived from a logical data model, though it may be reverse-engineered from a given database implementation. A complete physical data model will include all the database artifacts required to create relationships between tables or achieve performance goals, such as indexes, constraint definitions, linking tables, partitioned tables or clusters. The physical data model can usually be used to calculate storage estimates and may include specific storage allocation details for a given database system4.
When you roll the Physical Data Models up to the Logical Data Models, you create a RDBMS-vendor independent view of the physical structures. A logical model in this case will be a relational logical model. You are now free of the clutter that makes a database run, and can focus solely on the key elements that are related to the core business concepts. You will however, still have overlaps to deal with.
To develop a single version of the truth, you can use the Conceptual Data Model (CDM). In the CDM, each logical model is rolled into a single conceptual data model, giving you a single abstraction that is aligned to all the logical and physical models that implement the data assets. This conceptual model now provides a single place to understand the core data definition, and trace it to all the points where it is being used. You have traceability from concept to implementation, so you can start to standardize all the multiple instances of data assets like “customer”.
Figure 3: The Conceptual Data Model
4 Physical Data Model definition reference from Wikipedia
5
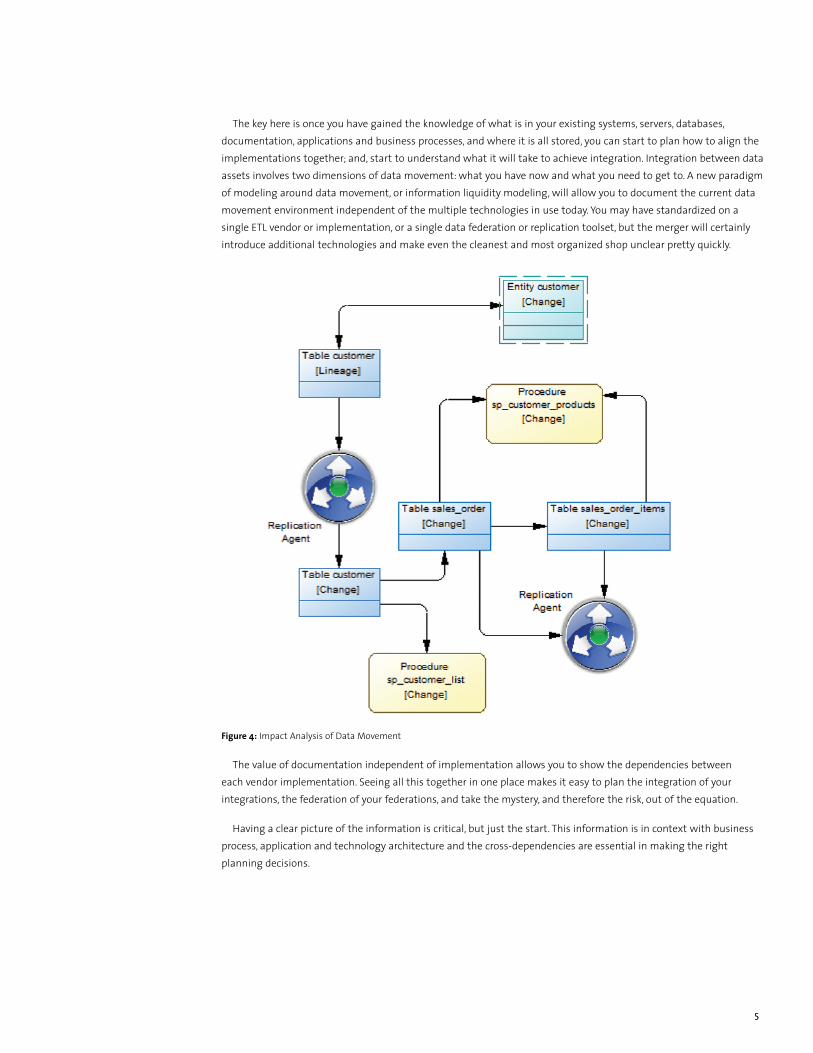
The key here is once you have gained the knowledge of what is in your existing systems, servers, databases, documentation, applications and business processes, and where it is all stored, you can start to plan how to align the implementations together; and, start to understand what it will take to achieve integration. Integration between data assets involves two dimensions of data movement: what you have now and what you need to get to. A new paradigm of modeling around data movement, or information liquidity modeling, will allow you to document the current data movement environment independent of the multiple technologies in use today. You may have standardized on a single ETL vendor or implementation, or a single data federation or replication toolset, but the merger will certainly introduce additional technologies and make even the cleanest and most organized shop unclear pretty quickly.
Figure 4: Impact Analysis of Data Movement
The value of documentation independent of implementation allows you to show the dependencies between each vendor implementation. Seeing all this together in one place makes it easy to plan the integration of your integrations, the federation of your federations, and take the mystery, and therefore the risk, out of the equation.
Having a clear picture of the information is critical, but just the start. This information is in context with business process, application and technology architecture and the cross-dependencies are essential in making the right planning decisions.
5
6
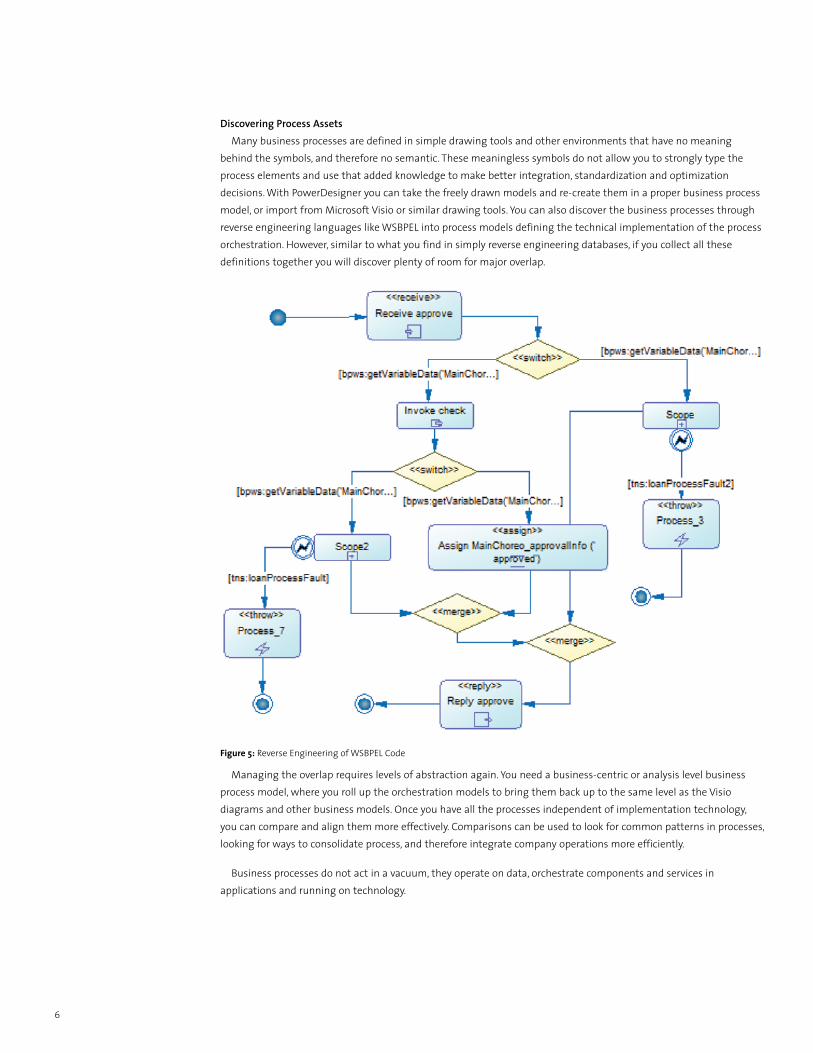
Discovering Process AssetsMany business processes are defined in simple drawing tools and other environments that have no meaning
behind the symbols, and therefore no semantic. These meaningless symbols do not allow you to strongly type the process elements and use that added knowledge to make better integration, standardization and optimization decisions. With PowerDesigner you can take the freely drawn models and re-create them in a proper business process model, or import from Microsoft Visio or similar drawing tools. You can also discover the business processes through reverse engineering languages like WSBPEL into process models defining the technical implementation of the process orchestration. However, similar to what you find in simply reverse engineering databases, if you collect all these definitions together you will discover plenty of room for major overlap.
Figure 5: Reverse Engineering of WSBPEL Code
Managing the overlap requires levels of abstraction again. You need a business-centric or analysis level business process model, where you roll up the orchestration models to bring them back up to the same level as the Visio diagrams and other business models. Once you have all the processes independent of implementation technology, you can compare and align them more effectively. Comparisons can be used to look for common patterns in processes, looking for ways to consolidate process, and therefore integrate company operations more efficiently.
Business processes do not act in a vacuum, they operate on data, orchestrate components and services in applications and running on technology.
7
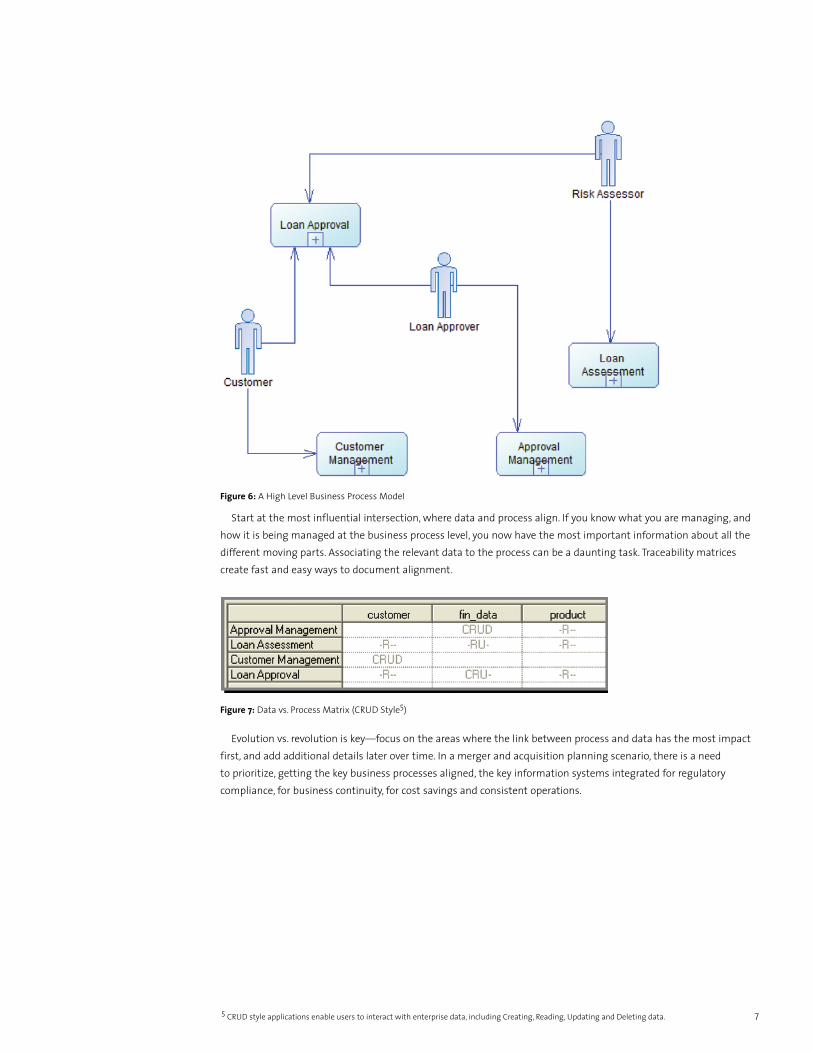
Figure 6: A High Level Business Process Model
Start at the most influential intersection, where data and process align. If you know what you are managing, and how it is being managed at the business process level, you now have the most important information about all the different moving parts. Associating the relevant data to the process can be a daunting task. Traceability matrices create fast and easy ways to document alignment.
Figure 7: Data vs. Process Matrix (CRUD Style5)
Evolution vs. revolution is key—focus on the areas where the link between process and data has the most impact first, and add additional details later over time. In a merger and acquisition planning scenario, there is a need to prioritize, getting the key business processes aligned, the key information systems integrated for regulatory compliance, for business continuity, for cost savings and consistent operations.
5 CRUD style applications enable users to interact with enterprise data, including Creating, Reading, Updating and Deleting data.

8
Discovering Application and Technology AssetsAfter you have identified the key information and processes to integrate, you will need to align it with an inventory
of the applications and services that perform the automation. Taking inventory of the application assets starts with a reverse engineering of the code, Java, C#, VB.NET, WSDL, XML and other sources. You need to look for the big-block items with this process, look to identify what pieces you have, how they are related to each other, so you can relate them to information and process. Now, again you find multiple implementation models all tied to a series of different implementation languages with tremendous overlap. Again, think about all the different code that is operating on Customer data—and how many different languages that code is written in.
Figure 8: Reverse Engineered Java J2EE Application
By continuing the reverse engineering process to an analysis-level representation of the code assets, you can roll up several implementations together into a fewer number of analysis models and start to rectify any discontinuity between service definitions or application architectures. You will also start to get a “where used” type of analysis to help identify the potentially multiple services all working towards the same basic interface, identifying opportunities for consolidation.
9
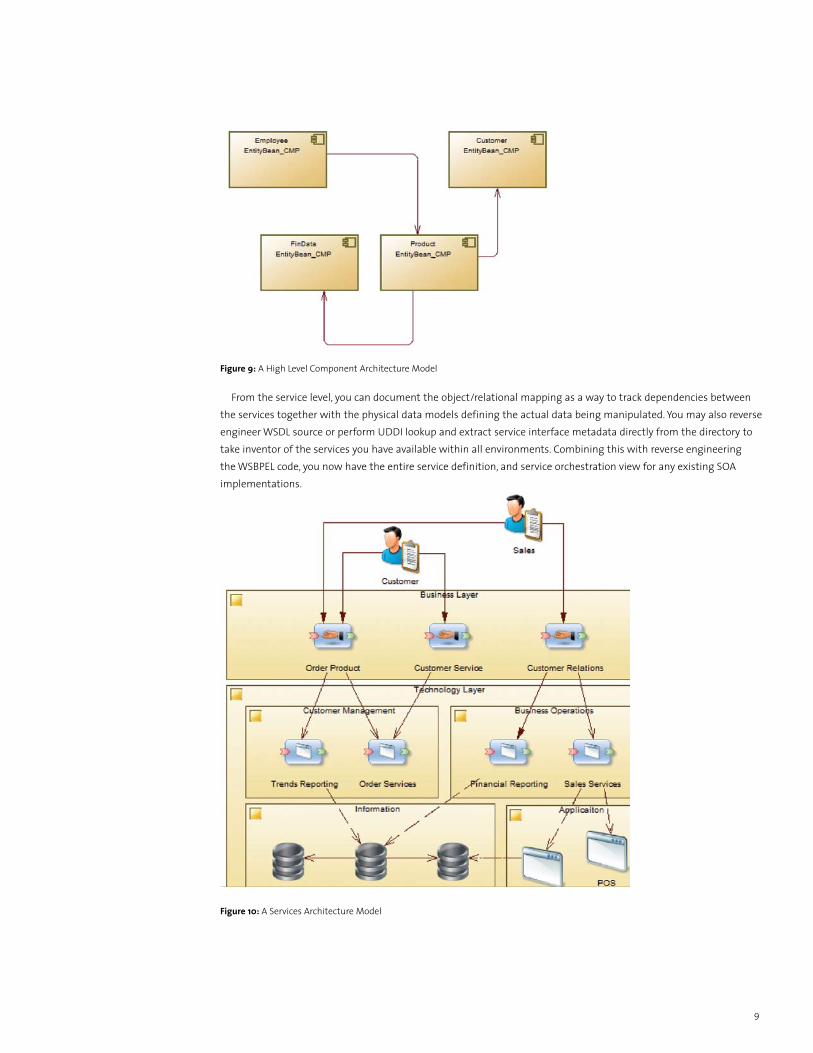
Figure 9: A High Level Component Architecture Model
From the service level, you can document the object/relational mapping as a way to track dependencies between the services together with the physical data models defining the actual data being manipulated. You may also reverse engineer WSDL source or perform UDDI lookup and extract service interface metadata directly from the directory to take inventor of the services you have available within all environments. Combining this with reverse engineering the WSBPEL code, you now have the entire service definition, and service orchestration view for any existing SOA implementations.
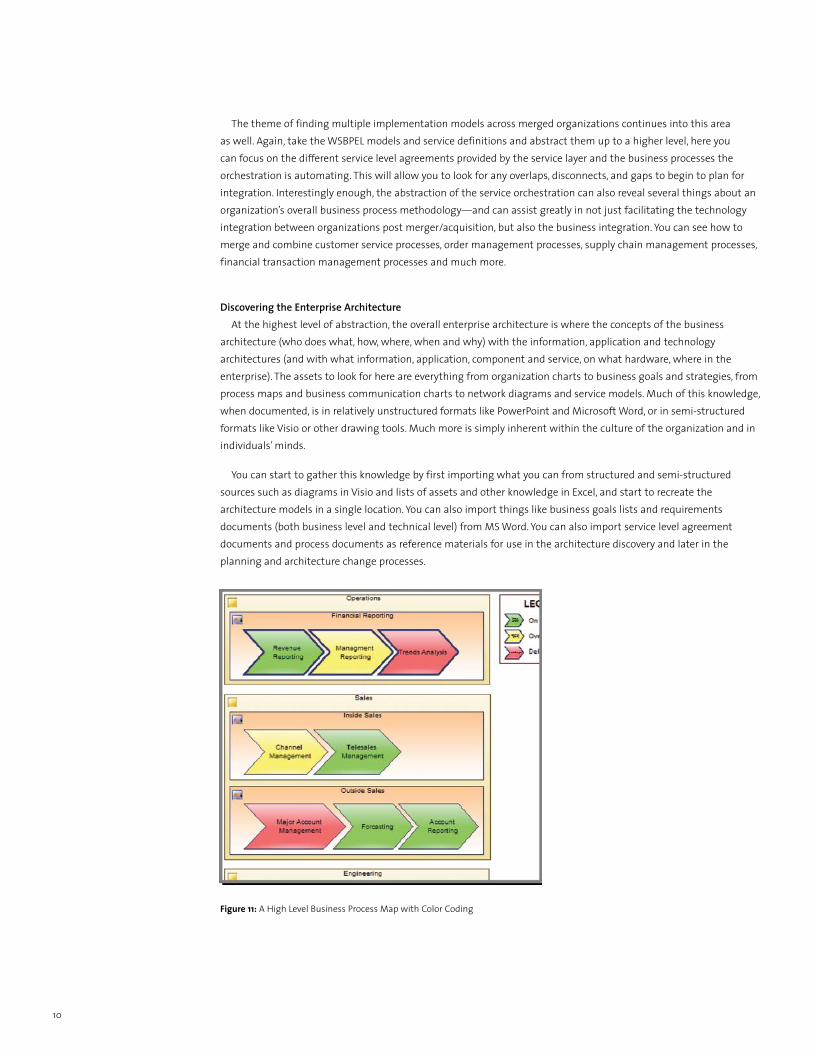
Figure 10: A Services Architecture Model
10
The theme of finding multiple implementation models across merged organizations continues into this area as well. Again, take the WSBPEL models and service definitions and abstract them up to a higher level, here you can focus on the different service level agreements provided by the service layer and the business processes the orchestration is automating. This will allow you to look for any overlaps, disconnects, and gaps to begin to plan for integration. Interestingly enough, the abstraction of the service orchestration can also reveal several things about an organization’s overall business process methodology—and can assist greatly in not just facilitating the technology integration between organizations post merger/acquisition, but also the business integration. You can see how to merge and combine customer service processes, order management processes, supply chain management processes, financial transaction management processes and much more.
Discovering the Enterprise ArchitectureAt the highest level of abstraction, the overall enterprise architecture is where the concepts of the business
architecture (who does what, how, where, when and why) with the information, application and technology architectures (and with what information, application, component and service, on what hardware, where in the enterprise). The assets to look for here are everything from organization charts to business goals and strategies, from process maps and business communication charts to network diagrams and service models. Much of this knowledge, when documented, is in relatively unstructured formats like PowerPoint and Microsoft Word, or in semi-structured formats like Visio or other drawing tools. Much more is simply inherent within the culture of the organization and in individuals’ minds.
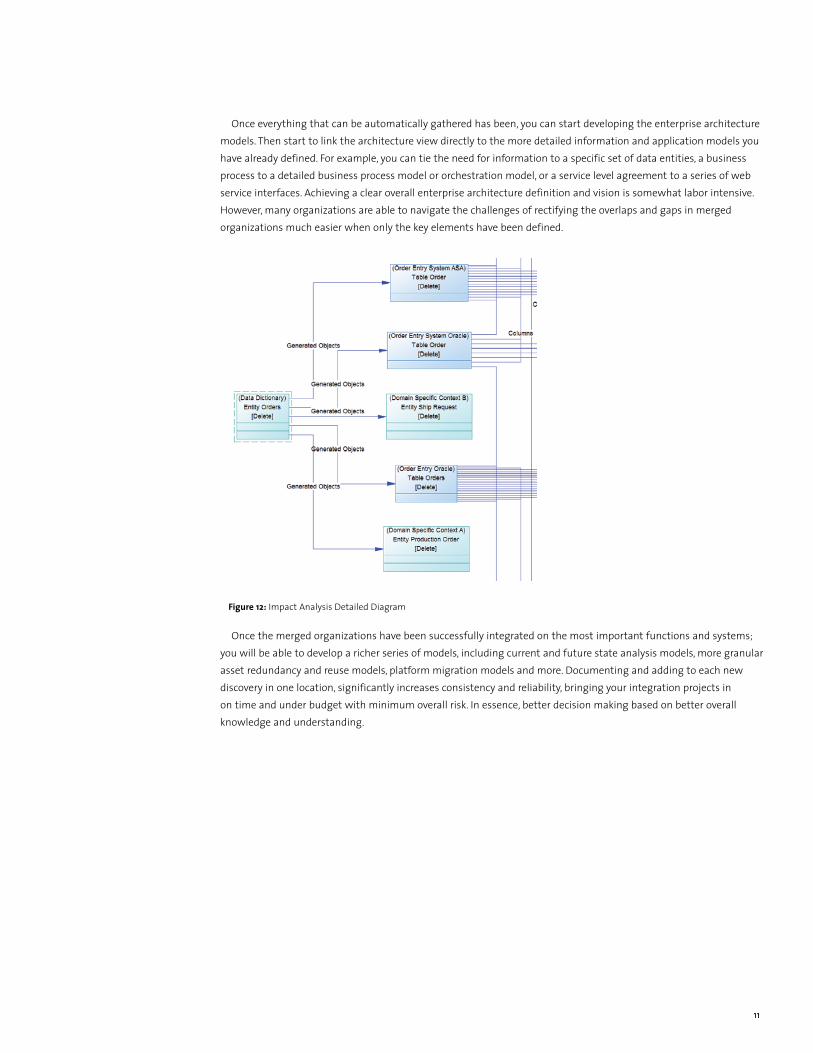
You can start to gather this knowledge by first importing what you can from structured and semi-structured sources such as diagrams in Visio and lists of assets and other knowledge in Excel, and start to recreate the architecture models in a single location. You can also import things like business goals lists and requirements documents (both business level and technical level) from MS Word. You can also import service level agreement documents and process documents as reference materials for use in the architecture discovery and later in the planning and architecture change processes.
Figure 11: A High Level Business Process Map with Color Coding
1111
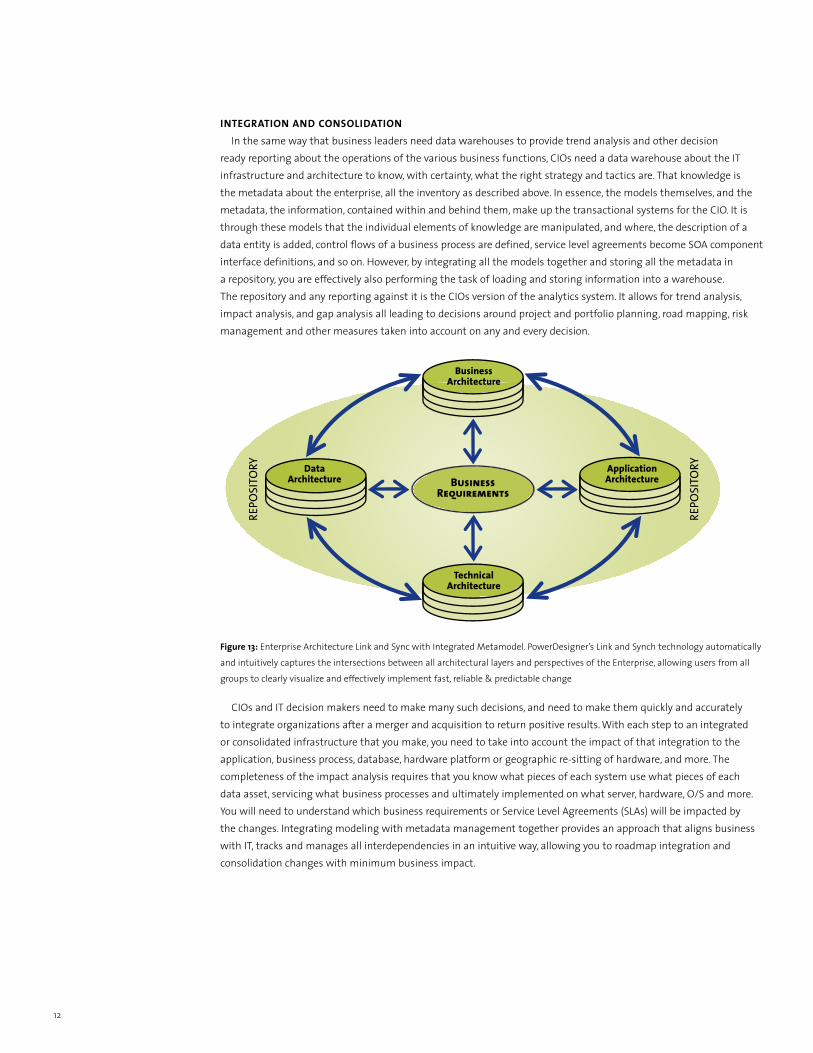
Once everything that can be automatically gathered has been, you can start developing the enterprise architecture models. Then start to link the architecture view directly to the more detailed information and application models you have already defined. For example, you can tie the need for information to a specific set of data entities, a business process to a detailed business process model or orchestration model, or a service level agreement to a series of web service interfaces. Achieving a clear overall enterprise architecture definition and vision is somewhat labor intensive. However, many organizations are able to navigate the challenges of rectifying the overlaps and gaps in merged organizations much easier when only the key elements have been defined.
Figure 12: Impact Analysis Detailed Diagram
Once the merged organizations have been successfully integrated on the most important functions and systems; you will be able to develop a richer series of models, including current and future state analysis models, more granular asset redundancy and reuse models, platform migration models and more. Documenting and adding to each new discovery in one location, significantly increases consistency and reliability, bringing your integration projects in on time and under budget with minimum overall risk. In essence, better decision making based on better overall knowledge and understanding.
12
iNtegratiON aNd CONSOLidatiONIn the same way that business leaders need data warehouses to provide trend analysis and other decision
ready reporting about the operations of the various business functions, CIOs need a data warehouse about the IT infrastructure and architecture to know, with certainty, what the right strategy and tactics are. That knowledge is the metadata about the enterprise, all the inventory as described above. In essence, the models themselves, and the metadata, the information, contained within and behind them, make up the transactional systems for the CIO. It is through these models that the individual elements of knowledge are manipulated, and where, the description of a data entity is added, control flows of a business process are defined, service level agreements become SOA component interface definitions, and so on. However, by integrating all the models together and storing all the metadata in a repository, you are effectively also performing the task of loading and storing information into a warehouse. The repository and any reporting against it is the CIOs version of the analytics system. It allows for trend analysis, impact analysis, and gap analysis all leading to decisions around project and portfolio planning, road mapping, risk management and other measures taken into account on any and every decision.
Figure 13: Enterprise Architecture Link and Sync with Integrated Metamodel. PowerDesigner’s Link and Synch technology automatically
and intuitively captures the intersections between all architectural layers and perspectives of the Enterprise, allowing users from all
groups to clearly visualize and effectively implement fast, reliable & predictable change
CIOs and IT decision makers need to make many such decisions, and need to make them quickly and accurately to integrate organizations after a merger and acquisition to return positive results. With each step to an integrated or consolidated infrastructure that you make, you need to take into account the impact of that integration to the application, business process, database, hardware platform or geographic re-sitting of hardware, and more. The completeness of the impact analysis requires that you know what pieces of each system use what pieces of each data asset, servicing what business processes and ultimately implemented on what server, hardware, O/S and more. You will need to understand which business requirements or Service Level Agreements (SLAs) will be impacted by the changes. Integrating modeling with metadata management together provides an approach that aligns business with IT, tracks and manages all interdependencies in an intuitive way, allowing you to roadmap integration and consolidation changes with minimum business impact.
REPO
SITO
RY
REPO
SITO
RY
BusinessRequirements
DataArchitecture
ApplicationArchitecture
TechnicalArchitecture
BusinessArchitecture

1313
MergerS aNd aCquiSitiONS – a MOdeL apprOaChBy using models as a way to gather the inventory of assets pre-merger, and using modeling techniques to develop
implementation independent, more “pure”, abstract views of those assets, you can start comparing apples to apples. Allowing you to get a clear picture of what you have, and how you can start to reduce redundancy, integrate operations and consolidate services. Models are visualizations to streamline communication between stakeholders and reach decision consensus faster, while also providing the best interface to manage and manipulate the core knowledge about your enterprise architecture. The most effective modeling tools will be ones that not just define and describe the inventory assets within themselves, but also naturally and automatically capture the dependencies between subject matters and domains. Capturing where data is used in a process, and by what service provider, for what business functions and on what hardware is far more valuable than understanding the details of the data asset when making change decisions. Implementing change decisions will require those details, so having both breath and depth of knowledge, interconnected within a common repository will be critical to success.
The ideal tools will integrate to a common repository, and manage that repository effectively so all those involved in the definition and management of models are working off a common framework, feeding the metadata warehouse in the most complete and accurate way possible, without any special manual intervention. This provides the ideal facility to generate reports to provide the analysis needed to build the integration and consolidation plan, and roll out that plan efficiently with minimized time, cost and risk.
SyBaSe pOwerdeSigNer FOr MergerS aNd aCquiSitiONSToday, only one tool provides the coverage needed to both understand all aspects of the existing detailed
infrastructure through reverse engineering and be able to automatically derive the abstraction levels needed to understand these elements in a single integrated environment, and that is Sybase PowerDesigner. Sybase PowerDesigner is the only modeling and metadata management tool that supports Enterprise Architecture implementation from business goals through implementation using unique Link and Synch technology; thus removing the silos, increasing business & IT alignment and enabling rapid response to technological, regulatory & competitive changes. No matter what the newly merged organizations have for documentation or how their models are formatted using unique Link and Synch technology, PowerDesigner automatically and intuitively captures the intersections between all architectural layers and perspectives of the Enterprise, allowing users from all groups to clearly visualize and effectively implement fast, reliable & predictable change: creating a smooth transition from the “AS-IS” state to the consolidated “TO-BE” state. In particular, with unplanned mergers and acquisitions, where no plan is present, PowerDesigner streamlines the inventory and integration tasks to arrive at actionable metadata in record time, ensuring a faster, safer, more predictable and reliable integration plan.
SuMMaryAs we have discussed throughout this paper there are considerable challenges when faced with a merger or
acquisition, and with those challenges comes considerable risk. In IT planning, the knowledge you need to be successful comes from the information about your architecture itself, the business, information, application and technology architectures and how they are related. The more “unplanned” the merger or acquisition, the more chaos will be encountered, as there will have been no real investigation on how to integrate the business and IT architectures between the newly joined organizations.
Having the right information available to the right people at the right time has greatly facilitated the entire post merger and acquisition integration activities at many companies worldwide. This is achieved through effective standardized use of an integrated modeling and metadata management toolset—Sybase PowerDesigner.

www.sybase.com
Sybase, Inc. Worldwide HeadquartersOne Sybase DriveDublin, CA 94568-7902U.S.A1 800 8 sybase
Copyright © 2009 Sybase, Inc. All rights reserved. Unpublished rights reserved under U.S. copyright laws. Sybase, the Sybase logo, and PowerDesigner are trademarks of Sybase, Inc. or its subsidiaries. All other trademarks are the property of their respective owners. ® indicates registration in the United States. Specifications are subject to change without notice. 04/09 L03182