mergermarket m&a trend report: 2013 title - pwc.es · the tmt sector was the backbone for...
TRANSCRIPT

Mergermarket 2013 Trend Report 1 www.mergermarket.com
Title
Total M&A value and volumeQuarterly M&A growth comparison
Mergermarket M&A Trend Report: 2013
Mergermarket 2013 Trend Report 1 www.mergermarket.com
Published 3rd January 2014
Including League Tables of Financial Advisors
Mergermarket 2013 Trend Report 2 www.mergermarket.com
Contents
Global overview
Global financial advisor league tables
Global private equity: Buyouts overview, top deals and league tables
Global private equity: Exits overview, top deals and league tables
Global deal size and Mid-market analysis
Global consideration and Multiples & premiums analysis
Press contacts:
EMEA: Flora Wilke T: +44 207 010 6348
Americas: Chrissy Carney T: +1 646 378 3118
Asia-Pacific: Jessica Chan T: +852 2158 9706
Deal submission contacts:
EMEA: Nancy Honsinger T: +44 207 010 6227
CEE: Zaynab Dost T: +44 207010 6129
Americas: Raquel Mozzer T: +1 212 574 7866
Asia-Pacific: Miran Lim Tel: +852 2158 9709
Japan: Sophie Kim T: +81 3 3597 2055
Europe: OverviewEurope: Financial advisor league tables
US: OverviewUS: Financial advisor league tables
Asia-Pacific (excl. Japan): OverviewAsia-Pacific (excl. Japan): Financial advisor league tables
Japan: OverviewJapan: Financial Financial advisor league tables
Emerging Markets: Overview
CriteriaWhat Mergermarket can do for you
Africa & Middle East: OverviewAfrica & Middle East: Financial advisor league tables
To sign up for other Mergermarket trend reports and league tables please click here
Mergermarket 2013 Trend Report 3 www.mergermarket.com
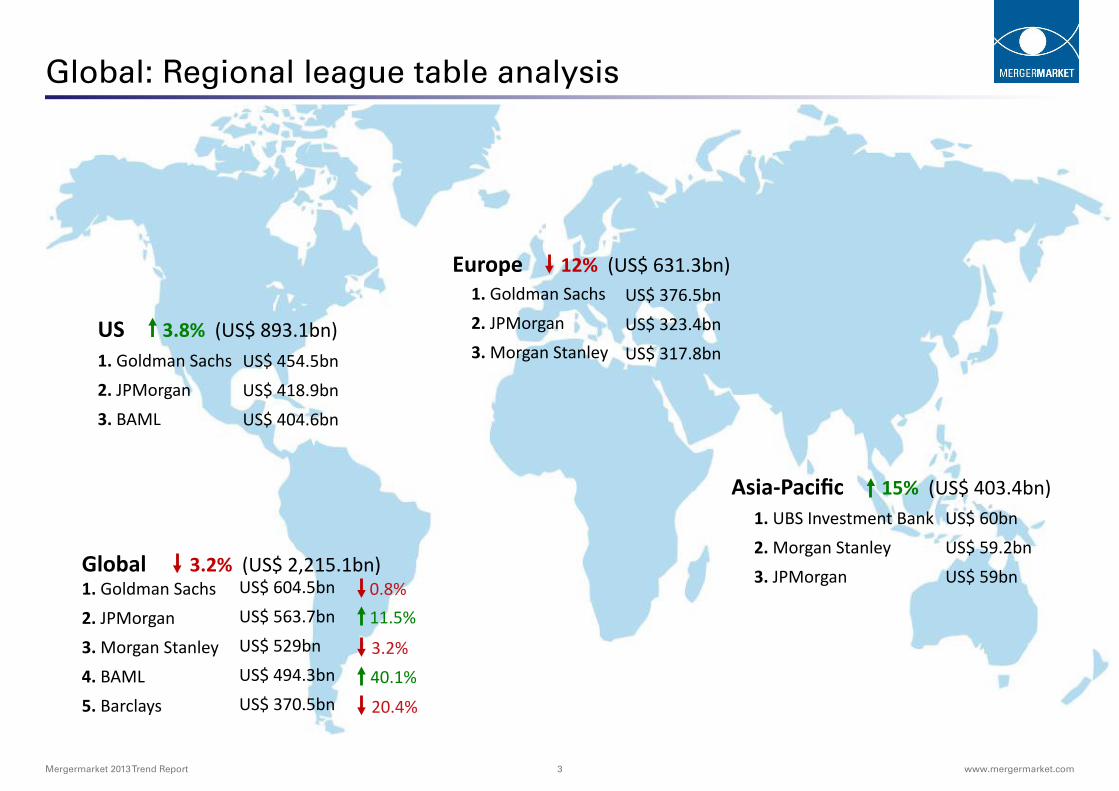
Global: Regional league table analysis
1. Goldman Sachs2. JPMorgan3. Morgan Stanley4. BAML5. Barclays
US$ 604.5bnUS$ 563.7bnUS$ 529bnUS$ 494.3bnUS$ 370.5bn
0.8%11.5%
3.2%40.1%
20.4%
1. Goldman Sachs 2. JPMorgan 3. BAML
US 3.8% (US$ 893.1bn)US$ 454.5bnUS$ 418.9bnUS$ 404.6bn
1. Goldman Sachs 2. JPMorgan 3. Morgan Stanley
Europe 12% (US$ 631.3bn)US$ 376.5bnUS$ 323.4bnUS$ 317.8bn
1. UBS Investment Bank2. Morgan Stanley 3. JPMorgan
Asia-Pacific 15% (US$ 403.4bn)US$ 60bnUS$ 59.2bnUS$ 59bnGlobal 3.2% (US$ 2,215.1bn)

Mergermarket 2013 Trend Report 4 www.mergermarket.com
Total M&A value and volumeQuarterly M&A growth comparison
Global: Overview of 2013 • After Q4 halted a third quarterly increase during 2013, global M&A valued at US$ 2,215.1bn was down 3.2% from 2012 (US$ 2,288.8bn)
• Goldman Sachs retained the leading position since 2009 with deals valued at US$ 604.5bn and ranked first in the US and Europe
3,668.7
2,408.2
1,710.5
2,089.6
2,251.2 2,288.8 2,215.1
810.1
591.6
419.2 459.4
613.3
460.5 448.0
1,276.7
677.2
396.0 429.2
580.9
560.5 542.9
849
681.7
326.3
492.6
587.7
516.9 653.7
732.9
457.7
569.0
708.4
469.3 750.9 570.5
0
500
1,000
1,500
2,000
2,500
3,000
3,500
4,000
2007 2008 2009 2010 2011 2012 2013
Valu
e of
Dea
ls (U
S$bn
)
Annual M&A Value Q4 M&A value Q3 M&A value Q2 M&A Value Q1 M&A Value
0
2,000
4,000
6,000
8,000
10,000
12,000
14,000
16,000
18,000
0
500
1,000
1,500
2,000
2,500
3,000
3,500
4,000
2007 2008 2009 2010 2011 2012 2013
Valu
e of
Dea
ls (U
S$bn
)
European M&A US M&A Asia-Pacific (excl. Japan M&A) RoW M&A Number of Deals
Num
ber o
f Dea
ls
• M&A confidence was building every quarter throughout 2013 and climaxed in September, when total deal values surpassed 2012’s like-for-like period for the first time. But Q4’s 12.7% drop to US$ 570.5bn-worth of deals from Q3 (US$ 653.7bn) slashed hopes for an uptick rather than another flat year
• This year will end as the third static year for deal value, down 3.2% at US$ 2,215.1bn compared to US$ 2,288.8bn in 2012. 2013 has been the slowest year since 2010 (US$ 2,089.6bn). Mega-deals totalling US$ 397.9bn, Verizon’s US$ 124.1bn deal value, a US recovery and the lowest number of lapsed bids on record, have failed to spur on significant growth
• Despite the lackluster Q4, H2’s deals valued at US$ 1,224.2bn overtook H1 (US$ 990.8bn) by 23.6% after a pre-Christmas dash to announce deals
• The 105 lapsed deals in 2013 was the lowest level on Mergermarket record (since 2001). The US$ 22.7bn bid for KPN by Americal Movil in 2013 was the fifth largest lapsed bid since 2009 and the highest valued in 2013 and yet the total value of lapsed deals in 2013 (US$ 83.9bn) was the lowest in over a decade (2002 valued at US$ 79.7bn)

Mergermarket 2013 Trend Report 5 www.mergermarket.com
• Cross-border deal value increased every quarter during 2013 with Q4 peaking at US$ 229.8bn, up 12.6% from Q3 (US$ 204.1bn). As a result, the share of cross-border deals to global M&A in Q4 increased to 40.3%, up from the 35.5% in Q4 2012 (US$ 266.5bn)
• Despite the quarterly increases, the total value of cross-border deals through 2013 was down 11.5% with deals valued at US$ 774.4bn compared to 2012’s cross-border deals valued at US$ 875.2bn
• Europe continued to take the majority share of all cross-border deals with US$ 338.6bn-worth of transactions having a 43.7% share compared to deals valued at US$ 359.4bn in 2012 taking a 41.1% share. Asia-Pacific also increased its share to global cross-border M&A with US$ 136.1bn-worth of deals taking a 17.6% share compared to US$ 135.5bn-worth of cross-border deals having a 15.5% share in 2012
• Stressing the preference for US domestic M&A was the 26.3% decline by value for cross-border deals involving North American targets in 2013 (US$ 192.8bn) compared to 2012 (US$ 261.6bn). Attention on Central and South American targets dropped 34.7% to US$ 48.5bn compared to US$ 74.3bn in 2012
Global: Industry and Cross-border analysis
0
2,000
4,000
6,000
8,000
10,000
12,000
14,000
16,000
18,000
0
500
1,000
1,500
2,000
2,500
3,000
3,500
4,000
2004 2005 2006 2007 2008 2009 2010 2011 2012 2013
Num
ber o
f Dea
ls
Valu
e of
Dea
ls (U
S$bn
)
Global M&A Value
Cross-Border Value
Global Number of Deals
Cross-Border Number of Deals
• The TMT sector was the backbone for large-cap M&A throughout 2013 and saw deals valued at US$ 510.1bn, up 54.1% compared to 2012 (US$ 331.1bn). As a result the share it had to global M&A increased to 23% from just 14.5% last year
• Technology M&A during 2013 saw its highest value in six years at US$ 166.2bn (2007 valued at US$ 164.8bn). Media M&A saw deals valued at US$ 92.1bn, marking the third annual increase in value. Telecommunications M&A in 2013 reached the highest value in seven years (2006 valued at US$ 265.8bn) with deals valued at US$ 245bn
• The Financial Services sector, confronted with the ongoing prospect for regulatory chang-es, has declined every year since 2007, ending 2013 with deals valued at US$ 231.1bn. The sector saw the second highest decline compared to its peak year, down 60.3% compared to 2007 (US$ 582.8bn). The only other decline larger than this was in Leisure M&A which decreased 72.9% from its peak in 2006 (US$ 130.5bn) to US$ 35.4bn in 2013
4.3%
12.0%
25.4%
12.4%
12.6%
1.9%
7.9%
3.9%
14.5%
2.5% 2.7%
4.3%
10.9%
19.3%
10.4%
10.0% 1.6%
8.0%
6.2%
23.0%
2.9% 3.3%
Business Services: US$ 95.1bn (US$ 99.5bn)
Consumer: US$ 242.4bn (US$ 273.5bn)
Energy, Mining & Utilities: US$ 427bn (US$ 580.7bn)
Financial Services: US$ 231.1bn (US$ 282.8bn)
Industrials & Chemicals: US$ 222.4bn (US$ 289.3bn)
Leisure: US$ 35.4bn (US$ 42.4bn)
Pharma, Medical & Biotech: US$ 178bn (US$ 180.8bn)
Real Estate: US$ 136.8bn (US$ 90bn)
TMT: US$ 510.1bn (US$ 331.1bn)
Transport: US$ 64.3bn (US$ 56.8bn)
Other: US$ 72.6bn (US$ 61.8bn)
2012
2013
Global cross-border analysis2013 vs. (2012) value and market share comparison
Mergermarket 2013 Trend Report 6 www.mergermarket.com
Total M&A value and volumeQuarterly M&A growth comparison
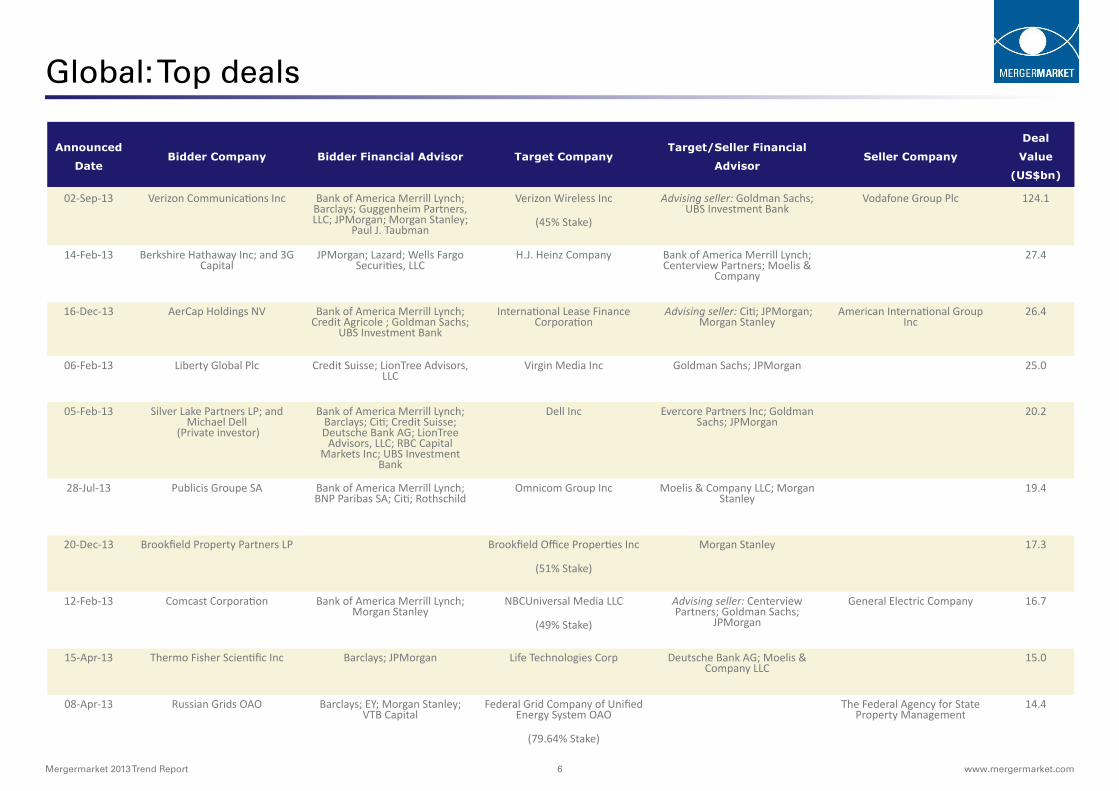
Global: Top deals
Announced
DateBidder Company Bidder Financial Advisor Target Company
Target/Seller Financial
AdvisorSeller Company
Deal
Value
(US$bn)
02-Sep-13 Verizon Communications Inc Bank of America Merrill Lynch; Barclays; Guggenheim Partners, LLC; JPMorgan; Morgan Stanley;
Paul J. Taubman
Verizon Wireless Inc
(45% Stake)
Advising seller: Goldman Sachs; UBS Investment Bank
Vodafone Group Plc 124.1
14-Feb-13 Berkshire Hathaway Inc; and 3G Capital
JPMorgan; Lazard; Wells Fargo Securities, LLC
H.J. Heinz Company Bank of America Merrill Lynch; Centerview Partners; Moelis &
Company
27.4
16-Dec-13 AerCap Holdings NV Bank of America Merrill Lynch; Credit Agricole ; Goldman Sachs;
UBS Investment Bank
International Lease Finance Corporation
Advising seller: Citi; JPMorgan; Morgan Stanley
American International Group Inc
26.4
06-Feb-13 Liberty Global Plc Credit Suisse; LionTree Advisors, LLC
Virgin Media Inc Goldman Sachs; JPMorgan 25.0
05-Feb-13 Silver Lake Partners LP; and Michael Dell
(Private investor)
Bank of America Merrill Lynch; Barclays; Citi; Credit Suisse; Deutsche Bank AG; LionTree
Advisors, LLC; RBC Capital Markets Inc; UBS Investment
Bank
Dell Inc Evercore Partners Inc; Goldman Sachs; JPMorgan
20.2
28-Jul-13 Publicis Groupe SA Bank of America Merrill Lynch; BNP Paribas SA; Citi; Rothschild
Omnicom Group Inc Moelis & Company LLC; Morgan Stanley
19.4
20-Dec-13 Brookfield Property Partners LP Brookfield Office Properties Inc
(51% Stake)
Morgan Stanley 17.3
12-Feb-13 Comcast Corporation Bank of America Merrill Lynch; Morgan Stanley
NBCUniversal Media LLC
(49% Stake)
Advising seller: Centerview Partners; Goldman Sachs;
JPMorgan
General Electric Company 16.7
15-Apr-13 Thermo Fisher Scientific Inc Barclays; JPMorgan Life Technologies Corp Deutsche Bank AG; Moelis & Company LLC
15.0
08-Apr-13 Russian Grids OAO Barclays; EY; Morgan Stanley; VTB Capital
Federal Grid Company of Unified Energy System OAO
(79.64% Stake)
The Federal Agency for State Property Management
14.4
Mergermarket 2013 Trend Report 7 www.mergermarket.com
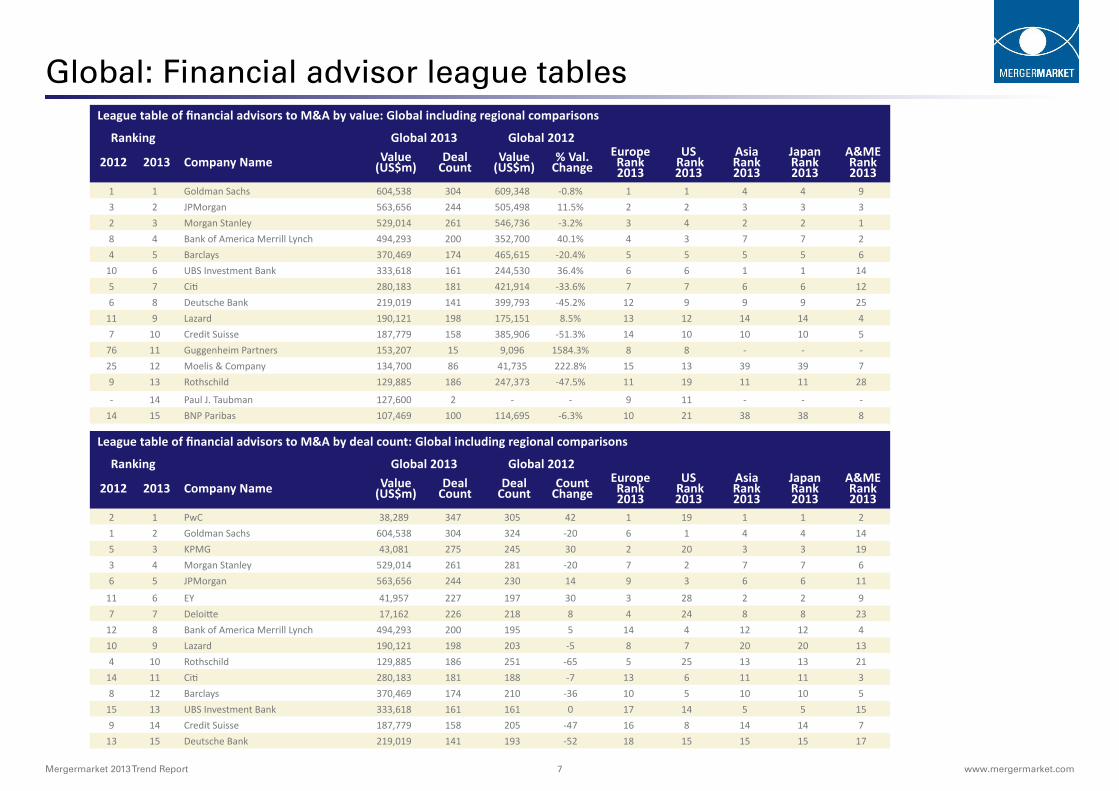
Global: Financial advisor league tablesLeague table of financial advisors to M&A by value: Global including regional comparisons
Ranking Global 2013 Global 2012
2012 2013 Company Name Value (US$m)
Deal Count
Value (US$m)
% Val. Change
Europe Rank 2013
US Rank 2013
Asia Rank 2013
Japan Rank 2013
A&ME Rank 2013
1 1 Goldman Sachs 604,538 304 609,348 -0.8% 1 1 4 4 93 2 JPMorgan 563,656 244 505,498 11.5% 2 2 3 3 32 3 Morgan Stanley 529,014 261 546,736 -3.2% 3 4 2 2 18 4 Bank of America Merrill Lynch 494,293 200 352,700 40.1% 4 3 7 7 24 5 Barclays 370,469 174 465,615 -20.4% 5 5 5 5 6
10 6 UBS Investment Bank 333,618 161 244,530 36.4% 6 6 1 1 145 7 Citi 280,183 181 421,914 -33.6% 7 7 6 6 126 8 Deutsche Bank 219,019 141 399,793 -45.2% 12 9 9 9 25
11 9 Lazard 190,121 198 175,151 8.5% 13 12 14 14 47 10 Credit Suisse 187,779 158 385,906 -51.3% 14 10 10 10 5
76 11 Guggenheim Partners 153,207 15 9,096 1584.3% 8 8 - - -25 12 Moelis & Company 134,700 86 41,735 222.8% 15 13 39 39 79 13 Rothschild 129,885 186 247,373 -47.5% 11 19 11 11 28
- 14 Paul J. Taubman 127,600 2 - - 9 11 - - -14 15 BNP Paribas 107,469 100 114,695 -6.3% 10 21 38 38 8
League table of financial advisors to M&A by deal count: Global including regional comparisons
Ranking Global 2013 Global 2012
2012 2013 Company Name Value (US$m)
Deal Count
Deal Count
Count Change
Europe Rank 2013
US Rank 2013
Asia Rank 2013
Japan Rank 2013
A&ME Rank 2013
2 1 PwC 38,289 347 305 42 1 19 1 1 21 2 Goldman Sachs 604,538 304 324 -20 6 1 4 4 145 3 KPMG 43,081 275 245 30 2 20 3 3 193 4 Morgan Stanley 529,014 261 281 -20 7 2 7 7 66 5 JPMorgan 563,656 244 230 14 9 3 6 6 11
11 6 EY 41,957 227 197 30 3 28 2 2 97 7 Deloitte 17,162 226 218 8 4 24 8 8 23
12 8 Bank of America Merrill Lynch 494,293 200 195 5 14 4 12 12 410 9 Lazard 190,121 198 203 -5 8 7 20 20 134 10 Rothschild 129,885 186 251 -65 5 25 13 13 21
14 11 Citi 280,183 181 188 -7 13 6 11 11 38 12 Barclays 370,469 174 210 -36 10 5 10 10 5
15 13 UBS Investment Bank 333,618 161 161 0 17 14 5 5 159 14 Credit Suisse 187,779 158 205 -47 16 8 14 14 7
13 15 Deutsche Bank 219,019 141 193 -52 18 15 15 15 17

Mergermarket 2013 Trend Report 8 www.mergermarket.com
Global: Private equity buyouts
• The total value of buyouts during 2013 stood at US$ 271.1bn, a modest 0.4% increase by value compared to 2012 (US$ 270.0bn). This can, in part, be credited to the US’s mega-deals in the Consumer and Technology sectors during H1 2013
• Buyout deals contributed 12.2% to global M&A activity (US$ 2.2tn), up from 11.8% in 2012 but lower than in 2011 (13.1%)
• Unable to maintain the mega-deal momentum set in H1 2013, there were no buyout deals valued above US$ 5bn in the final quarter of the year, leaving the US$ 27.4bn acqui-sition of H.J. Heinz by Berkshire Hathaway and 3G Capital Partners as the highest valued deal of 2013
0%
10%
20%
30%
40%
50%
60%
70%
80%
0
1
2
3
4
5
6
7
2004 2005 2006 2007 2008 2009 2010 2011 2012 2013
Deb
t/T
ota
l Fu
nd
ing
(%
)
Debt/EBITDA (x)
Debt-to-total funding
Deb
t/E
BIT
DA
Mu
ltip
le (x
)
Private equity buyouts - geography breakdown
• Global buyouts during 2013 (US$ 271.1bn) were flat against 2012 (US$ 270bn) after two quarterly decreases and no mega-deals during Q4 (US$ 58.8bn)
• UBS Investment Bank advised on two of the largest buyouts and topped the financial advisor rankings by value with deals worth US$ 44.8bn
Debt/EBITDA and Debt-to-total funding
• Q4 buyout activity increased in all regions compared to Q3 with Asia-Pacific (excl. Japan) witnessing the highest increase by 18% (US$ 9.8bn). The US (US$ 24.4bn) saw a mod-est increase of 3.4% (Q3 2013 valued at US$ 23.6bn) as companies held on to post-crisis record amounts of cash. The US did however remain the most active region in 2013 (US$ 132.7bn) with deal values up 2.4% from 2012 (US$ 129.6bn) and seven out of the top 10 deals involving US-based firms
• A buyers’ market in terms of debt availability was demonstrated by debt/EBITDA ratios reaching 6.2x, up from 5x in 2012. Meanwhile the average buyout leverage ratio has re-mained at the same level as in 2012 at 61.2%
0%
5%
10%
15%
20%
25%
30%
0
100
200
300
400
500
600
700
800
900
2004 2005 2006 2007 2008 2009 2010 2011 2012 2013
Valu
e of
Dea
ls (U
S$bn
)
Perc
enta
ge o
f Glo
bal M
&A
Europe US Asia-Pacific ex Japan Rest of the World Buyouts (% of Total M&A)

Mergermarket 2013 Trend Report 9 www.mergermarket.com
Global: Private equity top buyouts and league tables
Announced Date
Bidder Company Bidder Financial Advisor Target CompanyTarget/Seller Financial
AdvisorSeller Company
Deal Value (US$bn)
14-Feb-13 Berkshire Hathaway; and 3G Capital Partners
JPMorgan; Lazard; Wells Fargo Securities
H J Heinz Company Bank of America Merrill Lynch; Centerview Partners; Moelis &
Company
27.4
05-Feb-13 Silver Lake Partners LP; and Michael Dell (Private investor)
Bank of America Merrill Lynch; Barclays; Citi; Credit Suisse;
Deutsche Bank; LionTree Advisors; RBC Capital Markets;
UBS Investment Bank
Dell Inc Evercore Partners; Goldman Sachs; JPMorgan
20.2
06-May-13 Bain Capital LLC; GIC Special Investments Pte Ltd; Golden
Gate Capital; and Insight Venture Partners
Barclays; Credit Suisse; Qatalyst Group; RBC Capital Markets
BMC Software Inc Bank of America Merrill Lynch; Moelis & Company; Morgan
Stanley
6.5
09-Sep-13 Canada Pension Plan Investment Board; and Ares Management
LLC
Deutsche Bank; RBC Capital Markets
Neiman Marcus Group Inc Credit Suisse TPG Capital LP; Warburg Pincus LLC; and Leonard Green &
Partners LP
6.0
12-Apr-13 NSW Ports Consortium Lazard; UBS Investment Bank Port Botany Advising seller: Morgan Stanley Government of New South Wales
4.5
Rank HouseValue
(US$m)Deal
Count
1 The Carlyle Group 3,068 25
2 Kohlberg Kravis Roberts & Co 14,850 24
3 TPG Capital 3,569 19
4 Bain Capital 10,526 16
5 Blackstone Group 4,884 16
Top five most active firms for number of buyouts

Mergermarket 2013 Trend Report 10 www.mergermarket.com
Global: Financial advisor league tables to buyoutsLeague Table of financial advisors to private equity buyouts by value: Global
Ranking 2013 2012
2012 2013 Company Name Value (US$m)
Deal Count
Value (US$m)
% Val. Change
13 1 UBS Investment Bank 44,782 24 10,028 346.6%3 2 Barclays 42,439 19 26,331 61.2%7 3 Credit Suisse 41,147 22 19,811 107.7%
26 4 Lazard 41,009 16 2,803 1,363%8 5 JPMorgan 40,926 15 16,294 151.2%4 6 RBC Capital Markets 38,258 13 24,957 53.3%1 7 Deutsche Bank 34,773 15 32,586 6.7%
10 8 Bank of America Merrill Lynch 33,781 15 12,977 160.3%29 9 Wells Fargo Securities 28,662 3 2,399 1,094.7%2 10 Citi 27,462 12 27,469 -- 11 LionTree Advisors 20,769 2 - -6 12 Morgan Stanley 14,279 21 20,483 -30.3%5 13 Goldman Sachs 13,007 23 21,513 -39.5%9 14 Jefferies 12,434 18 13,410 -7.3%
12 15 Nomura Holdings 9,482 10 10,050 -5.7%- 16 Qatalyst Group 6,535 1 - -
15 17 Rothschild 5,312 12 7,039 -24.5%49 18 Simmons & Company International 4,860 2 1,112 337.1%27 19 EY 3,939 23 2,795 40.9%19 20 PwC 3,830 22 5,397 -29%
League Table of financial advisors to private equity buyouts by deal count: Global
Ranking 2013 2012
2012 2013 Company Name Value (US$m)
Value (US$m)
Deal Count
Count Change
4 1 Deloitte 957 27 23 419 2 UBS Investment Bank 44,782 24 10 1410 3 Goldman Sachs 13,007 23 18 55 4 EY 3,939 23 22 1
11 5 Credit Suisse 41,147 22 17 51 6 PwC 3,830 22 43 -213 7 Morgan Stanley 14,279 21 25 -4
13 8 KPMG 3,419 21 15 66 9 Barclays 42,439 19 21 -2
12 10 Jefferies 12,434 18 16 224 11 Lazard 41,009 16 8 817 12 JPMorgan 40,926 15 10 52 13 Deutsche Bank 34,773 15 26 -11
14 14 Bank of America Merrill Lynch 33,781 15 14 134 15 DC Advisory 1,551 15 5 1015 16 Lincoln International 466 15 13 27 17 RBC Capital Markets 38,258 13 21 -89 18 Citi 27,462 12 18 -6
20 19 Rothschild 5,312 12 10 218 20 Nomura Holdings 9,482 10 10 0
* Based on the target geography only and the advisor advising the buy-side only
Mergermarket 2013 Trend Report 11 www.mergermarket.com
Global: Private equity exits
from US$ 378.6m in 2012
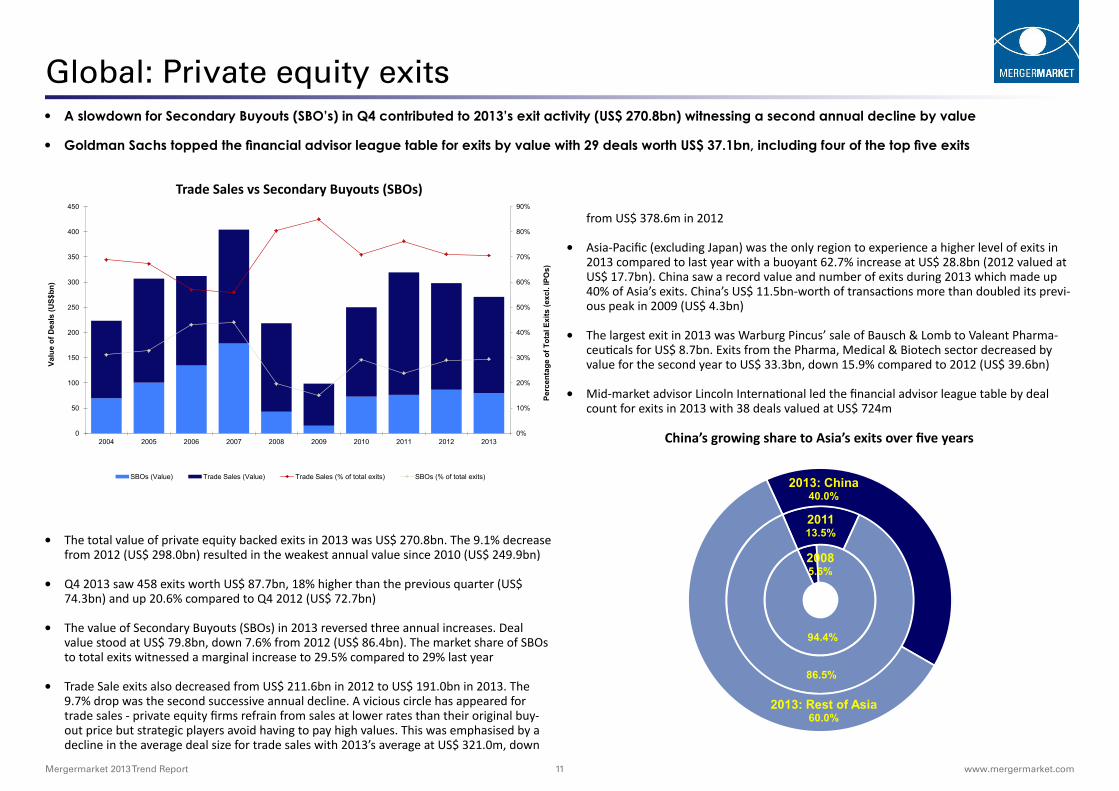
• Asia-Pacific (excluding Japan) was the only region to experience a higher level of exits in 2013 compared to last year with a buoyant 62.7% increase at US$ 28.8bn (2012 valued at US$ 17.7bn). China saw a record value and number of exits during 2013 which made up 40% of Asia’s exits. China’s US$ 11.5bn-worth of transactions more than doubled its previ-ous peak in 2009 (US$ 4.3bn)
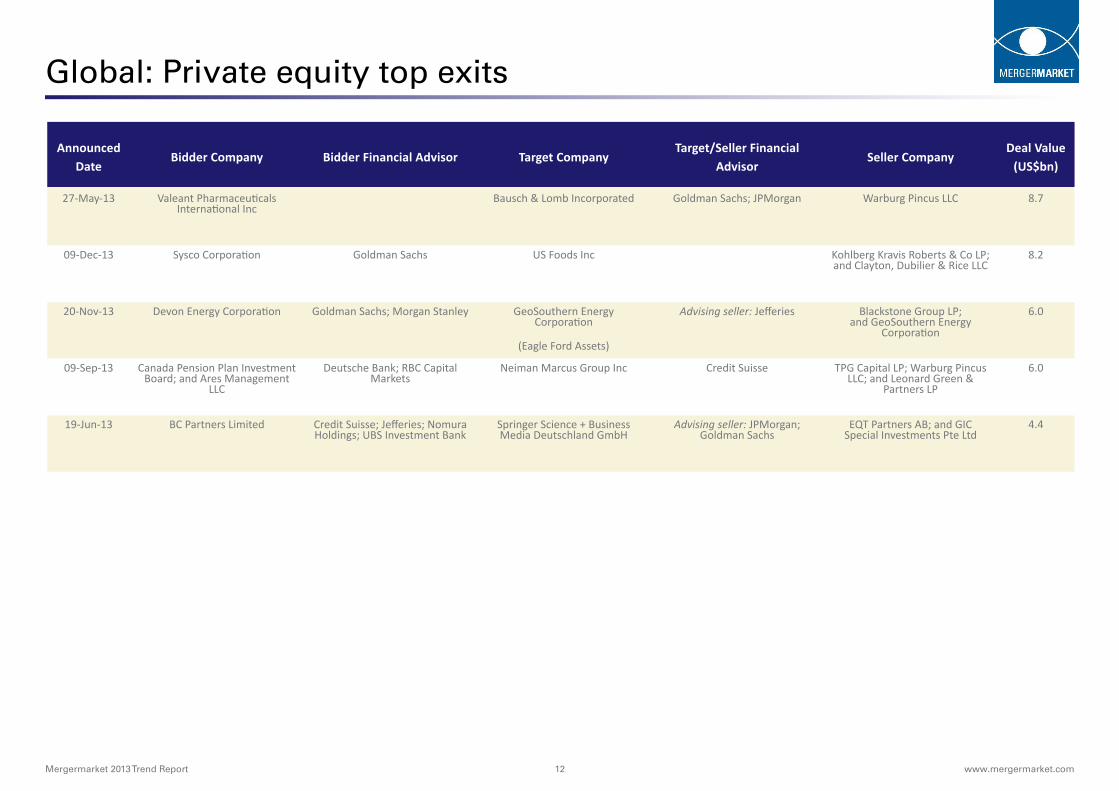
• The largest exit in 2013 was Warburg Pincus’ sale of Bausch & Lomb to Valeant Pharma-ceuticals for US$ 8.7bn. Exits from the Pharma, Medical & Biotech sector decreased by value for the second year to US$ 33.3bn, down 15.9% compared to 2012 (US$ 39.6bn)
• Mid-market advisor Lincoln International led the financial advisor league table by deal count for exits in 2013 with 38 deals valued at US$ 724m
• A slowdown for Secondary Buyouts (SBO’s) in Q4 contributed to 2013’s exit activity (US$ 270.8bn) witnessing a second annual decline by value
• Goldman Sachs topped the financial advisor league table for exits by value with 29 deals worth US$ 37.1bn, including four of the top five exits
• The total value of private equity backed exits in 2013 was US$ 270.8bn. The 9.1% decrease from 2012 (US$ 298.0bn) resulted in the weakest annual value since 2010 (US$ 249.9bn)
• Q4 2013 saw 458 exits worth US$ 87.7bn, 18% higher than the previous quarter (US$ 74.3bn) and up 20.6% compared to Q4 2012 (US$ 72.7bn)
• The value of Secondary Buyouts (SBOs) in 2013 reversed three annual increases. Deal value stood at US$ 79.8bn, down 7.6% from 2012 (US$ 86.4bn). The market share of SBOs to total exits witnessed a marginal increase to 29.5% compared to 29% last year
• Trade Sale exits also decreased from US$ 211.6bn in 2012 to US$ 191.0bn in 2013. The 9.7% drop was the second successive annual decline. A vicious circle has appeared for trade sales - private equity firms refrain from sales at lower rates than their original buy-out price but strategic players avoid having to pay high values. This was emphasised by a decline in the average deal size for trade sales with 2013’s average at US$ 321.0m, down
2008 5.6%
94.4%
2011 13.5%
86.5%
2013: China 40.0%
2013: Rest of Asia 60.0%
Trade Sales vs Secondary Buyouts (SBOs)
China’s growing share to Asia’s exits over five years0%
10%
20%
30%
40%
50%
60%
70%
80%
90%
0
50
100
150
200
250
300
350
400
450
2004 2005 2006 2007 2008 2009 2010 2011 2012 2013
Perc
enta
ge o
f Tot
al E
xits
(exc
l. IP
Os)
Valu
e of
Dea
ls (U
S$bn
)
SBOs (Value) Trade Sales (Value) Trade Sales (% of total exits) SBOs (% of total exits)
Mergermarket 2013 Trend Report 12 www.mergermarket.com
Global: Private equity top exits
Announced Date
Bidder Company Bidder Financial Advisor Target CompanyTarget/Seller Financial
AdvisorSeller Company
Deal Value (US$bn)
27-May-13 Valeant Pharmaceuticals International Inc
Bausch & Lomb Incorporated Goldman Sachs; JPMorgan Warburg Pincus LLC 8.7
09-Dec-13 Sysco Corporation Goldman Sachs US Foods Inc Kohlberg Kravis Roberts & Co LP; and Clayton, Dubilier & Rice LLC
8.2
20-Nov-13 Devon Energy Corporation Goldman Sachs; Morgan Stanley GeoSouthern Energy Corporation
(Eagle Ford Assets)
Advising seller: Jefferies Blackstone Group LP; and GeoSouthern Energy
Corporation
6.0
09-Sep-13 Canada Pension Plan Investment Board; and Ares Management
LLC
Deutsche Bank; RBC Capital Markets
Neiman Marcus Group Inc Credit Suisse TPG Capital LP; Warburg Pincus LLC; and Leonard Green &
Partners LP
6.0
19-Jun-13 BC Partners Limited Credit Suisse; Jefferies; Nomura Holdings; UBS Investment Bank
Springer Science + Business Media Deutschland GmbH
Advising seller: JPMorgan; Goldman Sachs
EQT Partners AB; and GIC Special Investments Pte Ltd
4.4

Mergermarket 2013 Trend Report 13 www.mergermarket.com
Average deal size and Mid-market analysis • Q4’s three mega-deals (US$ 54.5bn) resulted in the lowest value for mega-deals since Q4 2011 (US$ 47.8bn), and a 4.2% decline in 2013’s average deal size
• The 27.1% share of mid-market M&A towards global M&A was the third highest percentage for any year on Mergermarket record (since 2001)
• In 2013, mid-market M&A totaled US$ 606.3bn, representing a 3.3% decrease compared to 2012 (US$ 626.9bn)
• Fluctuating mid-market M&A value per quarter was evident even throughout the credit crisis. One constant since Q3 2009 however, is the share of global M&A which has remained above 20%. Q4’s total value (US$ 186.2bn) represents the second highest share in any quarter on Mergermarket record (since 2001) with 32.6% of global M&A, up from 24.5% in Q3 (US$ 160.4bn)
• Asia-Pacific (exc. Japan) was the only region to see an increase in 2013 with US$ 141.9bn-worth of deals, up 42.9% compared to last year (US$ 99.3bn). Mid-market M&A in Europe saw each quarter valued around US$ 40bn until Q4’s US$ 47.6bn - the year has finished with a total value of US$ 167.6bn - a 7.1% decrease compared to 2012 (US$ 180.4bn). In the US, investors shied away from mid-cap deals in 2013 (US$ 210.1bn), down 11.6% compared to 2012 (US$ 237.6bn)
• The global average deal size during 2013 reversed two annual increases, down 4.2% to US$ 311.5m compared to the 2012 average of U$ 325.1m
• With three mega-deals (above US$ 10bn) announced in Q4, the quarter’s average deal size declined 18.4% to US$ 293.2m from US$ 359.5m in Q3
• Asia-Pacific (excl. Japan) witnessed its only mega-deal in Q4 but saw the fourth consecu-tive quarterly increase in average deal size in the region. At US$ 211.9m, Q4 was up 6.3% compared to Q3 (US$ 199.3m). Along with this growth pattern, 2013’s total average of US$ 192.9m was up 2% compared to last year’s average of US$ 189.1m
• A 71.4% (US$ 284.2bn) share of the total value of mega-deals in 2013 (US$ 397.9bn) came from ten deals (US$ 284.2bn) targeting US companies. As a result, the US achieved its highest average deal size on Mergermarket record (since 2001) at US$ 526.6m, up 1.9% from the previous high in 2009 (US$ 516.7m)
173.5 227.0
265.5
327.5
192.8
97.8
186.7 210.3 180.4 167.6
165.8
178.6
230.8
283.1
123.0
86.5
194.1 165.3 237.6
210.1 30.9
62.2
80.8
104.8
70.9
96.1
100.3 111.3 99.3 141.9
42.8
67.2
104.8
127.2
80.2
69.7
92.1 103.1 109.6
86.7
0%
5%
10%
15%
20%
25%
30%
0
100
200
300
400
500
600
700
800
900
2004 2005 2006 2007 2008 2009 2010 2011 2012 2013
% o
f Glo
bal M
&A
Valu
e of
Dea
ls (U
S$bn
)
% of Global M&A Europe US Asia-Pacific (exc. Japan) Rest of the World
Mid-market analysis (US$ 501m - US$ 2bn) Quarterly average deal size breakdown
321.2 266.4
382.1 302.4
357.4 288.2 282.6
466.5
301.6
299.3
248.3 295.2
304.9 308.1
333.6
360.3 228.4 286.9
338.0 313.1
359.5
277.3
339.5 332.3 360.5
265.4 384.5 293.2
0
200
400
600
800
1,000
1,200
1,400
1,600
2007 2008 2009 2010 2011 2012 2013
Valu
e (U
S$m
)
Q1 Q2 Q3 Q4
351.2
312.5 307.6 301.5 313.2 325.1 311.5

Mergermarket 2013 Trend Report 14 www.mergermarket.com
Consideration and Multiples & premiums analysis
• The global average EBITDA multiple fell for the third year down to 12.9x, the lowest since 2003 (10.6x) and down from 13.3x in 2012
• North America was the only region to see an increased average EBITDA multiple. North America finished the year at 12.6x, an increase following 2012’s dip to 12.1x as large-cap deals returned to the fore
• The TMT sector was one of the dominant industries in 2013 and as a result commanded one of the highest average EBITDA multiples at 15.1x, up from 13.2x in 2012. Average premiums in this sector rose slightly to 34% compared to 33.1% in 2012
• Equity-only consideration increasingly used for cross-border transactions in 2013 (US$ 49.1bn), up 101.7% compared to 2012 (US$ 24.3bn)
• The global average EBIDTA Exit multiple (12.9x) and premium percentage (19.2%) decreased for the third year in a row
0
5
10
15
20
25
30
2004 2005 2006 2007 2008 2009 2010 2011 2012 2013
EBIT
DA
Mul
tiple
(x) -
Ave
rage
Global Europe North America Asia-Pacific (excl. Japan) Japan
Multiples & Premiums Consideration value-market share breakdown for cross-border deals since 2009
• The value of cross-border deals paid for with some form of equity increased during 2013: US$ 49.1bn-worth of cross-border deals were funded by equity-only, an increase of 101.7% from 2012 (US$ 24.3bn)
• At 15%, the share of cross-border deals with a consideration mix of both cash and equity hit the highest level since 2007 (16.3%). The year saw US$ 93.7bn-worth of cross-border deals funded this way, up 86.5% compared to 2012 (US$ 50.3bn)
• However, global M&A deals with an equity-only consideration declined for a second year to US$ 241.9bn, down 21.6% from 2012 (US$ 308.5bn). Additionally, as a percentage of global M&A funding, deals paid for with equity constituted a mere 14.8% - marking a fifth consecutive drop and the lowest on Mergermarket record (2001)
• Until the final quarter of 2013, cash was very much the consideration of choice for investors looking to snap up US companies. Cash only deals witnessed consecutive value increases through the first three quarters, before taking a dip in Q4 to US$ 107.7bn - a 5.2% decline compared to Q3 (US$ 113.6bn). Meanwhile, deals funded by a mix of cash and equity were up 135.9% to US$ 71.3bn in Q4 compared to US$ 30.2bn in Q3
Regional EBITDA multilpe analysis
9.4%
2009 84.6%
6%
10.7%
2010 68.2%
9.1%
8.7%
2011 69.5%
6.4%
6.9%
2012 72.7%
3.3% 15.0%
2013 70.1%
7.8%
Cash & Equity Only Cash only Equity only
Mergermarket 2013 Trend Report 15 www.mergermarket.com
Total M&A value and volumeQuarterly M&A growth comparison
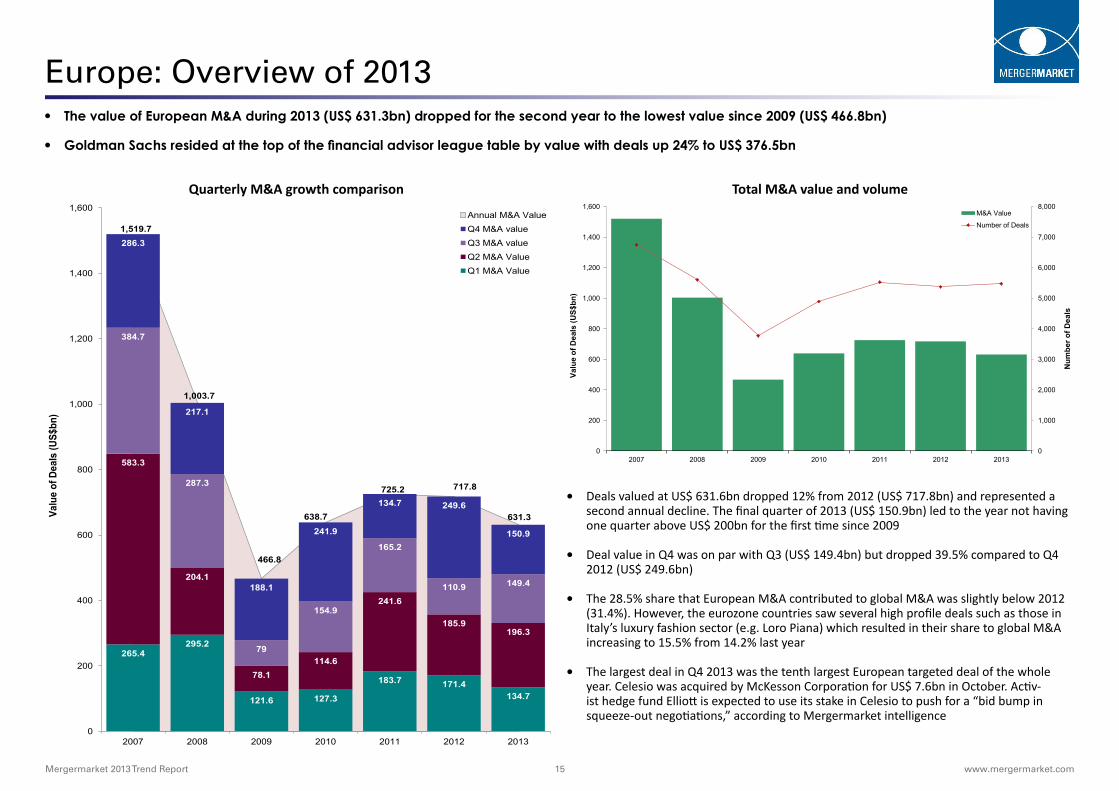
Europe: Overview of 2013 • The value of European M&A during 2013 (US$ 631.3bn) dropped for the second year to the lowest value since 2009 (US$ 466.8bn)
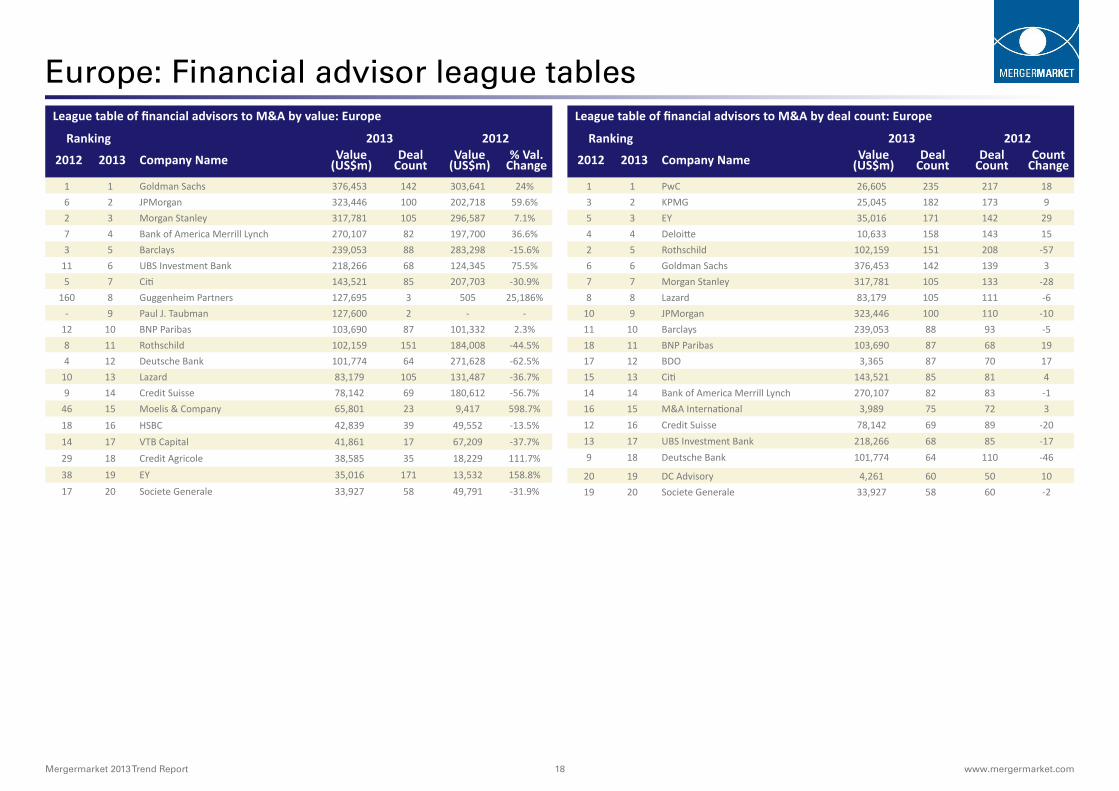
• Goldman Sachs resided at the top of the financial advisor league table by value with deals up 24% to US$ 376.5bn
1,519.7
1,003.7
466.8
638.7
725.2 717.8
631.3
265.4 295.2
121.6 127.3
183.7 171.4 134.7
583.3
204.1
78.1 114.6
241.6
185.9 196.3
384.7
287.3
79
154.9
165.2
110.9 149.4
286.3
217.1
188.1
241.9
134.7 249.6
150.9
0
200
400
600
800
1,000
1,200
1,400
1,600
2007 2008 2009 2010 2011 2012 2013
Valu
e of
Dea
ls (U
S$bn
)
Annual M&A Value Q4 M&A value Q3 M&A value Q2 M&A Value Q1 M&A Value
0
1,000
2,000
3,000
4,000
5,000
6,000
7,000
8,000
0
200
400
600
800
1,000
1,200
1,400
1,600
2007 2008 2009 2010 2011 2012 2013
Valu
e of
Dea
ls (U
S$bn
)
M&A Value
Number of Deals
Num
ber o
f Dea
ls
• Deals valued at US$ 631.6bn dropped 12% from 2012 (US$ 717.8bn) and represented a second annual decline. The final quarter of 2013 (US$ 150.9bn) led to the year not having one quarter above US$ 200bn for the first time since 2009
• Deal value in Q4 was on par with Q3 (US$ 149.4bn) but dropped 39.5% compared to Q4 2012 (US$ 249.6bn)
• The 28.5% share that European M&A contributed to global M&A was slightly below 2012 (31.4%). However, the eurozone countries saw several high profile deals such as those in Italy’s luxury fashion sector (e.g. Loro Piana) which resulted in their share to global M&A increasing to 15.5% from 14.2% last year
• The largest deal in Q4 2013 was the tenth largest European targeted deal of the whole year. Celesio was acquired by McKesson Corporation for US$ 7.6bn in October. Activ-ist hedge fund Elliott is expected to use its stake in Celesio to push for a “bid bump in squeeze-out negotiations,” according to Mergermarket intelligence

Mergermarket 2013 Trend Report 16 www.mergermarket.com
Europe: Industry and Cross-border analysis
• Inbound and outbound activity rebounded in Q3 from a lull in Q2 and Q4 continued the upward trajectory. Inbound deals valued at US$ 48.8bn in Q4 increased 8.2% from Q3 (US$ 45.1bn). The overall deal value though was down 15.4% from 2012 (US$ 218.4bn) at US$ 184.7bn. Inbound deal value for 2013 was the lowest value since 2010 (US$ 136.2bn)
• North American companies with the firepower to target large-cap deals remain loyal investors in Europe. The 68.7% share of all inbound deals from North America during 2013 came from deals valued at US$ 127bn, down 10.9% from the US$ 127.1bn in 2012 but with an increased share compared to 65.3% in 2012
• Succumbed by a continued eurozone crisis that still holds back deal making opportunities, 2013’s outbound deal value fell 17.5% to US$ 142.7bn compared to 2012 (US$ 173.1bn). It was the lowest value since 2009 (US$ 122bn). However, Q4’s deal value leapt 75.2% compared to Q4 2012 (US$ 36.5bn) and 73% compared to Q3 2013 (US$ 37bn)
• Every region except from Asia-Pacific (excl. Japan) aimed for European targets less in 2013 than in 2012. But for Asia-Pacific (excl. Japan), deal value increased 14.8% to US$ 25.6bn compared to US$ 22.3bn in 2012
0
200
400
600
800
1,000
1,200
0
100
200
300
400
500
600
700
2004 2005 2006 2007 2008 2009 2010 2011 2012 2013
Num
ber o
f Dea
ls
Valu
e of
Dea
ls (U
S$bn
)
Outbound M&A Value
Inbound M&A Value
Inbound Number of Deals
Outbound Number of Deals
• During 2013, four out of 11 sectors increased their values compared to 2012. TMT had the largest increase at 97% with deals valued at US$ 132.2bn versus US$ 67.1bn last year. The 20.9% market share the sector had during 2013 drastically increased compared to last year’s 9.3% with the Virgin Media deal (US$ 25bn) contributing 18.9% to the value
• The two other thriving sectors were Leisure (US$ 13.8bn vs. US$ 7.4bn) and Pharma, Medical & Biotech (US$ 50.6bn vs. US$ 33.7bn), up 86.5% and 50.1%, respectively
• The Energy, Mining & Utilities (US$ 117.5bn) sector experienced the biggest decline by value out of all sectors, down 45.7%. The sector represented 18.6% of Europe’s M&A compared to 2012’s (US$ 216.5bn) 30.2% share. However, three mega-deals in 2012, including Glencore/Xstrata and two acquisitions involving TNK-BP Holdings, skewed the true representation - without these deals, 2013’s value would be down by just 1.1%
4.6%
10.6%
30.2%
15.4%
14.0%
1.0%
4.7%
3.7%
9.3%
3.7% 2.8%
4.6%
9.4%
18.6%
14.2%
11.1%
2.2%
8.0%
3.8%
20.9%
3.7% 3.4%
Business Services: US$ 29bn (US$ 32.9bn)
Consumer: US$ 59.5bn (US$ 76.4bn)
Energy, Mining & Utilities: US$ 117.5bn (US$ 216.5bn)
Financial Services: US$ 89.9bn (US$ 110.8bn)
Industrials & Chemicals: US$ 69.9bn (US$ 100.2bn)
Leisure: US$ 13.8bn (US$ 7.4bn)
Pharma, Medical & Biotech: US$ 50.6bn (US$ 33.7bn)
Real Estate: US$ 23.8bn (US$ 26.3bn)
TMT: US$ 132.2bn (US$ 67.1bn)
Transport: US$ 23.4bn (US$ 26.4bn)
Other: US$ 21.7bn (US$ 20bn)
2012
2013
European cross-border analysis2013 vs. (2012) value and market share comparison

Mergermarket 2013 Trend Report 17 www.mergermarket.com
Europe: Top deals
Announced Date
Bidder Company Bidder Financial Advisor Target CompanyTarget/Seller Financial
AdvisorSeller Company
Deal Value (US$bn)
06-Feb-13 Liberty Global Plc Credit Suisse; LionTree Advisors Virgin Media Inc Goldman Sachs; JPMorgan 25.0
08-Apr-13 Russian Grids OAO Barclays; EY; Morgan Stanley; VTB Capital
Federal Grid Company of Unified Energy System OAO
(79.64% Stake)
The Federal Agency for State Property Management
14.4
21-Jun-13 Hellenic Financial Stability Fund BNP Paribas; Moelis & Company National Bank of Greece SA
(84.4% Stake)
11.4
24-Jun-13 Vodafone Group Plc Goldman Sachs; UBS Investment Bank
Kabel Deutschland Holding AG
(76.57% Stake)
Deutsche Bank; Morgan Stanley; Perella Weinberg Partners
11.3
23-Jul-13 Telefonica Deutschland Holding AG
Bank of America Merrill Lynch; Citi; HSBC; Morgan Stanley; UBS
Investment Bank
E-Plus Mobilfunk GmbH & Co KG Advising seller: ABN AMRO Bank; Goldman Sachs; ING;
JPMorgan; KPMG; Rothschild
Koninklijke KPN NV 11.3
28-Jun-13 Hellenic Financial Stability Fund BNP Paribas; Moelis & Company Piraeus Bank SA
(81.01% Stake)
Barclays; Lazard 9.1
12-Apr-13 Joh. A. Benckiser SE Bank of America Merrill Lynch; Citi; Leonardo & Co; Morgan
Stanley; Rabobank; Rothschild
D.E Master Blenders 1753 NV
(84.95% Stake)
Goldman Sachs; JPMorgan; Lazard
8.6
20-May-13 Actavis Inc Bank of America Merrill Lynch; Greenhill & Co
Warner Chilcott Plc Deutsche Bank; Goldman Sachs 8.4
30-Apr-13 Hellenic Financial Stability Fund BNP Paribas; Moelis & Company Eurobank Ergasias SA
(98.57% Stake)
Barclays; Deutsche Bank 7.6
24-Oct-13 McKesson Corporation Goldman Sachs Celesio AG Citi; Advising seller: JPMorgan Franz Haniel & Cie GmbH 7.6
Mergermarket 2013 Trend Report 18 www.mergermarket.com
Europe: Financial advisor league tablesLeague table of financial advisors to M&A by value: Europe
Ranking 2013 2012
2012 2013 Company Name Value (US$m)
Deal Count
Value (US$m)
% Val. Change
1 1 Goldman Sachs 376,453 142 303,641 24%6 2 JPMorgan 323,446 100 202,718 59.6%2 3 Morgan Stanley 317,781 105 296,587 7.1%7 4 Bank of America Merrill Lynch 270,107 82 197,700 36.6%3 5 Barclays 239,053 88 283,298 -15.6%
11 6 UBS Investment Bank 218,266 68 124,345 75.5%5 7 Citi 143,521 85 207,703 -30.9%
160 8 Guggenheim Partners 127,695 3 505 25,186%- 9 Paul J. Taubman 127,600 2 - -
12 10 BNP Paribas 103,690 87 101,332 2.3%8 11 Rothschild 102,159 151 184,008 -44.5%4 12 Deutsche Bank 101,774 64 271,628 -62.5%
10 13 Lazard 83,179 105 131,487 -36.7%9 14 Credit Suisse 78,142 69 180,612 -56.7%
46 15 Moelis & Company 65,801 23 9,417 598.7%18 16 HSBC 42,839 39 49,552 -13.5%14 17 VTB Capital 41,861 17 67,209 -37.7%29 18 Credit Agricole 38,585 35 18,229 111.7%38 19 EY 35,016 171 13,532 158.8%17 20 Societe Generale 33,927 58 49,791 -31.9%
League table of financial advisors to M&A by deal count: Europe
Ranking 2013 2012
2012 2013 Company Name Value (US$m)
Deal Count
Deal Count
Count Change
1 1 PwC 26,605 235 217 183 2 KPMG 25,045 182 173 95 3 EY 35,016 171 142 294 4 Deloitte 10,633 158 143 152 5 Rothschild 102,159 151 208 -576 6 Goldman Sachs 376,453 142 139 37 7 Morgan Stanley 317,781 105 133 -288 8 Lazard 83,179 105 111 -6
10 9 JPMorgan 323,446 100 110 -1011 10 Barclays 239,053 88 93 -518 11 BNP Paribas 103,690 87 68 1917 12 BDO 3,365 87 70 1715 13 Citi 143,521 85 81 414 14 Bank of America Merrill Lynch 270,107 82 83 -116 15 M&A International 3,989 75 72 312 16 Credit Suisse 78,142 69 89 -2013 17 UBS Investment Bank 218,266 68 85 -179 18 Deutsche Bank 101,774 64 110 -46
20 19 DC Advisory 4,261 60 50 1019 20 Societe Generale 33,927 58 60 -2
Mergermarket 2013 Trend Report 19 www.mergermarket.com
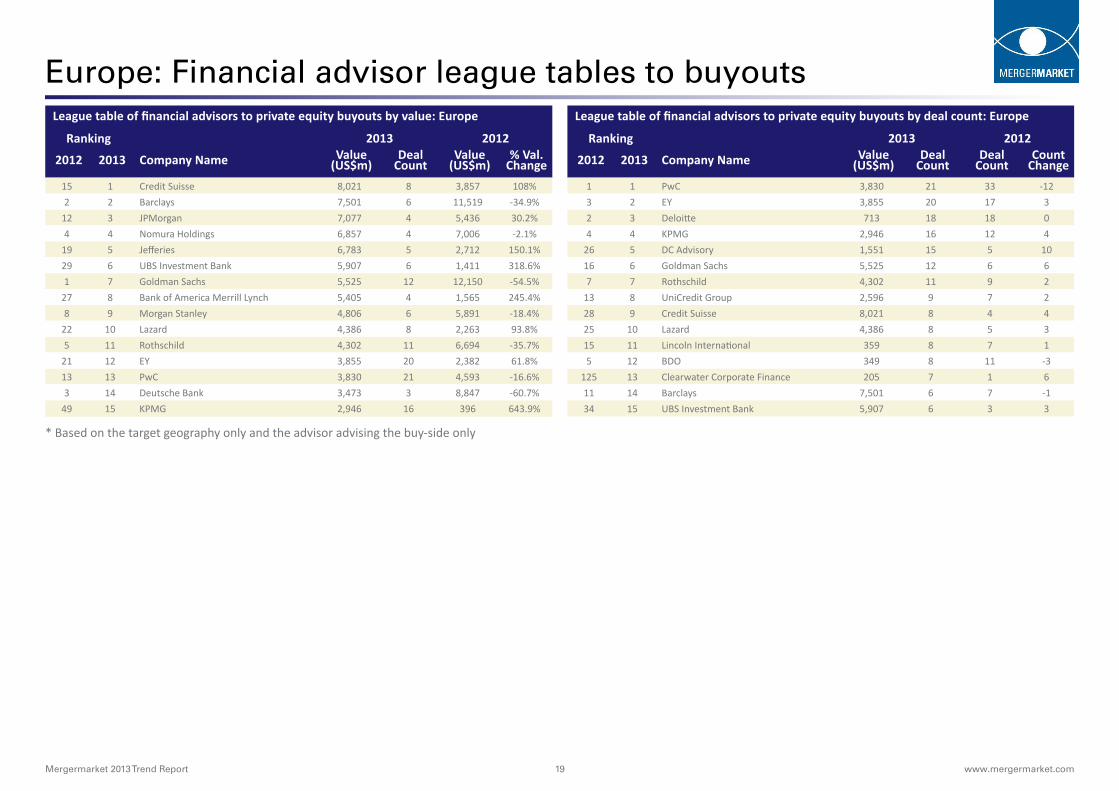
Europe: Financial advisor league tables to buyoutsLeague table of financial advisors to private equity buyouts by value: Europe
Ranking 2013 2012
2012 2013 Company Name Value (US$m)
Deal Count
Value (US$m)
% Val. Change
15 1 Credit Suisse 8,021 8 3,857 108%2 2 Barclays 7,501 6 11,519 -34.9%
12 3 JPMorgan 7,077 4 5,436 30.2%4 4 Nomura Holdings 6,857 4 7,006 -2.1%
19 5 Jefferies 6,783 5 2,712 150.1%29 6 UBS Investment Bank 5,907 6 1,411 318.6%1 7 Goldman Sachs 5,525 12 12,150 -54.5%
27 8 Bank of America Merrill Lynch 5,405 4 1,565 245.4%8 9 Morgan Stanley 4,806 6 5,891 -18.4%
22 10 Lazard 4,386 8 2,263 93.8%5 11 Rothschild 4,302 11 6,694 -35.7%
21 12 EY 3,855 20 2,382 61.8%13 13 PwC 3,830 21 4,593 -16.6%3 14 Deutsche Bank 3,473 3 8,847 -60.7%
49 15 KPMG 2,946 16 396 643.9%
League table of financial advisors to private equity buyouts by deal count: Europe
Ranking 2013 2012
2012 2013 Company Name Value (US$m)
Deal Count
Deal Count
Count Change
1 1 PwC 3,830 21 33 -123 2 EY 3,855 20 17 32 3 Deloitte 713 18 18 04 4 KPMG 2,946 16 12 4
26 5 DC Advisory 1,551 15 5 1016 6 Goldman Sachs 5,525 12 6 67 7 Rothschild 4,302 11 9 2
13 8 UniCredit Group 2,596 9 7 228 9 Credit Suisse 8,021 8 4 425 10 Lazard 4,386 8 5 315 11 Lincoln International 359 8 7 15 12 BDO 349 8 11 -3
125 13 Clearwater Corporate Finance 205 7 1 611 14 Barclays 7,501 6 7 -134 15 UBS Investment Bank 5,907 6 3 3
* Based on the target geography only and the advisor advising the buy-side only
Mergermarket 2013 Trend Report 20 www.mergermarket.com
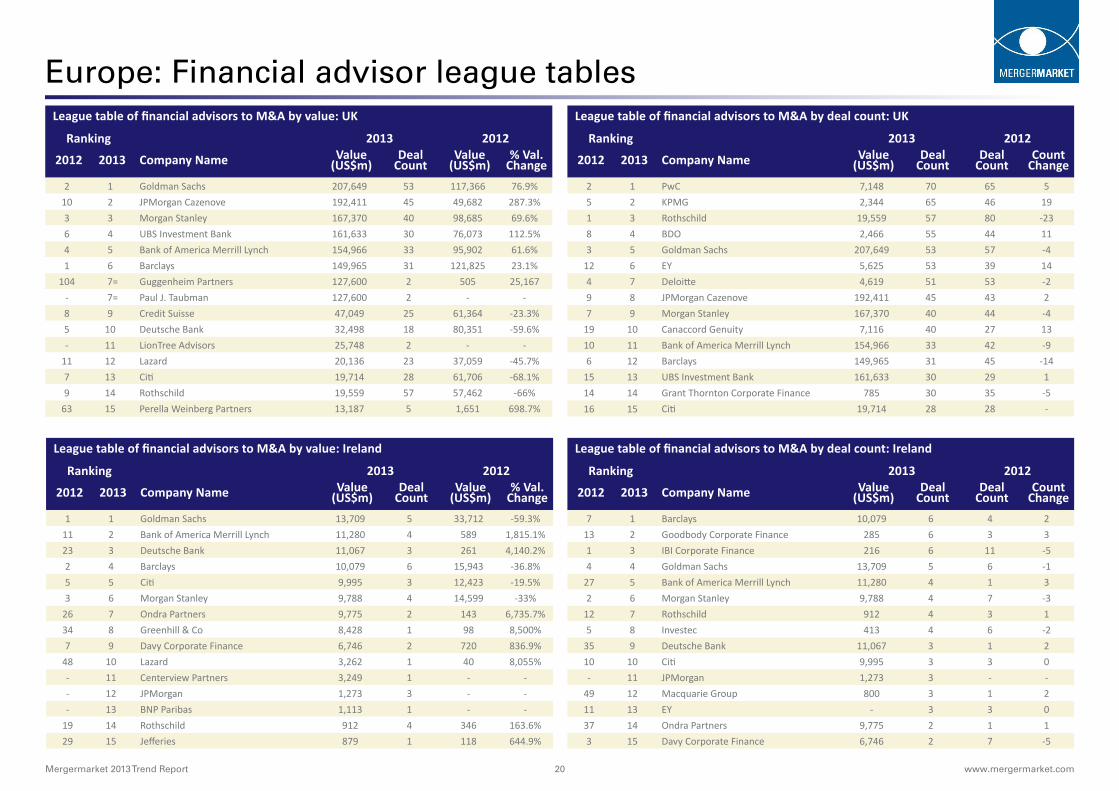
Europe: Financial advisor league tables League table of financial advisors to M&A by value: UK
Ranking 2013 2012
2012 2013 Company Name Value (US$m)
Deal Count
Value (US$m)
% Val. Change
2 1 Goldman Sachs 207,649 53 117,366 76.9%10 2 JPMorgan Cazenove 192,411 45 49,682 287.3%3 3 Morgan Stanley 167,370 40 98,685 69.6%6 4 UBS Investment Bank 161,633 30 76,073 112.5%4 5 Bank of America Merrill Lynch 154,966 33 95,902 61.6%1 6 Barclays 149,965 31 121,825 23.1%
104 7= Guggenheim Partners 127,600 2 505 25,167- 7= Paul J. Taubman 127,600 2 - -8 9 Credit Suisse 47,049 25 61,364 -23.3%5 10 Deutsche Bank 32,498 18 80,351 -59.6%- 11 LionTree Advisors 25,748 2 - -
11 12 Lazard 20,136 23 37,059 -45.7%7 13 Citi 19,714 28 61,706 -68.1%9 14 Rothschild 19,559 57 57,462 -66%
63 15 Perella Weinberg Partners 13,187 5 1,651 698.7%
League table of financial advisors to M&A by deal count: UK
Ranking 2013 2012
2012 2013 Company Name Value (US$m)
Deal Count
Deal Count
Count Change
2 1 PwC 7,148 70 65 55 2 KPMG 2,344 65 46 191 3 Rothschild 19,559 57 80 -238 4 BDO 2,466 55 44 113 5 Goldman Sachs 207,649 53 57 -4
12 6 EY 5,625 53 39 144 7 Deloitte 4,619 51 53 -29 8 JPMorgan Cazenove 192,411 45 43 27 9 Morgan Stanley 167,370 40 44 -4
19 10 Canaccord Genuity 7,116 40 27 1310 11 Bank of America Merrill Lynch 154,966 33 42 -96 12 Barclays 149,965 31 45 -14
15 13 UBS Investment Bank 161,633 30 29 114 14 Grant Thornton Corporate Finance 785 30 35 -516 15 Citi 19,714 28 28 -
League table of financial advisors to M&A by value: Ireland
Ranking 2013 2012
2012 2013 Company Name Value (US$m)
Deal Count
Value (US$m)
% Val. Change
1 1 Goldman Sachs 13,709 5 33,712 -59.3%11 2 Bank of America Merrill Lynch 11,280 4 589 1,815.1%23 3 Deutsche Bank 11,067 3 261 4,140.2%2 4 Barclays 10,079 6 15,943 -36.8%5 5 Citi 9,995 3 12,423 -19.5%3 6 Morgan Stanley 9,788 4 14,599 -33%
26 7 Ondra Partners 9,775 2 143 6,735.7%34 8 Greenhill & Co 8,428 1 98 8,500%7 9 Davy Corporate Finance 6,746 2 720 836.9%
48 10 Lazard 3,262 1 40 8,055%- 11 Centerview Partners 3,249 1 - -- 12 JPMorgan 1,273 3 - -- 13 BNP Paribas 1,113 1 - -
19 14 Rothschild 912 4 346 163.6%29 15 Jefferies 879 1 118 644.9%
League table of financial advisors to M&A by deal count: Ireland
Ranking 2013 2012
2012 2013 Company Name Value (US$m)
Deal Count
Deal Count
Count Change
7 1 Barclays 10,079 6 4 213 2 Goodbody Corporate Finance 285 6 3 31 3 IBI Corporate Finance 216 6 11 -54 4 Goldman Sachs 13,709 5 6 -1
27 5 Bank of America Merrill Lynch 11,280 4 1 32 6 Morgan Stanley 9,788 4 7 -3
12 7 Rothschild 912 4 3 15 8 Investec 413 4 6 -2
35 9 Deutsche Bank 11,067 3 1 210 10 Citi 9,995 3 3 0- 11 JPMorgan 1,273 3 - -
49 12 Macquarie Group 800 3 1 211 13 EY - 3 3 037 14 Ondra Partners 9,775 2 1 13 15 Davy Corporate Finance 6,746 2 7 -5

Mergermarket 2013 Trend Report 21 www.mergermarket.com
Europe: Financial advisor league tables League table of financial advisors to M&A by value: Germany
Ranking 2013 2012
2012 2013 Company Name Value (US$m)
Deal Count
Value (US$m)
% Val. Change
2 1 Goldman Sachs 66,134 28 41,418 59.7%3 2 Deutsche Bank 39,690 18 38,375 3.4%7 3 UBS Investment Bank 36,351 14 23,220 56.6%4 4 JPMorgan 36,029 13 36,537 -1.4%1 5 Morgan Stanley 33,778 13 46,753 -27.8%6 6 Citi 32,697 10 24,159 35.3%5 7 Rothschild 23,048 24 29,740 -22.5%
10 8 Bank of America Merrill Lynch 21,776 11 12,607 72.7%14 9 Perella Weinberg Partners 17,579 4 7,364 138.7%28 10 KPMG 16,359 31 2,710 503.7%16 11 HSBC 15,166 5 4,391 245.4%9 12 Credit Suisse 14,593 12 17,951 -18.7%
141 13 ING 11,749 4 - -68 14 ABN AMRO Bank 11,748 4 245 4,695.1%8 15 Lazard 8,834 14 19,435 -54.5%
League table of financial advisors to M&A by deal count: Germany
Ranking 2013 2012
2012 2013 Company Name Value (US$m)
Deal Count
Deal Count
Count Change
7 1 EY 7,011 45 22 231 2 KPMG 16,359 31 36 -56 3 PwC 1,286 30 23 74 4 Goldman Sachs 66,134 28 25 32 5 Rothschild 23,048 24 32 -88 6 Lincoln International 142 19 22 -35 7 Deutsche Bank 39,690 18 25 -79 8 Deloitte 818 17 21 -4
19 9 UniCredit Group 3,902 16 11 529 10 Perspektiv - 16 8 813 11 UBS Investment Bank 36,351 14 14 010 12 Lazard 8,834 14 18 -412 13 Baker Tilly Roelfs 168 14 15 -111 14 JPMorgan 36,029 13 17 -43 15 Morgan Stanley 33,778 13 26 -13
League table of financial advisors to M&A by value: Germanic
Ranking 2013 2012
2012 2013 Company Name Value (US$m)
Deal Count
Value (US$m)
% Val. Change
3 1 Goldman Sachs 80,284 39 101,724 -21.1%1 2 Morgan Stanley 48,200 20 110,093 -56.2%4 3 JPMorgan 47,379 17 89,255 -46.9%6 4 Citi 44,073 13 74,761 -41%2 5 Deutsche Bank 43,474 24 104,503 -58.4%
14 6 UBS Investment Bank 37,873 21 25,405 49.1%13 7 Bank of America Merrill Lynch 34,143 17 26,735 27.7%11 8 Rothschild 34,056 31 42,981 -20.8%12 9 Lazard 19,222 23 35,353 -45.6%21 10 Perella Weinberg Partners 17,751 5 8,911 99.2%5 11 Credit Suisse 17,350 23 82,026 -78.8%
25 12 KPMG 16,515 38 4,122 300.7%24 13 HSBC 15,166 5 4,474 239%36 14 Leonardo & Co 14,535 13 2,620 454.8%79 15 ING 11,838 7 258 4,488.4%
League table of financial advisors to M&A by deal count: Germanic
Ranking 2013 2012
2012 2013 Company Name Value (US$m)
Deal Count
Deal Count
Count Change
8 1 EY 7,976 53 32 215 2 Goldman Sachs 80,284 39 34 51 3 KPMG 16,515 38 49 -117 4 PwC 1,429 35 32 32 5 Rothschild 34,056 31 39 -84 6 Deloitte 959 28 35 -76 7 Deutsche Bank 43,474 24 33 -9
13 8 Lincoln International 292 24 23 19 9 Lazard 19,222 23 30 -7
12 10 Credit Suisse 17,350 23 28 -521 11 UniCredit Group 4,537 22 14 810 12 UBS Investment Bank 37,873 21 30 -93 13 Morgan Stanley 48,200 20 38 -18
27 14 BNP Paribas 11,673 18 10 811 15 JPMorgan 47,379 17 28 -11
Mergermarket 2013 Trend Report 22 www.mergermarket.com
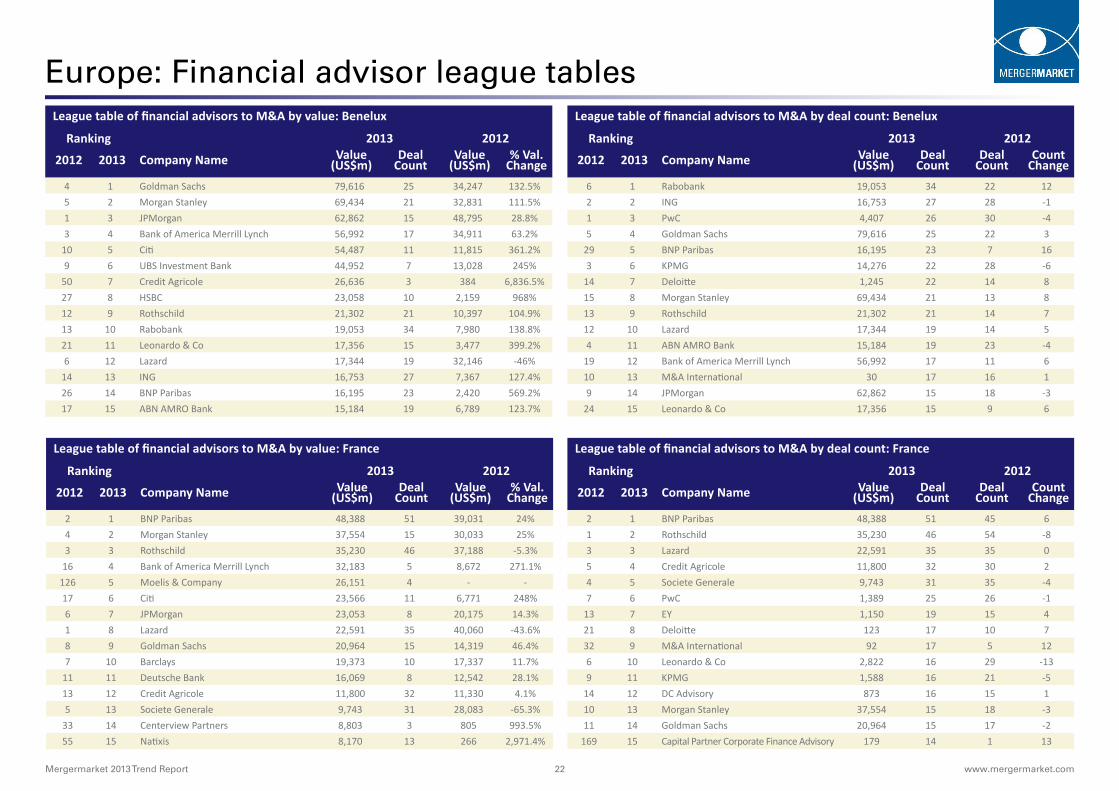
Europe: Financial advisor league tables League table of financial advisors to M&A by value: Benelux
Ranking 2013 2012
2012 2013 Company Name Value (US$m)
Deal Count
Value (US$m)
% Val. Change
4 1 Goldman Sachs 79,616 25 34,247 132.5%5 2 Morgan Stanley 69,434 21 32,831 111.5%1 3 JPMorgan 62,862 15 48,795 28.8%3 4 Bank of America Merrill Lynch 56,992 17 34,911 63.2%
10 5 Citi 54,487 11 11,815 361.2%9 6 UBS Investment Bank 44,952 7 13,028 245%
50 7 Credit Agricole 26,636 3 384 6,836.5%27 8 HSBC 23,058 10 2,159 968%12 9 Rothschild 21,302 21 10,397 104.9%13 10 Rabobank 19,053 34 7,980 138.8%21 11 Leonardo & Co 17,356 15 3,477 399.2%6 12 Lazard 17,344 19 32,146 -46%
14 13 ING 16,753 27 7,367 127.4%26 14 BNP Paribas 16,195 23 2,420 569.2%17 15 ABN AMRO Bank 15,184 19 6,789 123.7%
League table of financial advisors to M&A by deal count: Benelux
Ranking 2013 2012
2012 2013 Company Name Value (US$m)
Deal Count
Deal Count
Count Change
6 1 Rabobank 19,053 34 22 122 2 ING 16,753 27 28 -11 3 PwC 4,407 26 30 -45 4 Goldman Sachs 79,616 25 22 3
29 5 BNP Paribas 16,195 23 7 163 6 KPMG 14,276 22 28 -6
14 7 Deloitte 1,245 22 14 815 8 Morgan Stanley 69,434 21 13 813 9 Rothschild 21,302 21 14 712 10 Lazard 17,344 19 14 54 11 ABN AMRO Bank 15,184 19 23 -4
19 12 Bank of America Merrill Lynch 56,992 17 11 610 13 M&A International 30 17 16 19 14 JPMorgan 62,862 15 18 -3
24 15 Leonardo & Co 17,356 15 9 6
League table of financial advisors to M&A by value: France
Ranking 2013 2012
2012 2013 Company Name Value (US$m)
Deal Count
Value (US$m)
% Val. Change
2 1 BNP Paribas 48,388 51 39,031 24%4 2 Morgan Stanley 37,554 15 30,033 25%3 3 Rothschild 35,230 46 37,188 -5.3%
16 4 Bank of America Merrill Lynch 32,183 5 8,672 271.1%126 5 Moelis & Company 26,151 4 - -17 6 Citi 23,566 11 6,771 248%6 7 JPMorgan 23,053 8 20,175 14.3%1 8 Lazard 22,591 35 40,060 -43.6%8 9 Goldman Sachs 20,964 15 14,319 46.4%7 10 Barclays 19,373 10 17,337 11.7%
11 11 Deutsche Bank 16,069 8 12,542 28.1%13 12 Credit Agricole 11,800 32 11,330 4.1%5 13 Societe Generale 9,743 31 28,083 -65.3%
33 14 Centerview Partners 8,803 3 805 993.5%55 15 Natixis 8,170 13 266 2,971.4%
League table of financial advisors to M&A by deal count: France
Ranking 2013 2012
2012 2013 Company Name Value (US$m)
Deal Count
Deal Count
Count Change
2 1 BNP Paribas 48,388 51 45 61 2 Rothschild 35,230 46 54 -83 3 Lazard 22,591 35 35 05 4 Credit Agricole 11,800 32 30 24 5 Societe Generale 9,743 31 35 -47 6 PwC 1,389 25 26 -1
13 7 EY 1,150 19 15 421 8 Deloitte 123 17 10 732 9 M&A International 92 17 5 126 10 Leonardo & Co 2,822 16 29 -139 11 KPMG 1,588 16 21 -5
14 12 DC Advisory 873 16 15 110 13 Morgan Stanley 37,554 15 18 -311 14 Goldman Sachs 20,964 15 17 -2
169 15 Capital Partner Corporate Finance Advisory 179 14 1 13
Mergermarket 2013 Trend Report 23 www.mergermarket.com
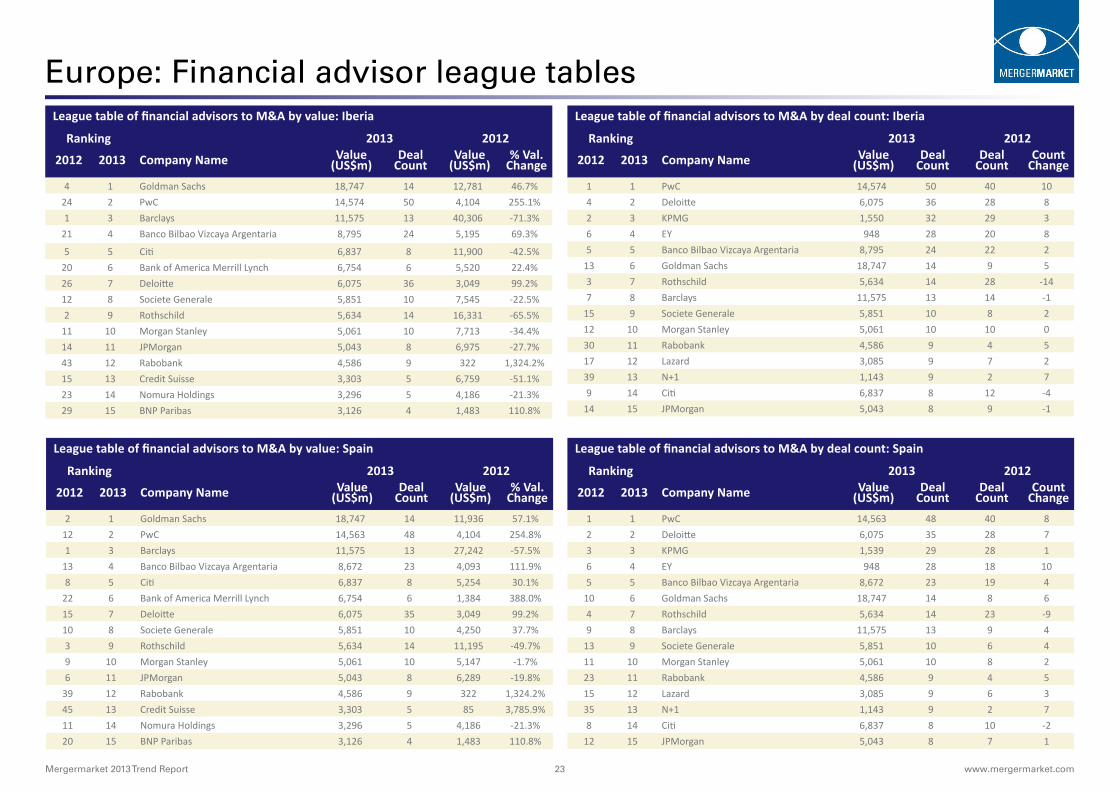
Europe: Financial advisor league tables League table of financial advisors to M&A by value: Iberia
Ranking 2013 2012
2012 2013 Company Name Value (US$m)
Deal Count
Value (US$m)
% Val. Change
4 1 Goldman Sachs 18,747 14 12,781 46.7%24 2 PwC 14,574 50 4,104 255.1%1 3 Barclays 11,575 13 40,306 -71.3%
21 4 Banco Bilbao Vizcaya Argentaria 8,795 24 5,195 69.3%
5 5 Citi 6,837 8 11,900 -42.5%20 6 Bank of America Merrill Lynch 6,754 6 5,520 22.4%26 7 Deloitte 6,075 36 3,049 99.2%12 8 Societe Generale 5,851 10 7,545 -22.5%2 9 Rothschild 5,634 14 16,331 -65.5%
11 10 Morgan Stanley 5,061 10 7,713 -34.4%14 11 JPMorgan 5,043 8 6,975 -27.7%43 12 Rabobank 4,586 9 322 1,324.2%15 13 Credit Suisse 3,303 5 6,759 -51.1%23 14 Nomura Holdings 3,296 5 4,186 -21.3%29 15 BNP Paribas 3,126 4 1,483 110.8%
League table of financial advisors to M&A by deal count: Iberia
Ranking 2013 2012
2012 2013 Company Name Value (US$m)
Deal Count
Deal Count
Count Change
1 1 PwC 14,574 50 40 104 2 Deloitte 6,075 36 28 82 3 KPMG 1,550 32 29 36 4 EY 948 28 20 85 5 Banco Bilbao Vizcaya Argentaria 8,795 24 22 2
13 6 Goldman Sachs 18,747 14 9 53 7 Rothschild 5,634 14 28 -147 8 Barclays 11,575 13 14 -1
15 9 Societe Generale 5,851 10 8 212 10 Morgan Stanley 5,061 10 10 030 11 Rabobank 4,586 9 4 517 12 Lazard 3,085 9 7 239 13 N+1 1,143 9 2 79 14 Citi 6,837 8 12 -4
14 15 JPMorgan 5,043 8 9 -1
League table of financial advisors to M&A by value: Spain
Ranking 2013 2012
2012 2013 Company Name Value (US$m)
Deal Count
Value (US$m)
% Val. Change
2 1 Goldman Sachs 18,747 14 11,936 57.1%12 2 PwC 14,563 48 4,104 254.8%1 3 Barclays 11,575 13 27,242 -57.5%
13 4 Banco Bilbao Vizcaya Argentaria 8,672 23 4,093 111.9%8 5 Citi 6,837 8 5,254 30.1%
22 6 Bank of America Merrill Lynch 6,754 6 1,384 388.0%15 7 Deloitte 6,075 35 3,049 99.2%10 8 Societe Generale 5,851 10 4,250 37.7%3 9 Rothschild 5,634 14 11,195 -49.7%9 10 Morgan Stanley 5,061 10 5,147 -1.7%6 11 JPMorgan 5,043 8 6,289 -19.8%
39 12 Rabobank 4,586 9 322 1,324.2%45 13 Credit Suisse 3,303 5 85 3,785.9%11 14 Nomura Holdings 3,296 5 4,186 -21.3%20 15 BNP Paribas 3,126 4 1,483 110.8%
League table of financial advisors to M&A by deal count: Spain
Ranking 2013 2012
2012 2013 Company Name Value (US$m)
Deal Count
Deal Count
Count Change
1 1 PwC 14,563 48 40 82 2 Deloitte 6,075 35 28 73 3 KPMG 1,539 29 28 16 4 EY 948 28 18 105 5 Banco Bilbao Vizcaya Argentaria 8,672 23 19 4
10 6 Goldman Sachs 18,747 14 8 64 7 Rothschild 5,634 14 23 -99 8 Barclays 11,575 13 9 4
13 9 Societe Generale 5,851 10 6 411 10 Morgan Stanley 5,061 10 8 223 11 Rabobank 4,586 9 4 515 12 Lazard 3,085 9 6 335 13 N+1 1,143 9 2 78 14 Citi 6,837 8 10 -2
12 15 JPMorgan 5,043 8 7 1
Mergermarket 2013 Trend Report 24 www.mergermarket.com
Europe: Financial advisor league tables League table of financial advisors to M&A by value: Italy
Ranking 2013 2012
2012 2013 Company Name Value (US$m)
Deal Count
Value (US$m)
% Val. Change
5 1 Goldman Sachs 21,189 11 16,080 31.8%15 2 Barclays 16,078 7 6,156 161.2%8 3 Banca IMI/Intesa Sanpaolo 14,882 32 14,871 0.1%
14 4 JPMorgan 13,690 9 6,461 111.9%2 5 Rothschild 12,383 17 26,749 -53.7%
13 6 UniCredit Group 10,781 28 8,710 23.8%4 7 Lazard 9,552 19 18,655 -48.8%1 8 Morgan Stanley 9,324 4 28,987 -67.8%
11 9 Deutsche Bank 8,349 5 10,911 -23.5%9 10 Mediobanca 8,160 15 14,007 -41.7%
10 11 Bank of America Merrill Lynch 7,979 5 11,937 -33.2%7 12 BNP Paribas 7,952 14 14,993 -47%3 13 Leonardo & Co 7,268 6 22,287 -67.4%
27 14 HSBC 6,828 6 964 608.3%12 15 Credit Suisse 4,607 3 8,760 -47.4%
League table of financial advisors to M&A by deal count: Italy
Ranking 2013 2012
2012 2013 Company Name Value (US$m)
Deal Count
Deal Count
Count Change
2 1 Banca IMI/Intesa Sanpaolo 14,882 32 22 104 2 UniCredit Group 10,781 28 20 81 3 Lazard 9,552 19 22 -38 4 KPMG 1,438 18 11 73 5 Rothschild 12,383 17 21 -45 6 Mediobanca 8,160 15 19 -47 7 BNP Paribas 7,952 14 13 1
11 8 Goldman Sachs 21,189 11 8 321 9 JPMorgan 13,690 9 4 513 10 Vitale & Associati 2,392 9 8 114 11 EQUITA S.I.M. 689 9 8 137 12 Lincoln International 102 9 2 718 13 Fineurop Soditic 1,006 8 7 115 14 PwC 249 8 8 026 15 Barclays 16,078 7 3 4
League table of financial advisors to M&A by value: Nordic
Ranking 2013 2012
2012 2013 Company Name Value (US$m)
Deal Count
Value (US$m)
% Val. Change
2 1 Goldman Sachs 24,535 12 14,030 74.9%4 2 JPMorgan 20,088 16 12,429 61.6%
12 3 Morgan Stanley 12,099 8 7,357 64.5%13 4 SEB 12,052 37 7,197 67.5%1 5 Deutsche Bank 9,958 8 19,667 -49.4%
14 6 Citi 8,034 12 7,072 13.6%9 7 Nordea Corporate Finance 7,844 18 7,979 -1.7%
10 8 Barclays 6,789 8 7,654 -11.3%42 9 Danske Bank Corporate Finance 6,336 17 718 782.5%15 10 Handelsbanken Capital Markets 5,722 15 6,902 -17.1%32 11 Jefferies 5,608 5 2,285 145.4%18 12 Nomura Holdings 5,423 3 4,120 31.6%11 13 UBS Investment Bank 5,286 7 7,432 -28.9%3 14 Bank of America Merrill Lynch 4,852 7 12,545 -61.3%6 15 Credit Suisse 4,423 3 8,933 -50.5%
League table of financial advisors to M&A by deal count: Nordic
Ranking 2013 2012
2012 2013 Company Name Value (US$m)
Deal Count
Deal Count
Count Change
1 1 PwC 3,301 59 52 72 2 SEB 12,052 37 35 24 3 EY 2,036 24 30 -67 4 ABG Sundal Collier Holding 2,236 20 18 25 5 KPMG 510 19 25 -63 6 Nordea Corporate Finance 7,844 18 30 -12
12 7 Pareto Securities 1,010 18 16 222 8 Danske Bank Corporate Finance 6,336 17 10 76 9 Deloitte 869 17 21 -4
17 10 JPMorgan 20,088 16 11 510 11 Handelsbanken Capital Markets 5,722 15 16 -185 12 Grant Thornton Corporate Finance 52 14 2 129 13 M&A International 112 13 17 -4
16 14 Goldman Sachs 24,535 12 11 124 15 Citi 8,034 12 8 4

Mergermarket 2013 Trend Report 25 www.mergermarket.com
Europe: Financial advisor league tables League table of financial advisors to M&A by value: Sweden
Ranking 2013 2012
2012 2013 Company Name Value (US$m)
Deal Count
Value (US$m)
% Val. Change
1 1 Goldman Sachs 8,365 4 13,582 -38.4%2 2 JPMorgan 8,252 11 9,170 -10%7 3 SEB 6,938 18 4,292 61.6%5 4 Handelsbanken Capital Markets 5,523 10 6,717 -17.8%
15 5 Jefferies 5,019 3 1,525 229.1%21 6 Nomura Holdings 4,823 2 1,152 318.7%6 7 Morgan Stanley 4,516 3 4,558 -0.9%
18 8 UBS Investment Bank 4,423 4 1,245 255.3%3 9 Credit Suisse 4,423 2 7,488 -40.9%8 10 Nordea Corporate Finance 4,336 8 3,714 16.7%- 11 VTB Capital 3,550 2 - -
30 12 PK Partners 3,336 2 320 942.5%10 13 Barclays 3,205 6 3,198 0.2%9 14 Citi 2,343 5 3,655 -35.9%
22 15 PwC 1,895 34 1,131 67.6%
League table of financial advisors to M&A by deal count: Sweden
Ranking 2013 2012
2012 2013 Company Name Value (US$m)
Deal Count
Deal Count
Count Change
1 1 PwC 1,895 34 28 64 2 SEB 6,938 18 17 1
45 3 Grant Thornton Corporate Finance 52 13 2 117 4 JPMorgan 8,252 11 9 23 5 EY 112 11 18 -78 6 Handelsbanken Capital Markets 5,523 10 9 1
21 7 ABG Sundal Collier Holding 1,189 9 4 52 8 Nordea Corporate Finance 4,336 8 18 -105 9 KPMG 129 8 12 -4- 10 Arctos Corporate Finance - 7 - -
18 11 Barclays 3,205 6 4 220 12 Swedbank 1,230 6 4 232 13 Danske Bank Corporate Finance 218 6 3 317 14 Citi 2,343 5 4 110 15 Carnegie Investment Bank 1,444 5 8 -3
League table of financial advisors to M&A by value: Denmark
Ranking 2013 2012
2012 2013 Company Name Value (US$m)
Deal Count
Value (US$m)
% Val. Change
12 1 Nordea Corporate Finance 3,437 8 527 552.2%7 2 Morgan Stanley 2,568 4 918 179.7%
10 3 Danske Bank Corporate Finance 2,108 3 664 217.5%51 4 Citi 1,447 3 - -5 5 PwC 1,253 17 1,789 -30%6 6 FIH Partners 1,073 6 1,732 -38%1 7 SEB 1,043 11 2,488 -58.1%
31 8 JPMorgan 876 3 140 525.7%9 9 Swedbank 769 1 671 14.6%
38 10 EY 713 5 42 1,597.6%24 11 Moelis & Company 700 1 204 243.1%- 12 UniCredit Group 687 3 - -- 13= CITIC Securities Co 600 1 - -- 13= Nomura Holdings 600 1 - -- 13= Southwest Securities Company 600 1 - -
League table of financial advisors to M&A by deal count: Denmark
Ranking 2013 2012
2012 2013 Company Name Value (US$m)
Deal Count
Deal Count
Count Change
1 1 PwC 1,253 17 19 -23 2 Deloitte 488 13 12 14 3 SEB 1,043 11 11 05 4 Advizer - 9 9 08 5 Nordea Corporate Finance 3,437 8 7 1
11 6 M&A International 79 7 4 39 7 FIH Partners 1,073 6 5 12 8 Carnegie Investment Bank 523 6 12 -6
20 9 EY 713 5 2 310 10 Morgan Stanley 2,568 4 4 06 11 KPMG - 4 7 -37 12 Danske Bank Corporate Finance 2,108 3 7 -4
51 13 Citi 1,447 3 1 238 14 JPMorgan 876 3 1 2- 15 UniCredit Group 687 3 - -
Mergermarket 2013 Trend Report 26 www.mergermarket.com
Europe: Financial advisor league tables League table of financial advisors to M&A by value: Norway
Ranking 2013 2012
2012 2013 Company Name Value (US$m)
Deal Count
Value (US$m)
% Val. Change
24 1 SEB 6,436 14 660 875.2%16 2 Goldman Sachs 5,837 3 1,223 377.3%12 3 DNB Markets 4,174 8 2,995 39.4%3 4 Barclays 3,584 2 4,316 -17%- 5 Maybank Investment Bank 3,140 2 - -5 6 Bank of America Merrill Lynch 2,995 2 3,949 -24.2%
18 7 Deutsche Bank 2,948 3 895 229.4%- 8 CIMB Group 2,933 2 - -- 9 ING 2,900 3 - -
17 10 Morgan Stanley 2,900 1 920 215.2%- 11 Lambert Energy Advisory 2,650 1 - -- 12 Centerview Partners 2,446 1 - -2 13 ABG Sundal Collier Holding 2,203 18 6,788 -67.5%
44 14 Citi 1,416 4 55 2,474.5%4 15 Rothschild 1,289 4 4,101 -68.6%
League table of financial advisors to M&A by deal count: Norway
Ranking 2013 2012
2012 2013 Company Name Value (US$m)
Deal Count
Deal Count
Count Change
2 1 ABG Sundal Collier Holding 2,203 18 15 31 2 Pareto Securities 907 16 16 06 3 SEB 6,436 14 8 65 4 PwC 422 14 12 24 5 Arctic Securities 995 11 13 -23 6 DNB Markets 4,174 8 15 -7
14 7 EY 1,241 7 5 230 8 Danske Bank Corporate Finance 186 5 2 353 9 Citi 1,416 4 1 321 10 Rothschild 1,289 4 2 2- 11 Fondsfinans 287 4 - -
10 12 Handelsbanken Capital Markets 55 4 6 -27 13 Alpha Corporate Finance 53 4 8 -49 14 M&A International 25 4 7 -3
12 15 Global M&A Partners - 4 6 -2
League table of financial advisors to M&A by value: Finland
Ranking 2013 2012
2012 2013 Company Name Value (US$m)
Deal Count
Value (US$m)
% Val. Change
7 1 JPMorgan 11,696 4 3,119 275%11 2 Goldman Sachs 9,927 4 425 2,235.8%6 3 Deutsche Bank 5,230 2 3,119 67.7%
16 4 Danske Bank Corporate Finance 4,058 9 210 1,832.4%2 5 Citi 3,698 2 3,614 2.3%
34 6 ICECAPITAL Securities 3,557 2 35 10,063%10 7 Morgan Stanley 3,081 2 1,171 163.1%29 8 goetzpartners 2,219 1 52 4,167.3%- 9 BNP Paribas 2,049 2 - -5 10 Rothschild 1,724 2 3,119 -44.7%9 11 Perella Weinberg Partners 1,724 1 3,119 -44.7%
21 12 SEB 1,642 8 150 994.7%- 13 Code Advisors 1,630 2 - -- 14 Mizuho Financial Group 1,530 1 - -
19 15 PwC 1,393 11 191 629.3%
League table of financial advisors to M&A by deal count: Finland
Ranking 2013 2012
2012 2013 Company Name Value (US$m)
Deal Count
Deal Count
Count Change
4 1 PwC 1,393 11 6 533 2 Danske Bank Corporate Finance 4,058 9 1 89 3 SEB 1,642 8 4 4
14 4 KPMG 427 8 3 51 5 Nordea Corporate Finance 1,186 6 11 -53 6 HLP Corporate Finance - 6 6 05 7 PCA Corporate Finance 14 5 6 -12 8 EY - 5 9 -4
29 9 JPMorgan 11,696 4 1 313 10 Goldman Sachs 9,927 4 3 17 11 Access Partners 862 4 5 -1
62 12 Translink - 4 1 3- 13= Fredericks Michael & Co 26 3 - -
60 13= ProMan 26 3 1 211 15 Advium Corporate Finance 19 3 4 -1
Mergermarket 2013 Trend Report 27 www.mergermarket.com
Europe: Financial advisor league tables League table of financial advisors to M&A by value: CEE
Ranking 2013 2012
2012 2013 Company Name Value (US$m)
Deal Count
Value (US$m)
% Val. Change
4 1 VTB Capital 34,784 16 67,209 -48.2%7 2 Morgan Stanley 27,073 12 48,948 -44.7%2 3 Barclays 23,696 7 68,368 -65.3%
28 4 EY 21,163 19 708 2,889.1%15 5 JPMorgan 20,056 11 8,880 125.9%18 6 Societe Generale 13,178 14 2,269 480.8%14 7 Sberbank CIB 9,427 9 17,494 -46.1%5 8 Citi 8,120 13 66,504 -87.8%6 9 Goldman Sachs 7,639 9 55,157 -86.2%9 10 Credit Suisse 6,965 7 44,499 -84.3%1 11 Deutsche Bank 6,552 9 79,650 -91.8%3 12 Bank of America Merrill Lynch 5,880 8 67,700 -91.3%
57 13 Trigon Group 5,310 6 78 6,707.7%10 14 Renaissance Capital 3,847 3 37,527 -89.7%17 15 Gazprombank 3,708 5 5,993 -38.1%
League table of financial advisors to M&A by deal count: CEE
Ranking 2013 2012
2012 2013 Company Name Value (US$m)
Deal Count
Deal Count
Count Change
9 1 EY 21,163 19 12 74 2 KPMG 3,558 17 19 -22 3 VTB Capital 34,784 16 20 -4
21 4 Deloitte 1,236 16 6 1014 5 Societe Generale 13,178 14 9 516 6 Citi 8,120 13 7 68 7 Morgan Stanley 27,073 12 17 -56 8 UniCredit Group 656 12 18 -6
17 9 JPMorgan 20,056 11 7 43 10 Rothschild 1,461 10 20 -10
48 11 BDO 45 10 2 81 12 Sberbank CIB 9,427 9 26 -177 13 Goldman Sachs 7,639 9 17 -85 14 Deutsche Bank 6,552 9 18 -9
23 15 Bank of America Merrill Lynch 5,880 8 4 4
League table of financial advisors to M&A by value: Russia
Ranking 2013 2012
2012 2013 Company Name Value (US$m)
Deal Count
Value (US$m)
% Val. Change
3 1 VTB Capital 34,784 15 67,209 -48.2%7 2 Morgan Stanley 24,916 8 45,338 -45%5 3 Barclays 17,315 3 63,500 -72.7%
25 4 EY 14,421 3 396 3,541.7%14 5 Sberbank CIB 9,427 9 17,344 -45.6%15 6 JPMorgan 9,362 5 7,179 30.4%20 7 Societe Generale 5,957 5 1,500 297.1%2 8 Bank of America Merrill Lynch 5,707 4 67,700 -91.6%8 9 Credit Suisse 4,500 4 42,735 -89.5%1 10 Deutsche Bank 3,853 5 74,609 -94.8%
10 11 Renaissance Capital 3,847 3 37,447 -89.7%16 12 Gazprombank 3,708 5 5,993 -38.1%4 13 Citi 3,662 6 64,883 -94.4%- 14 Carnegie Investment Bank 2,682 1 - -6 15 Goldman Sachs 2,562 4 49,935 -94.9%
League table of financial advisors to M&A by deal count: Russia
Ranking 2013 2012
2012 2013 Company Name Value (US$m)
Deal Count
Deal Count
Count Change
2 1 VTB Capital 34,784 15 20 -51 2 Sberbank CIB 9,427 9 25 -163 3 Morgan Stanley 24,916 8 15 -7
11 4 Citi 3,662 6 5 1- 5 Otkritie Financial Corporation 1,957 6 - -
13 6 JPMorgan 9,362 5 5 010 7 Societe Generale 5,957 5 6 -14 8 Deutsche Bank 3,853 5 13 -87 9 Gazprombank 3,708 5 11 -6
15 10 Bank of America Merrill Lynch 5,707 4 4 09 11 Credit Suisse 4,500 4 7 -35 12 Goldman Sachs 2,562 4 11 -7
16 13 Barclays 17,315 3 4 -117 14 EY 14,421 3 4 -18 15 Renaissance Capital 3,847 3 8 -5

Mergermarket 2013 Trend Report 28 www.mergermarket.com
Europe: Financial advisor league tables League table of financial advisors to M&A by value: Poland
Ranking 2013 2012
2012 2013 Company Name Value (US$m)
Deal Count
Value (US$bn)
% Val. Change
27 1 Trigon Group 5,310 6 78 6,707.7%19 2 EY 5,008 4 281 1,682.2%6 3 Bank Zachodni WBK 1,067 4 1,576 -32.3%4 4 JPMorgan 698 1 1,701 -59%
12 5 Rothschild 604 3 987 -38.8%5 6 Citi 440 2 1,621 -72.9%
10 7 UniCredit Group 324 6 1,300 -75.1%- 8 Morgan Stanley 292 2 - -
13 9 Societe Generale 275 2 768 -64.2%22 10 Credit Agricole 264 1 206 28.2%- 11= Dundee Capital Markets 224 1 - -- 11= GMP Securities 224 1 - -- 11= Peters & Co 224 1 - -- 14 Bank of America Merrill Lynch 173 2 - -
28 15 Raiffeisen Centrobank 160 2 43 272.1%
League table of financial advisors to M&A by deal count: Poland
Ranking 2013 2012
2012 2013 Company Name Value (US$m)
Deal Count
Deal Count
Count Change
16 1 Trigon Group 5,310 6 2 41 2 UniCredit Group 324 6 8 -2
17 3 Deloitte 49 6 2 443 4 VCP Capital Partners 16 6 1 52 5 EY 5,008 4 5 -1
12 6 Bank Zachodni WBK 1,067 4 2 23 7 KPMG 36 4 5 -1
13 8 Rothschild 604 3 2 14 9 Goldman Sachs 59 3 4 -1
11 10 Citi 440 2 2 0- 11 Morgan Stanley 292 2 - -6 12 Societe Generale 275 2 3 -1- 13 Bank of America Merrill Lynch 173 2 - -8 14 Raiffeisen Centrobank 160 2 3 -1- 15 Clairfield International 130 2 - -
League table of financial advisors to M&A by value: Turkey
Ranking 2013 2012
2012 2013 Company Name Value (US$m)
Deal Count
Value (US$bn)
% Val. Change
9 1 Raiffeisen Centrobank 5,529 11 3,363 64.4%15 2 Citi 1,200 3 875 37.1%16 3 Garanti Securities 1,162 1 695 67.2%11 4 BNP Paribas 1,158 3 2,248 -48.5%24 5= UniCredit Group 1,073 2 207 418.4%26 5= Yapi Kredi Yatirim Menkul Degerler 1,073 2 207 418.4%7 7 Deutsche Bank 1,034 1 3,760 -72.5%- 8 Societe Generale 967 4 - -2 9 Goldman Sachs 925 6 8,078 -88.5%1 10 Bank of America Merrill Lynch 794 3 8,450 -90.6%
31 11 PwC 717 8 98 631.6%- 12 Lazard 712 2 - -
33 13 Burgan Securities 702 3 26 2,600%3 14 Barclays 673 4 7,928 -91.5%- 15 CIMB Group 612 2 - -
League table of financial advisors to M&A by deal count: Turkey
Ranking 2013 2012
2012 2013 Company Name Value (US$m)
Deal Count
Deal Count
Count Change
3 1 3 Seas Capital Partners 29 13 8 54 2 Raiffeisen Centrobank 5,529 11 6 58 3 IS Investment Securities 136 10 5 51 4 PwC 717 8 9 -12 5 Pragma Corporate Finance 262 8 8 06 6 Goldman Sachs 925 6 5 1- 7 Societe Generale 967 4 - -
13 8 Barclays 673 4 3 19 9 Unlu & Co 462 4 5 -1
12 10 Deloitte - 4 4 05 11 Citi 1,200 3 6 -3
28 12 BNP Paribas 1,158 3 1 210 13 Bank of America Merrill Lynch 794 3 4 -122 14 Burgan Securities 702 3 2 114 15 Rothschild 490 3 3 0
Mergermarket 2013 Trend Report 29 www.mergermarket.com
Total M&A value and volumeQuarterly M&A growth comparison
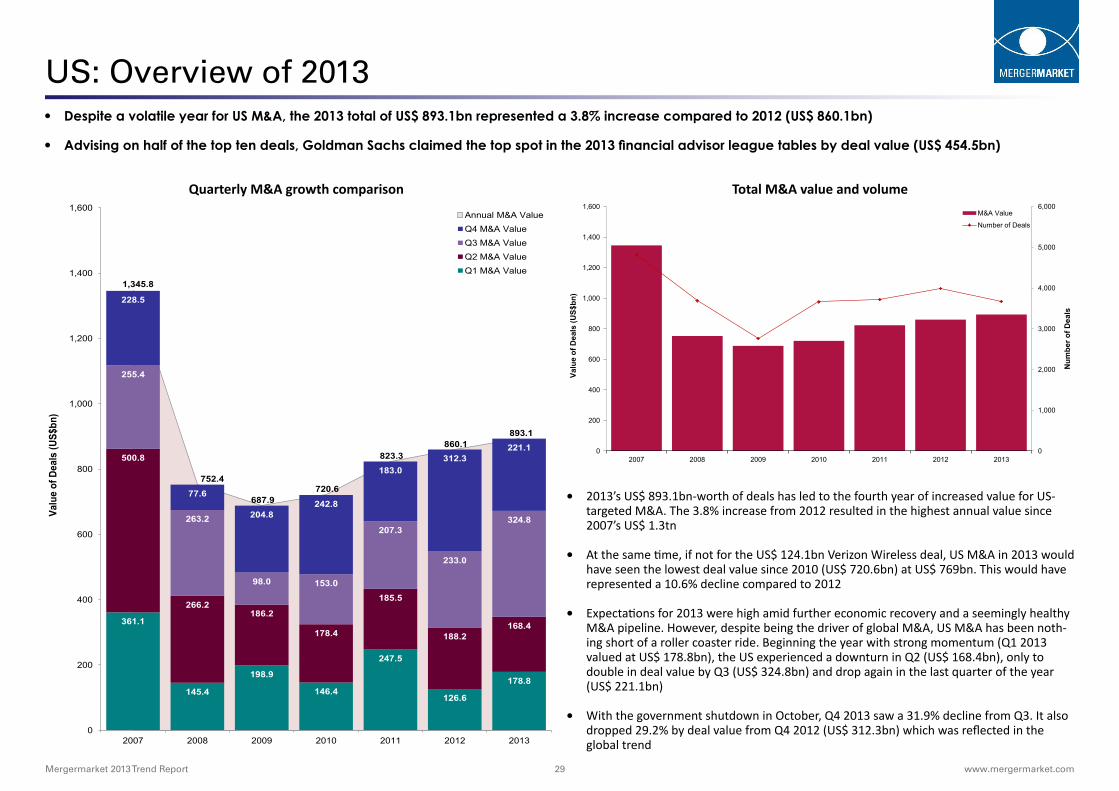
US: Overview of 2013 • Despite a volatile year for US M&A, the 2013 total of US$ 893.1bn represented a 3.8% increase compared to 2012 (US$ 860.1bn)
• Advising on half of the top ten deals, Goldman Sachs claimed the top spot in the 2013 financial advisor league tables by deal value (US$ 454.5bn)
1,345.8
752.4
687.9 720.6
823.3 860.1
893.1
361.1
145.4
198.9
146.4
247.5
126.6
178.8
500.8
266.2 186.2
178.4
185.5
188.2 168.4
255.4
263.2
98.0 153.0
207.3
233.0
324.8
228.5
77.6
204.8 242.8
183.0 312.3
221.1
0
200
400
600
800
1,000
1,200
1,400
1,600
2007 2008 2009 2010 2011 2012 2013
Valu
e of
Dea
ls (U
S$bn
)
Annual M&A Value Q4 M&A Value Q3 M&A Value Q2 M&A Value Q1 M&A Value
0
1,000
2,000
3,000
4,000
5,000
6,000
0
200
400
600
800
1,000
1,200
1,400
1,600
2007 2008 2009 2010 2011 2012 2013
Valu
e of
Dea
ls (U
S$bn
)
M&A Value
Number of Deals
Num
ber o
f Dea
ls
• 2013’s US$ 893.1bn-worth of deals has led to the fourth year of increased value for US-targeted M&A. The 3.8% increase from 2012 resulted in the highest annual value since 2007’s US$ 1.3tn
• At the same time, if not for the US$ 124.1bn Verizon Wireless deal, US M&A in 2013 would have seen the lowest deal value since 2010 (US$ 720.6bn) at US$ 769bn. This would have represented a 10.6% decline compared to 2012
• Expectations for 2013 were high amid further economic recovery and a seemingly healthy M&A pipeline. However, despite being the driver of global M&A, US M&A has been noth-ing short of a roller coaster ride. Beginning the year with strong momentum (Q1 2013 valued at US$ 178.8bn), the US experienced a downturn in Q2 (US$ 168.4bn), only to double in deal value by Q3 (US$ 324.8bn) and drop again in the last quarter of the year (US$ 221.1bn)
• With the government shutdown in October, Q4 2013 saw a 31.9% decline from Q3. It also dropped 29.2% by deal value from Q4 2012 (US$ 312.3bn) which was reflected in the global trend

Mergermarket 2013 Trend Report 30 www.mergermarket.com
4.5%
11.1%
19.6%
8.9%
11.7% 3.1%
14.4%
5.3%
19.6%
1.0%
1.0%
4.7%
10.6%
15.4%
7.6%
8.1% 1.1% 10.8%
5.1%
33.4%
1.4% 1.7%
Business Services: US$ 41.6bn (US$ 38.6bn)
Consumer: US$ 94.6bn (US$ 95.5bn)
Energy, Mining & Utilities: US$ 137.5bn (US$ 168.9bn)
Financial Services: US$ 68.3bn (US$ 76.2bn)
Industrials & Chemicals: US$ 72.6bn (US$ 100.3bn)
Leisure: US$ 10bn (US$ 26.4bn)
Pharma, Medical & Biotech: US$ 96.8bn (US$ 123.7bn)
Real Estate: US$ 45.4bn (US$ 45.3bn)
TMT: US$ 298.1bn (US$ 169.1bn)
Transport: US$ 12.8bn (US$ 8.3bn)
Other: US$ 15.5bn (US$ 8.4bn)
2012
2013
US: Industry and Cross-border analysis
• As the US economy stabilises, local companies are increasingly looking inward for acquisition opportunities: the value of domestic deals in 2013 (US$ 728.2bn) increased 9.1% from 2012 (US$ 667.7bn). As a result, this was the most active year for domestic deals since 2007 (US$ 976.3bn)
• The preference for domestic M&A can also be seen in the lack of growth for outbound activity during 2013 (US$ 176.1bn) which declined 6% from 2012 (US$ 187.3bn). Q4’s US$ 42.9bn declined 13.5% compared to Q3 (US$ 49.6bn) and up by 32.9% compared to Q4 2012 (US$ 63.9bn)
• Amid improving economic conditions, the nature of the US investor abroad is changing as well. In 2013, 80% of US outbound deal value came from a corporate buyer (versus a US-based financial sponsor), the highest proportion since 2008 (84.4%) and the second-highest since 2001 (93.7%)
• Consequently, riskier investments in the emerging markets appear to be traded for stable alternatives at home. US investments into the BRICs in 2013 (US$ 11.1bn, 122 deals) have declined for two consecutive years and saw the lowest deal count since 2009 (110 deals)
0
200
400
600
800
1,000
1,200
0
100
200
300
400
500
600
700
2004 2005 2006 2007 2008 2009 2010 2011 2012 2013
Num
ber o
f Dea
ls
Valu
e of
Dea
ls (U
S$bn
)
Outbound M&A Value
Inbound M&A Value
Inbound Number of Deals
Outbound Number of Deals
• Mega-deals in the TMT sector were the highlight of 2013. As a result, the sector was the dominant industry by both value and count with 775 deals worth US$ 298.1bn, a 76.3% increase in deal value compared to 2012 (US$ 169.1bn). Despite three of the top five deals being TMT focused, the sector’s average deal size of US$ 805.8m was only the second highest behind Real Estate (US$ 1.7bn)
• Q4’s largest deal was in the Financial Services sector and saw the acquisition of International Lease Finance by AerCap Holdings for US$ 26.4bn. Nonetheless, the sector still experienced a 10.4% year-on-year decrease in value (US$ 68.3bn in 2013 compared to US$ 76.2bn in 2012)
• In part due to the US’s shale revolution, the share of inbound Energy, Mining & Utilities deals has decreased each year since 2011, with 2013 (US$ 15.4bn) representing only 11.2% of the total value (US$ 137.5bn). The share of domestic deals in the sector wit-nessed consecutive increases with 2013 (US$ 122.1bn) accounting for 88.8% of the total
US cross-border analysis2013 vs. (2012) value and market share comparison

Mergermarket 2013 Trend Report 31 www.mergermarket.com
US: Top deals
Announced Date
Bidder Company Bidder Financial Advisor Target CompanyTarget/Seller Financial
AdvisorSeller Company
Deal Value (US$bn)
02-Sep-13 Verizon Communications Inc Bank of America Merrill Lynch; Barclays; Guggenheim Partners; JPMorgan; Morgan Stanley; Paul
J. Taubman
Verizon Wireless Inc
(45% Stake)
Advising seller: Goldman Sachs; UBS Investment Bank
Vodafone Group Plc 124.1
14-Feb-13 Berkshire Hathaway Inc; and 3G Capital
JPMorgan; Lazard; Wells Fargo Securities
H.J. Heinz Company Bank of America Merrill Lynch; Centerview Partners; Moelis &
Company
27.4
16-Dec-13 AerCap Holdings NV Bank of America Merrill Lynch; Credit Agricole ; Goldman Sachs;
UBS Investment Bank
International Lease Finance Corporation
Advsing seller: Citi; JPMorgan; Morgan Stanley
American International Group Inc
26.4
05-Feb-13 Silver Lake Partners LP; and Michael Dell (Private investor)
Bank of America Merrill Lynch; Barclays; Citi; Credit Suisse;
Deutsche Bank; LionTree Advisors; RBC Capital Markets;
UBS Investment Bank
Dell Inc Evercore Partners; Goldman Sachs; JPMorgan
20.2
28-Jul-13 Publicis Groupe SA Bank of America Merrill Lynch; BNP Paribas; Citi; Rothschild
Omnicom Group Inc Moelis & Company; Morgan Stanley
19.4
12-Feb-13 Comcast Corporation Bank of America Merrill Lynch; Morgan Stanley
NBCUniversal Media LLC
(49% Stake)
Advising seller: Centerview Partners; Goldman Sachs;
JPMorgan
General Electric Company 16.7
15-Apr-13 Thermo Fisher Scientific Inc Barclays; JPMorgan Life Technologies Corp Deutsche Bank; Moelis & Company
15.0
22-May-13 Pfizer Inc (Shareholders) Zoetis Inc
(80.2% Stake)
Advising seller: Bank of America Merrill Lynch; Goldman
Sachs; Guggenheim Partners; JPMorgan; Morgan Stanley
Pfizer Inc 12.4
06-Aug-13 Spectra Energy Partners LP Evercore Partners Spectra Energy Corp
(US transmission, storage and liquids assets)
Advising seller: Morgan Stanley Spectra Energy Corp 12.3
29-May-13 MidAmerican Energy Holdings Company
NV Energy Inc Lazard 10.4

Mergermarket 2013 Trend Report 32 www.mergermarket.com
Americas: Financial advisor league tablesLeague table of financial advisors to M&A by value: Americas
Ranking 2013 2012
2012 2013 Company Name Value (US$m)
Deal Count
Value (US$m)
% Val. Change
1 1 Goldman Sachs 478,867 211 365,683 31%2 2 JPMorgan 427,589 158 355,107 20.4%5 3 Bank of America Merrill Lynch 426,196 149 241,814 76.2%3 4 Morgan Stanley 390,437 171 293,393 33.1%4 5 Barclays 290,894 118 262,993 10.6%9 6 UBS Investment Bank 247,407 89 114,314 116.4%7 7 Citi 214,029 126 233,500 -8.3%
48 8 Guggenheim Partners 153,207 15 9,096 1,584.3%8 9 Deutsche Bank 148,478 88 194,503 -23.7%6 10 Credit Suisse 137,418 106 235,498 -41.6%- 11 Paul J. Taubman 127,600 2 - -
10 12 Lazard 119,295 119 113,737 4.9%13 13 Evercore Partners 94,652 88 96,706 -2.1%20 14 Moelis & Company 92,184 69 37,878 143.4%15 15 Centerview Partners 81,833 21 67,005 22.1%12 16 RBC Capital Markets 77,647 108 104,929 -26%19 17 Wells Fargo Securities 61,320 50 39,105 56.8%
674 18 LionTree Advisors 49,765 8 - -11 19 Rothschild 46,706 65 106,702 -56.2%14 20 Jefferies 42,812 92 71,872 -40.4%
League table of financial advisors to M&A by deal count: Americas
Ranking 2013 2012
2012 2013 Company Name Value (US$m)
Deal Count
Deal Count
Count Change
1 1 Goldman Sachs 478,867 211 220 -93 2 Morgan Stanley 390,437 171 156 155 3 JPMorgan 427,589 158 149 94 4 Bank of America Merrill Lynch 426,196 149 154 -59 5 Citi 214,029 126 122 48 6 Lazard 119,295 119 127 -82 7 Barclays 290,894 118 157 -397 8 RBC Capital Markets 77,647 108 132 -246 9 Credit Suisse 137,418 106 135 -29
12 10 Jefferies 42,812 92 106 -1414 11 UBS Investment Bank 247,407 89 84 511 12 Deutsche Bank 148,478 88 112 -2415 13 Evercore Partners 94,652 88 77 1110 14 Houlihan Lokey 14,248 87 114 -2719 15 PwC 11,666 82 58 2423 16 Stifel/KBW 12,058 81 55 2634 17 KPMG 9,496 75 41 3416 18 Moelis & Company 92,184 69 74 -5
18 19 Lincoln International 1,155 66 64 213 20 Rothschild 46,706 65 95 -30

Mergermarket 2013 Trend Report 33 www.mergermarket.com
US: Financial advisor league tablesLeague table of financial advisors to M&A by value: US
Ranking 2013 2012
2012 2013 Company Name Value (US$m)
Deal Count
Value (US$m)
% Val. Change
2 1 Goldman Sachs 454,520 191 308,262 47.4%
1 2 JPMorgan 418,933 142 312,801 33.9%7 3 Bank of America Merrill Lynch 404,593 130 184,872 118.9%3 4 Morgan Stanley 359,501 146 259,957 38.3%4 5 Barclays 284,379 112 227,747 24.9%9 6 UBS Investment Bank 240,168 80 99,731 140.8%6 7 Citi 203,266 112 195,067 4.2%
38 8 Guggenheim Partners 153,207 15 9,096 1,584.3%8 9 Deutsche Bank 131,614 77 161,372 -18.4%5 10 Credit Suisse 129,367 96 213,186 -39.3%- 11 Paul J. Taubman 127,600 2 - -
11 12 Lazard 113,489 100 82,754 37.1%19 13 Moelis & Company 92,163 68 37,444 146.1%10 14 Evercore Partners 89,900 85 95,325 -5.7%13 15 Centerview Partners 81,833 21 67,005 22.1%18 16 Wells Fargo Securities 61,320 50 39,105 56.8%16 17 RBC Capital Markets 60,146 86 46,851 28.4%
579 18 LionTree Advisors 49,765 8 - -12 19 Rothschild 41,068 45 81,880 -49.8%14 20 Jefferies 40,033 87 60,713 -34.1%
League table of financial advisors to M&A by deal count: US
Ranking 2013 2012
2012 2013 Company Name Value (US$m)
Deal Count
Deal Count
Count Change
1 1 Goldman Sachs 454,520 191 190 13 2 Morgan Stanley 359,501 146 138 84 3 JPMorgan 418,933 142 133 95 4 Bank of America Merrill Lynch 404,593 130 131 -12 5 Barclays 284,379 112 146 -348 6 Citi 203,266 112 106 69 7 Lazard 113,489 100 105 -57 8 Credit Suisse 129,367 96 107 -11
10 9 Jefferies 40,033 87 98 -1112 10 RBC Capital Markets 60,146 86 83 313 11 Evercore Partners 89,900 85 74 116 12 Houlihan Lokey 14,165 85 111 -26
20 13 Stifel/KBW 12,058 81 54 2715 14 UBS Investment Bank 240,168 80 67 1311 15 Deutsche Bank 131,614 77 97 -2014 16 Moelis & Company 92,163 68 70 -218 17 Lincoln International 1,155 63 62 124 18 Sandler O'Neill & Partners 12,207 57 48 9
27 19 PwC 9,206 57 45 1231 20 KPMG 5,799 55 32 23

Mergermarket 2013 Trend Report 34 www.mergermarket.com
US: Financial advisor league tables to buyoutsLeague Table of financial advisors to private equity buyouts by value: US
Ranking 2013 2012
2012 2013 Company Name Value (US$m)
Deal Count
Value (US$m)
% Val. Change
3 1 RBC Capital Markets 36,814 11 16,491 123.2%12 2 UBS Investment Bank 33,035 15 5,084 549.8%5 3 Credit Suisse 32,373 12 13,469 140.4%4 4 Barclays 31,926 8 14,545 119.5%
29 5 Lazard 30,918 4 540 5,625.6%2 6 Deutsche Bank 29,287 9 18,883 55.1%9 7 JPMorgan 29,201 6 9,208 217.1%
17 8 Wells Fargo Securities 28,662 3 2,399 1,094.7%8 9 Bank of America Merrill Lynch 28,056 9 9,622 191.6%1 10 Citi 21,747 4 20,174 7.8%- 11 LionTree Advisors 20,769 2 - -7 12 Morgan Stanley 7,239 10 10,449 -30.7%- 13 Qatalyst Group 6,535 1 - -
10 14 Goldman Sachs 6,008 9 9,164 -34.4%6 15 Jefferies 5,651 13 10,698 -47.2%
League Table of financial advisors to private equity buyouts by deal count: US
Ranking 2013 20122012 2013 Company Name Value
(US$m)Deal
CountDeal
CountCount
Change14 1 UBS Investment Bank 33,035 15 4 115 2 Jefferies 5,651 13 11 27 3 Credit Suisse 32,373 12 10 21 4 RBC Capital Markets 36,814 11 14 -34 5 Morgan Stanley 7,239 10 12 -22 6 Deutsche Bank 29,287 9 12 -38 7 Bank of America Merrill Lynch 28,056 9 10 -16 8 Goldman Sachs 6,008 9 11 -23 9 Barclays 31,926 8 12 -4
13 10 Lincoln International 107 7 5 219 11 JPMorgan 29,201 6 3 312 12 Houlihan Lokey 3,496 5 5 028 13 Lazard 30,918 4 2 29 14 Citi 21,747 4 8 -4
11 15 BMO Capital Markets 2,066 4 6 -2
* Based on the target geography only and the advisor advising the buy-side only

Mergermarket 2013 Trend Report 35 www.mergermarket.com
US: Financial advisor league tables League table of financial advisors to M&A by value: Canada
Ranking 2013 2012
2012 2013 Company Name Value (US$m)
Deal Count
Value (US$m)
% Val. Change
11 1 Morgan Stanley 37,260 18 13,439 177.3%1 2 RBC Capital Markets 29,855 34 73,271 -59.3%2 3 Goldman Sachs 27,496 16 40,597 -32.3%5 4 Bank of America Merrill Lynch 24,560 18 26,596 -7.7%
21 5 Deutsche Bank 20,216 11 6,233 224.3%19 6 JPMorgan 18,287 16 8,397 117.8%4 7 Scotiabank 16,205 24 29,285 -44.7%7 8 TD Securities 11,532 22 22,217 -48.1%
13 9 Credit Suisse 11,455 9 11,520 -0.6%6 10 Citi 10,276 13 25,131 -59.1%3 11 BMO Capital Markets 9,707 26 39,745 -75.6%
15 12 Canaccord Genuity 7,801 16 10,723 -27.2%10 13 Barclays 6,947 11 13,653 -49.1%8 14 CIBC World Markets 6,811 14 17,263 -60.5%
29 15 Lazard 5,596 6 2,270 146.5%
League table of financial advisors to M&A by deal count: Canada
Ranking 2013 2012
2012 2013 Company Name Value (US$m)
Deal Count
Deal Count
Count Change
1 1 RBC Capital Markets 29,855 34 64 -304 2 GMP Securities 4,996 27 27 02 3 BMO Capital Markets 9,707 26 34 -85 4 Scotiabank 16,205 24 26 -23 5 TD Securities 11,532 22 28 -6
11 6 Macquarie Group 4,863 19 17 215 7 Morgan Stanley 37,260 18 12 612 8 Bank of America Merrill Lynch 24,560 18 15 310 9 Goldman Sachs 27,496 16 17 -120 10 JPMorgan 18,287 16 10 67 11 Canaccord Genuity 7,801 16 22 -6
26 12 KPMG 2,850 16 8 823 13 PwC 725 16 10 68 14 CIBC World Markets 6,811 14 21 -7
31 15 Raymond James & Associates 2,311 14 7 7
League table of financial advisors to M&A by value: Central & South America
Ranking 2013 2012
2012 2013 Company Name Value (US$m)
Deal Count
Value (US$m)
% Val. Change
11 1 Banco BTG Pactual 18,055 44 19,704 -8.4%4 2 Goldman Sachs 15,521 20 32,303 -52.0%9 3 Banco Itau BBA 14,866 34 23,478 -36.7%
14 4 Banco Bradesco BBI 12,482 17 15,817 -21.1%5 5 Morgan Stanley 11,899 18 30,471 -60.9%2 6 Bank of America Merrill Lynch 11,163 13 43,035 -74.1%7 7 Credit Suisse 10,817 13 27,424 -60.6%6 8 Deutsche Bank 9,243 10 28,491 -67.6%3 9 Lazard 8,231 20 34,782 -76.3%
12 10 Citi 7,692 12 18,003 -57.3%20 11 Banco Bilbao Vizcaya Argentaria 5,953 13 3,511 69.6%1 12 JPMorgan 5,892 14 45,402 -87.0%8 13 Barclays 4,906 7 25,614 -80.8%
15 14 Santander Global Banking and Markets 4,292 7 7,121 -39.7%16 15 UBS Investment Bank 3,766 6 6,445 -41.6%
League table of financial advisors to M&A by deal count: Central & South America
Ranking 2013 2012
2012 2013 Company Name Value (US$m)
Deal Count
Deal Count
Count Change
2 1 Banco BTG Pactual 18,055 44 43 11 2 Banco Itau BBA 14,866 34 55 -214 3 Goldman Sachs 15,521 20 28 -87 4 Lazard 8,231 20 21 -1
12 5 Morgan Stanley 11,899 18 14 46 6 Banco Bradesco BBI 12,482 17 23 -6
23 7 PwC 2,216 15 6 99 8 JPMorgan 5,892 14 19 -58 9 Bank of America Merrill Lynch 11,163 13 20 -73 10 Credit Suisse 10,817 13 32 -19
16 11 Banco Bilbao Vizcaya Argentaria 5,953 13 12 110 12 Citi 7,692 12 15 -313 13 Deutsche Bank 9,243 10 13 -35 14 Rothschild 2,778 10 23 -13
17 15 Vinci Partners 888 10 9 1
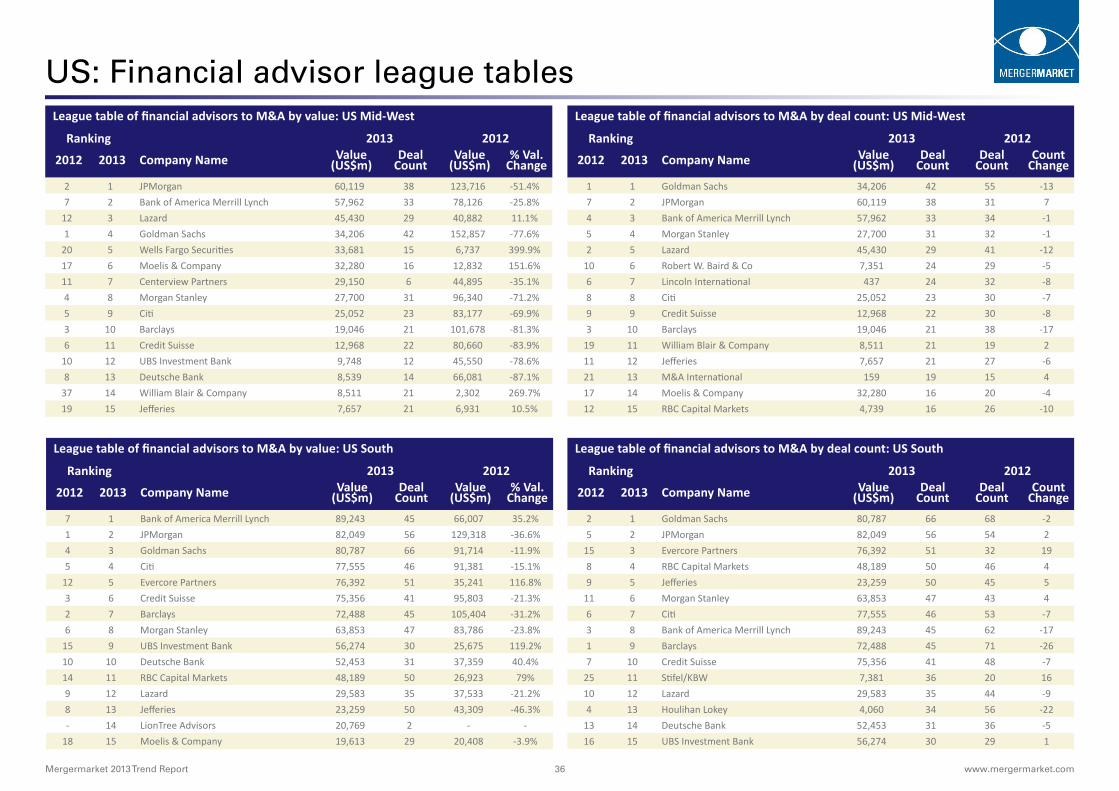
Mergermarket 2013 Trend Report 36 www.mergermarket.com
US: Financial advisor league tables League table of financial advisors to M&A by value: US Mid-West
Ranking 2013 2012
2012 2013 Company Name Value (US$m)
Deal Count
Value (US$m)
% Val. Change
2 1 JPMorgan 60,119 38 123,716 -51.4%7 2 Bank of America Merrill Lynch 57,962 33 78,126 -25.8%
12 3 Lazard 45,430 29 40,882 11.1%1 4 Goldman Sachs 34,206 42 152,857 -77.6%
20 5 Wells Fargo Securities 33,681 15 6,737 399.9%17 6 Moelis & Company 32,280 16 12,832 151.6%11 7 Centerview Partners 29,150 6 44,895 -35.1%4 8 Morgan Stanley 27,700 31 96,340 -71.2%5 9 Citi 25,052 23 83,177 -69.9%3 10 Barclays 19,046 21 101,678 -81.3%6 11 Credit Suisse 12,968 22 80,660 -83.9%
10 12 UBS Investment Bank 9,748 12 45,550 -78.6%8 13 Deutsche Bank 8,539 14 66,081 -87.1%
37 14 William Blair & Company 8,511 21 2,302 269.7%19 15 Jefferies 7,657 21 6,931 10.5%
League table of financial advisors to M&A by deal count: US Mid-West
Ranking 2013 2012
2012 2013 Company Name Value (US$m)
Deal Count
Deal Count
Count Change
1 1 Goldman Sachs 34,206 42 55 -137 2 JPMorgan 60,119 38 31 74 3 Bank of America Merrill Lynch 57,962 33 34 -15 4 Morgan Stanley 27,700 31 32 -12 5 Lazard 45,430 29 41 -12
10 6 Robert W. Baird & Co 7,351 24 29 -56 7 Lincoln International 437 24 32 -88 8 Citi 25,052 23 30 -79 9 Credit Suisse 12,968 22 30 -83 10 Barclays 19,046 21 38 -17
19 11 William Blair & Company 8,511 21 19 211 12 Jefferies 7,657 21 27 -621 13 M&A International 159 19 15 417 14 Moelis & Company 32,280 16 20 -412 15 RBC Capital Markets 4,739 16 26 -10
League table of financial advisors to M&A by value: US South
Ranking 2013 2012
2012 2013 Company Name Value (US$m)
Deal Count
Value (US$m)
% Val. Change
7 1 Bank of America Merrill Lynch 89,243 45 66,007 35.2%1 2 JPMorgan 82,049 56 129,318 -36.6%4 3 Goldman Sachs 80,787 66 91,714 -11.9%5 4 Citi 77,555 46 91,381 -15.1%
12 5 Evercore Partners 76,392 51 35,241 116.8%3 6 Credit Suisse 75,356 41 95,803 -21.3%2 7 Barclays 72,488 45 105,404 -31.2%6 8 Morgan Stanley 63,853 47 83,786 -23.8%
15 9 UBS Investment Bank 56,274 30 25,675 119.2%10 10 Deutsche Bank 52,453 31 37,359 40.4%14 11 RBC Capital Markets 48,189 50 26,923 79%9 12 Lazard 29,583 35 37,533 -21.2%8 13 Jefferies 23,259 50 43,309 -46.3%- 14 LionTree Advisors 20,769 2 - -
18 15 Moelis & Company 19,613 29 20,408 -3.9%
League table of financial advisors to M&A by deal count: US South
Ranking 2013 2012
2012 2013 Company Name Value (US$m)
Deal Count
Deal Count
Count Change
2 1 Goldman Sachs 80,787 66 68 -25 2 JPMorgan 82,049 56 54 2
15 3 Evercore Partners 76,392 51 32 198 4 RBC Capital Markets 48,189 50 46 49 5 Jefferies 23,259 50 45 5
11 6 Morgan Stanley 63,853 47 43 46 7 Citi 77,555 46 53 -73 8 Bank of America Merrill Lynch 89,243 45 62 -171 9 Barclays 72,488 45 71 -267 10 Credit Suisse 75,356 41 48 -7
25 11 Stifel/KBW 7,381 36 20 1610 12 Lazard 29,583 35 44 -94 13 Houlihan Lokey 4,060 34 56 -22
13 14 Deutsche Bank 52,453 31 36 -516 15 UBS Investment Bank 56,274 30 29 1
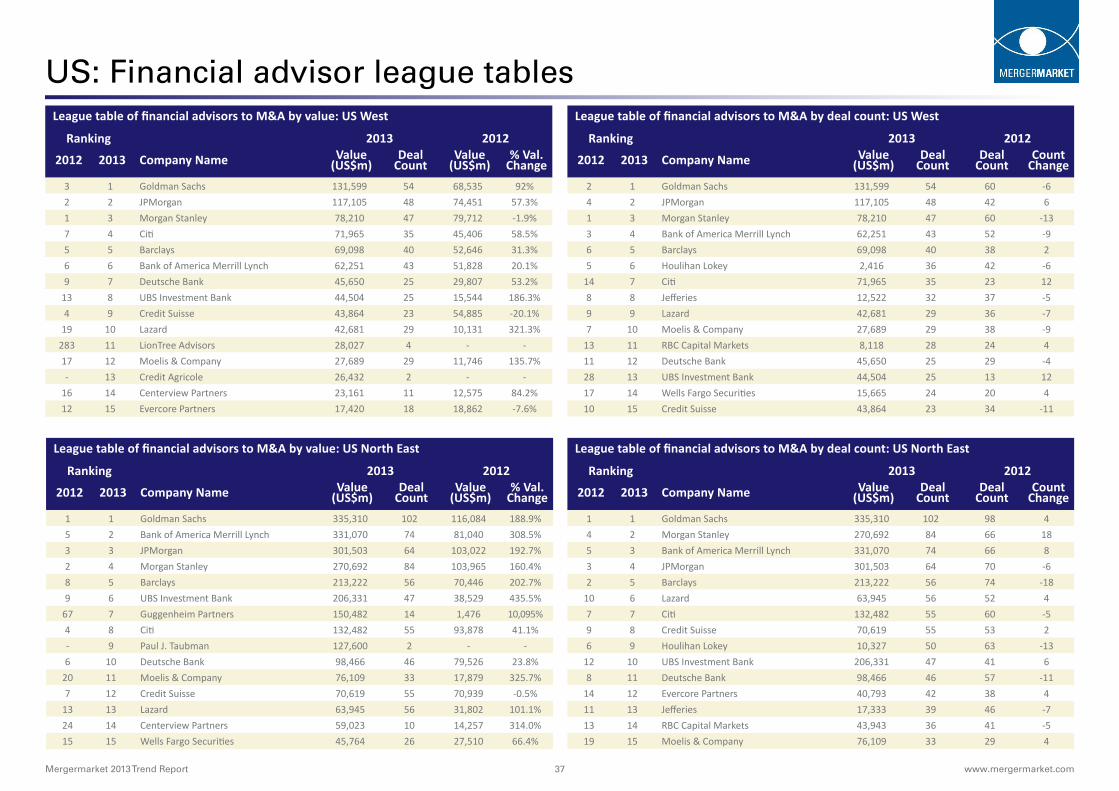
Mergermarket 2013 Trend Report 37 www.mergermarket.com
US: Financial advisor league tables League table of financial advisors to M&A by value: US West
Ranking 2013 2012
2012 2013 Company Name Value (US$m)
Deal Count
Value (US$m)
% Val. Change
3 1 Goldman Sachs 131,599 54 68,535 92%2 2 JPMorgan 117,105 48 74,451 57.3%1 3 Morgan Stanley 78,210 47 79,712 -1.9%7 4 Citi 71,965 35 45,406 58.5%5 5 Barclays 69,098 40 52,646 31.3%6 6 Bank of America Merrill Lynch 62,251 43 51,828 20.1%9 7 Deutsche Bank 45,650 25 29,807 53.2%
13 8 UBS Investment Bank 44,504 25 15,544 186.3%4 9 Credit Suisse 43,864 23 54,885 -20.1%
19 10 Lazard 42,681 29 10,131 321.3%283 11 LionTree Advisors 28,027 4 - -17 12 Moelis & Company 27,689 29 11,746 135.7%- 13 Credit Agricole 26,432 2 - -
16 14 Centerview Partners 23,161 11 12,575 84.2%12 15 Evercore Partners 17,420 18 18,862 -7.6%
League table of financial advisors to M&A by deal count: US West
Ranking 2013 2012
2012 2013 Company Name Value (US$m)
Deal Count
Deal Count
Count Change
2 1 Goldman Sachs 131,599 54 60 -64 2 JPMorgan 117,105 48 42 61 3 Morgan Stanley 78,210 47 60 -133 4 Bank of America Merrill Lynch 62,251 43 52 -96 5 Barclays 69,098 40 38 25 6 Houlihan Lokey 2,416 36 42 -6
14 7 Citi 71,965 35 23 128 8 Jefferies 12,522 32 37 -59 9 Lazard 42,681 29 36 -77 10 Moelis & Company 27,689 29 38 -9
13 11 RBC Capital Markets 8,118 28 24 411 12 Deutsche Bank 45,650 25 29 -428 13 UBS Investment Bank 44,504 25 13 1217 14 Wells Fargo Securities 15,665 24 20 410 15 Credit Suisse 43,864 23 34 -11
League table of financial advisors to M&A by value: US North East
Ranking 2013 2012
2012 2013 Company Name Value (US$m)
Deal Count
Value (US$m)
% Val. Change
1 1 Goldman Sachs 335,310 102 116,084 188.9%5 2 Bank of America Merrill Lynch 331,070 74 81,040 308.5%3 3 JPMorgan 301,503 64 103,022 192.7%2 4 Morgan Stanley 270,692 84 103,965 160.4%8 5 Barclays 213,222 56 70,446 202.7%9 6 UBS Investment Bank 206,331 47 38,529 435.5%
67 7 Guggenheim Partners 150,482 14 1,476 10,095%4 8 Citi 132,482 55 93,878 41.1%- 9 Paul J. Taubman 127,600 2 - -6 10 Deutsche Bank 98,466 46 79,526 23.8%
20 11 Moelis & Company 76,109 33 17,879 325.7%7 12 Credit Suisse 70,619 55 70,939 -0.5%
13 13 Lazard 63,945 56 31,802 101.1%24 14 Centerview Partners 59,023 10 14,257 314.0%15 15 Wells Fargo Securities 45,764 26 27,510 66.4%
League table of financial advisors to M&A by deal count: US North East
Ranking 2013 2012
2012 2013 Company Name Value (US$m)
Deal Count
Deal Count
Count Change
1 1 Goldman Sachs 335,310 102 98 44 2 Morgan Stanley 270,692 84 66 185 3 Bank of America Merrill Lynch 331,070 74 66 83 4 JPMorgan 301,503 64 70 -62 5 Barclays 213,222 56 74 -18
10 6 Lazard 63,945 56 52 47 7 Citi 132,482 55 60 -59 8 Credit Suisse 70,619 55 53 26 9 Houlihan Lokey 10,327 50 63 -13
12 10 UBS Investment Bank 206,331 47 41 68 11 Deutsche Bank 98,466 46 57 -11
14 12 Evercore Partners 40,793 42 38 411 13 Jefferies 17,333 39 46 -713 14 RBC Capital Markets 43,943 36 41 -519 15 Moelis & Company 76,109 33 29 4
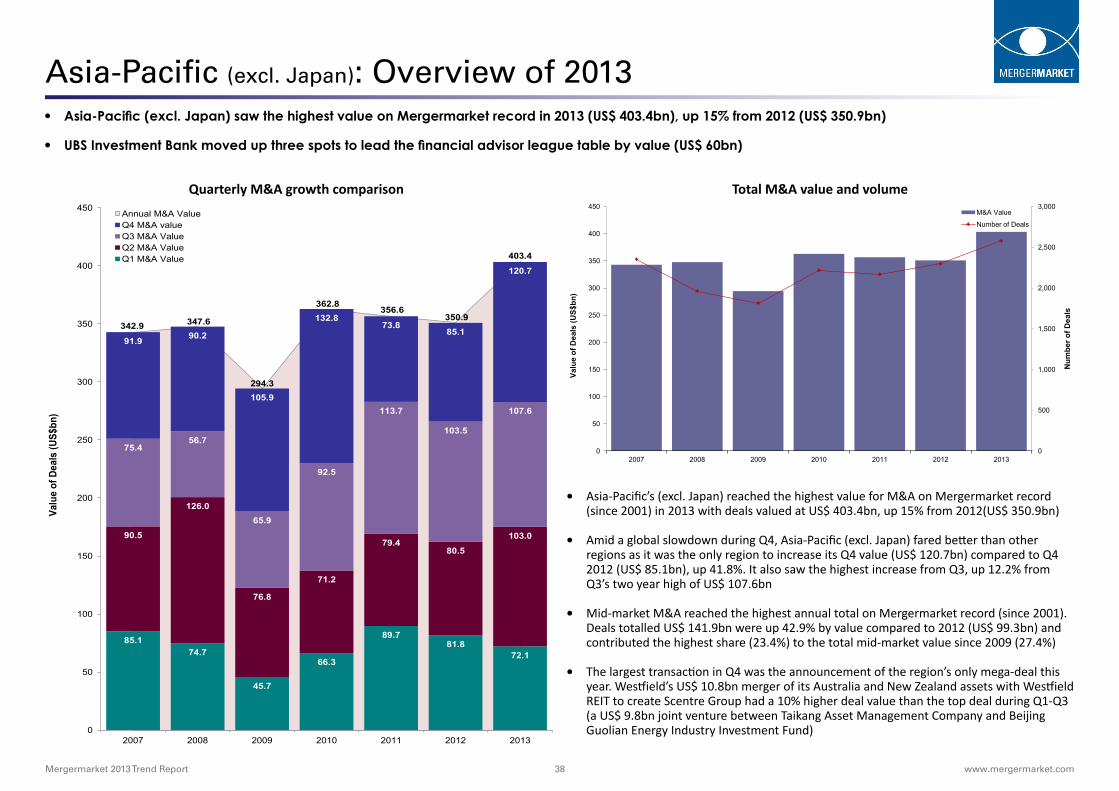
Mergermarket 2013 Trend Report 38 www.mergermarket.com
Total M&A value and volumeQuarterly M&A growth comparison
Asia-Pacific (excl. Japan): Overview of 2013 • Asia-Pacific (excl. Japan) saw the highest value on Mergermarket record in 2013 (US$ 403.4bn), up 15% from 2012 (US$ 350.9bn)
• UBS Investment Bank moved up three spots to lead the financial advisor league table by value (US$ 60bn)
342.9 347.6
294.3
362.8 356.6
350.9
403.4
85.1 74.7
45.7
66.3
89.7 81.8
72.1
90.5
126.0
76.8
71.2
79.4 80.5
103.0
75.4 56.7
65.9
92.5
113.7
103.5
107.6
91.9 90.2
105.9
132.8 73.8
85.1
120.7
0
50
100
150
200
250
300
350
400
450
2007 2008 2009 2010 2011 2012 2013
Valu
e of
Dea
ls (U
S$bn
)
Annual M&A Value Q4 M&A value Q3 M&A Value Q2 M&A Value Q1 M&A Value
0
500
1,000
1,500
2,000
2,500
3,000
0
50
100
150
200
250
300
350
400
450
2007 2008 2009 2010 2011 2012 2013
Valu
e of
Dea
ls (U
S$bn
)
M&A Value
Number of Deals
Num
ber o
f Dea
ls
• Asia-Pacific’s (excl. Japan) reached the highest value for M&A on Mergermarket record (since 2001) in 2013 with deals valued at US$ 403.4bn, up 15% from 2012(US$ 350.9bn)
• Amid a global slowdown during Q4, Asia-Pacific (excl. Japan) fared better than other regions as it was the only region to increase its Q4 value (US$ 120.7bn) compared to Q4 2012 (US$ 85.1bn), up 41.8%. It also saw the highest increase from Q3, up 12.2% from Q3’s two year high of US$ 107.6bn
• Mid-market M&A reached the highest annual total on Mergermarket record (since 2001). Deals totalled US$ 141.9bn were up 42.9% by value compared to 2012 (US$ 99.3bn) and contributed the highest share (23.4%) to the total mid-market value since 2009 (27.4%)
• The largest transaction in Q4 was the announcement of the region’s only mega-deal this year. Westfield’s US$ 10.8bn merger of its Australia and New Zealand assets with Westfield REIT to create Scentre Group had a 10% higher deal value than the top deal during Q1-Q3 (a US$ 9.8bn joint venture between Taikang Asset Management Company and Beijing Guolian Energy Industry Investment Fund)

Mergermarket 2013 Trend Report 39 www.mergermarket.com
Asia-Pacific (excl. Japan): Industry and Cross-border analysis
0
100
200
300
400
500
600
0
50
100
150
200
250
2004 2005 2006 2007 2008 2009 2010 2011 2012 2013
Num
ber o
f Dea
ls
Valu
e of
Dea
ls (U
S$bn
)
Outbound M&A Value
Inbound M&A Value
Inbound Number of Deals
Outbound Number of Deals
• Outbound activity was valued between US$ 16bn - US$ 19bn every quarter in 2013 apart from Q2’s US$ 26.5bn. With consistent deal values, the year ended with deals valued at US$ 80.2bn, a slight decrease of 2.4% from 2012 (US$ 82.2bn)
• Africa and Middle East saw an 163.4% worth of value from Asia-Pacific (excl. Japan) with deals valued at US$ 18.8bn compared to US$ 7.1bn last year. As a result the annual total of outbound deals into the region accounted for 23.4% of total outbound investment, a considerable increase from 8.7% in 2012. This is likely to continue as the region looks into more energy resources.
• Inbound M&A also failed to make a significant difference compared to 2012 with deals val-ued at US$ 69.4bn yet it still registered a 3% increase from US$ 67.4bn last year. Inbound investment from every region remained on par with the values seen last year
• Consumer deals were most active in Asia’s outbound transactions with deals valued at US$ 12.3bn more than doubling the value in 2012 (US$ 4.1bn) with eight extra deals. Meanwhile, inbound investment into the sector during 2013 declined 36.4% to US$ 11bn compared to US$ 17.3bn last year
• Asia-Pacific (excl. Japan) saw the majority of its sectors increase by both deal value and number of deals, the opposite trend seen in most other regions
• The largest increase by both deal value and deal count was the Real Estate sector, up 219.1% by value to US$ 36.7bn compared to US$ 11.5bn in 2012 and up 49.4% by deal count with 121 deals versus 81 last year
• Energy, Mining & Utilities M&A remained the most active sector during 2013 with deals worth US$ 93.9bn, up 43.4% by value from 2012 (US$ 65.5bn) and increasing its market share to 23.3% compared to 18.7% last year
• As the region’s Pharma, Medical & Biotech companies battle it out to be the market leader (particularly in China), the sector saw the second highest increase by deal count (after Real Estate), up 27.5% with 195 deals compared to 153 deals last year. The sector also saw a 32% increase by value with deals valued at US$ 16.5bn versus US$ 12.5bn in 2012
3.6%
14.0%
18.7%
15.6% 16.8%
1.5% 3.6%
3.3%
15.1%
4.1% 3.8%
3.0%
10.6%
23.3%
12.8% 13.8%
1.9%
4.1%
9.1%
11.0%
5.1% 5.2%
Business Services: US$ 12.3bn (US$ 12.7bn)
Consumer: US$ 42.7bn (US$ 49bn)
Energy, Mining & Utilities: US$ 93.9bn (US$ 65.5bn)
Financial Services: US$ 51.7bn (US$ 54.8bn)
Industrials & Chemicals: US$ 55.7bn (US$ 59bn)
Leisure: US$ 7.6bn (US$ 5.2bn)
Pharma, Medical & Biotech: US$ 16.5bn (US$ 12.5bn)
Real Estate: US$ 36.7bn (US$ 11.5bn)
TMT: US$ 44.5bn (US$ 53.1bn)
Transport: US$ 20.7bn (US$ 14.5bn)
Other: US$ 21.1bn (US$ 13.2bn)
2012
2013
Asia-Pacific (excl. Japan) cross-border analysis2013 vs. (2012) value and market share comparison
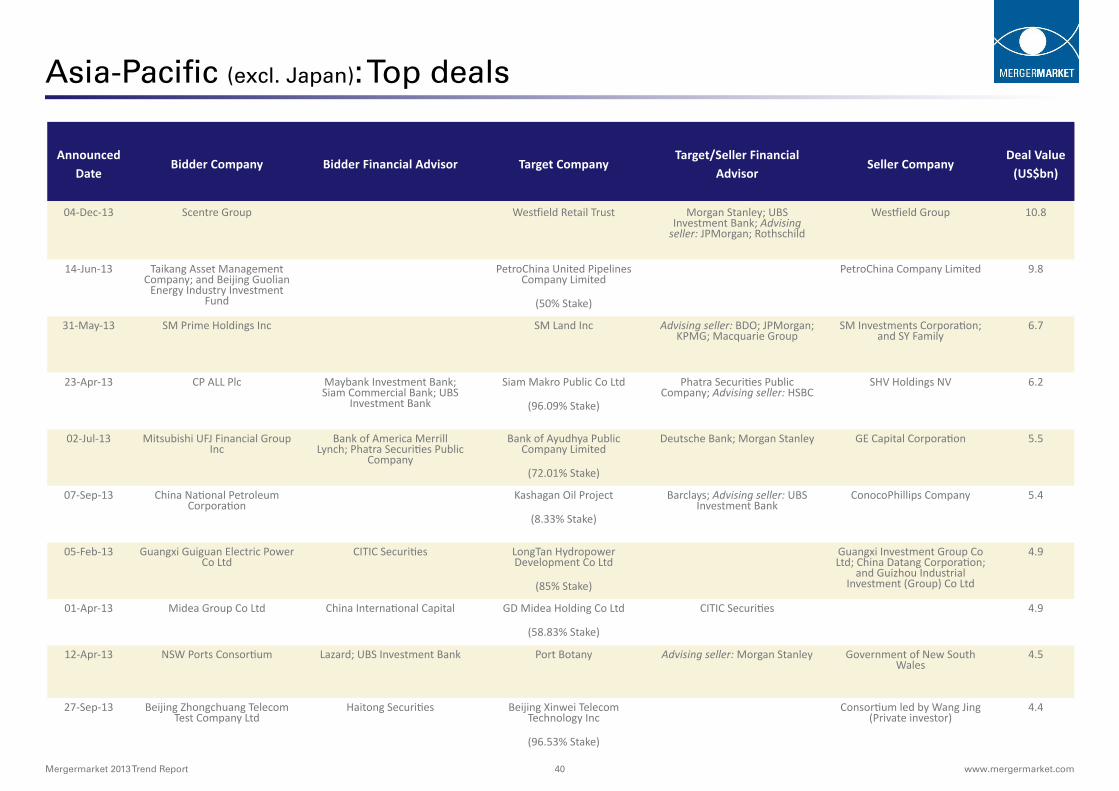
Mergermarket 2013 Trend Report 40 www.mergermarket.com
Asia-Pacific (excl. Japan): Top deals
Announced Date
Bidder Company Bidder Financial Advisor Target CompanyTarget/Seller Financial
AdvisorSeller Company
Deal Value (US$bn)
04-Dec-13 Scentre Group Westfield Retail Trust Morgan Stanley; UBS Investment Bank; Advising
seller: JPMorgan; Rothschild
Westfield Group 10.8
14-Jun-13 Taikang Asset Management Company; and Beijing Guolian
Energy Industry Investment Fund
PetroChina United Pipelines Company Limited
(50% Stake)
PetroChina Company Limited 9.8
31-May-13 SM Prime Holdings Inc SM Land Inc Advising seller: BDO; JPMorgan; KPMG; Macquarie Group
SM Investments Corporation; and SY Family
6.7
23-Apr-13 CP ALL Plc Maybank Investment Bank; Siam Commercial Bank; UBS
Investment Bank
Siam Makro Public Co Ltd
(96.09% Stake)
Phatra Securities Public Company; Advising seller: HSBC
SHV Holdings NV 6.2
02-Jul-13 Mitsubishi UFJ Financial Group Inc
Bank of America Merrill Lynch; Phatra Securities Public
Company
Bank of Ayudhya Public Company Limited
(72.01% Stake)
Deutsche Bank; Morgan Stanley GE Capital Corporation 5.5
07-Sep-13 China National Petroleum Corporation
Kashagan Oil Project
(8.33% Stake)
Barclays; Advising seller: UBS Investment Bank
ConocoPhillips Company 5.4
05-Feb-13 Guangxi Guiguan Electric Power Co Ltd
CITIC Securities LongTan Hydropower Development Co Ltd
(85% Stake)
Guangxi Investment Group Co Ltd; China Datang Corporation;
and Guizhou Industrial Investment (Group) Co Ltd
4.9
01-Apr-13 Midea Group Co Ltd China International Capital GD Midea Holding Co Ltd
(58.83% Stake)
CITIC Securities 4.9
12-Apr-13 NSW Ports Consortium Lazard; UBS Investment Bank Port Botany Advising seller: Morgan Stanley Government of New South Wales
4.5
27-Sep-13 Beijing Zhongchuang Telecom Test Company Ltd
Haitong Securities Beijing Xinwei Telecom Technology Inc
(96.53% Stake)
Consortium led by Wang Jing (Private investor)
4.4
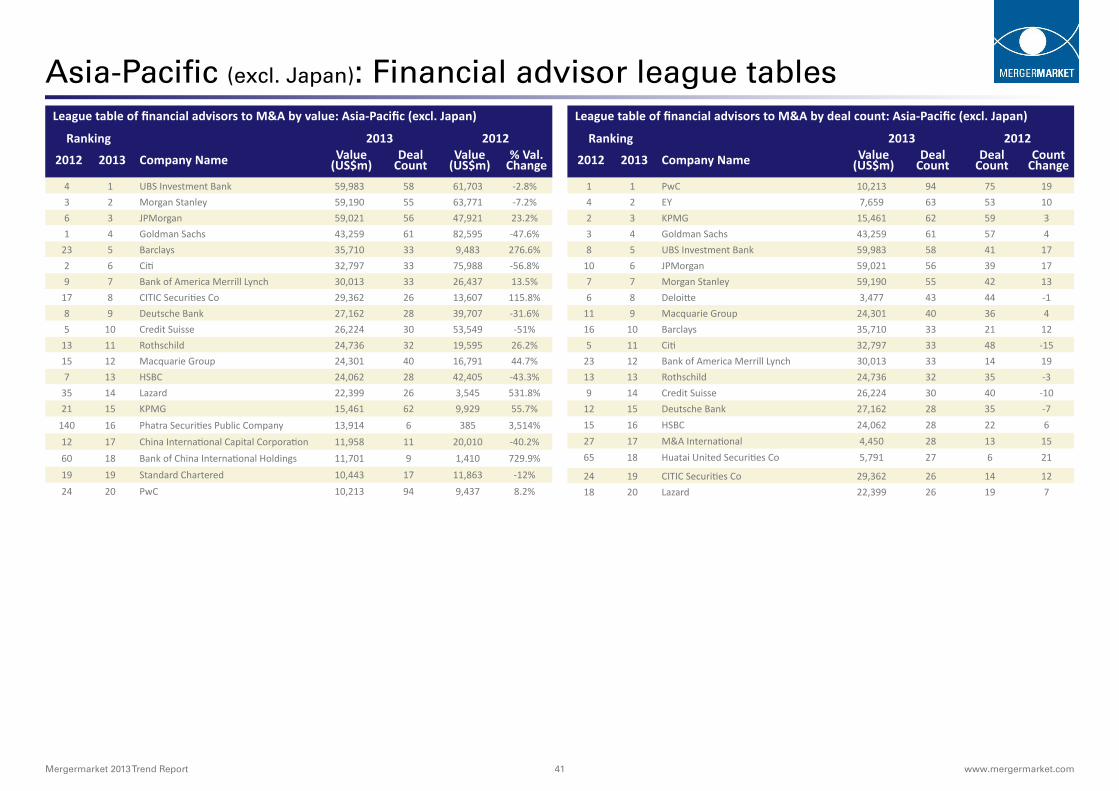
Mergermarket 2013 Trend Report 41 www.mergermarket.com
Asia-Pacific (excl. Japan): Financial advisor league tablesLeague table of financial advisors to M&A by value: Asia-Pacific (excl. Japan)
Ranking 2013 2012
2012 2013 Company Name Value (US$m)
Deal Count
Value (US$m)
% Val. Change
4 1 UBS Investment Bank 59,983 58 61,703 -2.8%3 2 Morgan Stanley 59,190 55 63,771 -7.2%6 3 JPMorgan 59,021 56 47,921 23.2%1 4 Goldman Sachs 43,259 61 82,595 -47.6%
23 5 Barclays 35,710 33 9,483 276.6%2 6 Citi 32,797 33 75,988 -56.8%9 7 Bank of America Merrill Lynch 30,013 33 26,437 13.5%
17 8 CITIC Securities Co 29,362 26 13,607 115.8%8 9 Deutsche Bank 27,162 28 39,707 -31.6%5 10 Credit Suisse 26,224 30 53,549 -51%
13 11 Rothschild 24,736 32 19,595 26.2%15 12 Macquarie Group 24,301 40 16,791 44.7%7 13 HSBC 24,062 28 42,405 -43.3%
35 14 Lazard 22,399 26 3,545 531.8%21 15 KPMG 15,461 62 9,929 55.7%
140 16 Phatra Securities Public Company 13,914 6 385 3,514%12 17 China International Capital Corporation 11,958 11 20,010 -40.2%60 18 Bank of China International Holdings 11,701 9 1,410 729.9%19 19 Standard Chartered 10,443 17 11,863 -12%24 20 PwC 10,213 94 9,437 8.2%
League table of financial advisors to M&A by deal count: Asia-Pacific (excl. Japan)
Ranking 2013 2012
2012 2013 Company Name Value (US$m)
Deal Count
Deal Count
Count Change
1 1 PwC 10,213 94 75 194 2 EY 7,659 63 53 102 3 KPMG 15,461 62 59 33 4 Goldman Sachs 43,259 61 57 48 5 UBS Investment Bank 59,983 58 41 17
10 6 JPMorgan 59,021 56 39 177 7 Morgan Stanley 59,190 55 42 136 8 Deloitte 3,477 43 44 -1
11 9 Macquarie Group 24,301 40 36 416 10 Barclays 35,710 33 21 125 11 Citi 32,797 33 48 -15
23 12 Bank of America Merrill Lynch 30,013 33 14 1913 13 Rothschild 24,736 32 35 -39 14 Credit Suisse 26,224 30 40 -10
12 15 Deutsche Bank 27,162 28 35 -715 16 HSBC 24,062 28 22 627 17 M&A International 4,450 28 13 1565 18 Huatai United Securities Co 5,791 27 6 21
24 19 CITIC Securities Co 29,362 26 14 1218 20 Lazard 22,399 26 19 7
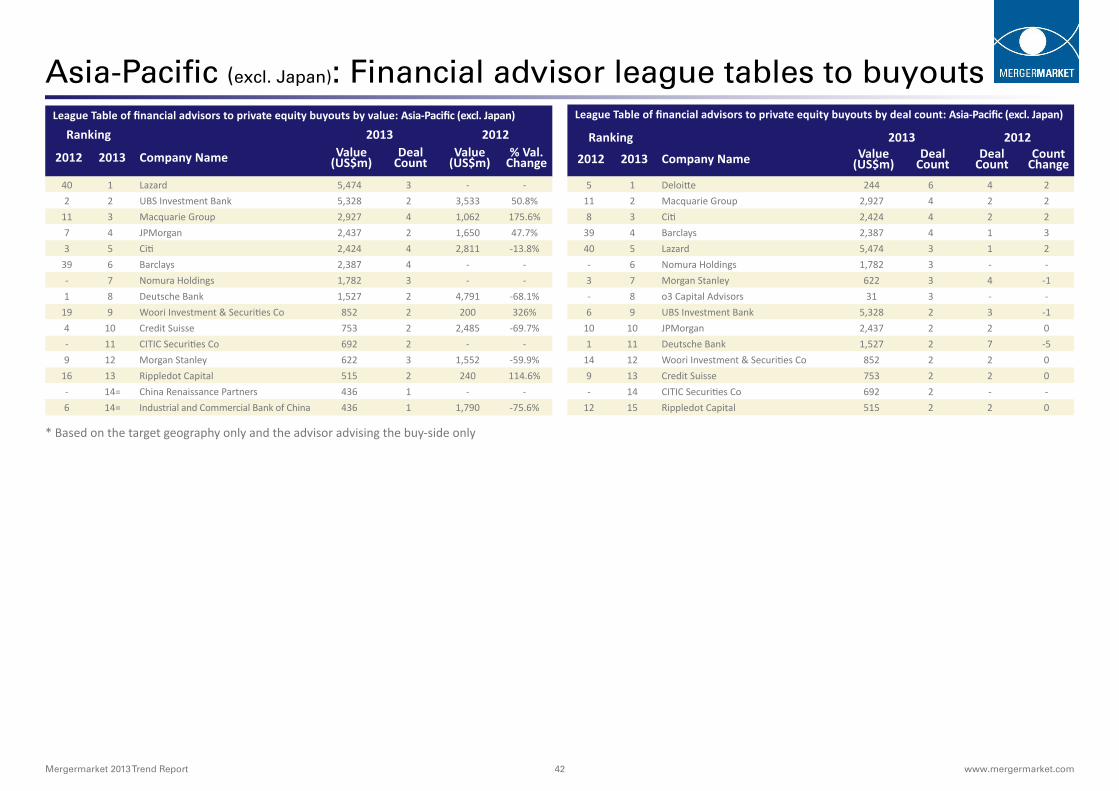
Mergermarket 2013 Trend Report 42 www.mergermarket.com
Asia-Pacific (excl. Japan): Financial advisor league tables to buyoutsLeague Table of financial advisors to private equity buyouts by value: Asia-Pacific (excl. Japan)
Ranking 2013 2012
2012 2013 Company Name Value (US$m)
Deal Count
Value (US$m)
% Val. Change
40 1 Lazard 5,474 3 - -2 2 UBS Investment Bank 5,328 2 3,533 50.8%
11 3 Macquarie Group 2,927 4 1,062 175.6%7 4 JPMorgan 2,437 2 1,650 47.7%3 5 Citi 2,424 4 2,811 -13.8%
39 6 Barclays 2,387 4 - -- 7 Nomura Holdings 1,782 3 - -1 8 Deutsche Bank 1,527 2 4,791 -68.1%
19 9 Woori Investment & Securities Co 852 2 200 326%4 10 Credit Suisse 753 2 2,485 -69.7%- 11 CITIC Securities Co 692 2 - -9 12 Morgan Stanley 622 3 1,552 -59.9%
16 13 Rippledot Capital 515 2 240 114.6%- 14= China Renaissance Partners 436 1 - -6 14= Industrial and Commercial Bank of China 436 1 1,790 -75.6%
League Table of financial advisors to private equity buyouts by deal count: Asia-Pacific (excl. Japan)
Ranking 2013 2012
2012 2013 Company Name Value (US$m)
Deal Count
Deal Count
Count Change
5 1 Deloitte 244 6 4 211 2 Macquarie Group 2,927 4 2 28 3 Citi 2,424 4 2 2
39 4 Barclays 2,387 4 1 340 5 Lazard 5,474 3 1 2- 6 Nomura Holdings 1,782 3 - -3 7 Morgan Stanley 622 3 4 -1- 8 o3 Capital Advisors 31 3 - -6 9 UBS Investment Bank 5,328 2 3 -1
10 10 JPMorgan 2,437 2 2 01 11 Deutsche Bank 1,527 2 7 -5
14 12 Woori Investment & Securities Co 852 2 2 09 13 Credit Suisse 753 2 2 0- 14 CITIC Securities Co 692 2 - -
12 15 Rippledot Capital 515 2 2 0
* Based on the target geography only and the advisor advising the buy-side only
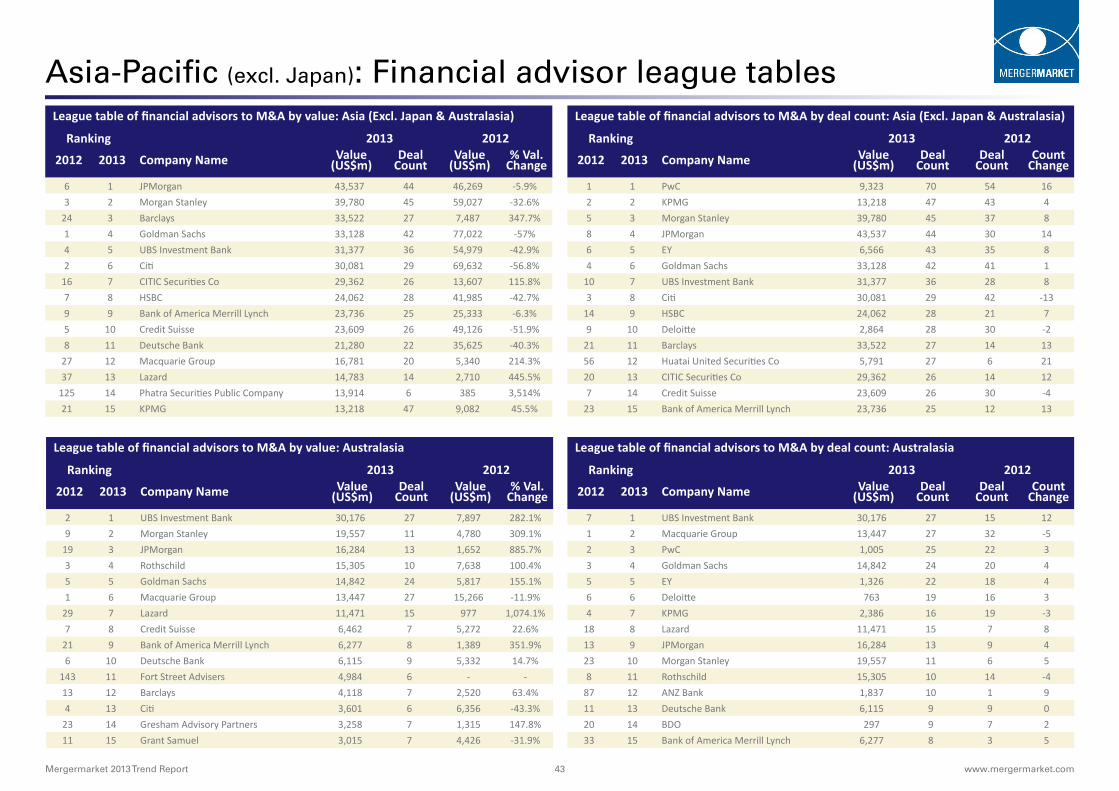
Mergermarket 2013 Trend Report 43 www.mergermarket.com
Asia-Pacific (excl. Japan): Financial advisor league tables League table of financial advisors to M&A by value: Asia (Excl. Japan & Australasia)
Ranking 2013 2012
2012 2013 Company Name Value (US$m)
Deal Count
Value (US$m)
% Val. Change
6 1 JPMorgan 43,537 44 46,269 -5.9%3 2 Morgan Stanley 39,780 45 59,027 -32.6%
24 3 Barclays 33,522 27 7,487 347.7%1 4 Goldman Sachs 33,128 42 77,022 -57%4 5 UBS Investment Bank 31,377 36 54,979 -42.9%2 6 Citi 30,081 29 69,632 -56.8%
16 7 CITIC Securities Co 29,362 26 13,607 115.8%7 8 HSBC 24,062 28 41,985 -42.7%9 9 Bank of America Merrill Lynch 23,736 25 25,333 -6.3%5 10 Credit Suisse 23,609 26 49,126 -51.9%8 11 Deutsche Bank 21,280 22 35,625 -40.3%
27 12 Macquarie Group 16,781 20 5,340 214.3%37 13 Lazard 14,783 14 2,710 445.5%
125 14 Phatra Securities Public Company 13,914 6 385 3,514%21 15 KPMG 13,218 47 9,082 45.5%
League table of financial advisors to M&A by deal count: Asia (Excl. Japan & Australasia)
Ranking 2013 2012
2012 2013 Company Name Value (US$m)
Deal Count
Deal Count
Count Change
1 1 PwC 9,323 70 54 162 2 KPMG 13,218 47 43 45 3 Morgan Stanley 39,780 45 37 88 4 JPMorgan 43,537 44 30 146 5 EY 6,566 43 35 84 6 Goldman Sachs 33,128 42 41 1
10 7 UBS Investment Bank 31,377 36 28 83 8 Citi 30,081 29 42 -13
14 9 HSBC 24,062 28 21 79 10 Deloitte 2,864 28 30 -2
21 11 Barclays 33,522 27 14 1356 12 Huatai United Securities Co 5,791 27 6 2120 13 CITIC Securities Co 29,362 26 14 127 14 Credit Suisse 23,609 26 30 -4
23 15 Bank of America Merrill Lynch 23,736 25 12 13
League table of financial advisors to M&A by value: Australasia
Ranking 2013 2012
2012 2013 Company Name Value (US$m)
Deal Count
Value (US$m)
% Val. Change
2 1 UBS Investment Bank 30,176 27 7,897 282.1%9 2 Morgan Stanley 19,557 11 4,780 309.1%
19 3 JPMorgan 16,284 13 1,652 885.7%3 4 Rothschild 15,305 10 7,638 100.4%5 5 Goldman Sachs 14,842 24 5,817 155.1%1 6 Macquarie Group 13,447 27 15,266 -11.9%
29 7 Lazard 11,471 15 977 1,074.1%7 8 Credit Suisse 6,462 7 5,272 22.6%
21 9 Bank of America Merrill Lynch 6,277 8 1,389 351.9%6 10 Deutsche Bank 6,115 9 5,332 14.7%
143 11 Fort Street Advisers 4,984 6 - -13 12 Barclays 4,118 7 2,520 63.4%4 13 Citi 3,601 6 6,356 -43.3%
23 14 Gresham Advisory Partners 3,258 7 1,315 147.8%11 15 Grant Samuel 3,015 7 4,426 -31.9%
League table of financial advisors to M&A by deal count: Australasia
Ranking 2013 2012
2012 2013 Company Name Value (US$m)
Deal Count
Deal Count
Count Change
7 1 UBS Investment Bank 30,176 27 15 121 2 Macquarie Group 13,447 27 32 -52 3 PwC 1,005 25 22 33 4 Goldman Sachs 14,842 24 20 45 5 EY 1,326 22 18 46 6 Deloitte 763 19 16 34 7 KPMG 2,386 16 19 -3
18 8 Lazard 11,471 15 7 813 9 JPMorgan 16,284 13 9 423 10 Morgan Stanley 19,557 11 6 58 11 Rothschild 15,305 10 14 -4
87 12 ANZ Bank 1,837 10 1 911 13 Deutsche Bank 6,115 9 9 020 14 BDO 297 9 7 233 15 Bank of America Merrill Lynch 6,277 8 3 5
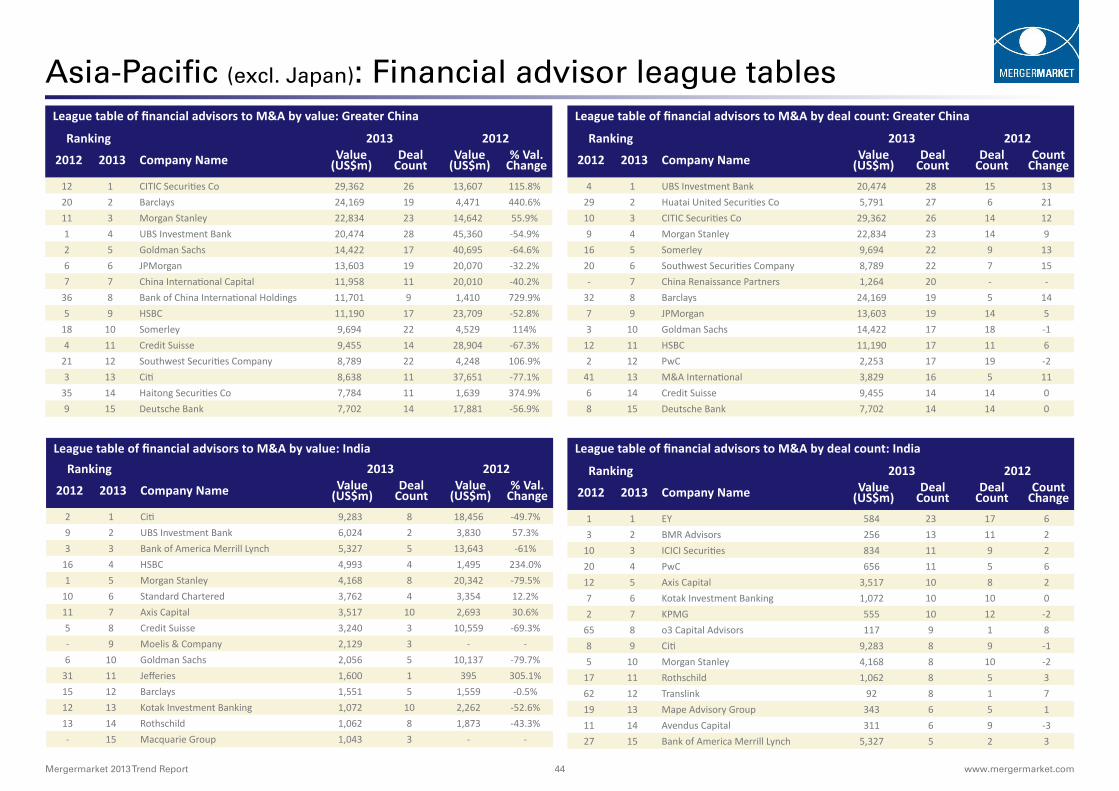
Mergermarket 2013 Trend Report 44 www.mergermarket.com
Asia-Pacific (excl. Japan): Financial advisor league tables League table of financial advisors to M&A by value: Greater China
Ranking 2013 2012
2012 2013 Company Name Value (US$m)
Deal Count
Value (US$m)
% Val. Change
12 1 CITIC Securities Co 29,362 26 13,607 115.8%20 2 Barclays 24,169 19 4,471 440.6%11 3 Morgan Stanley 22,834 23 14,642 55.9%1 4 UBS Investment Bank 20,474 28 45,360 -54.9%2 5 Goldman Sachs 14,422 17 40,695 -64.6%6 6 JPMorgan 13,603 19 20,070 -32.2%7 7 China International Capital 11,958 11 20,010 -40.2%
36 8 Bank of China International Holdings 11,701 9 1,410 729.9%5 9 HSBC 11,190 17 23,709 -52.8%
18 10 Somerley 9,694 22 4,529 114%4 11 Credit Suisse 9,455 14 28,904 -67.3%
21 12 Southwest Securities Company 8,789 22 4,248 106.9%3 13 Citi 8,638 11 37,651 -77.1%
35 14 Haitong Securities Co 7,784 11 1,639 374.9%9 15 Deutsche Bank 7,702 14 17,881 -56.9%
League table of financial advisors to M&A by deal count: Greater China
Ranking 2013 2012
2012 2013 Company Name Value (US$m)
Deal Count
Deal Count
Count Change
4 1 UBS Investment Bank 20,474 28 15 1329 2 Huatai United Securities Co 5,791 27 6 2110 3 CITIC Securities Co 29,362 26 14 129 4 Morgan Stanley 22,834 23 14 9
16 5 Somerley 9,694 22 9 1320 6 Southwest Securities Company 8,789 22 7 15- 7 China Renaissance Partners 1,264 20 - -
32 8 Barclays 24,169 19 5 147 9 JPMorgan 13,603 19 14 53 10 Goldman Sachs 14,422 17 18 -1
12 11 HSBC 11,190 17 11 62 12 PwC 2,253 17 19 -2
41 13 M&A International 3,829 16 5 116 14 Credit Suisse 9,455 14 14 08 15 Deutsche Bank 7,702 14 14 0
League table of financial advisors to M&A by value: IndiaRanking 2013 2012
2012 2013 Company Name Value (US$m)
Deal Count
Value (US$m)
% Val. Change
2 1 Citi 9,283 8 18,456 -49.7%9 2 UBS Investment Bank 6,024 2 3,830 57.3%3 3 Bank of America Merrill Lynch 5,327 5 13,643 -61%
16 4 HSBC 4,993 4 1,495 234.0%1 5 Morgan Stanley 4,168 8 20,342 -79.5%
10 6 Standard Chartered 3,762 4 3,354 12.2%11 7 Axis Capital 3,517 10 2,693 30.6%5 8 Credit Suisse 3,240 3 10,559 -69.3%- 9 Moelis & Company 2,129 3 - -6 10 Goldman Sachs 2,056 5 10,137 -79.7%
31 11 Jefferies 1,600 1 395 305.1%15 12 Barclays 1,551 5 1,559 -0.5%12 13 Kotak Investment Banking 1,072 10 2,262 -52.6%13 14 Rothschild 1,062 8 1,873 -43.3%- 15 Macquarie Group 1,043 3 - -
League table of financial advisors to M&A by deal count: India
Ranking 2013 2012
2012 2013 Company Name Value (US$m)
Deal Count
Deal Count
Count Change
1 1 EY 584 23 17 63 2 BMR Advisors 256 13 11 2
10 3 ICICI Securities 834 11 9 220 4 PwC 656 11 5 612 5 Axis Capital 3,517 10 8 27 6 Kotak Investment Banking 1,072 10 10 02 7 KPMG 555 10 12 -2
65 8 o3 Capital Advisors 117 9 1 88 9 Citi 9,283 8 9 -15 10 Morgan Stanley 4,168 8 10 -2
17 11 Rothschild 1,062 8 5 362 12 Translink 92 8 1 719 13 Mape Advisory Group 343 6 5 111 14 Avendus Capital 311 6 9 -327 15 Bank of America Merrill Lynch 5,327 5 2 3
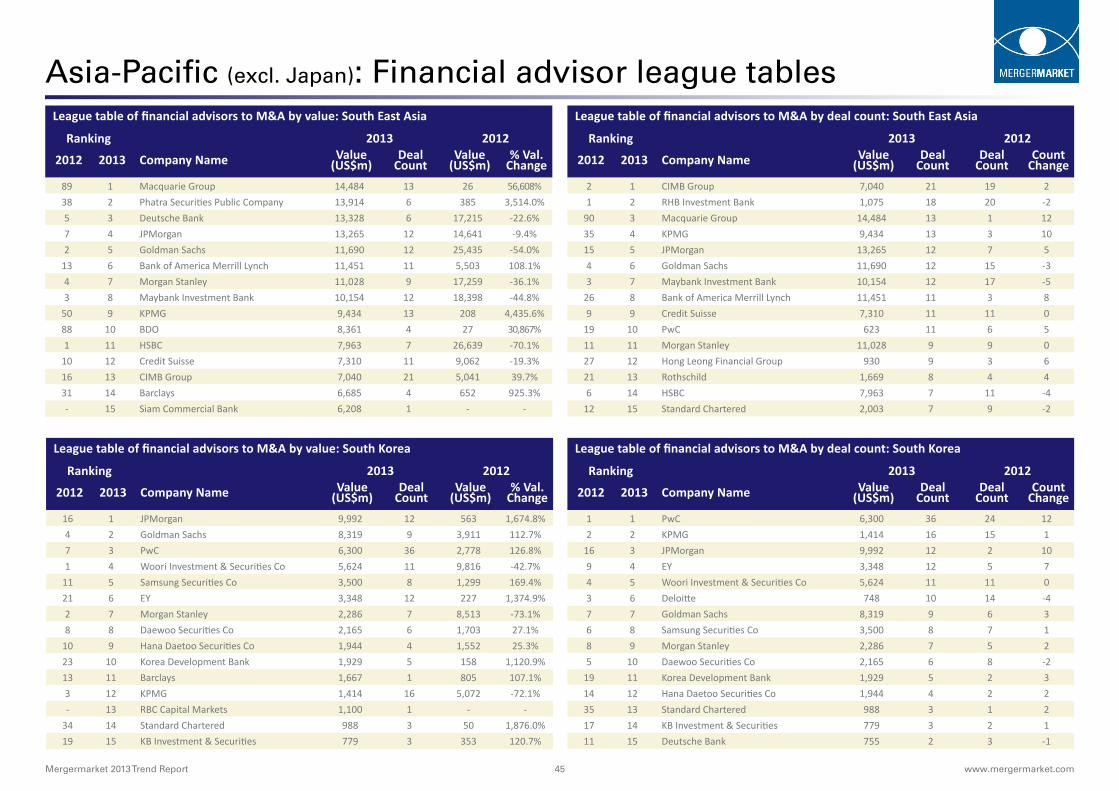
Mergermarket 2013 Trend Report 45 www.mergermarket.com
Asia-Pacific (excl. Japan): Financial advisor league tables League table of financial advisors to M&A by value: South East Asia
Ranking 2013 2012
2012 2013 Company Name Value (US$m)
Deal Count
Value (US$m)
% Val. Change
89 1 Macquarie Group 14,484 13 26 56,608%38 2 Phatra Securities Public Company 13,914 6 385 3,514.0%5 3 Deutsche Bank 13,328 6 17,215 -22.6%7 4 JPMorgan 13,265 12 14,641 -9.4%2 5 Goldman Sachs 11,690 12 25,435 -54.0%
13 6 Bank of America Merrill Lynch 11,451 11 5,503 108.1%4 7 Morgan Stanley 11,028 9 17,259 -36.1%3 8 Maybank Investment Bank 10,154 12 18,398 -44.8%
50 9 KPMG 9,434 13 208 4,435.6%88 10 BDO 8,361 4 27 30,867%1 11 HSBC 7,963 7 26,639 -70.1%
10 12 Credit Suisse 7,310 11 9,062 -19.3%16 13 CIMB Group 7,040 21 5,041 39.7%31 14 Barclays 6,685 4 652 925.3%- 15 Siam Commercial Bank 6,208 1 - -
League table of financial advisors to M&A by deal count: South East Asia
Ranking 2013 2012
2012 2013 Company Name Value (US$m)
Deal Count
Deal Count
Count Change
2 1 CIMB Group 7,040 21 19 21 2 RHB Investment Bank 1,075 18 20 -2
90 3 Macquarie Group 14,484 13 1 1235 4 KPMG 9,434 13 3 1015 5 JPMorgan 13,265 12 7 54 6 Goldman Sachs 11,690 12 15 -33 7 Maybank Investment Bank 10,154 12 17 -5
26 8 Bank of America Merrill Lynch 11,451 11 3 89 9 Credit Suisse 7,310 11 11 0
19 10 PwC 623 11 6 511 11 Morgan Stanley 11,028 9 9 027 12 Hong Leong Financial Group 930 9 3 621 13 Rothschild 1,669 8 4 46 14 HSBC 7,963 7 11 -4
12 15 Standard Chartered 2,003 7 9 -2
League table of financial advisors to M&A by value: South Korea
Ranking 2013 2012
2012 2013 Company Name Value (US$m)
Deal Count
Value (US$m)
% Val. Change
16 1 JPMorgan 9,992 12 563 1,674.8%4 2 Goldman Sachs 8,319 9 3,911 112.7%7 3 PwC 6,300 36 2,778 126.8%1 4 Woori Investment & Securities Co 5,624 11 9,816 -42.7%
11 5 Samsung Securities Co 3,500 8 1,299 169.4%21 6 EY 3,348 12 227 1,374.9%2 7 Morgan Stanley 2,286 7 8,513 -73.1%8 8 Daewoo Securities Co 2,165 6 1,703 27.1%
10 9 Hana Daetoo Securities Co 1,944 4 1,552 25.3%23 10 Korea Development Bank 1,929 5 158 1,120.9%13 11 Barclays 1,667 1 805 107.1%3 12 KPMG 1,414 16 5,072 -72.1%- 13 RBC Capital Markets 1,100 1 - -
34 14 Standard Chartered 988 3 50 1,876.0%19 15 KB Investment & Securities 779 3 353 120.7%
League table of financial advisors to M&A by deal count: South Korea
Ranking 2013 2012
2012 2013 Company Name Value (US$m)
Deal Count
Deal Count
Count Change
1 1 PwC 6,300 36 24 122 2 KPMG 1,414 16 15 1
16 3 JPMorgan 9,992 12 2 109 4 EY 3,348 12 5 74 5 Woori Investment & Securities Co 5,624 11 11 03 6 Deloitte 748 10 14 -47 7 Goldman Sachs 8,319 9 6 36 8 Samsung Securities Co 3,500 8 7 18 9 Morgan Stanley 2,286 7 5 25 10 Daewoo Securities Co 2,165 6 8 -2
19 11 Korea Development Bank 1,929 5 2 314 12 Hana Daetoo Securities Co 1,944 4 2 235 13 Standard Chartered 988 3 1 217 14 KB Investment & Securities 779 3 2 111 15 Deutsche Bank 755 2 3 -1
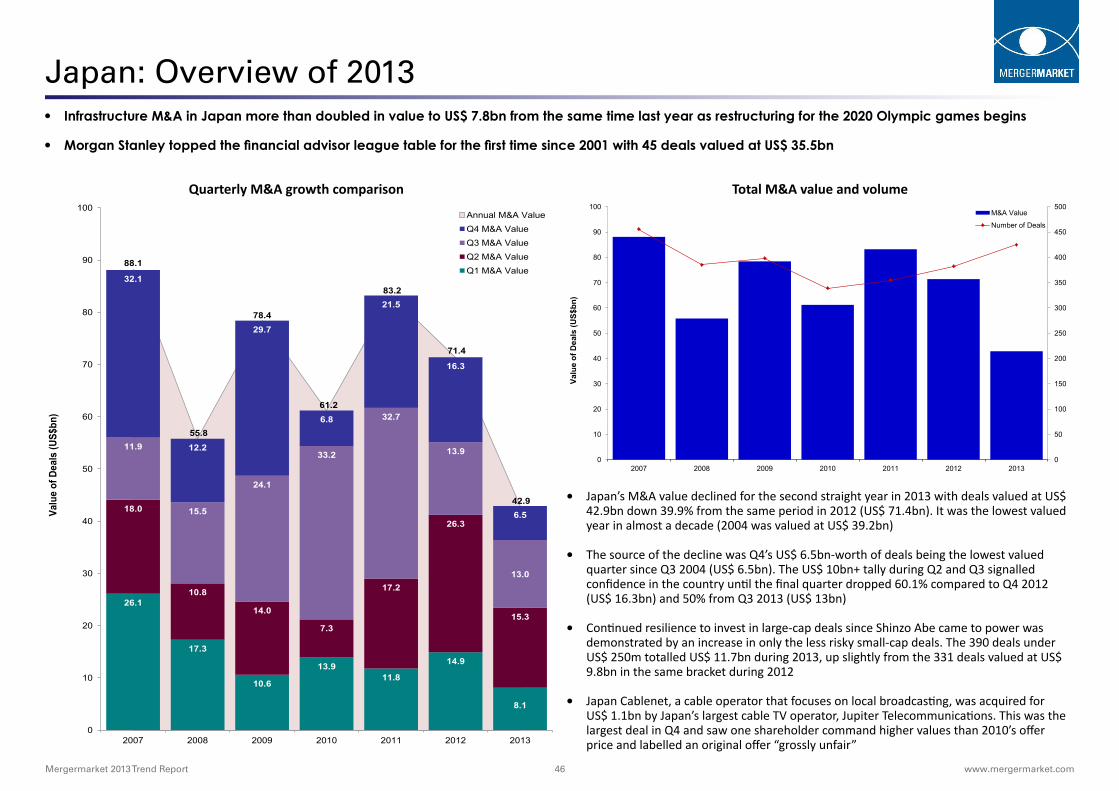
Mergermarket 2013 Trend Report 46 www.mergermarket.com
Total M&A value and volumeQuarterly M&A growth comparison
Japan: Overview of 2013 • Infrastructure M&A in Japan more than doubled in value to US$ 7.8bn from the same time last year as restructuring for the 2020 Olympic games begins
• Morgan Stanley topped the financial advisor league table for the first time since 2001 with 45 deals valued at US$ 35.5bn
88.1
55.8
78.4
61.2
83.2
71.4
42.9
26.1
17.3
10.6
13.9 11.8
14.9
8.1
18.0
10.8
14.0
7.3
17.2
26.3
15.3
11.9
15.5
24.1
33.2
32.7
13.9
13.0
32.1
12.2
29.7
6.8
21.5
16.3
6.5
0
10
20
30
40
50
60
70
80
90
100
2007 2008 2009 2010 2011 2012 2013
Valu
e of
Dea
ls (U
S$bn
)
Annual M&A Value Q4 M&A Value Q3 M&A Value Q2 M&A Value Q1 M&A Value
0
50
100
150
200
250
300
350
400
450
500
0
10
20
30
40
50
60
70
80
90
100
2007 2008 2009 2010 2011 2012 2013
Valu
e of
Dea
ls (U
S$bn
)
M&A Value
Number of Deals
Num
ber o
f Dea
ls
• Japan’s M&A value declined for the second straight year in 2013 with deals valued at US$ 42.9bn down 39.9% from the same period in 2012 (US$ 71.4bn). It was the lowest valued year in almost a decade (2004 was valued at US$ 39.2bn)
• The source of the decline was Q4’s US$ 6.5bn-worth of deals being the lowest valued quarter since Q3 2004 (US$ 6.5bn). The US$ 10bn+ tally during Q2 and Q3 signalled confidence in the country until the final quarter dropped 60.1% compared to Q4 2012 (US$ 16.3bn) and 50% from Q3 2013 (US$ 13bn)
• Continued resilience to invest in large-cap deals since Shinzo Abe came to power was demonstrated by an increase in only the less risky small-cap deals. The 390 deals under US$ 250m totalled US$ 11.7bn during 2013, up slightly from the 331 deals valued at US$ 9.8bn in the same bracket during 2012
• Japan Cablenet, a cable operator that focuses on local broadcasting, was acquired for US$ 1.1bn by Japan’s largest cable TV operator, Jupiter Telecommunications. This was the largest deal in Q4 and saw one shareholder command higher values than 2010’s offer price and labelled an original offer “grossly unfair”

Mergermarket 2013 Trend Report 47 www.mergermarket.com
Japan: Industry and Cross-border analysis
0
50
100
150
200
250
300
0
20
40
60
80
100
120
140
2004 2005 2006 2007 2008 2009 2010 2011 2012 2013
Num
ber o
f Dea
ls
Valu
e of
Dea
ls (U
S$bn
)
Outbound M&A Value
Inbound M&A Value
Inbound Number of Deals
Outbound Number of Deals
• he climb in value can be attributed to the US-based Applied Materials acquisition of Tokyo Electron for US$ 8.7bn in Q3 which contributed 68% to the total value of inbound transactions
• If the Tokyo Electron deal was excluded from the total deal value, there were only 33 inbound transactions worth US$ 4.1bn, representing a sizeable 58.6% drop compared to 2012’s total of US$ 9.9bn. It would also have resulted in the lowest total value of inbound deals since 2006 (US$ 2.7bn)
• Subdued inbound deals during Q2 (US$ 0.4bn) and Q4 (US$ 1.1bn) were responsible for the annual decline. Q4 was down 89.7% compared to Q3 (US$ 10.3bn) and if the Tokyo Electron deal was excluded from Q3’s total, Q4 would still represent a 31.3% decrease
• Outbound deal value saw a quarter-on-quarter recovery during 2013 ending Q3 with US$ 21.6bn-worth of deals. The climb in deal value ceased in Q4 though with a 39.4% decline from Q3 to US$ 13.1bn. The total value of outbound deals during 2013 was US$ 47.4bn, down 58.8% from 2012 (US$ 115.2bn)
• Japan’s Infrastructure M&A (Real Estate, Construction and Transportation) during 2013 more than doubled by value compared to 2012, up 95% to US$ 7.8bn from US$ 4bn. These Infrastructure sub-sectors made up half of the sectors to increase deal values compared to 2012 (the other were Business Services, Leisure and Pharma, Medical & Biotech)
• The highest value increase in any of the Infrastructure related sub-sectors was in Construction M&A, due to the third largest deal of the year targeting Hajime Construction for US$ 2.1bn in June. The 16 domestic Construction deals during the year were valued at US$ 3.1bn, up 138.5% compared to 2012’s US$ 1.3bn. The sector has steadily increased in value since 2011 (US$ 0.3bn)
• The market share of TMT M&A during 2013 (US$ 12.8bn) increased to 29.8% from 26.5% during 2012 (US$ 18.9bn). This was due to Technology M&A, valued at US$ 11.3bn, making up 88.3% of the total value. After three years of inclining deal value, Technology M&A in Japan has reached the highest value on Mergermarket record (since 2001) at US$ 11.3bn, up 6.6% from its previous peak in 2012 (US$ 10.6bn)
3.2% 1.8%
12.2%
24.8%
5.9% 19.4%
1.8% 0.6% 3.6%
26.5%
5.6%
7.2%
13.3%
8.4%
4.7%
12.1% 3.3% 4.7%
10.7%
29.8%
0.2%
Agriculture: US$ 0bn (US$ -bn)
Business Services: US$ 2.4bn (US$ 2.3bn)
Construction: US$ 3.1bn (US$ 1.3bn)
Consumer: US$ 5.7bn (US$ 8.7bn)
Energy, Mining & Utilities: US$ 3.6bn (US$ 17.7bn)
Financial Services: US$ 2bn (US$ 4.2bn)
Industrials & Chemicals: US$ 5.2bn (US$ 13.8bn)
Leisure: US$ 1.4bn (US$ 1.3bn)
Pharma, Medical & Biotech: US$ 2bn (US$ 0.4bn)
Real Estate: US$ 4.6bn (US$ 2.6bn)
TMT: US$ 12.8bn (US$ 18.9bn)
2012
2013
Japanese cross-border analysis2013 vs. (2012) value and market share comparison
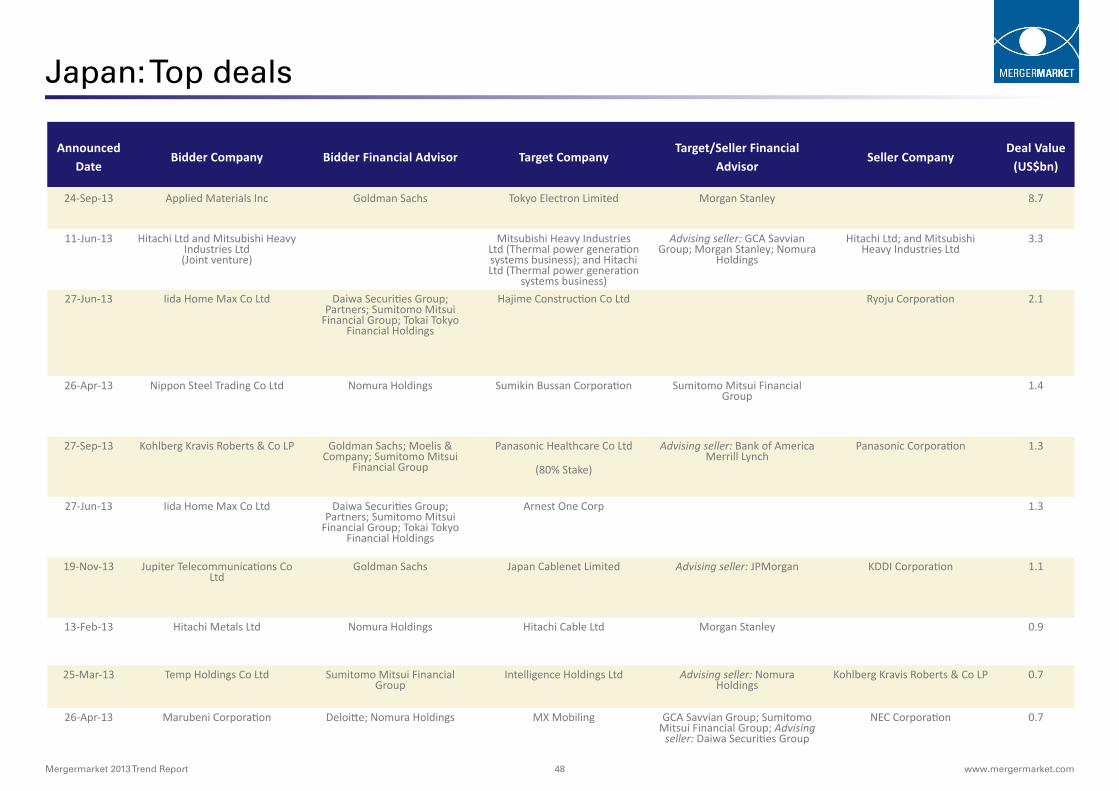
Mergermarket 2013 Trend Report 48 www.mergermarket.com
Japan: Top deals
Announced Date
Bidder Company Bidder Financial Advisor Target CompanyTarget/Seller Financial
AdvisorSeller Company
Deal Value (US$bn)
24-Sep-13 Applied Materials Inc Goldman Sachs Tokyo Electron Limited Morgan Stanley 8.7
11-Jun-13 Hitachi Ltd and Mitsubishi Heavy Industries Ltd (Joint venture)
Mitsubishi Heavy Industries Ltd (Thermal power generation systems business); and Hitachi Ltd (Thermal power generation
systems business)
Advising seller: GCA Savvian Group; Morgan Stanley; Nomura
Holdings
Hitachi Ltd; and Mitsubishi Heavy Industries Ltd
3.3
27-Jun-13 Iida Home Max Co Ltd Daiwa Securities Group; Partners; Sumitomo Mitsui
Financial Group; Tokai Tokyo Financial Holdings
Hajime Construction Co Ltd Ryoju Corporation 2.1
26-Apr-13 Nippon Steel Trading Co Ltd Nomura Holdings Sumikin Bussan Corporation Sumitomo Mitsui Financial Group
1.4
27-Sep-13 Kohlberg Kravis Roberts & Co LP Goldman Sachs; Moelis & Company; Sumitomo Mitsui
Financial Group
Panasonic Healthcare Co Ltd
(80% Stake)
Advising seller: Bank of America Merrill Lynch
Panasonic Corporation 1.3
27-Jun-13 Iida Home Max Co Ltd Daiwa Securities Group; Partners; Sumitomo Mitsui
Financial Group; Tokai Tokyo Financial Holdings
Arnest One Corp 1.3
19-Nov-13 Jupiter Telecommunications Co Ltd
Goldman Sachs Japan Cablenet Limited Advising seller: JPMorgan KDDI Corporation 1.1
13-Feb-13 Hitachi Metals Ltd Nomura Holdings Hitachi Cable Ltd Morgan Stanley 0.9
25-Mar-13 Temp Holdings Co Ltd Sumitomo Mitsui Financial Group
Intelligence Holdings Ltd Advising seller: Nomura Holdings
Kohlberg Kravis Roberts & Co LP 0.7
26-Apr-13 Marubeni Corporation Deloitte; Nomura Holdings MX Mobiling GCA Savvian Group; Sumitomo Mitsui Financial Group; Advising
seller: Daiwa Securities Group
NEC Corporation 0.7
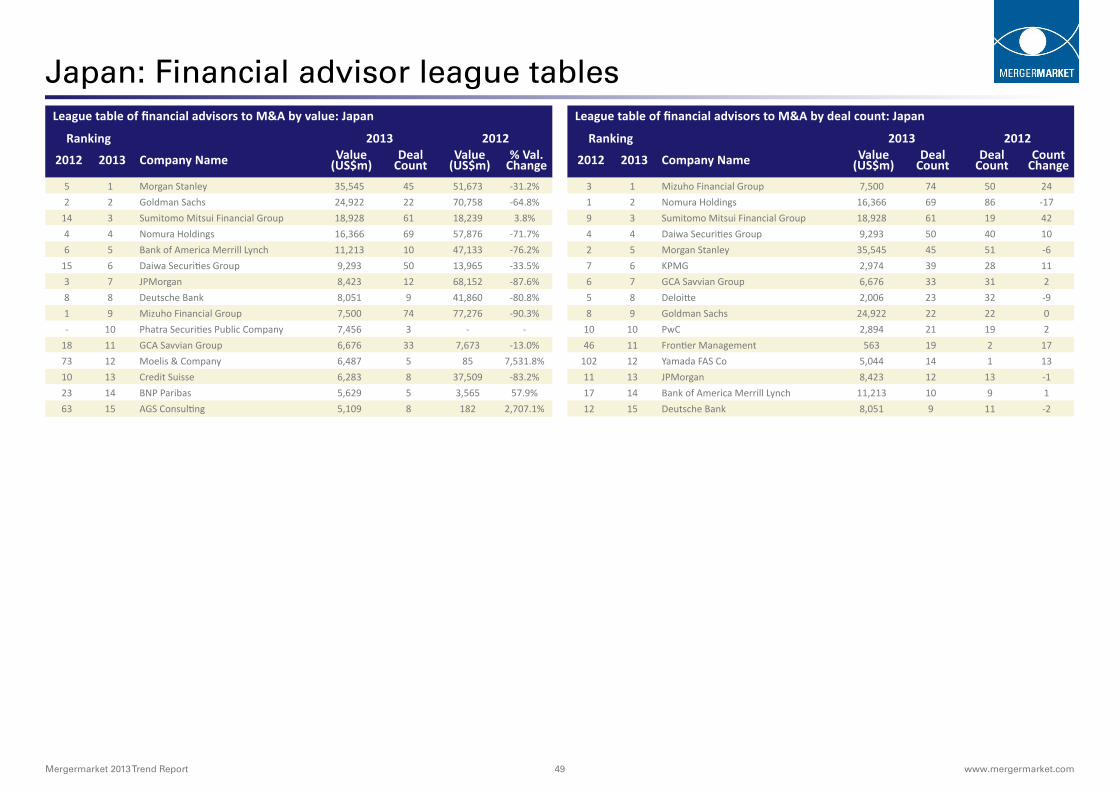
Mergermarket 2013 Trend Report 49 www.mergermarket.com
Japan: Financial advisor league tablesLeague table of financial advisors to M&A by value: Japan
Ranking 2013 2012
2012 2013 Company Name Value (US$m)
Deal Count
Value (US$m)
% Val. Change
5 1 Morgan Stanley 35,545 45 51,673 -31.2%2 2 Goldman Sachs 24,922 22 70,758 -64.8%
14 3 Sumitomo Mitsui Financial Group 18,928 61 18,239 3.8%4 4 Nomura Holdings 16,366 69 57,876 -71.7%6 5 Bank of America Merrill Lynch 11,213 10 47,133 -76.2%
15 6 Daiwa Securities Group 9,293 50 13,965 -33.5%3 7 JPMorgan 8,423 12 68,152 -87.6%8 8 Deutsche Bank 8,051 9 41,860 -80.8%1 9 Mizuho Financial Group 7,500 74 77,276 -90.3%- 10 Phatra Securities Public Company 7,456 3 - -
18 11 GCA Savvian Group 6,676 33 7,673 -13.0%73 12 Moelis & Company 6,487 5 85 7,531.8%10 13 Credit Suisse 6,283 8 37,509 -83.2%23 14 BNP Paribas 5,629 5 3,565 57.9%63 15 AGS Consulting 5,109 8 182 2,707.1%
League table of financial advisors to M&A by deal count: Japan
Ranking 2013 2012
2012 2013 Company Name Value (US$m)
Deal Count
Deal Count
Count Change
3 1 Mizuho Financial Group 7,500 74 50 241 2 Nomura Holdings 16,366 69 86 -179 3 Sumitomo Mitsui Financial Group 18,928 61 19 424 4 Daiwa Securities Group 9,293 50 40 102 5 Morgan Stanley 35,545 45 51 -67 6 KPMG 2,974 39 28 116 7 GCA Savvian Group 6,676 33 31 25 8 Deloitte 2,006 23 32 -98 9 Goldman Sachs 24,922 22 22 0
10 10 PwC 2,894 21 19 246 11 Frontier Management 563 19 2 17
102 12 Yamada FAS Co 5,044 14 1 1311 13 JPMorgan 8,423 12 13 -117 14 Bank of America Merrill Lynch 11,213 10 9 112 15 Deutsche Bank 8,051 9 11 -2
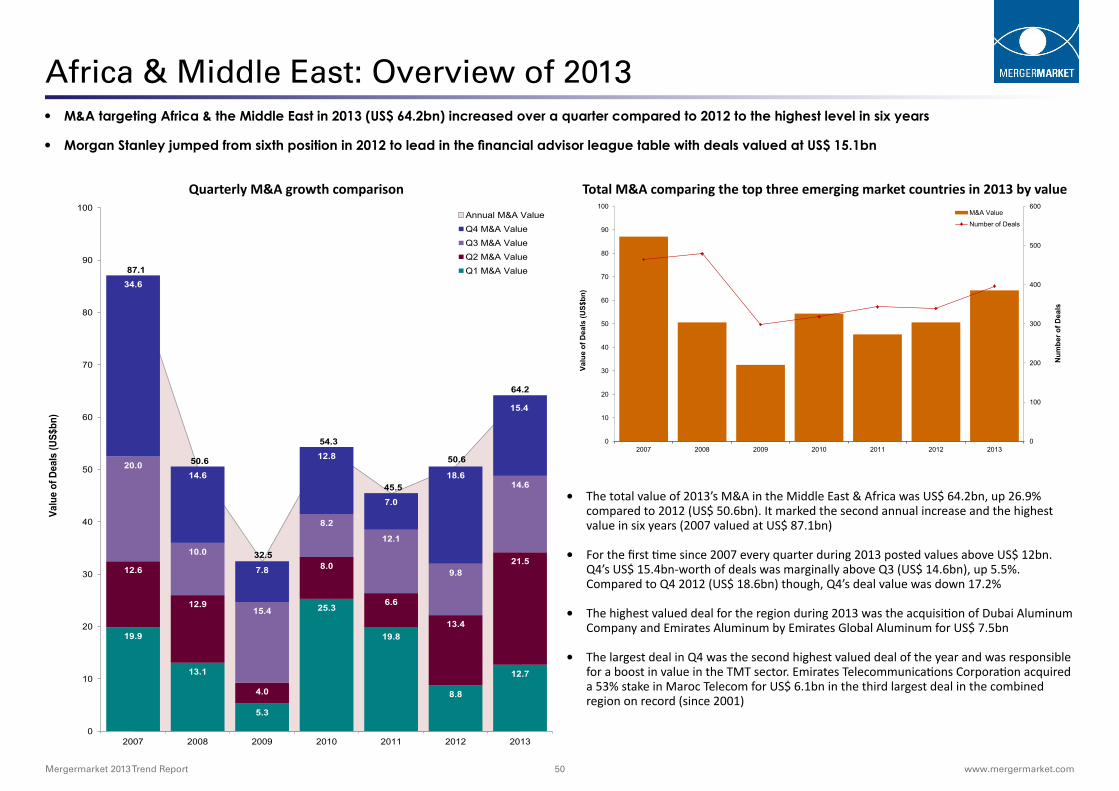
Mergermarket 2013 Trend Report 50 www.mergermarket.com
Quarterly M&A growth comparison Total M&A comparing the top three emerging market countries in 2013 by value
Africa & Middle East: Overview of 2013 • M&A targeting Africa & the Middle East in 2013 (US$ 64.2bn) increased over a quarter compared to 2012 to the highest level in six years
• Morgan Stanley jumped from sixth position in 2012 to lead in the financial advisor league table with deals valued at US$ 15.1bn
87.1
50.6
32.5
54.3
45.5
50.6
64.2
19.9
13.1
5.3
25.3
19.8
8.8
12.7
12.6
12.9
4.0
8.0
6.6
13.4
21.5
20.0
10.0
15.4
8.2
12.1
9.8
14.6
34.6
14.6
7.8
12.8
7.0
18.6
15.4
0
10
20
30
40
50
60
70
80
90
100
2007 2008 2009 2010 2011 2012 2013
Valu
e of
Dea
ls (U
S$bn
)
Annual M&A Value Q4 M&A Value Q3 M&A Value Q2 M&A Value Q1 M&A Value
0
100
200
300
400
500
600
0
10
20
30
40
50
60
70
80
90
100
2007 2008 2009 2010 2011 2012 2013
Valu
e of
Dea
ls (U
S$bn
)
M&A Value
Number of Deals
Num
ber o
f Dea
ls
• The total value of 2013’s M&A in the Middle East & Africa was US$ 64.2bn, up 26.9% compared to 2012 (US$ 50.6bn). It marked the second annual increase and the highest value in six years (2007 valued at US$ 87.1bn)
• For the first time since 2007 every quarter during 2013 posted values above US$ 12bn. Q4’s US$ 15.4bn-worth of deals was marginally above Q3 (US$ 14.6bn), up 5.5%. Compared to Q4 2012 (US$ 18.6bn) though, Q4’s deal value was down 17.2%
• The highest valued deal for the region during 2013 was the acquisition of Dubai Aluminum Company and Emirates Aluminum by Emirates Global Aluminum for US$ 7.5bn
• The largest deal in Q4 was the second highest valued deal of the year and was responsible for a boost in value in the TMT sector. Emirates Telecommunications Corporation acquired a 53% stake in Maroc Telecom for US$ 6.1bn in the third largest deal in the combined region on record (since 2001)
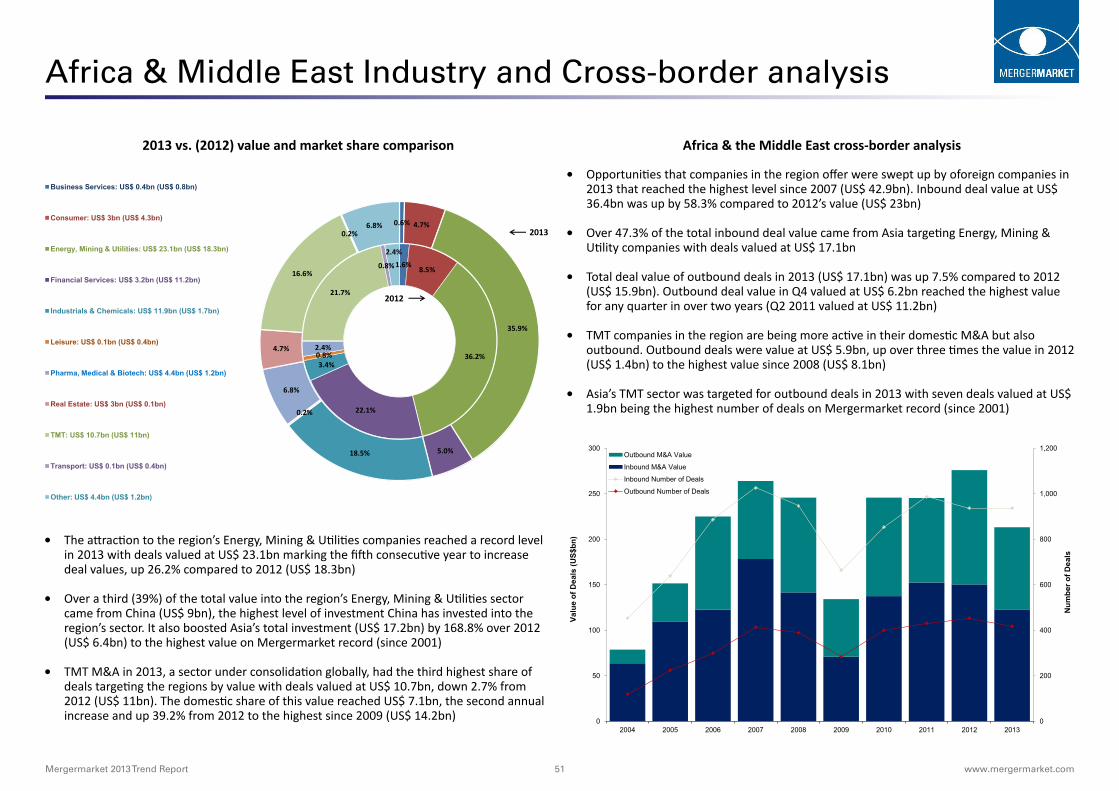
Mergermarket 2013 Trend Report 51 www.mergermarket.com
Africa & Middle East Industry and Cross-border analysis
0
200
400
600
800
1,000
1,200
0
50
100
150
200
250
300
2004 2005 2006 2007 2008 2009 2010 2011 2012 2013
Num
ber o
f Dea
ls
Valu
e of
Dea
ls (U
S$bn
)
Outbound M&A Value
Inbound M&A Value
Inbound Number of Deals
Outbound Number of Deals
• Opportunities that companies in the region offer were swept up by oforeign companies in 2013 that reached the highest level since 2007 (US$ 42.9bn). Inbound deal value at US$ 36.4bn was up by 58.3% compared to 2012’s value (US$ 23bn)
• Over 47.3% of the total inbound deal value came from Asia targeting Energy, Mining & Utility companies with deals valued at US$ 17.1bn
• Total deal value of outbound deals in 2013 (US$ 17.1bn) was up 7.5% compared to 2012 (US$ 15.9bn). Outbound deal value in Q4 valued at US$ 6.2bn reached the highest value for any quarter in over two years (Q2 2011 valued at US$ 11.2bn)
• TMT companies in the region are being more active in their domestic M&A but also outbound. Outbound deals were value at US$ 5.9bn, up over three times the value in 2012 (US$ 1.4bn) to the highest value since 2008 (US$ 8.1bn)
• Asia’s TMT sector was targeted for outbound deals in 2013 with seven deals valued at US$ 1.9bn being the highest number of deals on Mergermarket record (since 2001)
• The attraction to the region’s Energy, Mining & Utilities companies reached a record level in 2013 with deals valued at US$ 23.1bn marking the fifth consecutive year to increase deal values, up 26.2% compared to 2012 (US$ 18.3bn)
• Over a third (39%) of the total value into the region’s Energy, Mining & Utilities sector came from China (US$ 9bn), the highest level of investment China has invested into the region’s sector. It also boosted Asia’s total investment (US$ 17.2bn) by 168.8% over 2012 (US$ 6.4bn) to the highest value on Mergermarket record (since 2001)
• TMT M&A in 2013, a sector under consolidation globally, had the third highest share of deals targeting the regions by value with deals valued at US$ 10.7bn, down 2.7% from 2012 (US$ 11bn). The domestic share of this value reached US$ 7.1bn, the second annual increase and up 39.2% from 2012 to the highest since 2009 (US$ 14.2bn)
1.6% 8.5%
36.2%
22.1%
3.4% 0.8% 2.4%
21.7%
0.8%
2.4%
0.6% 4.7%
35.9%
5.0% 18.5%
0.2%
6.8%
4.7%
16.6%
0.2% 6.8%
Business Services: US$ 0.4bn (US$ 0.8bn)
Consumer: US$ 3bn (US$ 4.3bn)
Energy, Mining & Utilities: US$ 23.1bn (US$ 18.3bn)
Financial Services: US$ 3.2bn (US$ 11.2bn)
Industrials & Chemicals: US$ 11.9bn (US$ 1.7bn)
Leisure: US$ 0.1bn (US$ 0.4bn)
Pharma, Medical & Biotech: US$ 4.4bn (US$ 1.2bn)
Real Estate: US$ 3bn (US$ 0.1bn)
TMT: US$ 10.7bn (US$ 11bn)
Transport: US$ 0.1bn (US$ 0.4bn)
Other: US$ 4.4bn (US$ 1.2bn)
2012
2013
Africa & the Middle East cross-border analysis2013 vs. (2012) value and market share comparison
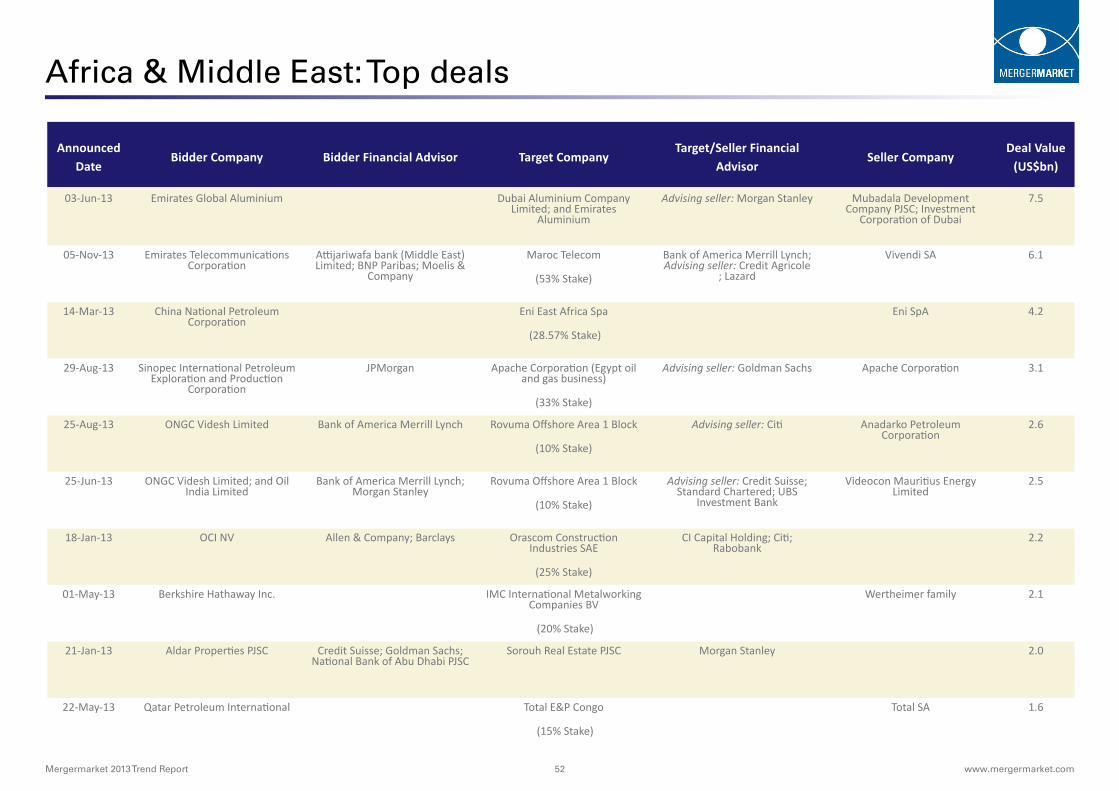
Mergermarket 2013 Trend Report 52 www.mergermarket.com
Africa & Middle East: Top deals
Announced Date
Bidder Company Bidder Financial Advisor Target CompanyTarget/Seller Financial
AdvisorSeller Company
Deal Value (US$bn)
03-Jun-13 Emirates Global Aluminium Dubai Aluminium Company Limited; and Emirates
Aluminium
Advising seller: Morgan Stanley Mubadala Development Company PJSC; Investment
Corporation of Dubai
7.5
05-Nov-13 Emirates Telecommunications Corporation
Attijariwafa bank (Middle East) Limited; BNP Paribas; Moelis &
Company
Maroc Telecom
(53% Stake)
Bank of America Merrill Lynch; Advising seller: Credit Agricole
; Lazard
Vivendi SA 6.1
14-Mar-13 China National Petroleum Corporation
Eni East Africa Spa
(28.57% Stake)
Eni SpA 4.2
29-Aug-13 Sinopec International Petroleum Exploration and Production
Corporation
JPMorgan Apache Corporation (Egypt oil and gas business)
(33% Stake)
Advising seller: Goldman Sachs Apache Corporation 3.1
25-Aug-13 ONGC Videsh Limited Bank of America Merrill Lynch Rovuma Offshore Area 1 Block
(10% Stake)
Advising seller: Citi Anadarko Petroleum Corporation
2.6
25-Jun-13 ONGC Videsh Limited; and Oil India Limited
Bank of America Merrill Lynch; Morgan Stanley
Rovuma Offshore Area 1 Block
(10% Stake)
Advising seller: Credit Suisse; Standard Chartered; UBS
Investment Bank
Videocon Mauritius Energy Limited
2.5
18-Jan-13 OCI NV Allen & Company; Barclays Orascom Construction Industries SAE
(25% Stake)
CI Capital Holding; Citi; Rabobank
2.2
01-May-13 Berkshire Hathaway Inc. IMC International Metalworking Companies BV
(20% Stake)
Wertheimer family 2.1
21-Jan-13 Aldar Properties PJSC Credit Suisse; Goldman Sachs; National Bank of Abu Dhabi PJSC
Sorouh Real Estate PJSC Morgan Stanley 2.0
22-May-13 Qatar Petroleum International Total E&P Congo
(15% Stake)
Total SA 1.6

Mergermarket 2013 Trend Report 53 www.mergermarket.com
Africa & Middle East: Financial advisor league tablesLeague table of financial advisors to M&A by value: Africa & Middle East
Ranking 2013 2012
2012 2013 Company Name Value (US$m)
Deal Count
Value (US$m)
% Val. Change
6 1 Morgan Stanley 15,083 11 4,775 215.9%31 2 Bank of America Merrill Lynch 12,973 12 1,145 1,033.0%2 3 JPMorgan 10,628 10 9,558 11.2%5 4 Lazard 8,810 7 5,122 72.0%9 5 Credit Suisse 8,757 11 4,385 99.7%3 6 Barclays 8,286 12 7,429 11.5%
53 7 Moelis & Company 7,521 4 313 2,302.9%14 8 BNP Paribas 7,420 4 2,775 167.4%1 9 Goldman Sachs 7,191 7 10,273 -30.0%- 10= Attijariwafa bank 6,100 1 - -
42 10= Credit Agricole 6,100 1 686 789.2%7 12 Citi 6,087 14 4,615 31.9%8 13 HSBC 5,693 9 4,420 28.8%
34 14 UBS Investment Bank 4,892 7 1,004 387.3%33 15 Evercore Partners 3,814 3 1,058 260.5%18 16 RBC Capital Markets 3,771 4 2,126 77.4%24 17 Investec 3,752 18 1,394 169.2%64 18 Allen & Company 3,366 3 100 3,266.0%29 19 Standard Chartered 2,758 3 1,173 135.1%- 20 Rabobank 2,437 3 - -
League table of financial advisors to M&A by deal count: Africa & Middle East
Ranking 2013 2012
2012 2013 Company Name Value (US$m)
Deal Count
Deal Count
Count Change
8 1 Investec 3,752 18 10 81 2 PwC 1,540 17 18 -1
12 3 Citi 6,087 14 7 721 4 Bank of America Merrill Lynch 12,973 12 5 76 5 Barclays 8,286 12 11 1
11 6 Morgan Stanley 15,083 11 7 420 7 Credit Suisse 8,757 11 5 69 8 Rand Merchant Bank 2,136 11 10 15 9 EY 569 11 12 -13 10 Standard Bank Group 539 11 13 -24 11 JPMorgan 10,628 10 12 -2
19 12 HSBC 5,693 9 5 416 13 Lazard 8,810 7 6 12 14 Goldman Sachs 7,191 7 14 -7
22 15 UBS Investment Bank 4,892 7 5 27 16 BDO 1,188 7 11 -4
17 17 Deutsche Bank 2,136 6 6 042 18 Nedbank Capital 657 6 2 4
30 19 KPMG 381 6 3 3- 20 PSG Capital 58 6 - -
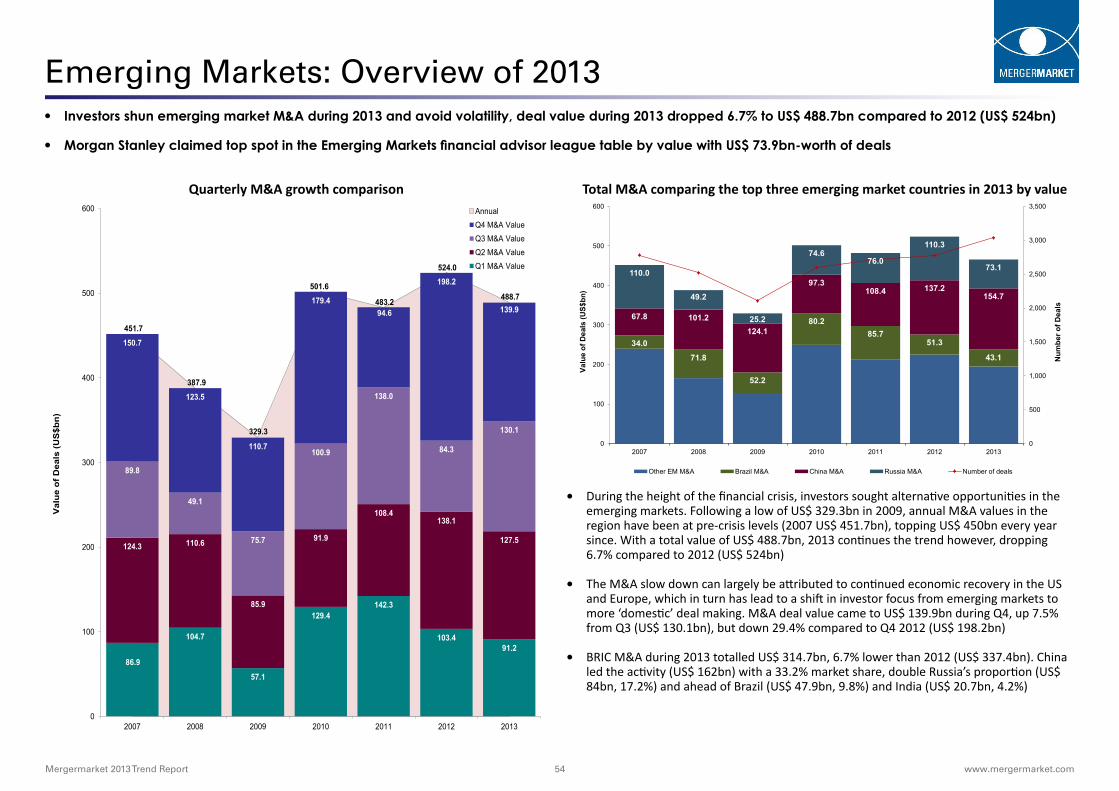
Mergermarket 2013 Trend Report 54 www.mergermarket.com
Quarterly M&A growth comparison Total M&A comparing the top three emerging market countries in 2013 by value
Emerging Markets: Overview of 2013 • Investors shun emerging market M&A during 2013 and avoid volatility, deal value during 2013 dropped 6.7% to US$ 488.7bn compared to 2012 (US$ 524bn)
• Morgan Stanley claimed top spot in the Emerging Markets financial advisor league table by value with US$ 73.9bn-worth of deals
451.7
387.9
329.3
501.6
483.2
524.0
488.7
86.9
104.7
57.1
129.4 142.3
103.4 91.2
124.3 110.6
85.9
91.9
108.4 138.1
127.5
89.8
49.1
75.7
100.9
138.0
84.3
130.1
150.7
123.5
110.7
179.4 94.6
198.2
139.9
0
100
200
300
400
500
600
2007 2008 2009 2010 2011 2012 2013
Val
ue o
f Dea
ls (U
S$b
n)
Annual Q4 M&A Value Q3 M&A Value Q2 M&A Value Q1 M&A Value
34.0
71.8
52.2
80.2 85.7
51.3
43.1
67.8 101.2 124.1
97.3 108.4 137.2
154.7
110.0
49.2
25.2
74.6 76.0
110.3
73.1
0
500
1,000
1,500
2,000
2,500
3,000
3,500
0
100
200
300
400
500
600
2007 2008 2009 2010 2011 2012 2013
Valu
e of
Dea
ls (U
S$bn
)
Other EM M&A Brazil M&A China M&A Russia M&A Number of deals
Num
ber o
f Dea
ls
• During the height of the financial crisis, investors sought alternative opportunities in the emerging markets. Following a low of US$ 329.3bn in 2009, annual M&A values in the region have been at pre-crisis levels (2007 US$ 451.7bn), topping US$ 450bn every year since. With a total value of US$ 488.7bn, 2013 continues the trend however, dropping 6.7% compared to 2012 (US$ 524bn)
• The M&A slow down can largely be attributed to continued economic recovery in the US and Europe, which in turn has lead to a shift in investor focus from emerging markets to more ‘domestic’ deal making. M&A deal value came to US$ 139.9bn during Q4, up 7.5% from Q3 (US$ 130.1bn), but down 29.4% compared to Q4 2012 (US$ 198.2bn)
• BRIC M&A during 2013 totalled US$ 314.7bn, 6.7% lower than 2012 (US$ 337.4bn). China led the activity (US$ 162bn) with a 33.2% market share, double Russia’s proportion (US$ 84bn, 17.2%) and ahead of Brazil (US$ 47.9bn, 9.8%) and India (US$ 20.7bn, 4.2%)

Mergermarket 2013 Trend Report 55 www.mergermarket.com
Emerging Markets: Industry and Cross-border analysis
0
200
400
600
800
1,000
1,200
0
50
100
150
200
250
300
2004 2005 2006 2007 2008 2009 2010 2011 2012 2013
Num
ber o
f Dea
ls
Valu
e of
Dea
ls (U
S$bn
)
Outbound M&A Value
Inbound M&A Value
Inbound Number of Deals
Outbound Number of Deals
• Inbound activity saw an 18.8% decline in 2013 with deals valued at US$ 122.2bn compared to US$ 150.4bn in 2012. The last time the region saw a lower inbound deal value was in 2009 (US$ 70.8bn), underlining the role of the risk averse investor
• The slowdown for targeting the BRICS has benefited less traditional emerging markets. For example, the Czech Republic’s US$ 7.4bn-worth of inbound deals in 2013 was up 64.4% compared to 2012 (US$ 4.5bn). Attention on smaller markets affected the average deal size for inbound deals (US$ 212.5m) resulting in the lowest average since 2009 (US$ 152.6m)
• Cautious about currency valuations (e.g. India), political unrest (e.g. Thailand) and regulations (e.g. China), outbound value in Q4 (US$ 19.1bn) represented the second quarterly decline - down 12.8% from Q3 (US$ 21.9bn). However, Q4 was up 7.3% compared to Q4 2012 (US$ 17.8bn)
• Total outbound activity in 2013 dropped 27.6% compared to 2012 (US$ 125.5bn), with deals valued at US$ 90.9bn being the lowest annual total since 2009 (US$ 63.2bn)
• Energy, Mining & Utilities continued to dominate M&A deal activity in the emerging markets with US$ 131.8bn-worth of deals and a stable 27% market share (30.8% in 2012). Deal value was down 18.2% compared to 2012 (US$ 161.1bn)
• The Real Estate sector (124 deals valued at US$ 26.8bn) was one of five sectors to increase by both deal value and number of deals compared to 2012, up the most by value and deal count at 208% and 45.9% respectively (US$ 8.7bn and 85 deals in 2012)
• TMT was another sector to register an increase in both value and number of deals. Maroc Telecom was the subject of the largest deal in the region during Q4 and also the fourth largest deal targeting Africa on Mergermarket record (since 2001). The company was ac-quired for US$ 6.1bn by United Emirates Communications, helping to raise the total value in the sector to US$ 66.9bn and 14.9% above last year’s total of US$ 58.2bn
3.3%
12.5%
30.8%
14.8%
13.1%
0.8% 3.5% 1.7%
11.1%
4.6% 3.9%
3.6%
11.2%
27.0%
10.8%
13.0%
1.5%
3.9%
5.5%
13.7%
4.4% 5.5%
Business Services: US$ 17.5bn (US$ 17.5bn)
Consumer: US$ 54.6bn (US$ 65.5bn)
Energy, Mining & Utilities: US$ 131.8bn (US$ 161.1bn)
Financial Services: US$ 52.6bn (US$ 77.3bn)
Industrials & Chemicals: US$ 63.5bn (US$ 68.4bn)
Leisure: US$ 7.5bn (US$ 4.1bn)
Pharma, Medical & Biotech: US$ 19bn (US$ 18.5bn)
Real Estate: US$ 26.8bn (US$ 8.7bn)
TMT: US$ 66.9bn (US$ 58.2bn)
Transport: US$ 21.3bn (US$ 24.2bn)
Other: US$ 27.1bn (US$ 20.3bn)
2012
2013
Emerging Markets cross-border analysis2013 vs. (2012) value and market share comparison

Mergermarket 2013 Trend Report 56 www.mergermarket.com
Emerging Markets: Top deals
Announced Date
Bidder Company Bidder Financial Advisor Target CompanyTarget/Seller Financial
AdvisorSeller Company
Deal Value (US$bn)
08-Apr-13 Russian Grids OAO Barclays; EY; Morgan Stanley; VTB Capital
Federal Grid Company of Unified Energy System OAO
(79.64% Stake)
The Federal Agency for State Property Management
14.4
14-Jun-13 Taikang Asset Management Company; and Beijing
Guolian Energy Industry Investment Fund
PetroChina United Pipelines Company Limited
(50% Stake)
PetroChina Company Limited 9.8
31-May-13 SM Prime Holdings Inc SM Land Inc Advising seller:BDO; JPMorgan; KPMG; Macquarie
Group
SM Investments Corporation; and SY Family
6.7
23-Apr-13 CP ALL Plc Maybank Investment Bank; Siam Commercial Bank; UBS
Investment Bank
Siam Makro Public Co Ltd
(96.09% Stake)
Phatra Securities Public Company; Advising seller:
HSBC
SHV Holdings NV 6.2
5-Nov-13 Emirates Telecommunications Corporation
Attijariwafa bank (Middle East); BNP Paribas; Moelis &
Company
Maroc Telecom
(53% Stake)
Bank of America Merrill Lynch; Advising seller: Credit Agricole; Lazard
Vivendi SA 6.1
2-Jul-13 Mitsubishi UFJ Financial Group Inc
Bank of America Merrill Lynch; Phatra Securities
Public Company
Bank of Ayudhya Public Company Limited
(72.01% Stake)
Deutsche Bank; Morgan Stanley
GE Capital Corporation 5.7
5-Feb-13 Guangxi Guiguan Electric Power Co Ltd
CITIC Securities LongTan Hydropower Development Co Ltd
(85% Stake)
Guangxi Investment Group Co Ltd; China Datang
Corporation; and Guizhou Industrial Investment
(Group) Co Ltd
4.9
1-Apr-13 Midea Group Co Ltd China International Capital GD Midea Holding Co Ltd
(58.83% Stake)
CITIC Securities 4.9
14-Nov-13 Cyfrowy Polsat SA EY; Trigon Group Polkomtel Sp z oo
(83.77% Stake)
Karswell Limited; Sensor Overseas Limited; and Argumenol Investment
Company Limited
4.9
24-Dec-13 Ruslan Baysarov (Private investor)
Stroygazconsulting (SGC)
(30% Stake)
Ziyad Manasir (Private investor)
4.8

Mergermarket 2013 Trend Report 57 www.mergermarket.com
Criteria
All data is based on transactions over US$ 5m and is based on the Mergermarket’s M&A deals database. Deals with undisclosed deal values are included where the target’s turnover exceeds US$ 10m. Deals where the stake acquired is less than 30% will only be included if the value is greater than US$ 100m. Click here for the full deal criteria
M&A trends and top deals: correct as of 9am, 02-Jan-2014 Based on the dominant geography or dominant sector of the target according to Mergermarket’s deals database. The trend graphs are based on transactions announced in the given time periods
Financial advisor league tables: correct as of 9am, 02-Jan-2014 Based on the dominant geography of any of the target, bidder or seller according to Mergermarket’s deal database. Buyout league tables to financial advisors are based on the target geography only and the advisor advising the buy-side only and exclude lapsed or withdrawn bids. Dates are between 1-Jan to 18-Dec for 2013 and 2012 comparison
Industry consolidations: TMT: consolidated sectors of Technology, Media & Telecommunications OTHER in Global, Europe, US & Asia-Pacific sections: consolidated sectors of Leisure, Defence, Agriculture, and Construction OTHER in the Emerging Markets section: consolidated sectors of Leisure, Real Estate, and Transport
Cross-Border: Inbound: deals where the dominant geography of the target is X and the dominant geography of the bidder is outside X Outbound: deals where the dominant geography of the target is outside X and the dominant geography of the bidder is X
Small-cap: deals valued under US$ 500m Mid-market: deals valued between US$ 501m - US$ 2bn Large-cap: deals valued between US$ 201bn - US$ 9.9bn Mega-deal: deals above the value of US$ 10bn Average deal size: excludes non-disclosed value deals
Dates: Q4 2013 / Q4 2012: 01-Oct-13 to 31-Dec-13 / 01-Oct 12 to 31-Dec-12 2013 / 2012: 01-Jan-13 to 31-Dec-13 / 01-Jan-12 to 31-Dec-12
About Mergermarket
Mergermarket is a mergers & acquisitions (M&A) intelligence service.
Mergermarket is part of The Mergermarket Group which has nearly 1000 employees worldwide and regional head offices in New York, London and Hong Kong.
In any market, the life blood of advisors is deal flow. mergermarket is unique in the provision of origination intelligence to the investment banking, legal, private equity, acquisition finance, public relations (PR) and corporate markets.
With an unrivalled network of analysts covering M&A in the Americas, Europe, Middle-East, Africa and Asia-Pacific, mergermarket generates proprietary intelligence and delivers it together with daily aggregated content, on its mergermarket.com platform and by real-time email alerts to subscribers.
This wealth of intelligence, together with a series of deal databases, individual and house league tables, profiles and editorial have proven time and time again that this product can and does gener-ate real revenues for clients. This is apparent when you see that mergermarket is used by over 1600 of the world’s foremost advisory firms to assist in their origination process.
Part of The Mergermarket Group
www.mergermarket.com80 Strand
London, WC2R 0RL
United Kingdom
T: +44 207 010 6100
330 Hudson St.
4th Floor
New York
NY 10013. USA
T: +1 212 500 7537
Suite 2401-3
Grand Millennium Plaza
181 Queen’s Road, Central
Hong Kong
T: + 852 2158 9764
Mergermarket 2013 Trend Report 58 www.mergermarket.com
What Mergermarket can do for you
Our global team of 400 dedicated M&A journalists, spread in over 65 locations worldwide, gathers proprietary information about corporate strategy through its network of industry contacts and executives. This is M&A intelligence you won’t find anywhere. The insight we provide often doesn’t become public knowledge until 6-24 months after our journalists first start reporting, giving you a large window of opportunity to take early action.
Our multilingual team of journalists monitors more than 3,000 global media sources daily, analyzing and translating the most relevant information into summarized articles that subscribers receive in their alerts, together with our proprietary intelligence.
Mergermarket’s comprehensive Deals Database offers you the opportunity to search a global library of historical M&A transactions with fully-sourced financials and exit multiples. You can analyze volumes and values of M&A activity in specific regions or sectors to discover deal patterns and identify trends ahead of competitors.
Our customizable Private Equity Search facility provides you with extensive analyses of more than 1,000 of the world’s biggest private equity firms. Analyse specific PE firms in terms of current portfolio, historical exits, potential investments, firm profile, historical advisor and investment relationships, as well as rival bidders to monitor competitors and stay on top of your market.
Because we are always up-to-speed on which advisers are working on which deals, our detailed ‘Who’s who in M&A’ league tables have become an industry standard among investment professionals. Tailor-build individual or house league tables to analyze firm performance and enhance your marketing strategy, competitor analysis or pitch book efforts.
PREDICTIVE INTELLIGENCE
ANALYSIS
DEALS DATABASE
PRIVATE EQUITY PORTFOLIOLEAGUE TABLES
Mergermarket is a business development tool designed specifically for the M&A sector, providing proprietary news, intelligence and analysis on corporate strategy before that strategy becomes public knowledge.
Over 2000 of the world’s foremost advisory firms, investment banks, law firms, private equity firms and corporates use mergermarket to drive their origination process and capture lucrative business opportunities. Click the buttons at the bottom of the page to find out about the real benefits mergermarket can bring to your company.