mercer county, pennsylvania - rampp
TRANSCRIPT


NOTICE TO FLOOD INSURANCE STUDY USERS
Communities participating in the National Flood Insurance Program have established repositories of flood hazard data for floodplain management and flood insurance purposes. This Flood Insurance Study (FIS) report may not contain all data available within the Community Map Repository. Please contact the Community Map Repository for any additional data. The Federal Emergency Management Agency (FEMA) may revise and republish part or all of this FIS report at any time. In addition, FEMA may revise part of this FIS report by the Letter of Map Revision process, which does not involve republication or redistribution of the FIS report. Therefore, users should consult with community officials and check the Community Map Repository to obtain the most current FIS report components. Selected Flood Insurance Rate Map (FIRM) panels for this community contain information that was previously shown separately on the corresponding Flood Boundary and Floodway Map (FBFM) panels (e.g., floodways, cross sections). In addition, former flood hazard zone designations have been changed as follows: Old Zone(s) New Zone
Al through A30 AE B X C X Initial Countywide FIS Effective Date: To Be Determined

Page is Intentionally Left Blank

i
TABLE OF CONTENTS
1.0 INTRODUCTION.............................................................................................. 1 1.1 Purpose of Study ...................................................................................... 1
1.2 Authority and Acknowledgments ............................................................ 1
1.3 Coordination ............................................................................................ 3
2.0 AREA STUDIED ............................................................................................... 4 2.1 Scope of Study ......................................................................................... 4
2.2 Community Description ........................................................................... 6
2.3 Principal Flood Problems ......................................................................... 9
2.4 Flood Protection Measures .................................................................... 10
3.0 ENGINEERING METHODS ......................................................................... 12 3.1 Hydrologic Analyses .............................................................................. 12
3.2 Hydraulic Analyses ................................................................................ 16
3.3 Vertical Datum ....................................................................................... 20
4.0 FLOODPLAIN MANAGEMENT APPLICATIONS .................................. 21 4.1 Floodplain Boundaries ........................................................................... 22
4.2 Floodways .............................................................................................. 22
5.0 INSURANCE APPLICATIONS..................................................................... 36
6.0 FLOOD INSURANCE RATE MAP .............................................................. 38
7.0 OTHER STUDIES ........................................................................................... 43
8.0 LOCATION OF DATA ................................................................................... 43
9.0 BIBLIOGRAPHY AND REFERENCES ...................................................... 43

ii
TABLE OF CONTENTS (Continued)
FIGURES
Figure 1 – Floodway Schematic .................................................................................... 36
TABLES
Table 1 – Initial and Final CCO Meetings ....................................................................... 4 Table 2 – Areas Studied by Detailed Methods ................................................................ 5 Table 3 – Incorporated Letters of Map Corrections (LOMCs) ........................................ 6 Table 4 – Summary of Discharges ................................................................................. 14 Table 5 – Manning’s “n” Values ................................................................................... 19 Table 6 – Vertical Datum Conversion Values ............................................................... 20 Table 7 – Floodway Data ............................................................................................... 24 Table 8 – Community Map History ............................................................................... 39
EXHIBITS
Exhibit 1 – Flood Profiles
Baker Run Panels 01P-02P Black Run Panel 03P Bobby Run Panel 04P Brandy Springs Run Panel 05P Golden Run Panel 06P Hogback Run Panel 07P Little Shenango River Panels 08P-09P McCullough Run Panels 10P-11P Mill Creek Panel 12P Munnel Run Panel 13P Neshannock Creek Panel 14P Otter Creek Panel 15P Outlet to Sandy Lake Panel 16P Pine Run Panels 17P-18P Sandy Creek Panel 19P Sawmill Run Panels 20P-21P Shenango River Panels 22P-29P Unnamed Tributary to Neshannock Creek Panel 30P West Branch Pine Hollow Run Panel 31P Wolf Creek Panels 32P-34P
Exhibit 2 – Flood Insurance Rate Map Index Flood Insurance Rate Map

1
FLOOD INSURANCE STUDY
MERCER COUNTY, PENNSYLVANIA (ALL JURISDICTIONS)
1.0 INTRODUCTION
1.1 Purpose of Study
This Flood Insurance Study (FIS) report investigates the existence and severity of flood hazards in the geographic area of Mercer County, Pennsylvania, including the Boroughs of Clark, Fredonia, Greenville, Grove City, Jackson Center, Jamestown, Mercer, New Lebanon, Sandy Lake, Sharpsville, Sheakleyville, Stoneboro, West Middlesex, and Wheatland; the Cities of Farrel, Hertimage, and Sharon; and the Townships of Coolspring, Deer Creek, Delaware, East Lackawannock, Fairview, Findley, French Creek, Greene, Hempfield, Jackson, Jefferson, Lackawannock, Lake, Liberty, Mill Creek, New Vernon, Otter Creek, Pery, Pine, Pymatuning, Salem, Sandy Creek, Sandy Lake, Shenango, South Pymatuning, Springfield, Sugar Grove, West Salem, Wilmington, Wolf Creek, and Worth (referred to collectively herein as Mercer County), and aids in the administration of the National Flood Insurance Act of 1968 and the Flood Disaster Protection Act of 1973. This study has developed flood-risk data for various areas of the community that will be used to establish actuarial flood insurance rates and to assist the community in its efforts to promote sound floodplain management. Minimum floodplain management requirements for participation in the National Flood Insurance Program (NFIP) are set forth in the Code of Federal Regulations at 44 CFR, 60.3. Please note that the Boroughs of Fredonia, Sharpsville, and Sheakleyville; and the Township of Deer Creek are non-floodprone. In some states or communities, floodplain management criteria or regulations may exist that are more restrictive or comprehensive than the minimum Federal requirements. In such cases, the more restrictive criteria take precedence and the State or other jurisdictional agency will be able to explain them.
1.2 Authority and Acknowledgments
The sources of authority for this FIS are the National Flood Insurance Act of 1968 and the Flood Disaster Protection Act of 1973. This FIS was prepared to include all jurisdictions within Mercer County into a countywide format FIS. Information on the authority and acknowledgements for each of the previously printed FISs for communities within Mercer County was compiled, and is shown below. Farrell, City of The hydrologic and hydraulic analyses for the October 1977
study were performed by Michael Baker, Jr., Inc., for the Federal Insurance Administration (FIA), under Contract No. H-3812 (Reference 1). This work was completed in February 1977.

2
Greenville, Borough of
The hydrologic and hydraulic analyses for the January 16, 1981 study were prepared by Michael Baker, Jr., Inc. for the FIA under Contract No. H-4816 (Reference 2). This work was completed in November 1979. The hydrologic and hydraulic analyses for the Shenango River and Little Shenango River were previously prepared by the U.S. Department of Agriculture, Soil Conservation Service (SCS).
Grove City, Borough of
The hydrologic and hydraulic analyses for the September 1977 study were determined by Michael Baker, Jr., Inc., for FIA, under Contract No. H-3812 (Reference 3). This work was completed in May 1976.
Hempfield, Township of
The hydrologic and hydraulic analyses for the February 15, 1991 study were prepared by the U.S. Army Corps of Engineers (USACE), Pittsburgh District, for the Federal Emergency Management Agency (FEMA), under Inter-Agency Agreement No. EMW-87-E-2509, Project Order No. 3 (Reference 4). This work was completed in April 1989.
Hermitage, City of The hydrologic and hydraulic analyses for the March 30, 1981 study were prepared by L. Robert Kimball and Associates, for the FIA, under Contract No. H-4554 (Reference 5). This work was completed in December 1979.
Mercer, Borough of
The hydrologic and hydraulic analyses for the September 1976 study were determined by Michael Baker, Jr., Inc., for the FIA, under Contract No. H-3727 (Reference 6).
Sandy Lake, Borough of
The hydrologic and hydraulic analyses for the March 18, 1991 study were prepared by the USACE, Pittsburgh District, for FEMA, under Inter-Agency Agreement No. EMW-87-E-2509, Project Order No. 3 (Reference 7). This work was completed in April 1989.
Sharon, City of The hydrologic and hydraulic analyses for the April 1978 study were performed by Michael Baker, Jr., Inc., for the FIA, under Contract No. H-3812 (Reference 8). This work was completed in May 1977.
Shenango, Township of
The hydrologic and hydraulic analyses in the September 4, 1991 study were prepared by the USACE, Pittsburgh District (Reference 9). This work was completed in October 1983.
South Pymatuning, Township of
The hydrologic and hydraulic analyses for the March 18, 1991 study were prepared by the USACE, Pittsburgh District, for FEMA, under Inter-Agency Agreement No. EMW-87-E-2509, Project Order No. 3 (Reference 10). This work was completed in April 1989.

3
Stoneboro, Borough of
The hydrologic and hydraulic analyses for the March 18, 1991 study were prepared by the USACE, Pittsburgh District, or FEMA, under Inter-Agency Agreement No. EMW-87-E-2509, Project Order No. 3 (Reference 11). This work was completed in April 1989.
West Middlesex, Borough of
The hydrologic and hydraulic analyses in the September 4, 1991 study were prepared by the USACE, Pittsburgh District (Reference 12). This work was completed in October 1983.
Wheatland, Borough of
The hydrologic and hydraulic analyses for the August 1977 study were performed by Michael Baker, Jr., Inc., for the FIA, under Contract No. H-3812 (Reference 13). This work was completed in January 1977.
No previous FIS reports were prepared for the Boroughs of Clark, Fredonia, Jackson Center, Jamestown, New Lebanon, Sharpsville, and Sheakleyville; and the Townships of Coolspring, Deer Creek, Delaware, East Lackawannock, Fairview, Findley, French Creek, Greene, Jackson, Jefferson, Lackawannock, Lake, Liberty, Mill Creek, New Vernon, Otter Creek, Perry, Pine, Pymatuning, Salem, Sandy Creek, Sandy Lake, Springfield, Sugar Grove, West Salem, Wilmington, Wolf Creek, or Worth. For this countywide FIS, the Digital Flood Insurance Rate Map (DFIRM) database and mapping were prepared for FEMA by GG3, a joint venture between Greenhorne & O’Mara, Inc., Laurel, Maryland and Gannett Fleming, Inc, Camp Hill, Pennsylvania under the Joint Venture Contract No. EMP-2003-CO-2606, Task Order Number 10. The new countywide FIS, does not include detailed hydrologic and hydraulic analyses, but rather redelineation and digitizing of effective flood hazard information and new approximate analyses. This work was completed in November 2009. The orthophotography base mapping was provided by the PAMAP Program, PA Department of Conservation and Natural Resources, Bureau of Topographic and Geologic Survey at a scale of 1:2,400 from photography dated 2006 or later. The digital countywide Flood Insurance Rate Map (FIRM) was produced in Pennsylvania State Plane North Zone coordinate system with a Lambert Conformal Conic projection, units in feet, and referenced to the North American Datum of 1983, GRS80 spheroid. Differences in datum and spheroid used in the production of the FIRMs for adjacent counties may result in slight positional differences in map features at the county boundaries. These differences do not affect the accuracy of information shown on this FIRM.
1.3 Coordination
An initial Consultation Coordination Officer’s (CCO) meeting is typically held with representatives of FEMA, the community, and the study contractor to explain the nature and purpose of a FIS and to identify the streams to be studied by detailed methods. A final CCO meeting is held typically with the same representatives to review the results of

4
the study. The initial and final meeting dates for the previous FIS reports for Mercer County and its communities are listed in Table 1, “Initial and Final CCO Meetings.”
Table 1 – Initial and Final CCO Meetings
COMMUNITY NAME INITIAL MEETING FINAL MEETING
Farrell, City of September 3, 1975 April 26, 1977
Greenville, Borough of May 25, 1978 July 11, 1980
Grove City, Borough of September 3, 1975 July 7, 1976
Hempfield, Township of December 5, 1985 March 5, 1990
Hermitage, City of June 1977 July 11, 1980
Mercer, Borough of October 22, 1974 October 16, 1975
Sandy Lake, Borough of December 5, 1985 March 5, 1990
Sharon, City of September 3, 1975 July 12, 1977
Shenango, Township of May 14, 1990 September 17, 1990
South Pymatuning, Township of December 5, 1985 March 5, 1990
Stoneboro, Borough of December 5, 1985 March 5, 1990
West Middlesex, Borough of May 14, 1990 September 17, 1990
Wheatland, Borough of September 3, 1975 March 2, 1977
For this countywide revision, the final CCO meeting was held on ___________, and attended by representatives of ______________.
2.0 AREA STUDIED
2.1 Scope of Study
This FIS covers the geographic area of Mercer County, Pennsylvania, including incorporate communities listed in Section 1.1. Table 2, “Areas Studied by Detailed Methods” lists the streams that were studied by detailed methods. Limits of Detailed Study are indicated on the Flood Profiles (Exhibit 1).

5
Table 2 – Areas Studied by Detailed Methods
Stream Limits of Detailed Study Baker Run Approximately 1,450 feet upstream of Woodside
Drive to approximately 310 feet downstream of Lyle Drive
Black Run Confluence with Wolf Creek to approximately 50 feet downstream of Bridge
Bobby Run Longview Road to approximately 4,950 feet downstream of Longview Road
Brandy Springs Run Shenango Street to approximately 800 feet downstream of Park Road
Golden Run Private Drive to approximately 160 feet downstream of Private Drive
Hogback Run Sample Road to approximately 1,150 feet downstream of South Keel Ridge Road
Little Shenango River Confluence with Shenango River to approximately 900 feet downstream of Williamson Road
McCullough Run Approximately 2,100 feet upstream of Buckeye Drive to 3,500 feet downstream of Vanhoe Road
Mill Creek Confluence with Neshannock and Otter Creeks to approximately 2,600 feet downstream of confluence with Neshannock and Otter Creeks
Munnel Run Confluence with Otter Creek to Franklin Street/Perry Highway
Neshannock Creek Approximately 2,310 feet upstream of Wilson Avenue to confluence with Otter and Mills Creeks
Otter Creek Confluence with Neshannock Creek and Mills Creek to approximately 2,600 feet downstream of Railroad crossing
Outlet to Sandy Lake Confluence with Sandy Creek to approximately 1,500 feet downstream of the confluence with McCutcheon Run
Pine Run South Dock Street to confluence of Pine Run Tributary
Sandy Creek Approximately 1,300 feet upstream of the confluence of Outlet to Sandy Lake to approximately 1,500 feet downstream of Sandy Lake New Lebanon Road/Mercer Street
Sawmill Run Approximately 1,650 feet upstream of Franklin Street to approximately 1,200 downstream of Mercer Road
Shenango River Lawrence and Mercer County Boundaries to approximately 4,800 downstream of the confluence of Little Shenango River
Unnamed Tributary to Neshannock Creek
South Shenango Street to approximately 300 downstream of South Shenango Street

6
Table 2 – Areas Studied by Detailed Methods (Continued)
Stream Limits of Detailed Study West Branch Pine Hollow Run U.S. Route 62 Bypass Inlet to approximately 1,400
downstream of Easton Road Wolf Creek Approximately 2,050 feet upstream of Clark Street to
approximately 570 feet downstream of North Street
The areas studied by detailed methods were selected with priority given to all known flood hazards and areas of projected development or proposed construction. Approximate analyses were used to study those areas having a low development potential or minimal flooding hazards. The scope and methods of study were proposed to, and agreed upon, by FEMA and the communities. Table 3 presents Letters of Map Correction (LOMCs) incorporated into this countywide study:
Table 3 – Incorporated Letters of Map Corrections (LOMCs)
LOMC Case Number Date Issued Project Identifier LOMR 95-03-069P June 1, 1995 North of George Street and southeast
of Shenango Valley Freeway
2.2 Community Description
Mercer County is located in northwestern Pennsylvania, south of the City of Erie. The county is bordered on the north by Crawford County, on the east by the Counties of Venango and Butler, on the south by Lawrence County, and on the west by Trumbull County, Ohio. Major transportation routes that serve Mercer County include U.S. Interstates 79 and 80, State Route 60, and the railroads. The 2000 population of Mercer County was reported to be 120,293 (Reference 14). The climate for this area is temperate with normal seasonal variation in temperature. Mercer County is geographically located in a region of both polar and tropical air mass activity, subject to continental and maritime invasion. The weather is usually moderate, but may have occasional rapid changes resulting from frontal air mass movements. The average high temperature of 81 degrees Fahrenheit (ºF) usually occurs in July. The average low of 17ºF usually occurs in January. The highest recorded temperature was 103ºF in 1936. The lowest recorded temperature was -22ºF in 1994. Yearly precipitation averages approximately 38.02 inches, with the maximum monthly average occurring in June, with 4.62 inches of rain and the minimum monthly average occurring in February, with 2.56 inches (Reference 15). The geologic structure is of the Mississippian Age and in the Pocono Group. Characteristics of this group are predominantly gray, hard, massive, crossbedded conglomerate and sandstone with small amounts of shale. Soil types are predominantly Wayland silt loam with coarse variant. The soils are also silty loams in the Canfield, Lardstown and Ravenna classifications. The Wayland and Ravenna classes are poorly drained soils while the Lordstown is well drained and the Canfield is moderately drained.

7
The Wayland classification is generally deposited by flooding while the others are from glacial deposits (Reference 16).
Baker Run flows north for approximately two miles through the City of Hertimage for about 1.4 miles into Pine Run in Sharon, Pennsylvania. Black Run flows through the Borough of Grove City, in the southeastern corner of Mercer County. Vegetation through the area surrounding the central business district consists of sporadic wooded and open space areas, with sparse residential development along the floodplain of Black Run.
Bobby Run, a tributary flowing south to the Shenango River, is 3.5 miles in length with a drainage area of 2.92 square miles. It flows through the City of Hertimage, in the southwestern portion of Mercer County. The low lying areas within the Borough of Mercer are composed of floodplains of Brandy Springs Run, Neshannock Creek, Otter Creek, Mill Creek, Munnel Run, and an Unnamed Tributary to Neshannock Creek. Brandy Springs Run, Munnel Run, and the Unnamed Tributary to Neshannock Creek have slopes above 1- percent. Neshannock, Otter, and Mill Creeks have about a 0.2-percent slope. They have very wide and flat floodplains which cause low overbank velocities and ponding. Continued industrial growth will intensify the development in the floodplain areas and will require the management of the floodplain. The land area is expected to become more densely populated because of Mercer County's location with respect to the Interstates.
Golden Run flows through the City of Hertimage, in the southwestern portion of Mercer County. Golden Run flows north for about five miles to the Shenango River Reservoir and encompasses a drainage area of 4.51 square miles. Hogback Run, flowing through the City of Hertimage, flows south for 7.2 miles and has a drainage area of 8.03 square miles.
Little Shenango River has a total drainage area of 109 square miles at its mouth. It flows in a westerly direction with an average channel slope of about nine feet per mile. Industrial and commercial development is located on the flat plains bordering the river. The surrounding area is characterized by broad, gently sloping uplands with steep-sided valleys and low gradient streams meandering along the flood plains. Elevations range from about 925 to 1,180 feet, with a total relief of about 255 feet in the Borough of Greenville (Reference 17).
The average bedslope of McCullough Run within the Township of South Pymatuning is approximately 35 feet per mile. Local relief above the stream varies from a low of 880 feet to an average hilltop elevation of 1,030 feet within the study limits. The valley floor within the study area varies from 50 to 200 feet.
Outlet to Sandy Lake has a total drainage area of 7.1 square miles at its confluence with Sandy Creek in the Borough of Sandy Lake. It flows toward the east from Sandy Lake, which is approximately 1 mile upstream of the Borough of Sandy Lake. The average stream gradient is approximately 58 feet per mile, and the average bed slope in the Borough of Sandy Lake is approximately eight feet per mile. Elevations in the main valley vary from a low of 1,150 feet to 1,430 feet at the extreme headwaters. Within the

8
study limits, local relief above the stream varies from a low of 1,150 feet to an average hilltop elevation of 1,300 feet. The valley floor within the borough varies from 1,000 to 3,000 feet.
Pine Run, which has its source in the Township of Hickory, flows generally northwesterly, through the City of Sharon, and empties into the Shenango River. Vegetation in the Pine Run watershed consists primarily of trees, brush, and grasses in the upper sections and trees and well kept lawns which help reduce runoff into Pine Run in the residential section of the city. Due to the intensity of development in the Shenango River flood plain, very little vegetation of any kind exists in the lower area of the Pine Run watershed, producing a high runoff into Pine Run. Sandy Creek, has a total drainage area of 161 square miles, and joins the Allegheny River on the right bank at river mile 114.3, at Bully Hill in Venango County. It flows toward the southeast from its source near Porters Corners in Crawford County; the creek is detained by Sandy Creek Dam, located approximately 2 miles upstream of the Borough of Sandy Lake. The average stream gradient is approximately seven feet per mile, and its average bed slope within the Borough of Sandy Creek is approximately 14 feet per mile. Elevations in the main valley vary from a low of 930 feet to 1,360 feet at the extreme headwaters. Within the study limits, local relief above the stream varies from a low of 1,150 feet to an average hilltop elevation of 1,340 feet. The valley floor within the study limits varies from 500 to 1,000 feet in width. Sawmill Run, with a total drainage area of 2.2 square miles at its mouth, flows into the Outlet to Sandy Lake on the right bank, at river mile 1.0. Sawmill Run flows towards the northeast from its source approximately three miles south of the Borough of Stoneboro. The average stream gradient is approximately 92 feet per mile. Elevations in the main valley vary from a low of 1,150 feet to 1,400 feet at the extreme headwaters. The average bed slope of Sawmill Run within the Borough of Stoneboro is approximately 70 feet per mile. Local relief above the stream varies from a low of 1,150 feet to an average hilltop elevation of 1,260 feet within the Borough of Stoneboro. The valley floor within the Borough of Stoneboro varies from 50 to 500 feet. The Shenango River flows southeast for approximately 69.7 miles from Pymatuning Reservoir along the Pennsylvania-Ohio Border, to its confluence with the Mahoning River at New Castle, Pennsylvania. The two rivers combine to form the Beaver River, which flows southward to the Ohio River. The Shenango River's drainage area encompasses 1,062 square miles (References 18 and 19) . West Branch Pine Hollow Run flows north for approximately two miles through the City of Hertimage into Pine Hollow Run. The southward flowing Wolf Creek serves to separate the topography of the Borough of Grove City. The stratigraphy east of Wolf Creek is noticeably different from that west of Wolf Creek. The strata in both areas is of Pennsylvanian age; however, the strata east of Wolf Creek consists primarily of shale, belonging to the Allegheny group, and the strata west of Wolf Creek is primarily sandstone belonging to the Pottsville group (References 17 and 20). Vegetation through the area surrounding the central business district consists of sporadic wooded and open space areas. Sparse residential development exists in the floodplain of Wolf Creek. Some commercial development exists in the floodplain of

9
Wolf Creek and is clustered mainly in the area of Main Street. The campus of Grove City College is partially within the floodplain of Wolf Creek.
2.3 Principal Flood Problems
The Little Shenango and Shenango Rivers flow in somewhat narrow valleys with steep sides, and their watersheds are mostly covered by poorly-drained soils. During rainstorms, these conditions are conducive to rapid runoff, causing streams to rise rapidly and reach high velocities. Flood damages and elevations can be increased by accumulations of ice and floating debris restricting the flow of water through the channel, culverts, and bridges. Major floods may occur on McCullough Run and Sawmill Run and Shenango River at various times of the year. However, the main flooding season is usually in the spring and summer months. Floods in the usually occur in the form of flash flooding from high-intensity, short-duration thunderstorms. Floods of Mill Creek, Neshannock Creek, Otter Creek, and Unnamed Tributary to Neshannock Creek have plagued residents in the Borough of Mercer directly or indirectly for years. The largest known historical flood was in October 1911 (this flood occurred before flood data was recorded). The maximum flood occurring in recent years was on January 22, 1959. Other serious flooding occurred on: December 31, 1942; May 28, 1946; January 28, 1952; October 17, 1954; June 22, 1956; July 17, 1958; February 11, 1959; June 1972; and January 1974. The Pine Run watershed experienced nearly two inches of rain on June 25, 1959, which caused the stream to leave its banks and flood the Towne Shopping Plaza at the intersection of South Sharpsville Avenue and the Shenango Valley Freeway within the City of Sharon (Reference 8). Six stores in the Plaza along with a lumber company further downstream on South Dock Street were all flooded. The lumber company has also experienced high water in the past in October 1954, August 1955, July 1958, and January 1959. Since Pine Run is ungaged, discharge measurements were not determined for any of the floods. The 1959 flood also caused traffic jams and local flooding in the vicinity of Stambaugh Avenue and the Shenango Valley Freeway. Debris collecting behind bridges tends to increase flood elevations on Pine Run, especially behind the piers supporting the building upstream of South Sharpsville Avenue. Major floods may occur on Sandy Creek and Outlet to Sandy Lake at various times of the year. However, most flooding occurs in the spring and summer. High-intensity, short-duration thunderstorms cause flash flooding in the Borough of Sandy Lake. In June 1972, approximately four inches of rain fell over the Sandy Creek watershed, causing the highest levels of flooding since 1970, when Lake Wilhelm became operational. As measured on the intake riser in the reservoir pool, flood waters reached an elevation of 1,193.5 feet. The normal pool elevation for Lake Wilhelm is 1,192.8 feet.
The Shenango River had flooded regularly since the first recorded flood in 1800. Flooding in the Shenango River Valley had occurred with alarming regularity up until the building of the Shenango River Dam in 1965. Floods of major significance occurred in 1913, 1954, 1958, and 1959 with the 1913 the greatest on record (Reference 21). The January 1959 flood caused severe damages, primarily to the commercial establishments along the river, totalling over 2.2 million dollars (Reference 22). The peak discharge

10
resulting from the 1959 flood is much greater than the discharge associated with the 0.2-percent-annual-chance flood in this report. According to records from the stream gage located one mile upstream from Farrell at Sharon, the 1913 flood reached elevations about three feet higher than the 1959 flood and had a peak discharge of 25,200 cubic feet per second (cfs), which is more than twice as great as the discharge associated with the 0.2-percent-annual-chance flood in this report. This means that, due to the regulating effects of the Shenango Reservoir, floods of the magnitude of the 1913 and 1959 floods have a very remote probability of occurring today. This flood, which was slightly less than a 1-percent-annual-chance flood, was the result of 2.5 inches of rain falling on about four inches of snow. The Borough of Greenville has a long history of flooding of Shenango River dating back to the early 1800s. The first known flood occurred in June 1826, and was followed by the "pumpkin flood" in the fall of 1827. The flood of 1832 washed away all the bridges from Greenville to the Ohio River. Other major floods occurred in 1878 and on February 12 and 13, 1887 (Reference 23).
Normal factors that aggravate flooding, such as siltation and debris blockage, have been reduced by construction of the Shenango Reservoir. Since the completion of the reservoir, the flooding potential in Sharon has also been greatly reduced. Even runoff from the severe rains of tropical storm Agnes in 1972, which caused extensive flooding throughout the state, resulted in minor flooding in Sharon compared to the floods of the past. Wolf Creek is the major flood source of the Borough of Grove City. Most of the flooding of Wolf Creek occurs in the southern part of the borough where low overbank lands are predominant. The worst flood at Grove City occurred in 1936. Flood waters damaged buildings in the vicinity of the Penn Grove Hotel. In 1972, due to heavy rains associated with tropical storm Agnes, the Grove City Sewage Disposal Plant was surrounded by flood waters. Other floods have occurred in the past due to the backwater effect of ice jamming at bridges, dams, and channel bends. Due to the lack of accurate high water marks and a lack of flood discharges, past flood frequencies could not be determined.
2.4 Flood Protection Measures
The SCS has maintained a comprehensive work plan for the Little Shenango River watershed since 1963. This plan includes land conservation measures and floodwater detention structures. By February 1991, four of these structures had been built, and two additional structures were scheduled. These five structures control a total drainage area of 50.4 square miles and have a total storage capacity of 6,792 acre-feet (Reference 19). Two flood water retention dams and reservoirs have been built by the SCS on Mathay Run and Saul Run. The Mathay Run Dam controls a drainage area of 1.9 square miles and has a total storage capacity of 755 acre-feet. Saul Run Dam controls a drainage area of 1.1 square miles and has a total storage of 222 acre-feet (Reference 2). Both structures were designed to control a 1-percent-annual-chance flood. A levee was constructed between Wilson Street (Route 58) and East Market Street along the northwest bank of Otter Creek. The levee gives protection from the 10-percent-annual-chance flood but is topped by the 2-, 1-, and 0.2-percent-annual-chance floods. The levee was constructed during a clearing and dragging of the channel. There was no available design for the levee at the time of this study. The levee is in good condition and is maintained by cutting brush which can affect flood elevations.

11
Sandy Lake, with a drainage area of 2.6 square miles, is a privately owned recreational lake. It is a natural lake, has no flood control capability, and has little effect on flooding. Sandy Creek Dam and Lake Wilhelm (drainage area 56.5 square miles) are located approximately two miles upstream of the borough and are parts of a comprehensive development of flood controls, recreational facilities, and municipal water supplies being carried out by the Pennsylvania Fish and Boat Commission and the SCS. The dam, currently owned by the Mercer County Commission, was designed by the SCS to protect downstream communities against the 1-percent-annual-chance flood. Sawmill Run Dam, with a drainage area of 1.4 square miles, is located at the upstream corporate limits of the Borough of Stoneboro. It is owned and maintained by Mercer County. The dry-bed flood control dam was constructed by the SCS to provide protection from the 1-percent-annual-chance flood event to downstream properties. However, flooding may still occur downstream of the dam due to local runoff. Mercer County has had its flood potential greatly reduced due to the construction of the Shenango River Dam and Reservoir. The dam was constructed in 1965 by the USACE at a cost of 33 million dollars. The dam controls a 589 square mile drainage area and is used for flood protection, recreation, and low flow augmentation creating a 29,900 acre-foot summer pool and a maximum pool of 191,000 acres. The Pymatuning Dam and Reservoir, completed in 1934 by the Pennsylvania Department of Forests and Waters, is also used to regulate flow in the Shenango River for flood control and for recreation (Reference 24). The reservoir controls a drainage area of 158 square miles and has a maximum storage capacity of 188,040 acre-feet (Reference 25).
Normal factors that aggravate flooding, such as siltation and debris blockage, have been reduced by construction of the Shenango Reservoir. With the completion of the reservoir, the flooding potential has also been greatly reduced. Even runoff from the severe rains of tropical storm Agnes in 1972, which caused extensive flooding throughout the state, resulted in minor flooding compared to the floods of the past.
The SCS has proposed construction of a dike on the east bank of the Shenango River through the Borough of Greenville. With the reduction in flood flows by the Pymatuning Reservoir and the six structures on the Little Shenango River watershed, this dike will contain a 1-percent-annual-chance flood. Since the completion date of this proposed project is uncertain, the analyses in this study do not consider its effects. Concrete floodwalls along the Shenango River in the City of Sharon help to reduce flood heights and protect against erosion. Also, on both sides of Pine Run Tributary between the Shenango Valley Freeway bridge and the bridge at the intersection of Griswold and Smith Streets, concrete and fiber quilted walls reduce flooding and protect against erosion of the stream banks. An earthen embankment extends from a building, located over Pine Run just upstream of South Sharpsville Avenue, to the bridge over Pine Run to the Towne Plaza parking lot. The embankment then continues along the north side of Pine Run for another 300 feet where it ties into high ground. Although this embankment is exceeded by the 2-percent-annual-chance flood, the 10-percent-annual-chance flood is contained under present conditions.
A floodplain channel improvement project was completed in July 1979 for a section of West Branch Pine Hollow Run between Sunset Road and Easton Road. This

12
improvement was found to completely contain the 0.2-percent-annual-chance flood flow in this area.
3.0 ENGINEERING METHODS
For the flooding sources studied by detailed methods in the community, standard hydrologic and hydraulic study methods were used to determine the flood hazard data required for this study. Flood events of a magnitude that are expected to be equaled or exceeded once on the average during any 10-, 50-, 100-, or 500-year period (recurrence interval) have been selected as having special significance for floodplain management and for flood insurance rates. These events, commonly termed the 10-, 50-, 100-, and 500-year floods, have a 10-, 2-, 1-, and 0.2-percent-annual-chance, respectively, of being equaled or exceeded during any year. Although the recurrence interval represents the long-term, average period between floods of a specific magnitude, rare floods could occur at short intervals or even within the same year. The risk of experiencing a rare flood increases when periods greater than 1 year are considered. For example, the risk of having a flood that equals or exceeds the 1-percent-annual-chance (100-year) flood in any 50-year period is approximately 40 percent (4 in 10); for any 90-year period, the risk increases to approximately 60 percent (6 in 10). The analyses reported herein reflect flooding potentials based on conditions existing in the community at the time of completion of this study. Maps and flood elevations will be amended periodically to reflect future changes. 3.1 Hydrologic Analyses
Hydrologic analyses were carried out to establish the peak discharge-frequency relationships for the flooding source studied by detail methods affecting the communities within Mercer County. Information on the methods used to determine the peak discharge-frequency relationships for each flooding source studied by detailed methods is shown below. Pre-countywide Analysis
Flood flows for Black Run were obtained using the SCS Method for determination of storm runoff in small watersheds (Reference 26). Variables affecting and included in this analysis are soil types, urbanization, channel velocities, channel slopes, swampy areas, and ponding areas. This method provides a systematic method for evaluating all the essential variables and it is based on actual daily rainfall records. Because of the small drainage area and the high degree of urbanization, the Rational Method was used for Baker Run. Along Brandy Springs Run, Bobby Run, Golden Run, Hogback Run, Munnel Run, Mill Creek, Neshannock Creek, Otter Creek, Unnamed Tributary to Neshannock Creek and Wolf Creek, the 1-percent annual chance flood flows were developed at the Pennsylvania State University (PSU), using the PSU III Flood Frequency Design Manual (Reference 27). This method, based on a multiple regression analysis, is a design procedure for obtaining peak discharges of selected return periods for ungaged watersheds from 1.5 to 200 square miles in Pennsylvania. Results obtained by using the analysis were compared with historical flood elevations supplied by the USACE Pittsburgh District. The PSU III method results correspond well with the information obtained from the USACE. Peak discharges for streams studied by approximate methods were estimated by the U.S.

13
Department of Agriculture, SCS method for urban watersheds, including an unnamed stream north of Brandy Spring Community Park. West Branch Pine Hollow Run flood flows were computed using a regionalized flood flow frequency regression analysis for ungaged streams developed by the USGS (Reference 28). The Little Shenango and Shenango River watersheds were analyzed using procedures outlined in the SCS National Engineering Handbook (Reference 31). Synthetic hydrographs representing runoff from each sub-watershed above the Borough of Greenville were derived from rainfall records corresponding with dates of annual peak discharges for the Shenango and Little Shenango Rivers. The synthetic hydro-graphs were routed downstream through the Borough of Greenville and were adjusted to match actual recorded peak discharges for the Shenango and Little Shenango Rivers. Rainfall-runoff relationships were determined from a study of the soils and soil cover. Five actual storms were reproduced and routed, and a relationship was determined between peak discharges and weighted runoff. In areas controlled by dams and reservoirs, the synthetic hydrographs were routed through the structures and to the Borough of Greenville in order to determine their effects on flood peaks (Reference 19).
There are no stream gage records available for McCullough Run. The 1-percent-annual-chance flow was developed using multiple regression formulas based on factors determined from a USACE study of small streams in Pennsylvania (Reference 29). The factors used in this type of analysis are drainage area, stream length, stream slope, and basin shape. The 1-percent-annual-chance flood flows for Outlet to Sandy Lake, Sandy Creek, and Sawmill Run studied by detailed methods were determined using a USACE HEC-1 rainfall-runoff model calibrated to the June 1972 flood (Reference 30). Existing data used in calibrating the model were obtained from the SCS, National Non-Federal Dam Safety reports, and National Weather Service climatology data. There are no gage or flow records on these streams. Since Pine Run has a small ungaged urbanized watershed, the peak flows for the selected recurrence intervals were developed by the SCS method of Urban Hydrology for Small Watersheds (Reference 26). This method considers runoff based on soil types and cover for urban watersheds.
The Shenango River Reservoir regulates a drainage area of 589 square miles upstream of the City of Farrell. Values of the 10-, 2-, 1-, and 0.2-percent-annual-chance peak discharges from the reservoir were obtained from frequency ratings developed by the USACE (References 8 and 5). The 10- and 2-percent-annual-chance peak discharges have the same magnitude for both floods because for these frequency floods, the maximum release from the reservoir is a constant 5,000 cfs. Values of peak discharges for the selected recurrence intervals of Shenango River were also obtained for the USACE stream gage at the City of New Castle Water Works, which is located about 21 miles downstream from the City of Farrell. The rating for this gage was based upon records from 1965 to date, analyzed in conjunction with records from a gage located 1.5 miles downstream at the Washington Street bridge with records from 1913 to 1934 (Reference 25).

14
Using this information, the flood flows for the 10-, 2-, 1-, and 0.2-percent-annual-chance recurrence intervals for the Shenango River through the City of Farrell and the Borough of Wheatland were determined by adjusting the discharges from the reservoir for the increase in drainage area between the reservoir and the two jurisdictions. This adjustment was based upon the uncontrolled drainage area between the New Castle gage and the Shenango Reservoir. Little Yankee Run and Yankee Run, both of which are outside the study area, comprise 44 percent of this area and can be expected to be the major factor for increasing flood peaks on the Shenango River between the Shenango Reservoir and the two jurisdictions. Due to the regulation of the Shenango Reservoir, the peak discharges for the 10- and 2-percent-annual-chance floods are the same upstream of the confluence of Yankee Run. Countywide Analyses No new hydrologic analyses were conducted as part of this countywide FIS. Peak discharge-drainage area relationships for the 10-, 2-, 1-, and 0.2-percent-annual-chance floods for each stream studied by detailed methods are presented in Table 4, “Summary of Discharges.”
Table 4 – Summary of Discharges
FLOODING SOURCE AND LOCATION
DRAINAGE AREA
(sq. miles)
PEAK DISCHARGES (cfs) 10-Percent-
Annual-Chance
2-Percent-Annual-Chance
1-Percent-Annual-Chance
0.2-Percent-Annual-Chance
BAKER RUN 200 feet above East
State Street 0.57 290 363 381 442 BLACK RUN
2000 feet above confluence with Wolf Creek 4.0 760 1,330 1,560 2,400
BOBBY RUN
At Longview Road 1.96 480 720 840 1,055 GOLDEN RUN
1,800 feet north of Robertson Road/Lamor Road intersection 1.76 310 460 540 680
HOGBACK RUN
At Sample Road 2.75 560 840 980 1,230
At confluence with the Shenango River 109.0 3,065 4,625 5,380 7,100

15
Table 4 – Summary of Discharges (Continued)
FLOODING SOURCE AND LOCATION
DRAINAGE AREA
(SQ. MILES)
10%- ANNUAL- CHANCE
2%- ANNUAL- CHANCE
1%- ANNUAL- CHANCE
0.2%- ANNUAL- CHANCE
LITTLE SHENANGO
RIVER At confluence with the
Shenango River 109.0 3,065 4,625 5,380 7,100 At confluence with
Shenango River 8.2 * * 2,680 * OUTLET TO SANDY
LAKE At confluence with
Sandy Creek 7.1 * * 1,500 * Upstream of confluence
of McCutcheon Run 5.0 * * 1,300 *
PINE RUN At confluence with
Shenango River 2.5 770 1,060 1,140 1,250 At Stambaugh Avenue 2.0 680 940 1,015 1,110
SANDY CREEK
Approximately 5,000 feet upstream of Triple Link Road 64.41 * * 3,300 *
Upstream of confluence of Outlet to Sandy Lake 57.31 * * 2,000 *
SAWMILL RUN
At confluence with Sandy Lake 2.2 * * 5002 *
SHENANGO RIVER
At the confluence of Little Yankee Run 700.0 6,100 7,400 9,000 11,500
At the confluence of Yankee Run 656.0 5,550 6,200 8,000 10,400
At State Street in the City of Sharon 608.0 5,000 5,000 7,000 9,300
*Data not available 156.5 square miles of this drainage area are controlled by Lake Wilhelm 2Flow released from Sawmill Run Dam

16
Table 4 – Summary of Discharges (Continued)
FLOODING SOURCE AND LOCATION
DRAINAGE AREA
(SQ. MILES)
10%- ANNUAL- CHANCE
2%- ANNUAL- CHANCE
1%- ANNUAL- CHANCE
0.2%- ANNUAL- CHANCE
SHENANGO RIVER
(Continued) At confluence with
Thornton Run 297.0 6,850 10,160 11,775 15,600 Above confluence of the
Little Shenango River 188.0 5,890 8,735 10,130 13,420 WEST BRANCH PINE
HOLLOW RUN At Shenango Valley
Freeway (US-62) 0.82 121 204 241 350 WOLF CREEK
Greenwood Road (extended) 59.8 4,000 6,000 7,000 8,800
3.2 Hydraulic Analyses
Analyses of the hydraulic characteristics of flooding from the sources studied were carried out to provide estimates of the elevations of floods of the selected recurrence intervals. Users should be aware that flood elevations shown on the FIRM represent rounded whole foot elevations and may not exactly reflect the elevations shown on the Flood Profiles or in the Floodway Data tables in the FIS report. Flood elevations shown on the FIRM are primarily intended for flood insurance rating purposes. For construction and/or floodplain management purposes, users are cautioned to use the flood elevation data presented in this FIS in conjunction with the data shown on the FIRM. Flood profiles were drawn showing computed water-surface elevations to an accuracy of 0.5-foot for floods of the selected recurrence intervals. Locations of selected cross sections used in the hydraulic analyses are shown on the Flood Profiles (Exhibit 1). For stream segments for which a floodway is computed (Section 4.2), selected cross-section locations are also shown on the FIRM (Exhibit 2). Unless specified otherwise, the hydraulic analyses for these studies were based on unobstructed flow. The flood elevations shown on the profiles are thus considered valid only if hydraulic structures remain unobstructed, operate properly, and do not fail. All elevations shown on the Flood Profiles and FIRM (Exhibits 1 and 2) are referenced to the North American Vertical Datum of 1988 (NAVD88).

17
Pre-countywide Analyses
The flooding problem on the northwest side of Pennsylvania Route 158 of the unnamed stream north of the Brandy Spring Community Park was studied in detail using information from a report prepared by the SCS dated December 7, 1972, in conjunction with a field survey completed by Michael Baker, Jr., Inc. The flooding is due to upstream urbanization causing increased runoff, and an insufficient culvert size under Highway Number 158. Further urbanization will increase flooding. Between the Shenango River and South Dock Street, flooding from Pine Run is shallow, with unpredictable flow paths and depths of less than one foot. The bridge backs up flood waters which flow over South Dock Street and travel as sheet flow directly into the Shenango River. This type of flooding would cause mostly content damage rather than structural damage. The earthen embankment along Pine Run upstream of the building located over the stream at South Sharpsville Avenue serves as a levee which contains the 10-percent-annual-chance flood in this area. Flood magnitudes for Pine Run from the downstream side of this building to a point approximately 200 feet of the Towne Plaza parking lot bridge were reduced for the 2-, 1-, and 0.2-percent-annual-chance floods based on the maximum channel capacity in this reach. Flood waters overtopping this embankment would flow through the Towne Plaza parking lot to the lower elevations at its entrance at South Sharpsville Avenue and Bank Place. The overbank flooding in the parking lot would therefore consist of shallow flooding with depths of less than one foot. Water-surface elevations for Baker Run, Black Run, Bobby Run, Brandy Springs Run, Golden Run, Hogback Run, McCullough Run, Mill Creek, Munnel Run, Neshannock Creek, Outlet to Sandy Creek, Otter Creek, Park Run, Pine Run, Sandy Creek, Sawmill Run, Shenango River, Unnamed Tributary to Neshannock Creek, West Branch Pine Hollow Run, and Wolf Creek were computed by the slope/area method, as outlined in the USACE’s HEC-2 step-backwater computer program (Reference 32), and by extrapolation of flood profiles from detailed study reaches. For the Little Shenango River and a portion of the Shenango River (upstream of the Borough of Greenville), water-surface elevations were obtained by a continuation of the profile from the Borough of Greenville (Reference 2).
The water surface elevation for McCullough Run was started at normal depth. For the portion of the Shenango River (downstream of the Borough of Greenville), water surface elevations were obtained from the FIS report for the Borough of Greenville, while starting water-surface elevations were taken from the USGS gage rating curve at Kidds Mill Bridge (References 2 and 33). Due to the similarities of the drainage basins of the Little Shenango River and upper Shenango River, the starting water-surface elevations for the Little Shenango River were determined by backwater computations of the Shenango River. The water-surface elevations for the Shenango River (within the Township of Shenango) were generated using the National Weather Service Dam Break Model (Reference 34). Water-surface elevations generated by the computer were calibrated using gauge data and known water-surface elevations from existing FISs.

18
Starting water-surface elevations for Baker Run, Bobby Run, Golden Run, Hogback Run, and West Branch Pine Hollow Run were based on hand culvert analyses at the beginning of the study area. The starting water-surface elevations for Black Run and Wolf Creek were obtained by slope/area method of calculations with consideration of backwater downstream of the detailed area of study. The backwater effects were due to an abandoned railroad. The starting water-surface elevations for Blacks Run were correlated with the backwater effect of Wolf Creek. The starting water-surface elevations for Brandy Spring Run, Mill Creek, Munnel Run, Neshannock Creek, Otter Creek, and Unnamed Tributary to Neshannock Creek were developed by the slope-area methods. The starting water surface elevation for Outlet to Sandy Lake was obtained from a cross section located on Sandy Creek immediately downstream of the confluence of Outlet to Sandy Lake. Use of this method incorporated backwater flow from Sandy Creek into the elevations for Outlet to Sandy Lake. The starting water-surface elevation for Sandy Creek was obtained using normal depth. The starting water-surface elevation for Sawmill Run was obtained from a cross section located on Outlet to Sandy Lake immediately downstream of the confluence of Sawmill Run. Use of this method incorporated backwater flow from Outlet to Sandy Lake into the elevations for Sawmill Run. Starting water-surface elevations for Shenango River were also taken from profiles developed for the FIS reports for the City of Farrell and the Borough of Wheatland (References 1 and 13). Elevations for Shenango River (within the City of Hertimage) were computed using the slope/area method. Cross-sectional data for Baker Run, McCullough Run, Shenango River (within the Borough of Wheatland), and West Branch Pine Hollow Run were obtained by field measurement. Cross-sectional data for the backwater analysis, for Brandy Springs Run, Black Run, Mill Creek, Munnel Run, Otter Creek, Neshannock Creek, Unnamed Tributary to Neshannock Creek and Wolf Creek were obtained from field surveys taken by Michael Baker, Jr., Inc. Five cross sections were taken on Black Run and 23 cross sections were taken on Wolf Creek.
Cross-sectional data for the backwater analyses for Bobby Run, Golden Run, Hogback Run, Little Shenango River and the Shenango River (within the Borough of Greenville and the City of Hertimage) were obtained from topographic maps prepared by photogrammetric methods and aerial photographs (Reference 35).
Cross-sectional data for the backwater analysis, for Pine Run and the Shenango River (within the City of Sharon) were obtained from field surveys. For Little Shenango River, Sandy Creek, the Outlet to Sandy Lake, Sawmill Run, and a portion of the Shenango River (located upstream of the Borough of Greenville), cross-

19
sectional data used in the backwater analyses were obtained by field measurements taken in October 1987 and for McCullough Run in November 1987. In the Boroughs of Greenville and Wheatland, the below-water data for the cross sections of Little Shenango River and Shenango River were obtained by field measurement. Unless otherwise noted, all bridges, dams, and culverts in Mercer County were field-surveyed to obtain elevation data and, structural geometry in order to compute any significant backwater effects of these structures. Roughness coefficients for the channel of the Shenango River were developed from backwater computations of controlled releases from the Shenango Reservoir. Roughness values for the overbanks were estimated by field inspection and comparison with known roughness (Reference 36). Countywide Analyses No new detailed hydraulic analyses were conducted as part of this countywide FIS; however for flooding sources studied with approximate methods, the 1-percent-annual-chance flood elevations were determined using USGS Regression Equations (Reference 37) and the USACE HEC-RAS computer program (Reference 38). The peak flood discharges from the regression equations were input into a HEC-RAS model that included cross sections extracted from PAMAP LiDAR data collected in 2006 (Reference 39). Because this cross section information was not supplemented with field survey data and the models did not include bridge and culvert information, the resulting floodplain boundaries are considered approximate. Approximately 555 stream miles in the County were analyzed using this approach. Channel and overbank roughness factors used in the hydraulic computations for the remainder of the detailed streams were estimated by engineering judgment and based on field observation at each cross-section and adjusted with known high-water marks and stream gage rating curves where possible (Reference 40). Table 5, “Manning’s “n” Values,” shows the channel and overbank values for the streams studied by detailed methods.
Table 5 – Manning’s “n” Values
STREAM CHANNEL OVERBANK Baker Run 0.030-0.040 0.050-0.100 Black Run 0.060-0.010 0.060-0.010 Bobby Run 0.040-0.045 0.045-0.100 Brandy Springs Run * * Golden Run 0.030-0.045 0.050-0.100 Hogback Run 0.030-0.045 0.060-0.100 Little Shenango River 0.041 0.080 McCullough Run 0.040 0.080 Mill Creek * * Munnell Run * * *Data not available

20
Table 5 – Manning’s “n” Values (Continued)
STREAM CHANNEL OVERBANK Neshannock Creek * * Otter Creek * * Outlet to Sandy Lake 0.040 0.080-0.100 Pine Run 0.025-0.055 0.100 Sandy Creek 0.040 0.080-0.100 Sawmill Run 0.040 0.080 Shenango River 0.028-0.043 0.041-0.100 Unnamed Tributary to Neshannock Creek * * West Branch Pine Hollow Run 0.030-0.045 0.060-0.100 Wolf Creek 0.020-0.040 0.050-0.110 *Data not available
3.3 Vertical Datum
All FIS reports and FIRMs are referenced to a specific vertical datum. The vertical datum provides a starting point against which flood, ground, and structure elevations can be referenced and compared. Until recently, the standard vertical datum used for newly created or revised FIS reports and FIRMs was the National Geodetic Vertical Datum of 1929 (NGVD29). With the completion of NAVD88, many FIS reports and FIRMs are now prepared using NAVD88 as the referenced vertical datum. Flood elevations shown in this FIS report and on the FIRM are referenced to the NAVD88. These flood elevations must be compared to structure and ground elevations referenced to the same vertical datum. Some of the data used in this revision were taken from the prior effective FIS reports and FIRMs and adjusted to NAVD88. The datum conversion factor from NGVD29 to NAVD88 in Mercer County is -0.52 feet. The data points used to determine the conversion are listed in Table 6, “Vertical Datum Conversion Values.”
Table 6 – Vertical Datum Conversion Values
Quad Name Corner Longitude Latitude Conversion from
NGVD29 to NAVD88 Andover, OH SE 41.500 -80.500 -0.594 Cochranton SE 41.500 -80.000 -0.522 Conneaut Lake SE 41.500 -80.250 -0.531 Fredonia SE 41.250 -80.250 -0.522 Geneva SE 41.500 -80.125 -0.515 Greenville East SE 41.375 -80.250 -0.522 Greenville West SE 41.375 -80.375 -0.564 Greenfield SE 41.125 -80.250 -0.495

21
Table 6 – Vertical Datum Conversion Values (Continued)
Quad Name Corner Longitude Latitude Conversion from
NGVD29 to NAVD88 Grove City SE 41.125 -80.000 -0.404 Hadley SE 41.375 -80.125 -0.528 Hartstown SE 41.500 -80.375 -0.554 Jackson Center SE 41.250 -80.125 -0.449 Kinsman, OH SE 41.375 -80.500 -0.541 Mercer SE 41.125 -80.125 -0.420 New Lebanon SE 41.375 -80.000 -0.545 Orangeville, OH SE 41.250 -80.500 -0.545 Sandy Lake SE 41.250 -80.000 -0.466 Sharon East SE 41.125 -80.375 -0.515 Sharon West SE 41.125 -80.500 -0.548 Sharpsville SE 41.250 -80.375 -0.528
AVERAGE -0.515 feet For additional information regarding conversion between the NGVD29 and NAVD88, visit the National Geodetic Survey website at http://www.ngs.noaa.gov, or contact the National Geodetic Survey at the following address:
NGS Information Services NOAA, N/NGS12 National Geodetic Survey, SSMC-3, #9202 1315 East-West Highway Silver Spring, Maryland 20910-3282 (301) 713-3242
Temporary vertical monuments are often established during the preparation of a flood hazard analysis for the purpose of establishing local vertical control. Although these monuments are not shown on the FIRM, they may be found in the Technical Support Data Notebook associated with the FIS report and FIRM for this community. Interested individuals may contact FEMA to access these data. To obtain current elevation, description, and/or location information for benchmarks shown on this map, please contact the Information Services Branch of the NGS at (301) 713-3242, or visit their website at http://www.ngs.noaa.gov.
4.0 FLOODPLAIN MANAGEMENT APPLICATIONS
The NFIP encourages State and local governments to adopt sound floodplain management programs. Therefore, each FIS provides 1-percent-annual-chance (100-year) flood elevations and delineations of the 1- and 0.2-percent-annual-chance (500-year) floodplain boundaries and 1-

22
percent-annual-chance floodway to assist communities in developing floodplain management measures. This information is presented on the FIRM and in many components of the FIS report, including Flood Profiles and Floodway Data Table. Users should reference the data presented in the FIS report as well as additional information that may be available at the local map repository before making flood elevation and/or floodplain boundary determinations. 4.1 Floodplain Boundaries
To provide a national standard without regional discrimination, the 1-percent-annual-chance flood has been adopted by FEMA as the base flood for floodplain management purposes. The 0.2-percent-annual-chance flood is employed to indicate additional areas of flood risk in the community. For each stream studied by detailed methods, the 1- and 0.2-percent-annual-chance floodplain boundaries have been delineated using the flood elevations determined at each cross section. Floodplain boundaries were interpolated between cross sections using digital terrain models developed from PAMAP LiDAR data collected in 2006 (Reference 39).
For streams studied by approximate methods, only the 1-percent-annual-chance floodplain boundary is shown on the FIRM (Exhibit 2). The boundary of the 1-percent-annual-chance floodplain was delineated using digital terrain models developed from PAMAP LiDAR data collected in 2006 (Reference 39). The 1- and 0.2-percent-annual-chance floodplain boundaries are shown on the FIRM. On this map, the 1-percent-annual-chance floodplain boundary corresponds to the boundary of the areas of special flood hazards (Zones A, AE, and V), and the 0.2-percent-annual-chance floodplain boundary corresponds to the boundary of areas of moderate flood hazards. In cases where the 1- and 0.2-percent-annual-chance floodplain boundaries are close together, only the 1-percent-annual-chance floodplain boundary has been shown. Small areas within the floodplain boundaries may lie above the flood elevations but cannot be shown due to limitations of the map scale and/or lack of detailed topographic data.
4.2 Floodways
Encroachment on floodplains, such as structures and fill, reduces flood-carrying capacity, increases flood heights and velocities, and increases flood hazards in areas beyond the encroachment itself. One aspect of floodplain management involves balancing the economic gain from floodplain development against the resulting increase in flood hazard. For purposes of the NFIP, a floodway is used as a tool to assist local communities in this aspect of floodplain management. Under this concept, the area of the 1-percent-annual-chance floodplain is divided into a floodway and a floodway fringe. The floodway is the channel of a stream, plus any adjacent floodplain areas, that must be kept free of encroachment so that the 1-percent-annual-chance flood can be carried without substantial increases in flood heights. Minimum Federal standards limit such increases to 1-foot, provided that hazardous velocities are not produced. The floodways in this study are presented to local agencies as minimum standards that can be adopted directly or that can be used as a basis for additional floodway studies. The floodways presented in this FIS report and on the FIRM were computed for certain stream segments on the basis of equal-conveyance reduction from each side of the

23
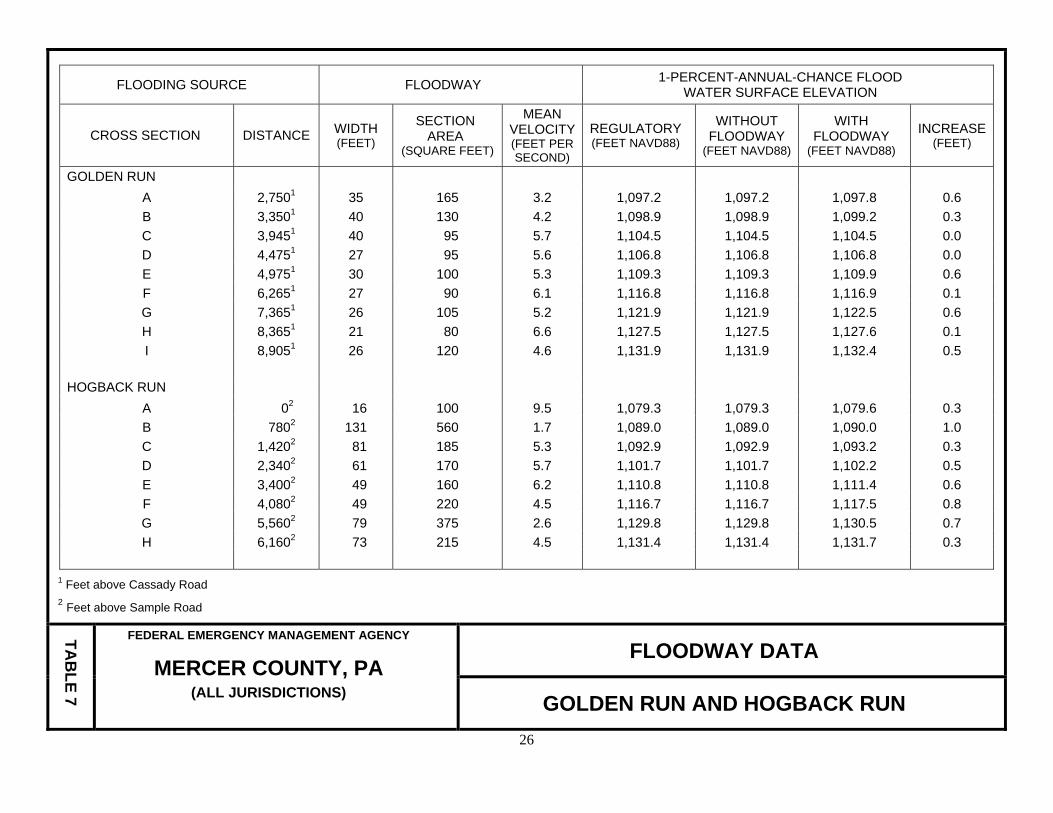
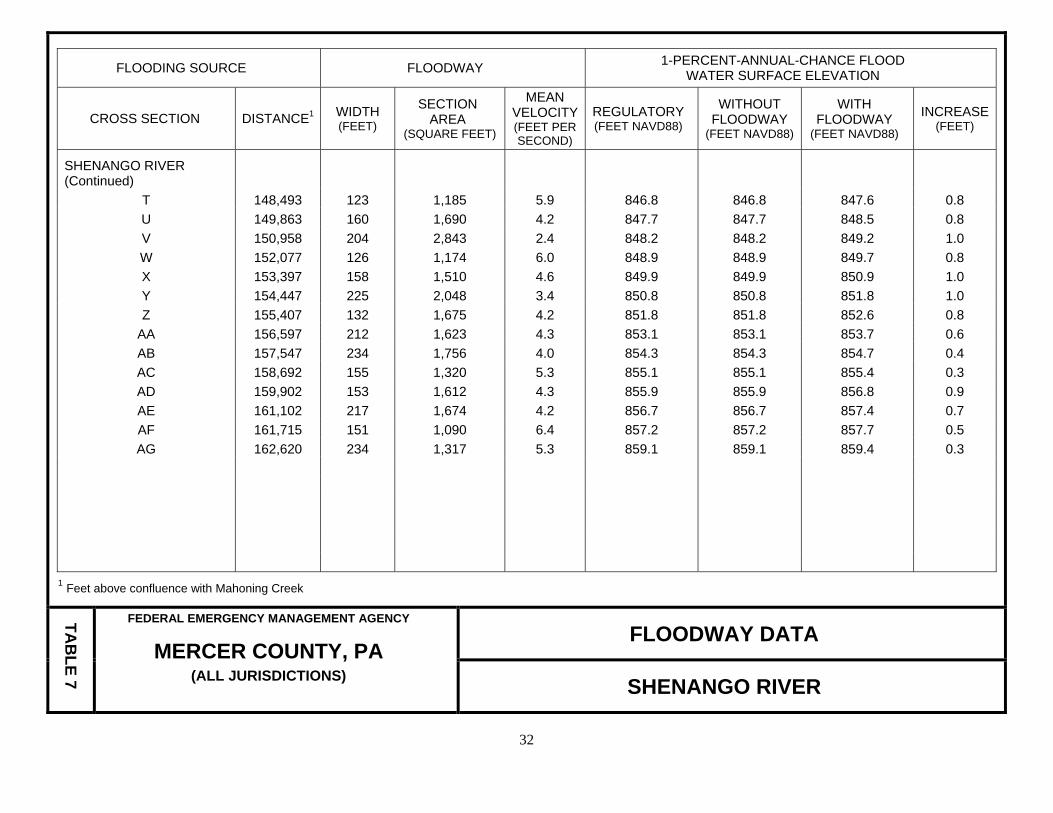
floodplain. Floodway widths were computed at cross sections. Between cross sections, the floodway boundaries were interpolated. The results of the floodway computations have been tabulated for selected cross sections (Table 7, “Floodway Data”). The computed floodways are shown on the FIRM. In cases where the floodway and 1-percent-annual-chance floodplain boundaries are either close together or collinear, only the floodway boundary has been shown. The area between the floodway and 1-percent-annual-chance floodplain boundaries is termed the floodway fringe. The floodway fringe encompasses the portion of the floodplain that could be completely obstructed without increasing the Water Surface Elevation (WSEL) of the 1-percent-annual-chance flood more than 1 foot at any point. Typical relationships between the floodway and the floodway fringe and their significance to floodplain development are shown in Figure 1. No floodways were computed for Brandy Springs Run, McCullough Run, Outlet to Sandy Lake, Sandy Creek, Sawmill Run, and Unnamed Tributary to Neshannock Creek.

24
Table 7 – Floodway Data
FLOODING SOURCE FLOODWAY 1-PERCENT-ANNUAL-CHANCE FLOOD WATER SURFACE ELEVATION
CROSS SECTION DISTANCE1 WIDTH (FEET)
SECTION AREA
(SQUARE FEET)
MEAN VELOCITY(FEET PER SECOND)
REGULATORY (FEET NAVD88)
WITHOUT FLOODWAY
(FEET NAVD88)
WITH FLOODWAY
(FEET NAVD88) INCREASE
(FEET)
BAKER RUN A 4001 41 135 2.8 1,092.2 1,092.2 1,093.2 1.0 B 1,0401 41 80 4.9 1,093.7 1,093.7 1,094.3 0.6 C 1,6651 29 75 5.0 1,097.9 1,097.9 1,097.9 0.0 D 2,4151 16 60 6.4 1,103.6 1,103.6 1,104.5 0.9 E 3,3001 24 95 4.1 1,117.7 1,117.7 1,118.4 0.7 F 3,6401 65 110 3.4 1,121.0 1,121.0 1,121.0 0.0 G 4,1001 20 55 7.1 1,131.3 1,131.3 1,131.8 0.5
BLACK RUN A 2,6252 73 618 2.7 1,245.4 1,245.4 1,246.2 0.8 B 3,0202 319 2,511 0.8 1,245.6 1,245.6 1,246.6 1.0
1 Feet above East State Street 2 Feet above confluence with Wolf Creek
TAB
LE 7
FEDERAL EMERGENCY MANAGEMENT AGENCY
MERCER COUNTY, PA (ALL JURISDICTIONS)
FLOODWAY DATA
BAKER RUN AND BLACK RUN

25
FLOODING SOURCE FLOODWAY 1-PERCENT-ANNUAL-CHANCE FLOOD WATER SURFACE ELEVATION
CROSS SECTION DISTANCE1 WIDTH (FEET)
SECTION AREA
(SQUARE FEET)
MEAN VELOCITY(FEET PER SECOND)
REGULATORY (FEET NAVD88)
WITHOUT FLOODWAY
(FEET NAVD88)
WITH FLOODWAY
(FEET NAVD88) INCREASE
(FEET)
BOBBY RUN A * 62 150 5.6 923.1 923.1 923.1 0.0 B 160 36 90 9.5 926.7 926.7 926.7 0.0 C 1,180 31 100 8.3 945.5 945.5 946.1 0.6 D 1,950 54 125 6.7 956.3 956.3 956.6 0.3 E 2,875 40 120 6.9 965.9 965.9 966.8 0.9 F 3,465 47 155 5.4 970.5 970.5 971.5 1.0 G 3,760 30 110 7.7 973.3 973.3 973.4 0.1 H 4,950 45 150 5.5 984.6 984.6 985.5 0.9
1 Feet above Long View Road
* Data not available
TAB
LE 7
FEDERAL EMERGENCY MANAGEMENT AGENCY
MERCER COUNTY, PA (ALL JURISDICTIONS)
FLOODWAY DATA
BOBBY RUN
26
FLOODING SOURCE FLOODWAY 1-PERCENT-ANNUAL-CHANCE FLOOD WATER SURFACE ELEVATION
CROSS SECTION DISTANCE WIDTH (FEET)
SECTION AREA
(SQUARE FEET)
MEAN VELOCITY(FEET PER SECOND)
REGULATORY (FEET NAVD88)
WITHOUT FLOODWAY
(FEET NAVD88)
WITH FLOODWAY
(FEET NAVD88) INCREASE
(FEET)
GOLDEN RUN A 2,7501 35 165 3.2 1,097.2 1,097.2 1,097.8 0.6 B 3,3501 40 130 4.2 1,098.9 1,098.9 1,099.2 0.3 C 3,9451 40 95 5.7 1,104.5 1,104.5 1,104.5 0.0 D 4,4751 27 95 5.6 1,106.8 1,106.8 1,106.8 0.0 E 4,9751 30 100 5.3 1,109.3 1,109.3 1,109.9 0.6 F 6,2651 27 90 6.1 1,116.8 1,116.8 1,116.9 0.1 G 7,3651 26 105 5.2 1,121.9 1,121.9 1,122.5 0.6 H 8,3651 21 80 6.6 1,127.5 1,127.5 1,127.6 0.1 I 8,9051 26 120 4.6 1,131.9 1,131.9 1,132.4 0.5
HOGBACK RUN A 02 16 100 9.5 1,079.3 1,079.3 1,079.6 0.3 B 7802 131 560 1.7 1,089.0 1,089.0 1,090.0 1.0 C 1,4202 81 185 5.3 1,092.9 1,092.9 1,093.2 0.3 D 2,3402 61 170 5.7 1,101.7 1,101.7 1,102.2 0.5 E 3,4002 49 160 6.2 1,110.8 1,110.8 1,111.4 0.6 F 4,0802 49 220 4.5 1,116.7 1,116.7 1,117.5 0.8 G 5,5602 79 375 2.6 1,129.8 1,129.8 1,130.5 0.7 H 6,1602 73 215 4.5 1,131.4 1,131.4 1,131.7 0.3
1 Feet above Cassady Road 2 Feet above Sample Road
TAB
LE 7
FEDERAL EMERGENCY MANAGEMENT AGENCY
MERCER COUNTY, PA (ALL JURISDICTIONS)
FLOODWAY DATA
GOLDEN RUN AND HOGBACK RUN

27
FLOODING SOURCE FLOODWAY 1-PERCENT-ANNUAL-CHANCE FLOOD WATER SURFACE ELEVATION
CROSS SECTION DISTANCE WIDTH (FEET)
SECTION AREA
(SQUARE FEET)
MEAN VELOCITY(FEET PER SECOND)
REGULATORY (FEET NAVD88)
WITHOUT FLOODWAY
(FEET NAVD88)
WITH FLOODWAY
(FEET NAVD88) INCREASE
(FEET)
LITTLE SHENANGO RIVER
A 2,7101 188 1,495 3.6 949.0 949.0 949.6 0.6 B 4,4751 103 791 6.8 950.7 950.7 951.1 0.4 C 5,1601 122 1,015 5.3 952.4 952.4 952.7 0.3 D 5,9701 100 557 9.7 953.9 953.9 954.1 0.2 E 6,7031 92 785 6.9 956.6 956.6 957.5 0.9
(F – J)*
MILL CREEK A 4602 676 5,351 2.1 1,097.53 1,097.5 1,098.0 0.5 B 1,2102 960 6,398 1.6 1,098.03 1,097.7 1,098.3 0.6 C 2,5902 605 2,497 4.4 1,098.83 1,098.0 1,098.9 0.9
1 Feet above confluence with Shenango River * No floodway data computed 2 Feet above Confluence with Neshannock and Otter Creeks
3 Flooding effects from Otter Creek
TAB
LE 7
FEDERAL EMERGENCY MANAGEMENT AGENCY
MERCER COUNTY, PA (ALL JURISDICTIONS)
FLOODWAY DATA
LITTLE SHENANGO RIVER AND MILL CREEK

28
FLOODING SOURCE FLOODWAY 1-PERCENT-ANNUAL-CHANCE FLOOD WATER SURFACE ELEVATION
CROSS SECTION DISTANCE1 WIDTH (FEET)
SECTION AREA
(SQUARE FEET)
MEAN VELOCITY(FEET PER SECOND)
REGULATORY (FEET NAVD88)
WITHOUT FLOODWAY
(FEET NAVD88)
WITH FLOODWAY
(FEET NAVD88) INCREASE
(FEET)
MUNNEL RUN A 340 25 211 6.2 1,098.1 1,098.1 1,098.9 0.8 B 526 40 264 5.0 1,099.8 1,099.8 1,099.9 0.1 C 816 40 220 5.9 1,099.9 1,099.9 1,100.4 0.5 D 956 40 195 6.7 1,100.0 1,100.0 1,100.8 0.8 E 1,388 35 170 7.6 1,102.8 1,102.8 1,103.1 0.3 F 1,848 129 3,230 4.2 1,110.5 1,110.5 1,110.8 0.3 G 2,193 57 182 10.0 1,111.3 1,111.3 1,112.3 1.0 H 2,446 236 742 2.8 1,115.0 1,115.0 1,116.0 1.0 I 3,116 53 191 10.7 1,122.1 1,122.1 1,123.1 1.0 J 4,280 48 172 10.9 1,135.7 1,135.7 1,135.7 0.0 K 4,617 70 268 6.7 1,139.1 1,139.1 1,140.1 1.0 L 5,029 34 190 6.9 1,146.2 1,146.2 1,146.2 0.0
1 Feet above Confluence with Otter Creek
TAB
LE 7
FEDERAL EMERGENCY MANAGEMENT AGENCY
MERCER COUNTY, PA (ALL JURISDICTIONS)
FLOODWAY DATA
MUNNEL RUN

29
FLOODING SOURCE FLOODWAY 1-PERCENT-ANNUAL-CHANCE FLOOD WATER SURFACE ELEVATION
CROSS SECTION DISTANCE1 WIDTH (FEET)
SECTION AREA
(SQUARE FEET)
MEAN VELOCITY(FEET PER SECOND)
REGULATORY (FEET NAVD88)
WITHOUT FLOODWAY
(FEET NAVD88)
WITH FLOODWAY
(FEET NAVD88) INCREASE
(FEET)
NESHANNOCK CREEK A 5,1001 994 5,146 3.9 1,093.1 1,093.1 1,094.1 1.0 B 5,8801 612 3,421 5.1 1,094.0 1,094.0 1,094.9 0.9 C 6,4401 969 5,486 3.6 1,094.6 1,094.6 1,095.6 1.0 D 6,8451 764 4,203 4.4 1,094.9 1,094.9 1,095.9 1.0 E 7,2191 136 1,424 6.8 1,096.9 1,096.9 1,096.9 0.0
OTTER CREEK A 2902 676 5,631 1.8 1,097.5 1,097.5 1,098.0 0.5 B 9482 661 5,174 1.8 1,098.0 1,098.0 1,098.7 0.7 C 1,6482 141 1,237 5.0 1,098.8 1,098.8 1,099.4 0.6 D 2,2382 128 1,012 5.3 1,099.3 1,099.3 1,100.2 0.9
1 Feet above Route 258 Bridge 2 Feet above Confluence with Neshannock and Mill Creeks
TAB
LE 7
FEDERAL EMERGENCY MANAGEMENT AGENCY
MERCER COUNTY, PA (ALL JURISDICTIONS)
FLOODWAY DATA
NESHANNOCK CREEK AND OTTER CREEK

30
FLOODING SOURCE FLOODWAY 1-PERCENT-ANNUAL-CHANCE FLOOD WATER SURFACE ELEVATION
CROSS SECTION DISTANCE1 WIDTH (FEET)
SECTION AREA
(SQUARE FEET)
MEAN VELOCITY(FEET PER SECOND)
REGULATORY (FEET NAVD88)
WITHOUT FLOODWAY
(FEET NAVD88)
WITH FLOODWAY
(FEET NAVD88) INCREASE
(FEET)
PINE RUN A 827 39 283 4.4 860.0 860.0 861.0 1.0 B 1,433 38 165 5.8 867.9 867.9 867.9 0.0 C 1,913 28 132 8.6 877.3 877.3 877.3 0.0 D 5,229 51 274 3.7 957.9 957.9 958.4 0.5 E 5,845 52 284 3.6 964.3 964.3 965.0 0.7 F 6,580 34 140 7.3 969.5 969.5 969.5 0.0 G 7,103 24 119 8.6 974.1 974.1 974.5 0.4 H 7,889 36 166 6.2 985.0 985.0 985.0 0.0
1 Feet above Confluence with Shenango River
TAB
LE 7
FEDERAL EMERGENCY MANAGEMENT AGENCY
MERCER COUNTY, PA (ALL JURISDICTIONS)
FLOODWAY DATA
PINE RUN

31
FLOODING SOURCE FLOODWAY 1-PERCENT-ANNUAL-CHANCE FLOOD WATER SURFACE ELEVATION
CROSS SECTION DISTANCE1 WIDTH (FEET)
SECTION AREA
(SQUARE FEET)
MEAN VELOCITY(FEET PER SECOND)
REGULATORY (FEET NAVD88)
WITHOUT FLOODWAY
(FEET NAVD88)
WITH FLOODWAY
(FEET NAVD88) INCREASE
(FEET)
SHENANGO RIVER A 123,497 2,055 13,860 0.6 832.6 832.6 833.6 1.0 B 126,107 1,285 10,180 0.9 832.8 832.8 833.8 1.0 C 127,997 343 3,980 2.3 833.0 833.0 834.0 1.0 D 128,727 650 5,445 1.7 833.2 833.2 834.2 1.0 E 129,287 390 2,770 3.2 833.2 833.2 834.2 1.0 F 130,043 160 1,890 4.8 833.3 833.3 834.3 1.0 G 131,623 170 2,115 4.2 834.4 834.4 835.3 0.9 H 132,970 214 1,980 4.9 835.1 835.1 836.1 1.0 I 134,670 166 1,803 5.0 836.0 836.0 837.0 1.0 J 135,633 146 1,649 5.4 836.5 836.5 837.4 0.9 K 136,513 124 1,791 5.0 836.9 836.9 837.9 1.0 L 137,172 152 2,198 4.1 837.3 837.3 838.2 0.9 M 138,238 223 2,421 3.7 837.6 837.6 838.5 0.9 N 139,216 139 1,214 7.4 837.9 837.9 838.7 0.8 O 140,323 124 1,200 7.5 839.9 839.9 840.4 0.5 P 142,306 182 1,797 5.0 844.9 844.9 845.4 0.5 Q 143,306 147 1,906 4.8 845.3 845.3 846.3 1.0 R 144,450 169 2,133 3.8 845.9 845.9 846.7 0.8 S 147,421 139 1,670 4.2 846.4 846.4 847.4 1.0
1 Feet above confluence with Mahoning Creek
TAB
LE 7
FEDERAL EMERGENCY MANAGEMENT AGENCY
MERCER COUNTY, PA (ALL JURISDICTIONS)
FLOODWAY DATA
SHENANGO RIVER
32
FLOODING SOURCE FLOODWAY 1-PERCENT-ANNUAL-CHANCE FLOOD WATER SURFACE ELEVATION
CROSS SECTION DISTANCE1 WIDTH (FEET)
SECTION AREA
(SQUARE FEET)
MEAN VELOCITY(FEET PER SECOND)
REGULATORY (FEET NAVD88)
WITHOUT FLOODWAY
(FEET NAVD88)
WITH FLOODWAY
(FEET NAVD88) INCREASE
(FEET)
SHENANGO RIVER (Continued)
T 148,493 123 1,185 5.9 846.8 846.8 847.6 0.8 U 149,863 160 1,690 4.2 847.7 847.7 848.5 0.8 V 150,958 204 2,843 2.4 848.2 848.2 849.2 1.0 W 152,077 126 1,174 6.0 848.9 848.9 849.7 0.8 X 153,397 158 1,510 4.6 849.9 849.9 850.9 1.0 Y 154,447 225 2,048 3.4 850.8 850.8 851.8 1.0 Z 155,407 132 1,675 4.2 851.8 851.8 852.6 0.8
AA 156,597 212 1,623 4.3 853.1 853.1 853.7 0.6 AB 157,547 234 1,756 4.0 854.3 854.3 854.7 0.4 AC 158,692 155 1,320 5.3 855.1 855.1 855.4 0.3 AD 159,902 153 1,612 4.3 855.9 855.9 856.8 0.9 AE 161,102 217 1,674 4.2 856.7 856.7 857.4 0.7 AF 161,715 151 1,090 6.4 857.2 857.2 857.7 0.5 AG 162,620 234 1,317 5.3 859.1 859.1 859.4 0.3
1 Feet above confluence with Mahoning Creek
TAB
LE 7
FEDERAL EMERGENCY MANAGEMENT AGENCY
MERCER COUNTY, PA (ALL JURISDICTIONS)
FLOODWAY DATA
SHENANGO RIVER

33
FLOODING SOURCE FLOODWAY 1-PERCENT-ANNUAL-CHANCE FLOOD WATER SURFACE ELEVATION
CROSS SECTION DISTANCE1 WIDTH (FEET)
SECTION AREA
(SQUARE FEET)
MEAN VELOCITY(FEET PER SECOND)
REGULATORY (FEET NAVD88)
WITHOUT FLOODWAY
(FEET NAVD88)
WITH FLOODWAY
(FEET NAVD88) INCREASE
(FEET)
SHENANGO RIVER (Continued)
(AH – AO)* AP 14,919 204 2,643 4.5 941.8 941.8 942.8 1.0 AQ 15,724 205 2,124 5.5 942.4 942.4 943.3 0.9 AR 17,171 371 2,265 5.2 943.6 943.6 944.3 0.7 AS 18,345 250 2,947 4.0 947.0 947.0 947.8 0.8 AT 20,214 646 4,457 2.3 948.6 948.6 949.5 0.9 AU 21,289 714 5,467 1.9 949.0 949.0 950.0 1.0
(AV – AY)*
1 Feet above confluence with Big Run * No floodway data computed
TAB
LE 7
FEDERAL EMERGENCY MANAGEMENT AGENCY
MERCER COUNTY, PA (ALL JURISDICTIONS)
FLOODWAY DATA
SHENANGO RIVER

34
FLOODING SOURCE FLOODWAY 1-PERCENT-ANNUAL-CHANCE FLOOD WATER SURFACE ELEVATION
CROSS SECTION DISTANCE1 WIDTH (FEET)
SECTION AREA
(SQUARE FEET)
MEAN VELOCITY(FEET PER SECOND)
REGULATORY (FEET NAVD88)
WITHOUT FLOODWAY
(FEET NAVD88)
WITH FLOODWAY
(FEET NAVD88) INCREASE
(FEET)
WEST BRANCH PINE HOLLOW RUN
A 25 23 49 4.9 1,071.2 1,071.2 1,071.4 0.2 B 550 14 44 5.5 1,076.8 1,076.8 1,077.3 0.5 C 1,070 20 34 7.0 1,081.3 1,081.3 1,081.3 0.0 D 1,340 28 42 5.8 1,084.6 1,084.6 1,084.6 0.0 E 1,990 28 41 5.8 1,091.1 1,091.1 1,091.1 0.0 F 2,850 16 29 8.4 1,101.3 1,101.3 1,101.3 0.0 G 3,270 11 26 9.3 1,106.7 1,106.7 1,106.7 0.0
1 Feet above Shenango Valley Freeway (US-62)
TAB
LE 7
FEDERAL EMERGENCY MANAGEMENT AGENCY
MERCER COUNTY, PA (ALL JURISDICTIONS)
FLOODWAY DATA
WEST BRANCH PINE HOLLOW RUN

35
FLOODING SOURCE FLOODWAY 1-PERCENT-ANNUAL-CHANCE FLOOD WATER SURFACE ELEVATION
CROSS SECTION DISTANCE1 WIDTH (FEET)
SECTION AREA
(SQUARE FEET)
MEAN VELOCITY(FEET PER SECOND)
REGULATORY (FEET NAVD88)
WITHOUT FLOODWAY
(FEET NAVD88)
WITH FLOODWAY
(FEET NAVD88) INCREASE
(FEET)
WOLF CREEK A 54,750 1,042 7,751 1.6 1,220.4 1,220.4 1,221.2 0.8 B 55,625 386 1,966 4.2 1,220.4 1,220.4 1,221.3 0.9 C 56,100 228 1,142 8.0 1,221.0 1,221.0 1,221.5 0.5 D 56,790 304 1,869 6.5 1,222.7 1,222.7 1,223.7 1.0 E 57,605 811 3,871 3.6 1,224.0 1,224.0 1,225.0 1.0 F 58,760 304 2,025 5.7 1,225.3 1,225.3 1,225.9 0.6 G 59,510 364 1,858 5.8 1,226.3 1,226.3 1,226.9 0.6 H 60,065 120 1,031 6.8 1,226.7 1,226.7 1,227.7 1.0 I 60,745 112 872 8.0 1,228.7 1,228.7 1,229.1 0.4 J 61,226 230 1,258 5.6 1,233.8 1,233.8 1,233.8 0.0 K 62,166 114 950 7.4 1,234.8 1,234.8 1,235.1 0.3 L 62,346 142 1,485 4.7 1,235.7 1,235.7 1,235.9 0.2 M 63,546 75 808 8.7 1,236.9 1,236.9 1,236.9 0.0 N 64,032 66 816 8.6 1,238.4 1,238.4 1,238.7 0.3 O 64,640 100 1,439 4.9 1,241.0 1,241.0 1,241.8 0.8 P 65,165 149 1,791 4.1 1,241.4 1,241.4 1,242.2 0.8 Q 65,863 130 1,786 4.2 1,241.7 1,241.7 1,242.6 0.9 R 66,483 103 1,174 6.4 1,241.8 1,241.8 1,242.6 0.8 S 67,298 143 2,093 3.3 1,244.6 1,244.6 1,245.6 1.0 T 67,638 526 6,805 1.1 1,244.8 1,244.8 1,245.8 1.0
1 Feet above Slippery Rock Creek
TAB
LE 7
FEDERAL EMERGENCY MANAGEMENT AGENCY
MERCER COUNTY, PA (ALL JURISDICTIONS)
FLOODWAY DATA
WOLF CREEK

36
Figure 1 - Floodway Schematic
5.0 INSURANCE APPLICATIONS
For flood insurance rating purposes, flood insurance zone designations are assigned to a community based on the results of the engineering analyses. These zones are as follows: Zone A Zone A is the flood insurance rate zone that corresponds to the 1-percent-annual-chance floodplains that are determined in the FIS report by approximate methods. Because detailed hydraulic analyses are not performed for such areas, no base (1-percent-annual-chance) flood elevations (BFEs) or depths are shown within this zone. Zone AE Zone AE is the flood insurance rate zone that corresponds to the 1-percent-annual-chance floodplains that are determined in the FIS report by detailed methods. Whole-foot BFEs derived from the detailed hydraulic analyses are shown at selected intervals within this zone.

37
Zone AH Zone AH is the flood insurance rate zone that corresponds to areas of 1-percent-annual-chance shallow flooding (usually areas of ponding) where average depths are between 1 and 3 feet. Whole-foot BFEs derived from the detailed hydraulic analyses are shown at selected intervals within this zone. Zone AO Zone AO is the flood insurance rate zone that corresponds to areas of 1-percent-annual-chance shallow flooding (usually sheet flow on sloping terrain) where average depths are between 1 and 3 feet. Average whole-foot depths derived from the detailed hydraulic analyses are shown within this zone. Zone AR Zone AR is the flood insurance risk zone that corresponds to an area of special flood hazard formerly protected from the base flood event by a flood-control system that was subsequently decertified. Zone AR indicates that the former flood-control system is being restored to provide protection from the 1-percent-annual-chance or greater flood event. Zone A99 Zone A99 is the flood insurance rate zone that corresponds to areas of the 1-percent-annual-chance floodplain that will be protected by a Federal flood protection system where construction has reached specified statutory milestones. No BFEs or depths are shown within this zone. Zone V Zone V is the flood insurance rate zone that corresponds to the 1-percent-annual-chance coastal floodplains that have additional hazards associated with storm waves. Because approximate hydraulic analyses are performed for such areas, no BFEs are shown within this zone. Zone VE Zone VE is the flood insurance rate zone that corresponds to the 1-percent-annual-chance coastal floodplains that have additional hazards associated with storm waves. Whole-foot BFEs derived from the detailed hydraulic analyses are shown at selected intervals within this zone. Zone X Zone X is the flood insurance rate zone that corresponds to areas outside the 0.2-percent-annual-chance floodplain, areas within the 0.2-percent-annual-chance floodplain, areas of 1-percent-annual-chance flooding where average depths are less than 1 foot, areas of 1-percent-annual-chance flooding where the contributing drainage area is less than 1 square mile (sq. mi.), and areas protected from the base flood by levees. No BFEs or depths are shown within this zone.

38
Zone X (Future Base Flood) Zone X (Future Base Flood) is the flood insurance risk zone that corresponds to the 1-percent-annual-chance floodplains that are determined based on future-conditions hydrology. No BFEs or base flood depths are shown within this zone. Zone D Zone D is the flood insurance rate zone that corresponds to unstudied areas where flood hazards are undetermined, but possible.
6.0 FLOOD INSURANCE RATE MAP
The FIRM is designed for flood insurance and floodplain management applications. For flood insurance applications, the map designates flood insurance risk zones as described in Section 5.0 and, in the 1-percent-annual-chance floodplains that were studied by detailed methods, shows selected whole-foot BFEs or average depths. Insurance agents use the zones and BFEs in conjunction with information on structures and their contents to assign premium rates for flood insurance policies. For floodplain management applications, the map shows by tints, screens, and symbols, the 1- and 0.2-percent-annual-chance floodplains, floodways, and the locations of selected cross sections used in the hydraulic analyses and floodway computations. The countywide FIRM presents flooding information for the geographic area of Mercer County. Previously, FIRMs were prepared for each incorporated community of the County identified as flood-prone. This countywide FIRM also includes flood hazard information that was presented separately on Flood Boundary and Floodway Maps (FBFMs), where applicable. Historical data relating to the maps prepared for each community are presented in Table 8, “Community Map History.”

39
Table 24– Community Map History
COMMUNITY NAME
INITIAL IDENTIFICATION
FLOOD HAZARD BOUNDARY MAP REVISIONS DATE
FIRM EFFECTIVE DATE
FIRM REVISIONS DATE
Clark, Borough of December 27, 1974 None July 30, 1982
Coolspring, Township of September 20, 1974 May 21, 1976 September 17, 1982
Deer Creek, Township of* None
Delaware, Township of July 11, 1975 None July 30, 1982
East Lackawannock, Township of September 6, 1974 June 18, 1976 July 23, 1982
Fairview, Township of November 29, 1974 None January 1, 19871
Farrell, City of June 28, 1974 None April 17, 1978
Findley, Township of September 13, 1974 April 30, 1976 February 4, 1983
Fredonia, Borough of* None
French Creek, Township of June 3, 1977 None June 1, 19861
Greene, Township of January 31, 1975 None June 30, 1976
Greenville, Borough of August 23, 1974 August 27, 1976 July 16, 1981
Grove City, Borough of January 4, 1974 October 15, 1976 September 30, 1977
Hempfield, Township of August 30, 1974 April 30, 1976 February 15, 1991
Hermitage, City of September 20, 1974 July 9, 1976 September 30, 1981 1Converted by Letter *Non-Floodprone Community
TAB
LE 8
FEDERAL EMERGENCY MANAGEMENT AGENCY
MERCER COUNTY, PA (ALL JURISDICTIONS)
COMMUNITY MAP HISTORY

40
Map History
COMMUNITY NAME
INITIAL IDENTIFICATION
FLOOD HAZARD BOUNDARY MAP REVISIONS DATE
FIRM EFFECTIVE DATE
FIRM REVISIONS DATE
Jackson Center, Borough of January 3, 1975 None June 18, 1982
Jackson, Township of January 17, 1975 None December 19, 1980
Jamestown, Borough of January 3, 1975 None September 10, 1982
Jefferson, Township of January 10, 1975 None June 1, 19861
Lackawannock, Township of January 17, 1975 None June 30, 1976
Lake, Township of January 31, 1975 None June 18, 1982
Liberty, Township of February 25, 1977 None June 1, 19861
Mercer, Borough of June 15, 1973 None March 15, 1977
Mill Creek, Township of December 20, 1974 June 18, 1976 June 7, 1979
December 17, 1982
New Lebanon, Borough of January 24, 1975 None September 10, 1982
New Vernon, Township of January 31, 1975 None October 15, 1982
Otter Creek, Township of January 31, 1975 None December 1, 19861
Perry, Township of January 31, 1975 None December 17, 1982
Pine, Township of November 15, 1974 July 9, 1976 February 25, 1983
Pymatuning, Township of November 15, 1974 None June 1, 19891 1Converted by Letter
TAB
LE 8
FEDERAL EMERGENCY MANAGEMENT AGENCY
MERCER COUNTY, PA (ALL JURISDICTIONS)
COMMUNITY MAP HISTORY

41
History
COMMUNITY NAME
INITIAL IDENTIFICATION
FLOOD HAZARD BOUNDARY MAP REVISIONS DATE
FIRM EFFECTIVE DATE
FIRM REVISIONS DATE
Salem, Township of October 3, 1975 None May 1, 19861
Sandy Creek, Township of September 20, 1974 June 11, 1976 October 1, 19861
Sandy Lake, Borough of January 16, 1974 June 18, 1976 March 18, 1991
Sandy Lake, Township of December 13, 1974 February 15, 1980 September 3, 1982
Sharon, City of August 2, 1974 None October 17, 1978
Sharpsville, Borough of* None
Sheakleyville, Borough of* None
Shenango, Township of May 17, 1974 May 14, 1976 May 7, 1982
September 4, 1991
South Pymatuning, Township of January 24, 1975 None March 18, 1991
Springfield, Township of December 13, 1974 August 13, 1976 July 16, 1982
Stoneboro, Borough of July 26, 1974 June 11, 1976 March 18, 1991
Sugar Grove, Township of January 31, 1975 None September 17, 1982
West Middlesex, Borough of April 12, 1974 June 25, 1976 April 30, 1982
September 4, 1991 1Converted by Letter *Non-Floodprone Community
TAB
LE 8
FEDERAL EMERGENCY MANAGEMENT AGENCY
MERCER COUNTY, PA (ALL JURISDICTIONS)
COMMUNITY MAP HISTORY

42
COMMUNITY NAME
INITIAL IDENTIFICATION
FLOOD HAZARD BOUNDARY MAP REVISIONS DATE
FIRM EFFECTIVE DATE
FIRM REVISIONS DATE
West Salem, Township of January 24, 1975 None January 21, 1983
Wheatland, Borough of July 19, 1974 None February 15, 1978
Wilmington, Township of February 7, 1975 None February 4, 1983
Wolf Creek, Township of January 31, 1975 None June 25, 1982
Worth, Township of January 24, 1975 None February 4, 1983
TAB
LE 8
FEDERAL EMERGENCY MANAGEMENT AGENCY
MERCER COUNTY, PA (ALL JURISDICTIONS)
COMMUNITY MAP HISTORY

43
7.0 OTHER STUDIES
This FIS report either supersedes or is compatible with all previous studies published on streams studied in this report and should be considered authoritative for the purposes of the NFIP.
8.0 LOCATION OF DATA
Information concerning the pertinent data used in preparation of this study can be obtained by contacting the Natural and Technological Hazards Division, FEMA, Liberty Square Building (Second Floor), 105 South Seventh Street, Philadelphia, PA 19106.
9.0 BIBLIOGRAPHY AND REFERENCES
1. U.S. Department of Housing and Urban Development, Federal Insurance Administration,
Flood Insurance Study, City of Farrell, Mercer County, Pennsylvania, Washington, D.C., October 1977.
2. Federal Emergency Management Agency, Federal Insurance Administration, Flood
Insurance Study, Borough of Greenville, Mercer County, Pennsylvania, Washington, D.C., January 16, 1981.
3. U.S. Department of Housing and Urban Development, Federal Insurance Administration,
Flood Insurance Study, Borough of Grove City, Mercer County, Pennsylvania, Washington, D.C., September 1977.
4. Federal Emergency Management Agency, Federal Insurance Administration, Flood
Insurance Study, Municipality of Hempfield, Mercer County, Pennsylvania, Washington, D.C., February 15, 1991.
5. Federal Emergency Management Agency, Federal Insurance Administration, Flood
Insurance Study, Township of Hermitage, Mercer County, Pennsylvania, Washington, D.C., March 30, 1991.
6. U.S. Department of Housing and Urban Development, Federal Insurance Administration,
Flood Insurance Study, Borough of Mercer, Mercer County, Pennsylvania, Washington, D.C., September 1976.
7. Federal Emergency Management Agency, Flood Insurance Study, Borough of Sandy
Lake, Mercer County, Pennsylvania, Washington, D.C., March 18, 1991. 8. U.S. Department of Housing and Urban Development, Federal Insurance Administration,
Flood Insurance Study, City of Sharon, Mercer County, Pennsylvania, Washington, D.C., April 1978.
9. Federal Emergency Management Agency, Flood Insurance Study, Township of
Shenango, Mercer County, Pennsylvania, Washington, D.C., September 4, 1991. 10. Federal Emergency Management Agency, Flood Insurance Study, Township of South
Pymatuning, Mercer County, Pennsylvania, Washington, D.C., March 18, 1991.

44
11. Federal Emergency Management Agency, Flood Insurance Study, Borough of Stoneboro,
Mercer County, Pennsylvania, Washington, D.C., March 18, 1991. 12. Federal Emergency Management Agency, Flood Insurance Study, Borough of West
Middlesex, Mercer County, Pennsylvania, Washington, D.C., September 4, 1991. 13. U.S. Department of Housing and Urban Development, Federal Insurance Administration,
Flood Insurance Study, Borough of Wheatland, Mercer County, Pennsylvania, Washington, D.C., August, 1977.
14. U.S. Census Bureau, 2000 Census: Mercer County, Pennsylvania. Retrieved February
27, 2007 from http://www.factfinder.census.gov. 15. The Weather Channel, Monthly Averages for Mercer County, Pennsylvania. Retrieved
February 27, 2007 from http://www.weather.com. 16. U.S. Department of Agriculture, Soil Conservation Service, Soil Survey of Mercer
County, Washington, D.C., April 1971. 17. U.S. Department of Agriculture, Soil Conservation Service, Work Plan, Little Shenango
River Watershed, Crawford and Mercer Counties, Pennsylvania, Washington, D.C., April 1963.
18. U.S. Department of Agriculture, Soil Conservation Service, Work Plan, Saul-Mathay
Watershed, Mercer County, Pennsylvania, Washington, D.C., March 1960. 19. Commonwealth of Pennsylvania, Department of Internal Affairs, Topographic and
Geologic Survey, Geologic Map of Pennsylvania, Harrisburg, Pennsylvania, 1960. 20. Pennsylvania Geological Survey, "Glacial Geology of Northwestern Pennsylvania,"
Bulletin G-32, Fourth Series, 1959. 21. The Sharon Herald, "Shenango River Reservoir, Dedication Edition," Sharon,
Pennsylvania, September 17, 1965. 22. Bureau of Resources Programming, Department of Environmental Resources, Flood
Damages Inventory, Harrisburg, Pennsylvania, 1974. 23. The Greenville Record Argus, Centennial Edition 1838-1938, Greenville, Pennsylvania,
1978. 24. U.S. Department of the Interior, Geological Survey, Water Resources Data for
Pennsylvania, Part 1, Surface Water Records, Harrisburg, Pennsylvania, 1961-1975. 25. U.S. Department of the Interior, Office of Water Data Coordination, Catalog of
Information on Water Data, Water Resources Region 05, Harrisburg, Pennsylvania, 1972. 26. U.S. Department of Agriculture, Soil Conservation Service, Urban Hydrology for Small
Watersheds, Technical Release No. 55,: U.S. Government Printing Office, Washington, D.C., 1975.

45
27. Reich, B.M. et al., Flood Peak Frequency Design Manual PSU III, Civil Engineering
Department, The Pennsylvania State University, June 1971. 28. Commonwealth of Pennsylvania, Department of Environmental Resources, in
cooperation with the U.S. Geological Survey, Water Resources Bulletin No. 13, Floods in Pennsylvania, A Manual for Estimation of their Magnitude and Frequency by Herbert J. Flippo, Jr., Harrisburg, Pennsylvania, October 1977.
29. U.S. Army Corps of Engineers, Pittsburgh District, Untitled Regression Data, Pittsburgh,
Pennsylvania, 1975. 30. U.S. Army Corps of Engineers, Hydrologic Engineering Center, HEC-1 Flood
Hydrograph Package, Davis, California, October 1970. 31. U.S. Department of Agriculture, Soil Conservation Service, National Engineering
Handbook, Section 4, Hydrology, Part I, Watershed Planning, U.S. Government Printing Office, Washington, D.C., August 1972.
32. U.S. Army, Corps of Engineers, HEC-2 Water Surface Profiles - Users Manual,
Hydrologic Engineering Center, Davis, CA, October 1973. 33. Commonwealth of Pennsylvania, Department of Forests and Waters, in cooperation with
the U.S. Geological Survey, Elevations of Major Floods Along Pennsylvania Rivers, Harrisburg, Pennsylvania, 1942.
34. National Weather Service (NWS), National Oceanic and Atmospheric Administration,
NWS Dam Break Model, Silver Spring, Maryland, 1984. 35. Michael Baker, Jr., Inc., Pennsylvania, Planimetric Maps Compiled from Air Photos,
Scale 1:9,600, Contour Interval 4 Feet: Borough of Greenville, Mercer County, Pennsylvania, flown in December 1978 (Unpublished).
36. U.S. Department of the Interior, Geological Survey, Roughness Characteristics of Natural
Channels, U.S. Government Printing Office, Washington, D.C., 1967.
37. U.S. Department of the Interior, Geological Survey, Scientific Investigations Report 2008-5102, Regression Equations for Estimating Flood Flows at Selected Recurrence Intervals for Ungaged Streams in Pennsylvania, by Mark A. Roland and Marla H. Stuckey, Reston, Virginia, 2008.
38. U.S. Army Corps of Engineers, Hydrologic Engineering Center, HEC-RAS River Analysis System, Version 4.0, Davis, California, March 2008.
39. Pennsylvania Department of Conservation and Natural Resources, Bureau of
Topographic and Geologic Survey, PAMAP Program, 2006 PAMAP Program LiDAR Data of Pennsylvania (West Central, SPCS North), Middletown, Pennsylvania, March 2007.
40. Ven Te Chow, Open-Channel Hydraulics, McGraw-Hill, New York, 1959.


