mepdg darwin-me status and implementation efforts. dar… · 1 darwin-me status and implementation...
TRANSCRIPT
1
Darwin-ME Status and Implementation Efforts_IAC09
Design Guide Implementation Team
MEPDG Darwin-ME
Status and
Implementation Efforts
Idaho Asphalt Conference
October 22, 2009
Design Guide Implementation Team
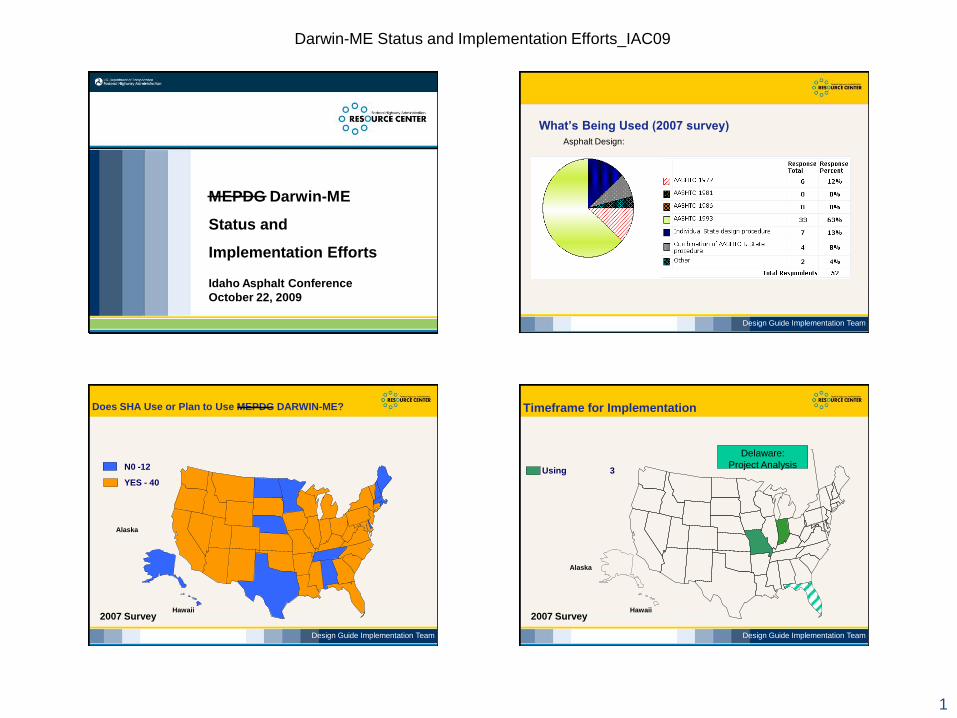
What’s Being Used (2007 survey)
Asphalt Design:
Design Guide Implementation Team
Hawaii
Alaska
Does SHA Use or Plan to Use MEPDG DARWIN-ME?
N0 -12
YES - 40
2007 Survey
Design Guide Implementation Team
Hawaii
Alaska
Timeframe for Implementation
Using 3
2007 Survey
Delaware:
Project Analysis
2
Darwin-ME Status and Implementation Efforts_IAC09
Design Guide Implementation Team
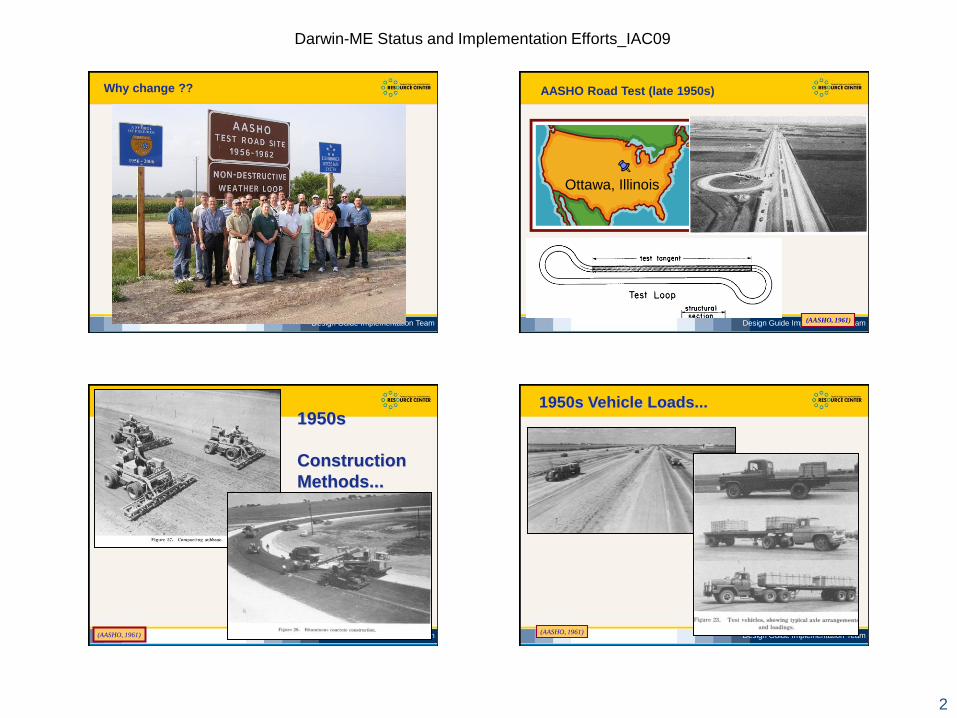
Why change ??
Design Guide Implementation Team
AASHO Road Test (late 1950s)
(AASHO, 1961)
Ottawa, Illinois
Design Guide Implementation Team
1950s
Construction
Methods...
(AASHO, 1961) Design Guide Implementation Team
1950s Vehicle Loads...
(AASHO, 1961)

3
Darwin-ME Status and Implementation Efforts_IAC09
Design Guide Implementation Team
Data
Limits
(AASHO
Road
Test)
Current
Designs
>100
million<2 million
AXLE LOAD REPETITIONS
PA
VE
ME
NT
TH
ICK
NE
SS
Current design traffic
is far beyond road
test limits
Limitations AASHTO Loadings
Design Guide Implementation Team
Maximum Asphalt layer thickness at the AASHO Road Test?
0
1
2
3
4
5
6
7
1 2 3 4 5 6 7 8 9 10 11 12 13 14 15 16 17 18
AASHO Rod Test Sections
Asp
hal
t L
ayer
Th
ickn
ess
(in
)
Design Guide Implementation Team
Thickness Distribution of MEPDG Calibration Sections
0
2
4
6
8
10
12
14
16
18
1 6 11 16 21 26 31 36 41 46 51 56 61 66 71 76 81 86 91 96 101 106
Section
As
ph
alt
Th
ick
ne
ss
(in
)
Design Guide Implementation Team
Practical Design Aspect (Conceptual)
0
2
4
6
8
10
12
14
50 60 70 80 90 100
Relaibility
Th
ickn
ess
4
Darwin-ME Status and Implementation Efforts_IAC09
Design Guide Implementation Team
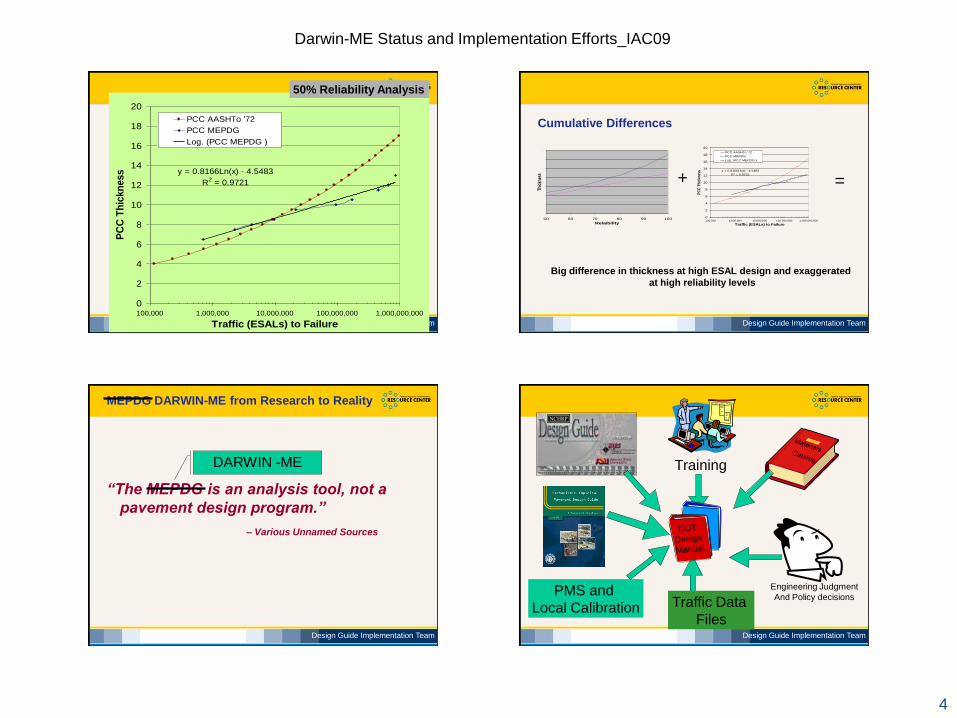
y = 0.8166Ln(x) - 4.5483
R2 = 0.9721
0
2
4
6
8
10
12
14
16
18
20
100,000 1,000,000 10,000,000 100,000,000 1,000,000,000
Traffic (ESALs) to Failure
PC
C T
hic
kn
ess
PCC AASHTo '72
PCC MEPDG
Log. (PCC MEPDG )
50% Reliability Analysis
Design Guide Implementation Team
Cumulative Differences
0
2
4
6
8
10
12
14
50 60 70 80 90 100
Relaibility
Thic
knes
s
y = 0.8166Ln(x) - 4.5483
R2 = 0.9721
0
2
4
6
8
10
12
14
16
18
20
100,000 1,000,000 10,000,000 100,000,000 1,000,000,000
Traffic (ESALs) to Failure
PC
C T
hic
knes
s
PCC AASHTo '72
PCC MEPDG
Log. (PCC MEPDG )
+ =
Big difference in thickness at high ESAL design and exaggerated
at high reliability levels
Design Guide Implementation Team
MEPDG DARWIN-ME from Research to Reality
“The MEPDG is an analysis tool, not a
pavement design program.”
– Various Unnamed Sources
DARWIN -ME
Design Guide Implementation Team
Engineering Judgment
And Policy decisionsTraffic Data
Files
Training
PMS and
Local Calibration

5
Darwin-ME Status and Implementation Efforts_IAC09
Design Guide Implementation Team17
Prep-ME
Arkansas Software Capabilities:
Import Raw Data
Traffic Data Check
Interpolate Climate and Traffic Data
Retrieve Material Data
• Dynamic Modulus
• CTE
• Mr
Design Guide Implementation Team18
Software Capabilities-Import Raw Data
Climate: icm files
Traffic: AHTD Traffic Monitoring Data
Design Guide Implementation Team19
Software Capabilities-Traffic Data Check
Design Guide Implementation Team20
Software Capabilities-Materials E*

6
Darwin-ME Status and Implementation Efforts_IAC09
Design Guide Implementation Team21
Software Capabilities- Retrieving Data
Design Guide Implementation Team22
Software Capabilities-Geo-Mapping Utility
Design Guide Implementation Team23
Software Capabilities-Generated Files
Design Guide Implementation Team
Use the experts in your Backyard…………
Arkansas DOT contracted with University of Arkansas
Dr. Kevin Hall
Indiana DOT contracted with INDOT Research / Purdue University
Dr. Tommy Nantung
7
Darwin-ME Status and Implementation Efforts_IAC09
Design Guide Implementation Team
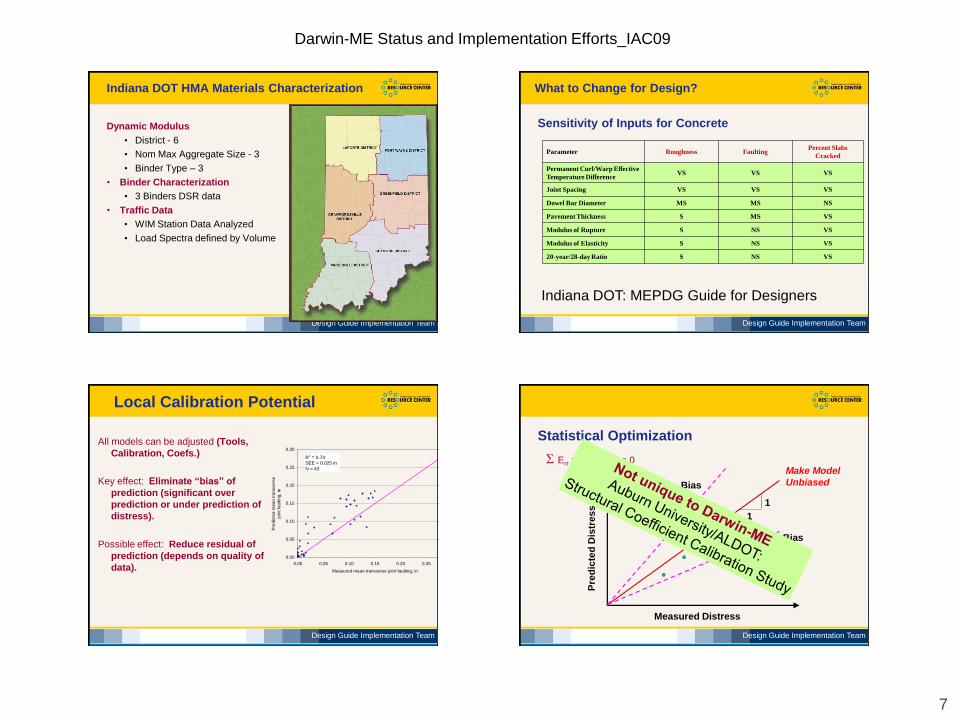
Indiana DOT HMA Materials Characterization
Dynamic Modulus
• District - 6
• Nom Max Aggregate Size - 3
• Binder Type – 3
• Binder Characterization
• 3 Binders DSR data
• Traffic Data
• WIM Station Data Analyzed
• Load Spectra defined by Volume
Design Guide Implementation Team
Sensitivity of Inputs for Concrete
Parameter Roughness FaultingPercent Slabs
Cracked
Permanent Curl/Warp Effective
Temperature DifferenceVS VS VS
Joint Spacing VS VS VS
Dowel Bar Diameter MS MS NS
Pavement Thickness S MS VS
Modulus of Rupture S NS VS
Modulus of Elasticity S NS VS
20-year/28-day Ratio S NS VS
Indiana DOT: MEPDG Guide for Designers
What to Change for Design?
Design Guide Implementation Team
Local Calibration Potential
All models can be adjusted (Tools,
Calibration, Coefs.)
Key effect: Eliminate “bias” of
prediction (significant over
prediction or under prediction of
distress).
Possible effect: Reduce residual of
prediction (depends on quality of
data).
0.00
0.05
0.10
0.15
0.20
0.25
0.30
0.00 0.05 0.10 0.15 0.20 0.25 0.30
Measured mean transverse joint faulting, in
Pre
dic
ted
me
an
tra
nsve
rse
join
t fa
ultin
g, in
R2 = 0.74
SEE = 0.025 in
N = 43
Design Guide Implementation Team
Statistical Optimization
S Err = (xip – xim) = 0
1
1
Bias
Bias
Make Model
Unbiased
Measured Distress
Pre
dic
ted
Dis
tre
ss

8
Darwin-ME Status and Implementation Efforts_IAC09
Design Guide Implementation Team
A few thoughts on calibration:
• Step 1: Become comfortable with MEPDG as it stands
• Step 2: Does it reflect current pavement performance?
• Use actual performance data & engineering experience
• Results from MEPDG will be different than AASHTO 93
• Step 3: Is there a bias in MEPDG prediction ?
• Step 4: Does the MEPDG capture special material
properties ?
• OGFC, SMA, Polymer, WMA, Rubber Asphalt, etc…
• Unique Structural Design
Design Guide Implementation Team
Good Calibration and Implementation Document
Montana DOT
http://www.mdt.mt.gov/research/projects/pave/pave_model.shtml
Major Findings:
• Preservation Practice Extend Performance
• Most models adequate for design
• Re-calibrate unbound materials rutting
Design Guide Implementation Team
Continual Improvement
• Continued MEPDG Validation
Design Guide Implementation Team
S11– As Built – Rut Depths
0.0
2.0
4.0
6.0
8.0
10.0
12.0
14.0
11
/9/2
00
6
12
/9/2
00
6
1/8
/20
07
2/7
/20
07
3/9
/20
07
4/8
/20
07
5/8
/20
07
6/7
/20
07
7/7
/20
07
8/6
/20
07
9/5
/20
07
10
/5/2
00
7
11
/4/2
00
7
12
/4/2
00
7
1/3
/20
08
2/2
/20
08
3/3
/20
08
4/2
/20
08
5/2
/20
08
6/1
/20
08
7/1
/20
08
7/3
1/2
00
8
Date
Ru
t D
ep
th,
mm
0.E
+0
0
1.E
+0
6
2.E
+0
6
3.E
+0
6
4.E
+0
6
5.E
+0
6
6.E
+0
6
7.E
+0
6
8.E
+0
6
ESALs
S11
MEPDG
at Auburn University

9
Darwin-ME Status and Implementation Efforts_IAC09
Design Guide Implementation Team
S11– As Built – Fatigue Cracking
0
5
10
15
20
25
30
35
40
10
/10
/20
06
1/1
8/2
00
7
4/2
8/2
00
7
8/6
/20
07
11
/14
/20
07
2/2
2/2
00
8
6/1
/20
08
9/9
/20
08
12
/18
/20
08
3/2
8/2
00
9
Date
Bo
tto
m-U
p F
atig
ue
Cra
ckin
g,
% o
f L
an
e
MEPDG
Measured
at Auburn University
Design Guide Implementation Team
Continued Validationat Auburn University
Design Guide Implementation Team
What about Polymers?
Design Guide Implementation Team
Strain Response
Looking at Strains Directlyat Auburn University

10
Darwin-ME Status and Implementation Efforts_IAC09
Design Guide Implementation Team
0%
10%
20%
30%
40%
50%
60%
70%
80%
90%
100%
0.0 100.0 200.0 300.0 400.0 500.0
Microstrain
Pe
rce
nti
le
Average
+15
-15
N3 2003
N4 2003
N3 2006
N4 2006
at Auburn University
Darwin-ME
output
Design Guide Implementation Team
Training Opportunities
NHI #131064 – Introduction to Mechanistic Design
NHI #131109 - Using Mechanistic-Empirical Pavement Design Guide Software
NHI #132040 – Geotechnical Aspects of Pavements
NHI #151018 – Application of Traffic Monitoring Guide
Design Guide Implementation Team
Training / Collaboration Opportunities
FHWA Regional WIM/Traffic Workshop
– Boise, Idaho Sept 2009
FHWA Resource Center on request training
MEPDG Regional Meetings
Look out for DARWIN- ME roll out
Summer 2010
Design Guide Implementation Team
Previous & On-Going Studies
NCHRP 1-41 – Models for Predicting Reflection Cracking
of HMA Overlays (2008)
NCHRP 1-42A – Models for Predicting Top-Down
Cracking of HMA Layers (2008)
NCHRP 9-29 – Simple Performance Tester for
Superpave Mix Design (2008)
NCHRP 9-38 – Endurance Limit of HMA Mixtures to
Prevent Fatigue Cracking (2008)
NCHRP 9-44 – Develop Plan for Validating an Endurance
Limit for HMA (2008)
NCHRP 9-44A – Validating an Endurance Limit for HMA

11
Darwin-ME Status and Implementation Efforts_IAC09
Design Guide Implementation Team
Previous & On-Going Studies
SHRP 2 Project R-21 – Composite Pavement Systems
NCHRP 1-46 – Development of AASHTO Pavement
Handbook (2008)
NCHRP 1-47 – Sensitivity Analysis of MEPDG (2011)
NCHRP 4-36 – Characterization of Cementitiously
Stabilized Layers for Use in Pavement Design
and Analysis (not awarded)
Design Guide Implementation Team
Previous & On-Going Studies
Calibration Documents:
• NCHRP Digest 284, December 2003; Refining the
Calibration & Validation of HMA Performance Models: An
Experimental Plan and Database.
• NCHRP Digest 283, December 2003; Jackknife Testing –
An Experimental Approach to Refine Model Calibration and
Validation.
FHWA: Use of PMS data for local calibration.
FHWA: Use of deflection basin data in the MEPDG.
Design Guide Implementation Team
What is DARWin ME going to look like?
• Runtime Improvement
• 35-45 minutes to less than 15 minutes
• Thickness Optimization
• Database Structure
• New GUI Interface
• Backwards Compatible with earlier MEPDG versions
• Stand Alone EICM
• Sensitivity Analysis
• Enhanced Batch Mode features and reports
• Structural response output
• SI Units
No Fundamental
Theory Changes
Design Guide Implementation Team
Perspective
•1960 – Completion of Road Test Experiment
•1961-62 AASHO Interim Guide of Rigid and Flexible Pavements
•1972 AASHTO Interim Guide for the Design of Pavements
•1981 Revised Chapter III on PCC Pavement Design
•1986 Guide for the Design of Pavement Structures
•1993 Revised Overlay Design Procedures
•1998 Supplement to Concrete Design Procedures
Darwin-ME
Coming to a computer
near you:
January 2011

12
Darwin-ME Status and Implementation Efforts_IAC09
Design Guide Implementation Team
$4,317