menu collections - menu analysis report · kcal fat (g) cho (g) chol (mg) pro (g) dfib (g) na (mg)...
TRANSCRIPT
Menu Item Name Portion SizeWeight
(g)KCAL FAT (g) CHO (g)
CHOL
(mg)PRO (g) DFIB (g) Na (mg) K (mg) Ca (mg) Fe (mg)
Vit A
(RAE)
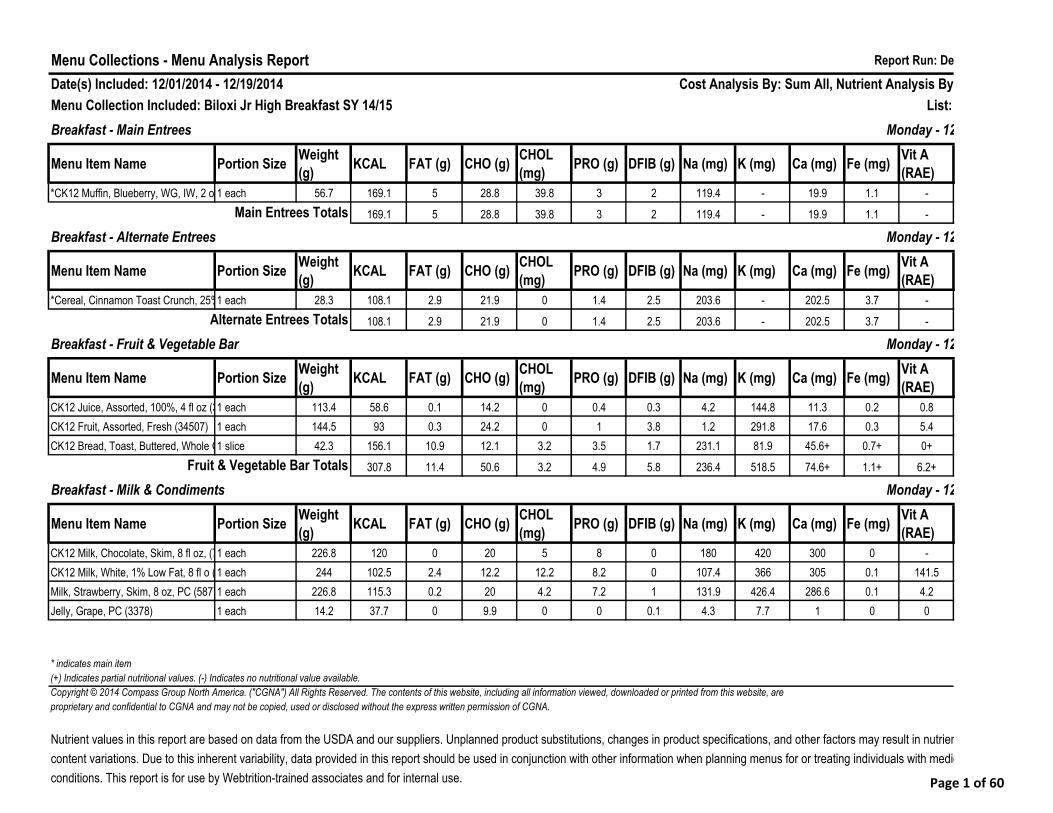
*CK12 Muffin, Blueberry, WG, IW, 2 oz (70560)1 each 56.7 169.1 5 28.8 39.8 3 2 119.4 - 19.9 1.1 -
169.1 5 28.8 39.8 3 2 119.4 - 19.9 1.1 -
Menu Item Name Portion SizeWeight
(g)KCAL FAT (g) CHO (g)
CHOL
(mg)PRO (g) DFIB (g) Na (mg) K (mg) Ca (mg) Fe (mg)
Vit A
(RAE)
*Cereal, Cinnamon Toast Crunch, 25% L (33388)1 each 28.3 108.1 2.9 21.9 0 1.4 2.5 203.6 - 202.5 3.7 -
108.1 2.9 21.9 0 1.4 2.5 203.6 - 202.5 3.7 -
Menu Item Name Portion SizeWeight
(g)KCAL FAT (g) CHO (g)
CHOL
(mg)PRO (g) DFIB (g) Na (mg) K (mg) Ca (mg) Fe (mg)
Vit A
(RAE)
CK12 Juice, Assorted, 100%, 4 fl oz (34497)1 each 113.4 58.6 0.1 14.2 0 0.4 0.3 4.2 144.8 11.3 0.2 0.8
CK12 Fruit, Assorted, Fresh (34507) 1 each 144.5 93 0.3 24.2 0 1 3.8 1.2 291.8 17.6 0.3 5.4
CK12 Bread, Toast, Buttered, Whole G (34761.16)1 slice 42.3 156.1 10.9 12.1 3.2 3.5 1.7 231.1 81.9 45.6+ 0.7+ 0+
307.8 11.4 50.6 3.2 4.9 5.8 236.4 518.5 74.6+ 1.1+ 6.2+
Menu Item Name Portion SizeWeight
(g)KCAL FAT (g) CHO (g)
CHOL
(mg)PRO (g) DFIB (g) Na (mg) K (mg) Ca (mg) Fe (mg)
Vit A
(RAE)
CK12 Milk, Chocolate, Skim, 8 fl oz, (70682)1 each 226.8 120 0 20 5 8 0 180 420 300 0 -
CK12 Milk, White, 1% Low Fat, 8 fl o (69531)1 each 244 102.5 2.4 12.2 12.2 8.2 0 107.4 366 305 0.1 141.5
Milk, Strawberry, Skim, 8 oz, PC (58772)1 each 226.8 115.3 0.2 20 4.2 7.2 1 131.9 426.4 286.6 0.1 4.2
Jelly, Grape, PC (3378) 1 each 14.2 37.7 0 9.9 0 0 0.1 4.3 7.7 1 0 0
* indicates main item
Copyright © 2014 Compass Group North America. ("CGNA") All Rights Reserved. The contents of this website, including all information viewed, downloaded or printed from this website, are
proprietary and confidential to CGNA and may not be copied, used or disclosed without the express written permission of CGNA.
Nutrient values in this report are based on data from the USDA and our suppliers. Unplanned product substitutions, changes in product specifications, and other factors may result in nutrient
content variations. Due to this inherent variability, data provided in this report should be used in conjunction with other information when planning menus for or treating individuals with medical
conditions. This report is for use by Webtrition-trained associates and for internal use.
Menu Collections - Menu Analysis Report Report Run: Dec 01, 2014
Date(s) Included: 12/01/2014 - 12/19/2014 Cost Analysis By: Sum All, Nutrient Analysis By: Sum All
Menu Collection Included: Biloxi Jr High Breakfast SY 14/15 List: All Items
Breakfast - Main Entrees Monday - 12/01/2014
Main Entrees Totals
Breakfast - Alternate Entrees Monday - 12/01/2014
Alternate Entrees Totals
Breakfast - Fruit & Vegetable Bar Monday - 12/01/2014
Fruit & Vegetable Bar Totals
Breakfast - Milk & Condiments Monday - 12/01/2014
(+) Indicates partial nutritional values. (-) Indicates no nutritional value available.
Page 1 of 60
Menu Item Name Portion SizeWeight
(g)KCAL FAT (g) CHO (g)
CHOL
(mg)PRO (g) DFIB (g) Na (mg) K (mg) Ca (mg) Fe (mg)
Vit A
(RAE)
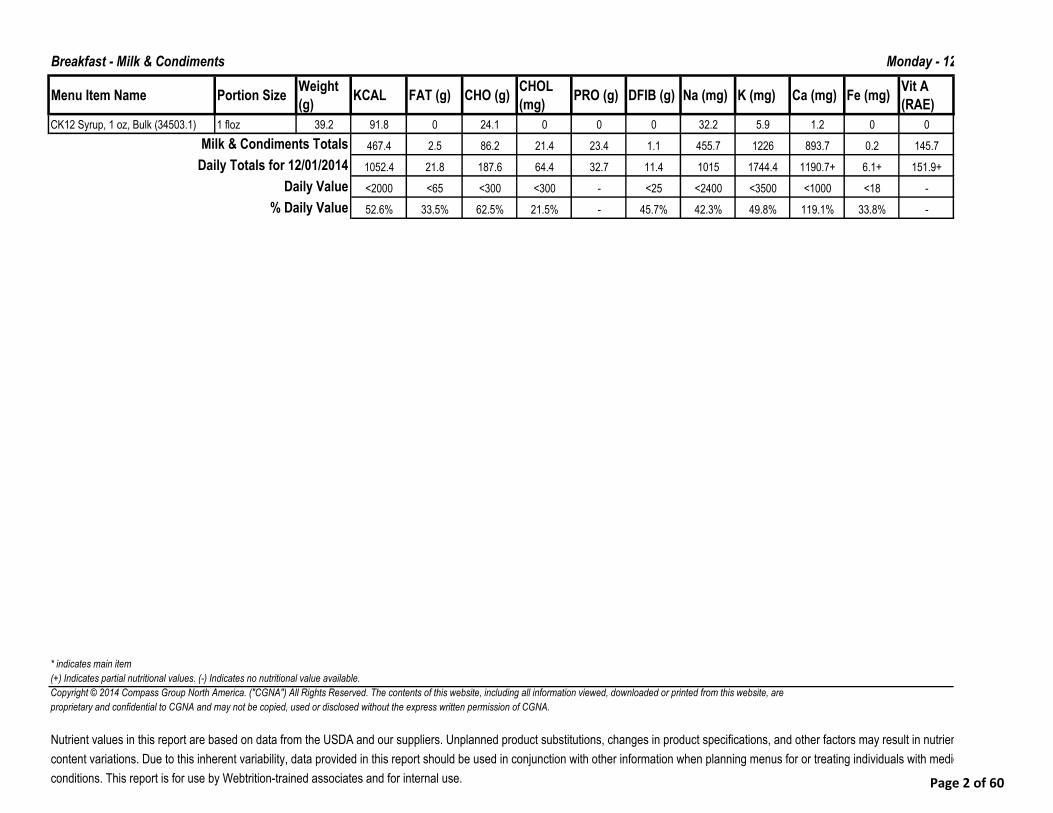
CK12 Syrup, 1 oz, Bulk (34503.1) 1 floz 39.2 91.8 0 24.1 0 0 0 32.2 5.9 1.2 0 0
467.4 2.5 86.2 21.4 23.4 1.1 455.7 1226 893.7 0.2 145.7
1052.4 21.8 187.6 64.4 32.7 11.4 1015 1744.4 1190.7+ 6.1+ 151.9+
<2000 <65 <300 <300 - <25 <2400 <3500 <1000 <18 -
52.6% 33.5% 62.5% 21.5% - 45.7% 42.3% 49.8% 119.1% 33.8% -
* indicates main item
Copyright © 2014 Compass Group North America. ("CGNA") All Rights Reserved. The contents of this website, including all information viewed, downloaded or printed from this website, are
proprietary and confidential to CGNA and may not be copied, used or disclosed without the express written permission of CGNA.
Nutrient values in this report are based on data from the USDA and our suppliers. Unplanned product substitutions, changes in product specifications, and other factors may result in nutrient
content variations. Due to this inherent variability, data provided in this report should be used in conjunction with other information when planning menus for or treating individuals with medical
conditions. This report is for use by Webtrition-trained associates and for internal use.
Breakfast - Milk & Condiments Monday - 12/01/2014
Milk & Condiments Totals
Daily Totals for 12/01/2014
Daily Value
% Daily Value
(+) Indicates partial nutritional values. (-) Indicates no nutritional value available.
Page 2 of 60
Menu Item Name Portion SizeWeight
(g)KCAL FAT (g) CHO (g)
CHOL
(mg)PRO (g) DFIB (g) Na (mg) K (mg) Ca (mg) Fe (mg)
Vit A
(RAE)
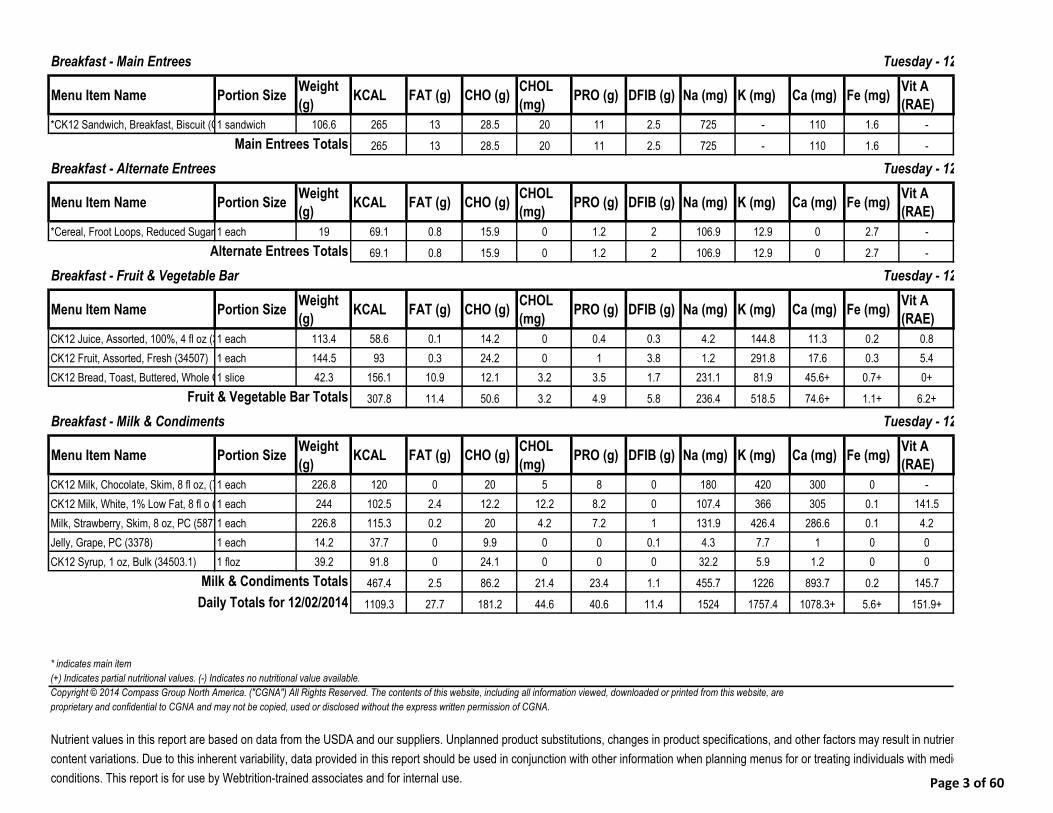
*CK12 Sandwich, Breakfast, Biscuit (G (34539.21)1 sandwich 106.6 265 13 28.5 20 11 2.5 725 - 110 1.6 -
265 13 28.5 20 11 2.5 725 - 110 1.6 -
Menu Item Name Portion SizeWeight
(g)KCAL FAT (g) CHO (g)
CHOL
(mg)PRO (g) DFIB (g) Na (mg) K (mg) Ca (mg) Fe (mg)
Vit A
(RAE)
*Cereal, Froot Loops, Reduced Sugar, (37041)1 each 19 69.1 0.8 15.9 0 1.2 2 106.9 12.9 0 2.7 -
69.1 0.8 15.9 0 1.2 2 106.9 12.9 0 2.7 -
Menu Item Name Portion SizeWeight
(g)KCAL FAT (g) CHO (g)
CHOL
(mg)PRO (g) DFIB (g) Na (mg) K (mg) Ca (mg) Fe (mg)
Vit A
(RAE)
CK12 Juice, Assorted, 100%, 4 fl oz (34497)1 each 113.4 58.6 0.1 14.2 0 0.4 0.3 4.2 144.8 11.3 0.2 0.8
CK12 Fruit, Assorted, Fresh (34507) 1 each 144.5 93 0.3 24.2 0 1 3.8 1.2 291.8 17.6 0.3 5.4
CK12 Bread, Toast, Buttered, Whole G (34761.16)1 slice 42.3 156.1 10.9 12.1 3.2 3.5 1.7 231.1 81.9 45.6+ 0.7+ 0+
307.8 11.4 50.6 3.2 4.9 5.8 236.4 518.5 74.6+ 1.1+ 6.2+
Menu Item Name Portion SizeWeight
(g)KCAL FAT (g) CHO (g)
CHOL
(mg)PRO (g) DFIB (g) Na (mg) K (mg) Ca (mg) Fe (mg)
Vit A
(RAE)
CK12 Milk, Chocolate, Skim, 8 fl oz, (70682)1 each 226.8 120 0 20 5 8 0 180 420 300 0 -
CK12 Milk, White, 1% Low Fat, 8 fl o (69531)1 each 244 102.5 2.4 12.2 12.2 8.2 0 107.4 366 305 0.1 141.5
Milk, Strawberry, Skim, 8 oz, PC (58772)1 each 226.8 115.3 0.2 20 4.2 7.2 1 131.9 426.4 286.6 0.1 4.2
Jelly, Grape, PC (3378) 1 each 14.2 37.7 0 9.9 0 0 0.1 4.3 7.7 1 0 0
CK12 Syrup, 1 oz, Bulk (34503.1) 1 floz 39.2 91.8 0 24.1 0 0 0 32.2 5.9 1.2 0 0
467.4 2.5 86.2 21.4 23.4 1.1 455.7 1226 893.7 0.2 145.7
1109.3 27.7 181.2 44.6 40.6 11.4 1524 1757.4 1078.3+ 5.6+ 151.9+
* indicates main item
Copyright © 2014 Compass Group North America. ("CGNA") All Rights Reserved. The contents of this website, including all information viewed, downloaded or printed from this website, are
proprietary and confidential to CGNA and may not be copied, used or disclosed without the express written permission of CGNA.
Nutrient values in this report are based on data from the USDA and our suppliers. Unplanned product substitutions, changes in product specifications, and other factors may result in nutrient
content variations. Due to this inherent variability, data provided in this report should be used in conjunction with other information when planning menus for or treating individuals with medical
conditions. This report is for use by Webtrition-trained associates and for internal use.
Breakfast - Main Entrees Tuesday - 12/02/2014
Main Entrees Totals
Breakfast - Alternate Entrees Tuesday - 12/02/2014
Alternate Entrees Totals
Breakfast - Fruit & Vegetable Bar Tuesday - 12/02/2014
Fruit & Vegetable Bar Totals
Breakfast - Milk & Condiments Tuesday - 12/02/2014
Milk & Condiments Totals
Daily Totals for 12/02/2014
(+) Indicates partial nutritional values. (-) Indicates no nutritional value available.
Page 3 of 60

<2000 <65 <300 <300 - <25 <2400 <3500 <1000 <18 -
55.5% 42.5% 60.4% 14.9% - 45.5% 63.5% 50.2% 107.8% 31.4% -
* indicates main item
Copyright © 2014 Compass Group North America. ("CGNA") All Rights Reserved. The contents of this website, including all information viewed, downloaded or printed from this website, are
proprietary and confidential to CGNA and may not be copied, used or disclosed without the express written permission of CGNA.
Nutrient values in this report are based on data from the USDA and our suppliers. Unplanned product substitutions, changes in product specifications, and other factors may result in nutrient
content variations. Due to this inherent variability, data provided in this report should be used in conjunction with other information when planning menus for or treating individuals with medical
conditions. This report is for use by Webtrition-trained associates and for internal use.
Daily Value
% Daily Value
(+) Indicates partial nutritional values. (-) Indicates no nutritional value available.
Page 4 of 60

Menu Item Name Portion SizeWeight
(g)KCAL FAT (g) CHO (g)
CHOL
(mg)PRO (g) DFIB (g) Na (mg) K (mg) Ca (mg) Fe (mg)
Vit A
(RAE)
*CK12 Chicken, Nuggets, WG (Tyson 703 (35365.12)5 each 97.8 263.3 15 16.3 25.1 16.3 2.5 401.3 - 25.1 2.3 -
263.3 15 16.3 25.1 16.3 2.5 401.3 - 25.1 2.3 -
Menu Item Name Portion SizeWeight
(g)KCAL FAT (g) CHO (g)
CHOL
(mg)PRO (g) DFIB (g) Na (mg) K (mg) Ca (mg) Fe (mg)
Vit A
(RAE)
*Cereal, Frosted Flakes, Reduced Suga (34026)1 each 28 106.1 0.1 24.9 - 1.7 0.3 159 38.6 0 4.1 -
106.1 0.1 24.9 - 1.7 0.3 159 38.6 0 4.1 -
Menu Item Name Portion SizeWeight
(g)KCAL FAT (g) CHO (g)
CHOL
(mg)PRO (g) DFIB (g) Na (mg) K (mg) Ca (mg) Fe (mg)
Vit A
(RAE)
CK12 Juice, Assorted, 100%, 4 fl oz (34497)1 each 113.4 58.6 0.1 14.2 0 0.4 0.3 4.2 144.8 11.3 0.2 0.8
CK12 Fruit, Assorted, Fresh (34507) 1 each 144.5 93 0.3 24.2 0 1 3.8 1.2 291.8 17.6 0.3 5.4
CK12 Bread, Toast, Buttered, Whole G (34761.16)1 slice 42.3 156.1 10.9 12.1 3.2 3.5 1.7 231.1 81.9 45.6+ 0.7+ 0+
307.8 11.4 50.6 3.2 4.9 5.8 236.4 518.5 74.6+ 1.1+ 6.2+
Menu Item Name Portion SizeWeight
(g)KCAL FAT (g) CHO (g)
CHOL
(mg)PRO (g) DFIB (g) Na (mg) K (mg) Ca (mg) Fe (mg)
Vit A
(RAE)
CK12 Milk, Chocolate, Skim, 8 fl oz, (70682)1 each 226.8 120 0 20 5 8 0 180 420 300 0 -
CK12 Milk, White, 1% Low Fat, 8 fl o (69531)1 each 244 102.5 2.4 12.2 12.2 8.2 0 107.4 366 305 0.1 141.5
Milk, Strawberry, Skim, 8 oz, PC (58772)1 each 226.8 115.3 0.2 20 4.2 7.2 1 131.9 426.4 286.6 0.1 4.2
Jelly, Grape, PC (3378) 1 each 14.2 37.7 0 9.9 0 0 0.1 4.3 7.7 1 0 0
CK12 Syrup, 1 oz, Bulk (34503.1) 1 floz 39.2 91.8 0 24.1 0 0 0 32.2 5.9 1.2 0 0
467.4 2.5 86.2 21.4 23.4 1.1 455.7 1226 893.7 0.2 145.7
1144.6 29 178 49.7 46.3 9.7 1252.4 1783.1 993.4+ 7.7+ 151.9+
* indicates main item
Copyright © 2014 Compass Group North America. ("CGNA") All Rights Reserved. The contents of this website, including all information viewed, downloaded or printed from this website, are
proprietary and confidential to CGNA and may not be copied, used or disclosed without the express written permission of CGNA.
Nutrient values in this report are based on data from the USDA and our suppliers. Unplanned product substitutions, changes in product specifications, and other factors may result in nutrient
content variations. Due to this inherent variability, data provided in this report should be used in conjunction with other information when planning menus for or treating individuals with medical
conditions. This report is for use by Webtrition-trained associates and for internal use.
Breakfast - Main Entrees Wednesday - 12/03/2014
Main Entrees Totals
Breakfast - Alternate Entrees Wednesday - 12/03/2014
Alternate Entrees Totals
Breakfast - Fruit & Vegetable Bar Wednesday - 12/03/2014
Fruit & Vegetable Bar Totals
Breakfast - Milk & Condiments Wednesday - 12/03/2014
Milk & Condiments Totals
Daily Totals for 12/03/2014
(+) Indicates partial nutritional values. (-) Indicates no nutritional value available.
Page 5 of 60

<2000 <65 <300 <300 - <25 <2400 <3500 <1000 <18 -
57.2% 44.7% 59.3% 16.6% - 38.7% 52.2% 50.9% 99.3% 42.6% -
* indicates main item
Copyright © 2014 Compass Group North America. ("CGNA") All Rights Reserved. The contents of this website, including all information viewed, downloaded or printed from this website, are
proprietary and confidential to CGNA and may not be copied, used or disclosed without the express written permission of CGNA.
Nutrient values in this report are based on data from the USDA and our suppliers. Unplanned product substitutions, changes in product specifications, and other factors may result in nutrient
content variations. Due to this inherent variability, data provided in this report should be used in conjunction with other information when planning menus for or treating individuals with medical
conditions. This report is for use by Webtrition-trained associates and for internal use.
Daily Value
% Daily Value
(+) Indicates partial nutritional values. (-) Indicates no nutritional value available.
Page 6 of 60

Menu Item Name Portion SizeWeight
(g)KCAL FAT (g) CHO (g)
CHOL
(mg)PRO (g) DFIB (g) Na (mg) K (mg) Ca (mg) Fe (mg)
Vit A
(RAE)
*CK12 French Toast, Sticks, WG (Aunt (34512.4)3 each 72.3 225.9 9.8 32.4 0 4.5 1.5 286.2 60.2 45.2 1.4 -
225.9 9.8 32.4 0 4.5 1.5 286.2 60.2 45.2 1.4 -
Menu Item Name Portion SizeWeight
(g)KCAL FAT (g) CHO (g)
CHOL
(mg)PRO (g) DFIB (g) Na (mg) K (mg) Ca (mg) Fe (mg)
Vit A
(RAE)
*Cereal, Cheerios Apple Cinnamon, Bow (59646)1 each 26.6 102.9 1.5 21.6 0 2 1.7 104 59.5 88.6 4 -
102.9 1.5 21.6 0 2 1.7 104 59.5 88.6 4 -
Menu Item Name Portion SizeWeight
(g)KCAL FAT (g) CHO (g)
CHOL
(mg)PRO (g) DFIB (g) Na (mg) K (mg) Ca (mg) Fe (mg)
Vit A
(RAE)
CK12 Juice, Assorted, 100%, 4 fl oz (34497)1 each 113.4 58.6 0.1 14.2 0 0.4 0.3 4.2 144.8 11.3 0.2 0.8
CK12 Fruit, Assorted, Fresh (34507) 1 each 144.5 93 0.3 24.2 0 1 3.8 1.2 291.8 17.6 0.3 5.4
CK12 Bread, Toast, Buttered, Whole G (34761.16)1 slice 42.3 156.1 10.9 12.1 3.2 3.5 1.7 231.1 81.9 45.6+ 0.7+ 0+
307.8 11.4 50.6 3.2 4.9 5.8 236.4 518.5 74.6+ 1.1+ 6.2+
Menu Item Name Portion SizeWeight
(g)KCAL FAT (g) CHO (g)
CHOL
(mg)PRO (g) DFIB (g) Na (mg) K (mg) Ca (mg) Fe (mg)
Vit A
(RAE)
CK12 Milk, Chocolate, Skim, 8 fl oz, (70682)1 each 226.8 120 0 20 5 8 0 180 420 300 0 -
CK12 Milk, White, 1% Low Fat, 8 fl o (69531)1 each 244 102.5 2.4 12.2 12.2 8.2 0 107.4 366 305 0.1 141.5
Milk, Strawberry, Skim, 8 oz, PC (58772)1 each 226.8 115.3 0.2 20 4.2 7.2 1 131.9 426.4 286.6 0.1 4.2
Jelly, Grape, PC (3378) 1 each 14.2 37.7 0 9.9 0 0 0.1 4.3 7.7 1 0 0
CK12 Syrup, 1 oz, Bulk (34503.1) 1 floz 39.2 91.8 0 24.1 0 0 0 32.2 5.9 1.2 0 0
467.4 2.5 86.2 21.4 23.4 1.1 455.7 1226 893.7 0.2 145.7
1104 25.2 190.8 24.6 34.9 10.1 1082.2 1864.2 1102.2+ 6.7+ 151.9+
* indicates main item
Copyright © 2014 Compass Group North America. ("CGNA") All Rights Reserved. The contents of this website, including all information viewed, downloaded or printed from this website, are
proprietary and confidential to CGNA and may not be copied, used or disclosed without the express written permission of CGNA.
Nutrient values in this report are based on data from the USDA and our suppliers. Unplanned product substitutions, changes in product specifications, and other factors may result in nutrient
content variations. Due to this inherent variability, data provided in this report should be used in conjunction with other information when planning menus for or treating individuals with medical
conditions. This report is for use by Webtrition-trained associates and for internal use.
Breakfast - Main Entrees Thursday - 12/04/2014
Main Entrees Totals
Breakfast - Alternate Entrees Thursday - 12/04/2014
Alternate Entrees Totals
Breakfast - Fruit & Vegetable Bar Thursday - 12/04/2014
Fruit & Vegetable Bar Totals
Breakfast - Milk & Condiments Thursday - 12/04/2014
Milk & Condiments Totals
Daily Totals for 12/04/2014
(+) Indicates partial nutritional values. (-) Indicates no nutritional value available.
Page 7 of 60
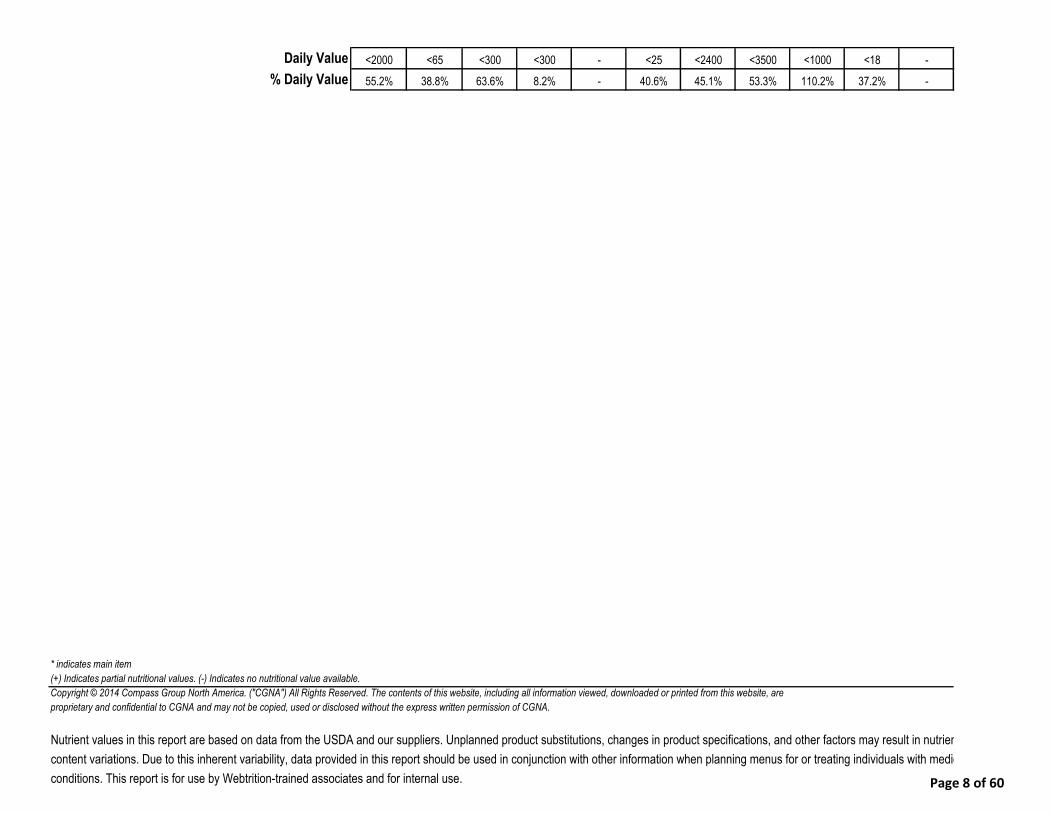
<2000 <65 <300 <300 - <25 <2400 <3500 <1000 <18 -
55.2% 38.8% 63.6% 8.2% - 40.6% 45.1% 53.3% 110.2% 37.2% -
* indicates main item
Copyright © 2014 Compass Group North America. ("CGNA") All Rights Reserved. The contents of this website, including all information viewed, downloaded or printed from this website, are
proprietary and confidential to CGNA and may not be copied, used or disclosed without the express written permission of CGNA.
Nutrient values in this report are based on data from the USDA and our suppliers. Unplanned product substitutions, changes in product specifications, and other factors may result in nutrient
content variations. Due to this inherent variability, data provided in this report should be used in conjunction with other information when planning menus for or treating individuals with medical
conditions. This report is for use by Webtrition-trained associates and for internal use.
Daily Value
% Daily Value
(+) Indicates partial nutritional values. (-) Indicates no nutritional value available.
Page 8 of 60

Menu Item Name Portion SizeWeight
(g)KCAL FAT (g) CHO (g)
CHOL
(mg)PRO (g) DFIB (g) Na (mg) K (mg) Ca (mg) Fe (mg)
Vit A
(RAE)
*CK12 Pancake, Sausage on a Stick (Sa (40463.8)1 each 82.2 220.6 11 23.1 25.1 8 1 451.2 - 40.1 1.4 -
220.6 11 23.1 25.1 8 1 451.2 - 40.1 1.4 -
Menu Item Name Portion SizeWeight
(g)KCAL FAT (g) CHO (g)
CHOL
(mg)PRO (g) DFIB (g) Na (mg) K (mg) Ca (mg) Fe (mg)
Vit A
(RAE)
*Cereal, Cocoa Puffs, 25% Less Sugar, (33398)1 each 30.1 114.8 1.5 25 0 1.9 1.7 156.6 86.2 100.1 4.5 -
114.8 1.5 25 0 1.9 1.7 156.6 86.2 100.1 4.5 -
Menu Item Name Portion SizeWeight
(g)KCAL FAT (g) CHO (g)
CHOL
(mg)PRO (g) DFIB (g) Na (mg) K (mg) Ca (mg) Fe (mg)
Vit A
(RAE)
CK12 Juice, Assorted, 100%, 4 fl oz (34497)1 each 113.4 58.6 0.1 14.2 0 0.4 0.3 4.2 144.8 11.3 0.2 0.8
CK12 Fruit, Assorted, Fresh (34507) 1 each 144.5 93 0.3 24.2 0 1 3.8 1.2 291.8 17.6 0.3 5.4
CK12 Bread, Toast, Buttered, Whole G (34761.16)1 slice 42.3 156.1 10.9 12.1 3.2 3.5 1.7 231.1 81.9 45.6+ 0.7+ 0+
307.8 11.4 50.6 3.2 4.9 5.8 236.4 518.5 74.6+ 1.1+ 6.2+
Menu Item Name Portion SizeWeight
(g)KCAL FAT (g) CHO (g)
CHOL
(mg)PRO (g) DFIB (g) Na (mg) K (mg) Ca (mg) Fe (mg)
Vit A
(RAE)
CK12 Milk, Chocolate, Skim, 8 fl oz, (70682)1 each 226.8 120 0 20 5 8 0 180 420 300 0 -
CK12 Milk, White, 1% Low Fat, 8 fl o (69531)1 each 244 102.5 2.4 12.2 12.2 8.2 0 107.4 366 305 0.1 141.5
Milk, Strawberry, Skim, 8 oz, PC (58772)1 each 226.8 115.3 0.2 20 4.2 7.2 1 131.9 426.4 286.6 0.1 4.2
Jelly, Grape, PC (3378) 1 each 14.2 37.7 0 9.9 0 0 0.1 4.3 7.7 1 0 0
CK12 Syrup, 1 oz, Bulk (34503.1) 1 floz 39.2 91.8 0 24.1 0 0 0 32.2 5.9 1.2 0 0
467.4 2.5 86.2 21.4 23.4 1.1 455.7 1226 893.7 0.2 145.7
1110.5 26.4 184.9 49.7 38.2 9.7 1299.8 1830.7 1108.5+ 7.3+ 151.9+
* indicates main item
Copyright © 2014 Compass Group North America. ("CGNA") All Rights Reserved. The contents of this website, including all information viewed, downloaded or printed from this website, are
proprietary and confidential to CGNA and may not be copied, used or disclosed without the express written permission of CGNA.
Nutrient values in this report are based on data from the USDA and our suppliers. Unplanned product substitutions, changes in product specifications, and other factors may result in nutrient
content variations. Due to this inherent variability, data provided in this report should be used in conjunction with other information when planning menus for or treating individuals with medical
conditions. This report is for use by Webtrition-trained associates and for internal use.
Breakfast - Main Entrees Friday - 12/05/2014
Main Entrees Totals
Breakfast - Alternate Entrees Friday - 12/05/2014
Alternate Entrees Totals
Breakfast - Fruit & Vegetable Bar Friday - 12/05/2014
Fruit & Vegetable Bar Totals
Breakfast - Milk & Condiments Friday - 12/05/2014
Milk & Condiments Totals
Daily Totals for 12/05/2014
(+) Indicates partial nutritional values. (-) Indicates no nutritional value available.
Page 9 of 60
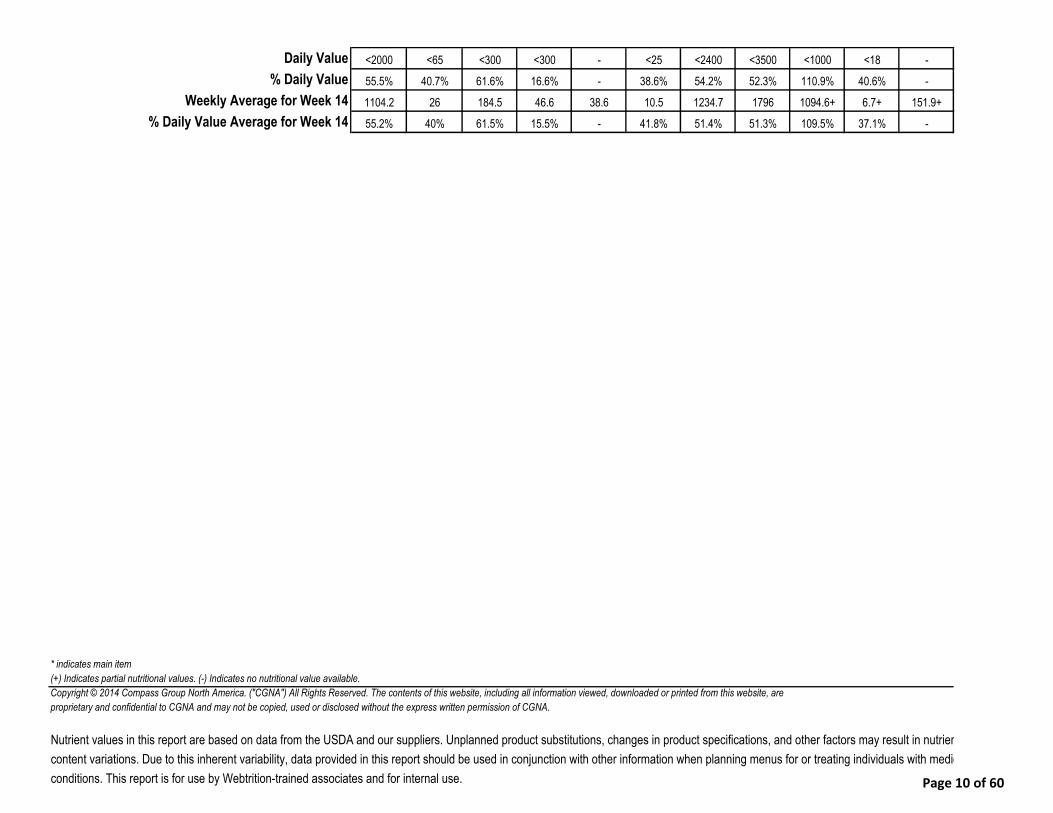
<2000 <65 <300 <300 - <25 <2400 <3500 <1000 <18 -
55.5% 40.7% 61.6% 16.6% - 38.6% 54.2% 52.3% 110.9% 40.6% -
1104.2 26 184.5 46.6 38.6 10.5 1234.7 1796 1094.6+ 6.7+ 151.9+
55.2% 40% 61.5% 15.5% - 41.8% 51.4% 51.3% 109.5% 37.1% -
* indicates main item
Copyright © 2014 Compass Group North America. ("CGNA") All Rights Reserved. The contents of this website, including all information viewed, downloaded or printed from this website, are
proprietary and confidential to CGNA and may not be copied, used or disclosed without the express written permission of CGNA.
Nutrient values in this report are based on data from the USDA and our suppliers. Unplanned product substitutions, changes in product specifications, and other factors may result in nutrient
content variations. Due to this inherent variability, data provided in this report should be used in conjunction with other information when planning menus for or treating individuals with medical
conditions. This report is for use by Webtrition-trained associates and for internal use.
Daily Value
% Daily Value
Weekly Average for Week 14
% Daily Value Average for Week 14
(+) Indicates partial nutritional values. (-) Indicates no nutritional value available.
Page 10 of 60

Menu Item Name Portion SizeWeight
(g)KCAL FAT (g) CHO (g)
CHOL
(mg)PRO (g) DFIB (g) Na (mg) K (mg) Ca (mg) Fe (mg)
Vit A
(RAE)
*CK12 Muffin, Blueberry, WG, IW, 2 oz (70560)1 each 56.7 169.1 5 28.8 39.8 3 2 119.4 - 19.9 1.1 -
169.1 5 28.8 39.8 3 2 119.4 - 19.9 1.1 -
Menu Item Name Portion SizeWeight
(g)KCAL FAT (g) CHO (g)
CHOL
(mg)PRO (g) DFIB (g) Na (mg) K (mg) Ca (mg) Fe (mg)
Vit A
(RAE)
*Cereal, Cinnamon Toast Crunch, 25% L (33388)1 each 28.3 108.1 2.9 21.9 0 1.4 2.5 203.6 - 202.5 3.7 -
108.1 2.9 21.9 0 1.4 2.5 203.6 - 202.5 3.7 -
Menu Item Name Portion SizeWeight
(g)KCAL FAT (g) CHO (g)
CHOL
(mg)PRO (g) DFIB (g) Na (mg) K (mg) Ca (mg) Fe (mg)
Vit A
(RAE)
CK12 Juice, Assorted, 100%, 4 fl oz (34497)1 each 113.4 58.6 0.1 14.2 0 0.4 0.3 4.2 144.8 11.3 0.2 0.8
CK12 Fruit, Assorted, Fresh (34507) 1 each 144.5 93 0.3 24.2 0 1 3.8 1.2 291.8 17.6 0.3 5.4
CK12 Bread, Toast, Buttered, Whole G (34761.16)1 slice 42.3 156.1 10.9 12.1 3.2 3.5 1.7 231.1 81.9 45.6+ 0.7+ 0+
307.8 11.4 50.6 3.2 4.9 5.8 236.4 518.5 74.6+ 1.1+ 6.2+
Menu Item Name Portion SizeWeight
(g)KCAL FAT (g) CHO (g)
CHOL
(mg)PRO (g) DFIB (g) Na (mg) K (mg) Ca (mg) Fe (mg)
Vit A
(RAE)
CK12 Milk, Chocolate, Skim, 8 fl oz, (70682)1 each 226.8 120 0 20 5 8 0 180 420 300 0 -
CK12 Milk, White, 1% Low Fat, 8 fl o (69531)1 each 244 102.5 2.4 12.2 12.2 8.2 0 107.4 366 305 0.1 141.5
Milk, Strawberry, Skim, 8 oz, PC (58772)1 each 226.8 115.3 0.2 20 4.2 7.2 1 131.9 426.4 286.6 0.1 4.2
Jelly, Grape, PC (3378) 1 each 14.2 37.7 0 9.9 0 0 0.1 4.3 7.7 1 0 0
CK12 Syrup, 1 oz, Bulk (34503.1) 1 floz 39.2 91.8 0 24.1 0 0 0 32.2 5.9 1.2 0 0
467.4 2.5 86.2 21.4 23.4 1.1 455.7 1226 893.7 0.2 145.7
1052.4 21.8 187.6 64.4 32.7 11.4 1015 1744.4 1190.7+ 6.1+ 151.9+
* indicates main item
Copyright © 2014 Compass Group North America. ("CGNA") All Rights Reserved. The contents of this website, including all information viewed, downloaded or printed from this website, are
proprietary and confidential to CGNA and may not be copied, used or disclosed without the express written permission of CGNA.
Nutrient values in this report are based on data from the USDA and our suppliers. Unplanned product substitutions, changes in product specifications, and other factors may result in nutrient
content variations. Due to this inherent variability, data provided in this report should be used in conjunction with other information when planning menus for or treating individuals with medical
conditions. This report is for use by Webtrition-trained associates and for internal use.
Breakfast - Main Entrees Monday - 12/08/2014
Main Entrees Totals
Breakfast - Alternate Entrees Monday - 12/08/2014
Alternate Entrees Totals
Breakfast - Fruit & Vegetable Bar Monday - 12/08/2014
Fruit & Vegetable Bar Totals
Breakfast - Milk & Condiments Monday - 12/08/2014
Milk & Condiments Totals
Daily Totals for 12/08/2014
(+) Indicates partial nutritional values. (-) Indicates no nutritional value available.
Page 11 of 60
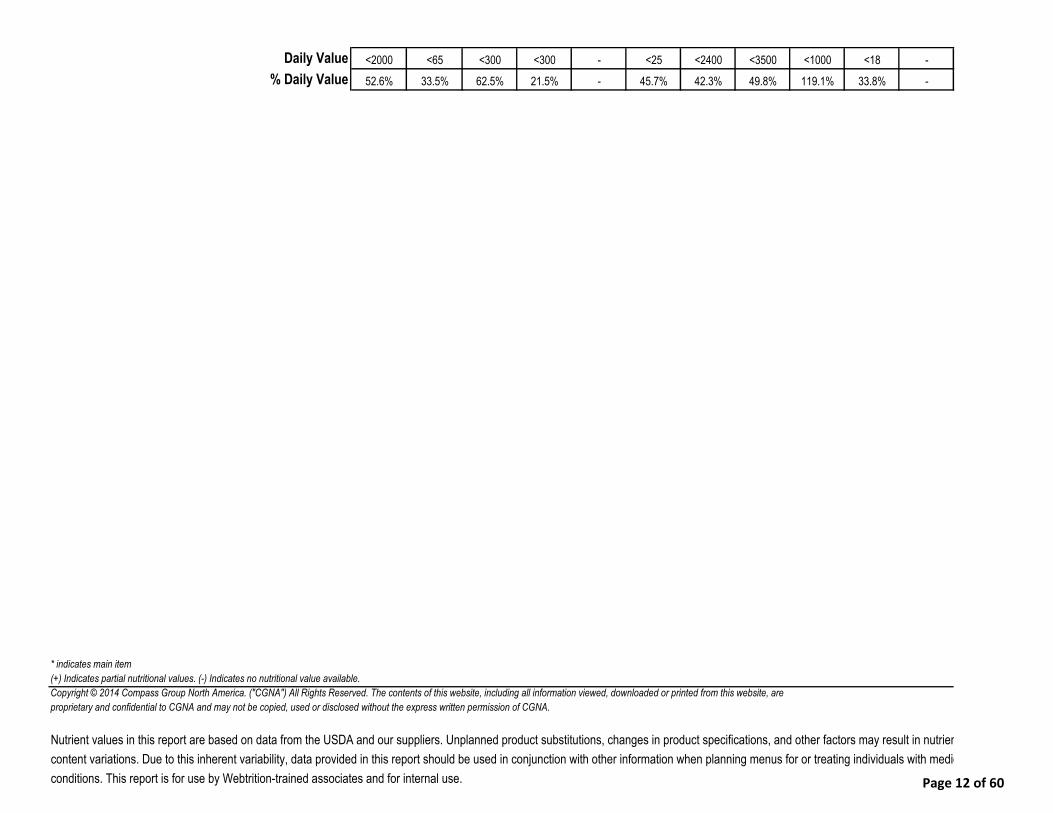
<2000 <65 <300 <300 - <25 <2400 <3500 <1000 <18 -
52.6% 33.5% 62.5% 21.5% - 45.7% 42.3% 49.8% 119.1% 33.8% -
* indicates main item
Copyright © 2014 Compass Group North America. ("CGNA") All Rights Reserved. The contents of this website, including all information viewed, downloaded or printed from this website, are
proprietary and confidential to CGNA and may not be copied, used or disclosed without the express written permission of CGNA.
Nutrient values in this report are based on data from the USDA and our suppliers. Unplanned product substitutions, changes in product specifications, and other factors may result in nutrient
content variations. Due to this inherent variability, data provided in this report should be used in conjunction with other information when planning menus for or treating individuals with medical
conditions. This report is for use by Webtrition-trained associates and for internal use.
Daily Value
% Daily Value
(+) Indicates partial nutritional values. (-) Indicates no nutritional value available.
Page 12 of 60

Menu Item Name Portion SizeWeight
(g)KCAL FAT (g) CHO (g)
CHOL
(mg)PRO (g) DFIB (g) Na (mg) K (mg) Ca (mg) Fe (mg)
Vit A
(RAE)
*CK12 Sandwich, Breakfast, Biscuit (G (34539.21)1 sandwich 106.6 265 13 28.5 20 11 2.5 725 - 110 1.6 -
265 13 28.5 20 11 2.5 725 - 110 1.6 -
Menu Item Name Portion SizeWeight
(g)KCAL FAT (g) CHO (g)
CHOL
(mg)PRO (g) DFIB (g) Na (mg) K (mg) Ca (mg) Fe (mg)
Vit A
(RAE)
*Cereal, Froot Loops, Reduced Sugar, (37041)1 each 19 69.1 0.8 15.9 0 1.2 2 106.9 12.9 0 2.7 -
69.1 0.8 15.9 0 1.2 2 106.9 12.9 0 2.7 -
Menu Item Name Portion SizeWeight
(g)KCAL FAT (g) CHO (g)
CHOL
(mg)PRO (g) DFIB (g) Na (mg) K (mg) Ca (mg) Fe (mg)
Vit A
(RAE)
CK12 Juice, Assorted, 100%, 4 fl oz (34497)1 each 113.4 58.6 0.1 14.2 0 0.4 0.3 4.2 144.8 11.3 0.2 0.8
CK12 Fruit, Assorted, Fresh (34507) 1 each 144.5 93 0.3 24.2 0 1 3.8 1.2 291.8 17.6 0.3 5.4
CK12 Bread, Toast, Buttered, Whole G (34761.16)1 slice 42.3 156.1 10.9 12.1 3.2 3.5 1.7 231.1 81.9 45.6+ 0.7+ 0+
307.8 11.4 50.6 3.2 4.9 5.8 236.4 518.5 74.6+ 1.1+ 6.2+
Menu Item Name Portion SizeWeight
(g)KCAL FAT (g) CHO (g)
CHOL
(mg)PRO (g) DFIB (g) Na (mg) K (mg) Ca (mg) Fe (mg)
Vit A
(RAE)
CK12 Milk, Chocolate, Skim, 8 fl oz, (70682)1 each 226.8 120 0 20 5 8 0 180 420 300 0 -
CK12 Milk, White, 1% Low Fat, 8 fl o (69531)1 each 244 102.5 2.4 12.2 12.2 8.2 0 107.4 366 305 0.1 141.5
Milk, Strawberry, Skim, 8 oz, PC (58772)1 each 226.8 115.3 0.2 20 4.2 7.2 1 131.9 426.4 286.6 0.1 4.2
Jelly, Grape, PC (3378) 1 each 14.2 37.7 0 9.9 0 0 0.1 4.3 7.7 1 0 0
CK12 Syrup, 1 oz, Bulk (34503.1) 1 floz 39.2 91.8 0 24.1 0 0 0 32.2 5.9 1.2 0 0
467.4 2.5 86.2 21.4 23.4 1.1 455.7 1226 893.7 0.2 145.7
1109.3 27.7 181.2 44.6 40.6 11.4 1524 1757.4 1078.3+ 5.6+ 151.9+
* indicates main item
Copyright © 2014 Compass Group North America. ("CGNA") All Rights Reserved. The contents of this website, including all information viewed, downloaded or printed from this website, are
proprietary and confidential to CGNA and may not be copied, used or disclosed without the express written permission of CGNA.
Nutrient values in this report are based on data from the USDA and our suppliers. Unplanned product substitutions, changes in product specifications, and other factors may result in nutrient
content variations. Due to this inherent variability, data provided in this report should be used in conjunction with other information when planning menus for or treating individuals with medical
conditions. This report is for use by Webtrition-trained associates and for internal use.
Breakfast - Main Entrees Tuesday - 12/09/2014
Main Entrees Totals
Breakfast - Alternate Entrees Tuesday - 12/09/2014
Alternate Entrees Totals
Breakfast - Fruit & Vegetable Bar Tuesday - 12/09/2014
Fruit & Vegetable Bar Totals
Breakfast - Milk & Condiments Tuesday - 12/09/2014
Milk & Condiments Totals
Daily Totals for 12/09/2014
(+) Indicates partial nutritional values. (-) Indicates no nutritional value available.
Page 13 of 60

<2000 <65 <300 <300 - <25 <2400 <3500 <1000 <18 -
55.5% 42.5% 60.4% 14.9% - 45.5% 63.5% 50.2% 107.8% 31.4% -
* indicates main item
Copyright © 2014 Compass Group North America. ("CGNA") All Rights Reserved. The contents of this website, including all information viewed, downloaded or printed from this website, are
proprietary and confidential to CGNA and may not be copied, used or disclosed without the express written permission of CGNA.
Nutrient values in this report are based on data from the USDA and our suppliers. Unplanned product substitutions, changes in product specifications, and other factors may result in nutrient
content variations. Due to this inherent variability, data provided in this report should be used in conjunction with other information when planning menus for or treating individuals with medical
conditions. This report is for use by Webtrition-trained associates and for internal use.
Daily Value
% Daily Value
(+) Indicates partial nutritional values. (-) Indicates no nutritional value available.
Page 14 of 60

Menu Item Name Portion SizeWeight
(g)KCAL FAT (g) CHO (g)
CHOL
(mg)PRO (g) DFIB (g) Na (mg) K (mg) Ca (mg) Fe (mg)
Vit A
(RAE)
*CK12 Chicken, Nuggets, WG (Tyson 703 (35365.12)5 each 97.8 263.3 15 16.3 25.1 16.3 2.5 401.3 - 25.1 2.3 -
263.3 15 16.3 25.1 16.3 2.5 401.3 - 25.1 2.3 -
Menu Item Name Portion SizeWeight
(g)KCAL FAT (g) CHO (g)
CHOL
(mg)PRO (g) DFIB (g) Na (mg) K (mg) Ca (mg) Fe (mg)
Vit A
(RAE)
*Cereal, Frosted Flakes, Reduced Suga (34026)1 each 28 106.1 0.1 24.9 - 1.7 0.3 159 38.6 0 4.1 -
106.1 0.1 24.9 - 1.7 0.3 159 38.6 0 4.1 -
Menu Item Name Portion SizeWeight
(g)KCAL FAT (g) CHO (g)
CHOL
(mg)PRO (g) DFIB (g) Na (mg) K (mg) Ca (mg) Fe (mg)
Vit A
(RAE)
CK12 Juice, Assorted, 100%, 4 fl oz (34497)1 each 113.4 58.6 0.1 14.2 0 0.4 0.3 4.2 144.8 11.3 0.2 0.8
CK12 Fruit, Assorted, Fresh (34507) 1 each 144.5 93 0.3 24.2 0 1 3.8 1.2 291.8 17.6 0.3 5.4
CK12 Bread, Toast, Buttered, Whole G (34761.16)1 slice 42.3 156.1 10.9 12.1 3.2 3.5 1.7 231.1 81.9 45.6+ 0.7+ 0+
307.8 11.4 50.6 3.2 4.9 5.8 236.4 518.5 74.6+ 1.1+ 6.2+
Menu Item Name Portion SizeWeight
(g)KCAL FAT (g) CHO (g)
CHOL
(mg)PRO (g) DFIB (g) Na (mg) K (mg) Ca (mg) Fe (mg)
Vit A
(RAE)
CK12 Milk, Chocolate, Skim, 8 fl oz, (70682)1 each 226.8 120 0 20 5 8 0 180 420 300 0 -
CK12 Milk, White, 1% Low Fat, 8 fl o (69531)1 each 244 102.5 2.4 12.2 12.2 8.2 0 107.4 366 305 0.1 141.5
Milk, Strawberry, Skim, 8 oz, PC (58772)1 each 226.8 115.3 0.2 20 4.2 7.2 1 131.9 426.4 286.6 0.1 4.2
Jelly, Grape, PC (3378) 1 each 14.2 37.7 0 9.9 0 0 0.1 4.3 7.7 1 0 0
CK12 Syrup, 1 oz, Bulk (34503.1) 1 floz 39.2 91.8 0 24.1 0 0 0 32.2 5.9 1.2 0 0
467.4 2.5 86.2 21.4 23.4 1.1 455.7 1226 893.7 0.2 145.7
1144.6 29 178 49.7 46.3 9.7 1252.4 1783.1 993.4+ 7.7+ 151.9+
* indicates main item
Copyright © 2014 Compass Group North America. ("CGNA") All Rights Reserved. The contents of this website, including all information viewed, downloaded or printed from this website, are
proprietary and confidential to CGNA and may not be copied, used or disclosed without the express written permission of CGNA.
Nutrient values in this report are based on data from the USDA and our suppliers. Unplanned product substitutions, changes in product specifications, and other factors may result in nutrient
content variations. Due to this inherent variability, data provided in this report should be used in conjunction with other information when planning menus for or treating individuals with medical
conditions. This report is for use by Webtrition-trained associates and for internal use.
Breakfast - Main Entrees Wednesday - 12/10/2014
Main Entrees Totals
Breakfast - Alternate Entrees Wednesday - 12/10/2014
Alternate Entrees Totals
Breakfast - Fruit & Vegetable Bar Wednesday - 12/10/2014
Fruit & Vegetable Bar Totals
Breakfast - Milk & Condiments Wednesday - 12/10/2014
Milk & Condiments Totals
Daily Totals for 12/10/2014
(+) Indicates partial nutritional values. (-) Indicates no nutritional value available.
Page 15 of 60

<2000 <65 <300 <300 - <25 <2400 <3500 <1000 <18 -
57.2% 44.7% 59.3% 16.6% - 38.7% 52.2% 50.9% 99.3% 42.6% -
* indicates main item
Copyright © 2014 Compass Group North America. ("CGNA") All Rights Reserved. The contents of this website, including all information viewed, downloaded or printed from this website, are
proprietary and confidential to CGNA and may not be copied, used or disclosed without the express written permission of CGNA.
Nutrient values in this report are based on data from the USDA and our suppliers. Unplanned product substitutions, changes in product specifications, and other factors may result in nutrient
content variations. Due to this inherent variability, data provided in this report should be used in conjunction with other information when planning menus for or treating individuals with medical
conditions. This report is for use by Webtrition-trained associates and for internal use.
Daily Value
% Daily Value
(+) Indicates partial nutritional values. (-) Indicates no nutritional value available.
Page 16 of 60

Menu Item Name Portion SizeWeight
(g)KCAL FAT (g) CHO (g)
CHOL
(mg)PRO (g) DFIB (g) Na (mg) K (mg) Ca (mg) Fe (mg)
Vit A
(RAE)
*CK12 French Toast, Sticks, WG (Aunt (34512.4)3 each 72.3 225.9 9.8 32.4 0 4.5 1.5 286.2 60.2 45.2 1.4 -
225.9 9.8 32.4 0 4.5 1.5 286.2 60.2 45.2 1.4 -
Menu Item Name Portion SizeWeight
(g)KCAL FAT (g) CHO (g)
CHOL
(mg)PRO (g) DFIB (g) Na (mg) K (mg) Ca (mg) Fe (mg)
Vit A
(RAE)
*Cereal, Cheerios Apple Cinnamon, Bow (59646)1 each 26.6 102.9 1.5 21.6 0 2 1.7 104 59.5 88.6 4 -
102.9 1.5 21.6 0 2 1.7 104 59.5 88.6 4 -
Menu Item Name Portion SizeWeight
(g)KCAL FAT (g) CHO (g)
CHOL
(mg)PRO (g) DFIB (g) Na (mg) K (mg) Ca (mg) Fe (mg)
Vit A
(RAE)
CK12 Juice, Assorted, 100%, 4 fl oz (34497)1 each 113.4 58.6 0.1 14.2 0 0.4 0.3 4.2 144.8 11.3 0.2 0.8
CK12 Fruit, Assorted, Fresh (34507) 1 each 144.5 93 0.3 24.2 0 1 3.8 1.2 291.8 17.6 0.3 5.4
CK12 Bread, Toast, Buttered, Whole G (34761.16)1 slice 42.3 156.1 10.9 12.1 3.2 3.5 1.7 231.1 81.9 45.6+ 0.7+ 0+
307.8 11.4 50.6 3.2 4.9 5.8 236.4 518.5 74.6+ 1.1+ 6.2+
Menu Item Name Portion SizeWeight
(g)KCAL FAT (g) CHO (g)
CHOL
(mg)PRO (g) DFIB (g) Na (mg) K (mg) Ca (mg) Fe (mg)
Vit A
(RAE)
CK12 Milk, Chocolate, Skim, 8 fl oz, (70682)1 each 226.8 120 0 20 5 8 0 180 420 300 0 -
CK12 Milk, White, 1% Low Fat, 8 fl o (69531)1 each 244 102.5 2.4 12.2 12.2 8.2 0 107.4 366 305 0.1 141.5
Milk, Strawberry, Skim, 8 oz, PC (58772)1 each 226.8 115.3 0.2 20 4.2 7.2 1 131.9 426.4 286.6 0.1 4.2
Jelly, Grape, PC (3378) 1 each 14.2 37.7 0 9.9 0 0 0.1 4.3 7.7 1 0 0
CK12 Syrup, 1 oz, Bulk (34503.1) 1 floz 39.2 91.8 0 24.1 0 0 0 32.2 5.9 1.2 0 0
467.4 2.5 86.2 21.4 23.4 1.1 455.7 1226 893.7 0.2 145.7
1104 25.2 190.8 24.6 34.9 10.1 1082.2 1864.2 1102.2+ 6.7+ 151.9+
* indicates main item
Copyright © 2014 Compass Group North America. ("CGNA") All Rights Reserved. The contents of this website, including all information viewed, downloaded or printed from this website, are
proprietary and confidential to CGNA and may not be copied, used or disclosed without the express written permission of CGNA.
Nutrient values in this report are based on data from the USDA and our suppliers. Unplanned product substitutions, changes in product specifications, and other factors may result in nutrient
content variations. Due to this inherent variability, data provided in this report should be used in conjunction with other information when planning menus for or treating individuals with medical
conditions. This report is for use by Webtrition-trained associates and for internal use.
Breakfast - Main Entrees Thursday - 12/11/2014
Main Entrees Totals
Breakfast - Alternate Entrees Thursday - 12/11/2014
Alternate Entrees Totals
Breakfast - Fruit & Vegetable Bar Thursday - 12/11/2014
Fruit & Vegetable Bar Totals
Breakfast - Milk & Condiments Thursday - 12/11/2014
Milk & Condiments Totals
Daily Totals for 12/11/2014
(+) Indicates partial nutritional values. (-) Indicates no nutritional value available.
Page 17 of 60

<2000 <65 <300 <300 - <25 <2400 <3500 <1000 <18 -
55.2% 38.8% 63.6% 8.2% - 40.6% 45.1% 53.3% 110.2% 37.2% -
* indicates main item
Copyright © 2014 Compass Group North America. ("CGNA") All Rights Reserved. The contents of this website, including all information viewed, downloaded or printed from this website, are
proprietary and confidential to CGNA and may not be copied, used or disclosed without the express written permission of CGNA.
Nutrient values in this report are based on data from the USDA and our suppliers. Unplanned product substitutions, changes in product specifications, and other factors may result in nutrient
content variations. Due to this inherent variability, data provided in this report should be used in conjunction with other information when planning menus for or treating individuals with medical
conditions. This report is for use by Webtrition-trained associates and for internal use.
Daily Value
% Daily Value
(+) Indicates partial nutritional values. (-) Indicates no nutritional value available.
Page 18 of 60

Menu Item Name Portion SizeWeight
(g)KCAL FAT (g) CHO (g)
CHOL
(mg)PRO (g) DFIB (g) Na (mg) K (mg) Ca (mg) Fe (mg)
Vit A
(RAE)
*CK12 Pancake, Sausage on a Stick (Sa (40463.8)1 each 82.2 220.6 11 23.1 25.1 8 1 451.2 - 40.1 1.4 -
220.6 11 23.1 25.1 8 1 451.2 - 40.1 1.4 -
Menu Item Name Portion SizeWeight
(g)KCAL FAT (g) CHO (g)
CHOL
(mg)PRO (g) DFIB (g) Na (mg) K (mg) Ca (mg) Fe (mg)
Vit A
(RAE)
*Cereal, Cocoa Puffs, 25% Less Sugar, (33398)1 each 30.1 114.8 1.5 25 0 1.9 1.7 156.6 86.2 100.1 4.5 -
114.8 1.5 25 0 1.9 1.7 156.6 86.2 100.1 4.5 -
Menu Item Name Portion SizeWeight
(g)KCAL FAT (g) CHO (g)
CHOL
(mg)PRO (g) DFIB (g) Na (mg) K (mg) Ca (mg) Fe (mg)
Vit A
(RAE)
CK12 Juice, Assorted, 100%, 4 fl oz (34497)1 each 113.4 58.6 0.1 14.2 0 0.4 0.3 4.2 144.8 11.3 0.2 0.8
CK12 Fruit, Assorted, Fresh (34507) 1 each 144.5 93 0.3 24.2 0 1 3.8 1.2 291.8 17.6 0.3 5.4
CK12 Bread, Toast, Buttered, Whole G (34761.16)1 slice 42.3 156.1 10.9 12.1 3.2 3.5 1.7 231.1 81.9 45.6+ 0.7+ 0+
307.8 11.4 50.6 3.2 4.9 5.8 236.4 518.5 74.6+ 1.1+ 6.2+
Menu Item Name Portion SizeWeight
(g)KCAL FAT (g) CHO (g)
CHOL
(mg)PRO (g) DFIB (g) Na (mg) K (mg) Ca (mg) Fe (mg)
Vit A
(RAE)
CK12 Milk, Chocolate, Skim, 8 fl oz, (70682)1 each 226.8 120 0 20 5 8 0 180 420 300 0 -
CK12 Milk, White, 1% Low Fat, 8 fl o (69531)1 each 244 102.5 2.4 12.2 12.2 8.2 0 107.4 366 305 0.1 141.5
Milk, Strawberry, Skim, 8 oz, PC (58772)1 each 226.8 115.3 0.2 20 4.2 7.2 1 131.9 426.4 286.6 0.1 4.2
Jelly, Grape, PC (3378) 1 each 14.2 37.7 0 9.9 0 0 0.1 4.3 7.7 1 0 0
CK12 Syrup, 1 oz, Bulk (34503.1) 1 floz 39.2 91.8 0 24.1 0 0 0 32.2 5.9 1.2 0 0
467.4 2.5 86.2 21.4 23.4 1.1 455.7 1226 893.7 0.2 145.7
1110.5 26.4 184.9 49.7 38.2 9.7 1299.8 1830.7 1108.5+ 7.3+ 151.9+
* indicates main item
Copyright © 2014 Compass Group North America. ("CGNA") All Rights Reserved. The contents of this website, including all information viewed, downloaded or printed from this website, are
proprietary and confidential to CGNA and may not be copied, used or disclosed without the express written permission of CGNA.
Nutrient values in this report are based on data from the USDA and our suppliers. Unplanned product substitutions, changes in product specifications, and other factors may result in nutrient
content variations. Due to this inherent variability, data provided in this report should be used in conjunction with other information when planning menus for or treating individuals with medical
conditions. This report is for use by Webtrition-trained associates and for internal use.
Breakfast - Main Entrees Friday - 12/12/2014
Main Entrees Totals
Breakfast - Alternate Entrees Friday - 12/12/2014
Alternate Entrees Totals
Breakfast - Fruit & Vegetable Bar Friday - 12/12/2014
Fruit & Vegetable Bar Totals
Breakfast - Milk & Condiments Friday - 12/12/2014
Milk & Condiments Totals
Daily Totals for 12/12/2014
(+) Indicates partial nutritional values. (-) Indicates no nutritional value available.
Page 19 of 60

<2000 <65 <300 <300 - <25 <2400 <3500 <1000 <18 -
55.5% 40.7% 61.6% 16.6% - 38.6% 54.2% 52.3% 110.9% 40.6% -
1104.2 26 184.5 46.6 38.6 10.5 1234.7 1796 1094.6+ 6.7+ 151.9+
55.2% 40% 61.5% 15.5% - 41.8% 51.4% 51.3% 109.5% 37.1% -
* indicates main item
Copyright © 2014 Compass Group North America. ("CGNA") All Rights Reserved. The contents of this website, including all information viewed, downloaded or printed from this website, are
proprietary and confidential to CGNA and may not be copied, used or disclosed without the express written permission of CGNA.
Nutrient values in this report are based on data from the USDA and our suppliers. Unplanned product substitutions, changes in product specifications, and other factors may result in nutrient
content variations. Due to this inherent variability, data provided in this report should be used in conjunction with other information when planning menus for or treating individuals with medical
conditions. This report is for use by Webtrition-trained associates and for internal use.
Daily Value
% Daily Value
Weekly Average for Week 15
% Daily Value Average for Week 15
(+) Indicates partial nutritional values. (-) Indicates no nutritional value available.
Page 20 of 60

Menu Item Name Portion SizeWeight
(g)KCAL FAT (g) CHO (g)
CHOL
(mg)PRO (g) DFIB (g) Na (mg) K (mg) Ca (mg) Fe (mg)
Vit A
(RAE)
*CK12 Muffin, Blueberry, WG, IW, 2 oz (70560)1 each 56.7 169.1 5 28.8 39.8 3 2 119.4 - 19.9 1.1 -
169.1 5 28.8 39.8 3 2 119.4 - 19.9 1.1 -
Menu Item Name Portion SizeWeight
(g)KCAL FAT (g) CHO (g)
CHOL
(mg)PRO (g) DFIB (g) Na (mg) K (mg) Ca (mg) Fe (mg)
Vit A
(RAE)
*Cereal, Cinnamon Toast Crunch, 25% L (33388)1 each 28.3 108.1 2.9 21.9 0 1.4 2.5 203.6 - 202.5 3.7 -
108.1 2.9 21.9 0 1.4 2.5 203.6 - 202.5 3.7 -
Menu Item Name Portion SizeWeight
(g)KCAL FAT (g) CHO (g)
CHOL
(mg)PRO (g) DFIB (g) Na (mg) K (mg) Ca (mg) Fe (mg)
Vit A
(RAE)
CK12 Juice, Assorted, 100%, 4 fl oz (34497)1 each 113.4 58.6 0.1 14.2 0 0.4 0.3 4.2 144.8 11.3 0.2 0.8
CK12 Fruit, Assorted, Fresh (34507) 1 each 144.5 93 0.3 24.2 0 1 3.8 1.2 291.8 17.6 0.3 5.4
CK12 Bread, Toast, Buttered, Whole G (34761.16)1 slice 42.3 156.1 10.9 12.1 3.2 3.5 1.7 231.1 81.9 45.6+ 0.7+ 0+
307.8 11.4 50.6 3.2 4.9 5.8 236.4 518.5 74.6+ 1.1+ 6.2+
Menu Item Name Portion SizeWeight
(g)KCAL FAT (g) CHO (g)
CHOL
(mg)PRO (g) DFIB (g) Na (mg) K (mg) Ca (mg) Fe (mg)
Vit A
(RAE)
CK12 Milk, Chocolate, Skim, 8 fl oz, (70682)1 each 226.8 120 0 20 5 8 0 180 420 300 0 -
CK12 Milk, White, 1% Low Fat, 8 fl o (69531)1 each 244 102.5 2.4 12.2 12.2 8.2 0 107.4 366 305 0.1 141.5
Milk, Strawberry, Skim, 8 oz, PC (58772)1 each 226.8 115.3 0.2 20 4.2 7.2 1 131.9 426.4 286.6 0.1 4.2
Jelly, Grape, PC (3378) 1 each 14.2 37.7 0 9.9 0 0 0.1 4.3 7.7 1 0 0
CK12 Syrup, 1 oz, Bulk (34503.1) 1 floz 39.2 91.8 0 24.1 0 0 0 32.2 5.9 1.2 0 0
467.4 2.5 86.2 21.4 23.4 1.1 455.7 1226 893.7 0.2 145.7
1052.4 21.8 187.6 64.4 32.7 11.4 1015 1744.4 1190.7+ 6.1+ 151.9+
* indicates main item
Copyright © 2014 Compass Group North America. ("CGNA") All Rights Reserved. The contents of this website, including all information viewed, downloaded or printed from this website, are
proprietary and confidential to CGNA and may not be copied, used or disclosed without the express written permission of CGNA.
Nutrient values in this report are based on data from the USDA and our suppliers. Unplanned product substitutions, changes in product specifications, and other factors may result in nutrient
content variations. Due to this inherent variability, data provided in this report should be used in conjunction with other information when planning menus for or treating individuals with medical
conditions. This report is for use by Webtrition-trained associates and for internal use.
Breakfast - Main Entrees Monday - 12/15/2014
Main Entrees Totals
Breakfast - Alternate Entrees Monday - 12/15/2014
Alternate Entrees Totals
Breakfast - Fruit & Vegetable Bar Monday - 12/15/2014
Fruit & Vegetable Bar Totals
Breakfast - Milk & Condiments Monday - 12/15/2014
Milk & Condiments Totals
Daily Totals for 12/15/2014
(+) Indicates partial nutritional values. (-) Indicates no nutritional value available.
Page 21 of 60

<2000 <65 <300 <300 - <25 <2400 <3500 <1000 <18 -
52.6% 33.5% 62.5% 21.5% - 45.7% 42.3% 49.8% 119.1% 33.8% -
* indicates main item
Copyright © 2014 Compass Group North America. ("CGNA") All Rights Reserved. The contents of this website, including all information viewed, downloaded or printed from this website, are
proprietary and confidential to CGNA and may not be copied, used or disclosed without the express written permission of CGNA.
Nutrient values in this report are based on data from the USDA and our suppliers. Unplanned product substitutions, changes in product specifications, and other factors may result in nutrient
content variations. Due to this inherent variability, data provided in this report should be used in conjunction with other information when planning menus for or treating individuals with medical
conditions. This report is for use by Webtrition-trained associates and for internal use.
Daily Value
% Daily Value
(+) Indicates partial nutritional values. (-) Indicates no nutritional value available.
Page 22 of 60

Menu Item Name Portion SizeWeight
(g)KCAL FAT (g) CHO (g)
CHOL
(mg)PRO (g) DFIB (g) Na (mg) K (mg) Ca (mg) Fe (mg)
Vit A
(RAE)
*CK12 Sandwich, Breakfast, Biscuit (G (34539.21)1 sandwich 106.6 265 13 28.5 20 11 2.5 725 - 110 1.6 -
265 13 28.5 20 11 2.5 725 - 110 1.6 -
Menu Item Name Portion SizeWeight
(g)KCAL FAT (g) CHO (g)
CHOL
(mg)PRO (g) DFIB (g) Na (mg) K (mg) Ca (mg) Fe (mg)
Vit A
(RAE)
*Cereal, Froot Loops, Reduced Sugar, (37041)1 each 19 69.1 0.8 15.9 0 1.2 2 106.9 12.9 0 2.7 -
69.1 0.8 15.9 0 1.2 2 106.9 12.9 0 2.7 -
Menu Item Name Portion SizeWeight
(g)KCAL FAT (g) CHO (g)
CHOL
(mg)PRO (g) DFIB (g) Na (mg) K (mg) Ca (mg) Fe (mg)
Vit A
(RAE)
CK12 Juice, Assorted, 100%, 4 fl oz (34497)1 each 113.4 58.6 0.1 14.2 0 0.4 0.3 4.2 144.8 11.3 0.2 0.8
CK12 Fruit, Assorted, Fresh (34507) 1 each 144.5 93 0.3 24.2 0 1 3.8 1.2 291.8 17.6 0.3 5.4
CK12 Bread, Toast, Buttered, Whole G (34761.16)1 slice 42.3 156.1 10.9 12.1 3.2 3.5 1.7 231.1 81.9 45.6+ 0.7+ 0+
307.8 11.4 50.6 3.2 4.9 5.8 236.4 518.5 74.6+ 1.1+ 6.2+
Menu Item Name Portion SizeWeight
(g)KCAL FAT (g) CHO (g)
CHOL
(mg)PRO (g) DFIB (g) Na (mg) K (mg) Ca (mg) Fe (mg)
Vit A
(RAE)
CK12 Milk, Chocolate, Skim, 8 fl oz, (70682)1 each 226.8 120 0 20 5 8 0 180 420 300 0 -
CK12 Milk, White, 1% Low Fat, 8 fl o (69531)1 each 244 102.5 2.4 12.2 12.2 8.2 0 107.4 366 305 0.1 141.5
Milk, Strawberry, Skim, 8 oz, PC (58772)1 each 226.8 115.3 0.2 20 4.2 7.2 1 131.9 426.4 286.6 0.1 4.2
Jelly, Grape, PC (3378) 1 each 14.2 37.7 0 9.9 0 0 0.1 4.3 7.7 1 0 0
CK12 Syrup, 1 oz, Bulk (34503.1) 1 floz 39.2 91.8 0 24.1 0 0 0 32.2 5.9 1.2 0 0
467.4 2.5 86.2 21.4 23.4 1.1 455.7 1226 893.7 0.2 145.7
1109.3 27.7 181.2 44.6 40.6 11.4 1524 1757.4 1078.3+ 5.6+ 151.9+
* indicates main item
Copyright © 2014 Compass Group North America. ("CGNA") All Rights Reserved. The contents of this website, including all information viewed, downloaded or printed from this website, are
proprietary and confidential to CGNA and may not be copied, used or disclosed without the express written permission of CGNA.
Nutrient values in this report are based on data from the USDA and our suppliers. Unplanned product substitutions, changes in product specifications, and other factors may result in nutrient
content variations. Due to this inherent variability, data provided in this report should be used in conjunction with other information when planning menus for or treating individuals with medical
conditions. This report is for use by Webtrition-trained associates and for internal use.
Breakfast - Main Entrees Tuesday - 12/16/2014
Main Entrees Totals
Breakfast - Alternate Entrees Tuesday - 12/16/2014
Alternate Entrees Totals
Breakfast - Fruit & Vegetable Bar Tuesday - 12/16/2014
Fruit & Vegetable Bar Totals
Breakfast - Milk & Condiments Tuesday - 12/16/2014
Milk & Condiments Totals
Daily Totals for 12/16/2014
(+) Indicates partial nutritional values. (-) Indicates no nutritional value available.
Page 23 of 60

<2000 <65 <300 <300 - <25 <2400 <3500 <1000 <18 -
55.5% 42.5% 60.4% 14.9% - 45.5% 63.5% 50.2% 107.8% 31.4% -
* indicates main item
Copyright © 2014 Compass Group North America. ("CGNA") All Rights Reserved. The contents of this website, including all information viewed, downloaded or printed from this website, are
proprietary and confidential to CGNA and may not be copied, used or disclosed without the express written permission of CGNA.
Nutrient values in this report are based on data from the USDA and our suppliers. Unplanned product substitutions, changes in product specifications, and other factors may result in nutrient
content variations. Due to this inherent variability, data provided in this report should be used in conjunction with other information when planning menus for or treating individuals with medical
conditions. This report is for use by Webtrition-trained associates and for internal use.
Daily Value
% Daily Value
(+) Indicates partial nutritional values. (-) Indicates no nutritional value available.
Page 24 of 60

Menu Item Name Portion SizeWeight
(g)KCAL FAT (g) CHO (g)
CHOL
(mg)PRO (g) DFIB (g) Na (mg) K (mg) Ca (mg) Fe (mg)
Vit A
(RAE)
*CK12 Chicken, Nuggets, WG (Tyson 703 (35365.12)5 each 97.8 263.3 15 16.3 25.1 16.3 2.5 401.3 - 25.1 2.3 -
263.3 15 16.3 25.1 16.3 2.5 401.3 - 25.1 2.3 -
Menu Item Name Portion SizeWeight
(g)KCAL FAT (g) CHO (g)
CHOL
(mg)PRO (g) DFIB (g) Na (mg) K (mg) Ca (mg) Fe (mg)
Vit A
(RAE)
*Cereal, Frosted Flakes, Reduced Suga (34026)1 each 28 106.1 0.1 24.9 - 1.7 0.3 159 38.6 0 4.1 -
106.1 0.1 24.9 - 1.7 0.3 159 38.6 0 4.1 -
Menu Item Name Portion SizeWeight
(g)KCAL FAT (g) CHO (g)
CHOL
(mg)PRO (g) DFIB (g) Na (mg) K (mg) Ca (mg) Fe (mg)
Vit A
(RAE)
CK12 Juice, Assorted, 100%, 4 fl oz (34497)1 each 113.4 58.6 0.1 14.2 0 0.4 0.3 4.2 144.8 11.3 0.2 0.8
CK12 Fruit, Assorted, Fresh (34507) 1 each 144.5 93 0.3 24.2 0 1 3.8 1.2 291.8 17.6 0.3 5.4
CK12 Bread, Toast, Buttered, Whole G (34761.16)1 slice 42.3 156.1 10.9 12.1 3.2 3.5 1.7 231.1 81.9 45.6+ 0.7+ 0+
307.8 11.4 50.6 3.2 4.9 5.8 236.4 518.5 74.6+ 1.1+ 6.2+
Menu Item Name Portion SizeWeight
(g)KCAL FAT (g) CHO (g)
CHOL
(mg)PRO (g) DFIB (g) Na (mg) K (mg) Ca (mg) Fe (mg)
Vit A
(RAE)
CK12 Milk, Chocolate, Skim, 8 fl oz, (70682)1 each 226.8 120 0 20 5 8 0 180 420 300 0 -
CK12 Milk, White, 1% Low Fat, 8 fl o (69531)1 each 244 102.5 2.4 12.2 12.2 8.2 0 107.4 366 305 0.1 141.5
Milk, Strawberry, Skim, 8 oz, PC (58772)1 each 226.8 115.3 0.2 20 4.2 7.2 1 131.9 426.4 286.6 0.1 4.2
Jelly, Grape, PC (3378) 1 each 14.2 37.7 0 9.9 0 0 0.1 4.3 7.7 1 0 0
CK12 Syrup, 1 oz, Bulk (34503.1) 1 floz 39.2 91.8 0 24.1 0 0 0 32.2 5.9 1.2 0 0
467.4 2.5 86.2 21.4 23.4 1.1 455.7 1226 893.7 0.2 145.7
1144.6 29 178 49.7 46.3 9.7 1252.4 1783.1 993.4+ 7.7+ 151.9+
* indicates main item
Copyright © 2014 Compass Group North America. ("CGNA") All Rights Reserved. The contents of this website, including all information viewed, downloaded or printed from this website, are
proprietary and confidential to CGNA and may not be copied, used or disclosed without the express written permission of CGNA.
Nutrient values in this report are based on data from the USDA and our suppliers. Unplanned product substitutions, changes in product specifications, and other factors may result in nutrient
content variations. Due to this inherent variability, data provided in this report should be used in conjunction with other information when planning menus for or treating individuals with medical
conditions. This report is for use by Webtrition-trained associates and for internal use.
Breakfast - Main Entrees Wednesday - 12/17/2014
Main Entrees Totals
Breakfast - Alternate Entrees Wednesday - 12/17/2014
Alternate Entrees Totals
Breakfast - Fruit & Vegetable Bar Wednesday - 12/17/2014
Fruit & Vegetable Bar Totals
Breakfast - Milk & Condiments Wednesday - 12/17/2014
Milk & Condiments Totals
Daily Totals for 12/17/2014
(+) Indicates partial nutritional values. (-) Indicates no nutritional value available.
Page 25 of 60

<2000 <65 <300 <300 - <25 <2400 <3500 <1000 <18 -
57.2% 44.7% 59.3% 16.6% - 38.7% 52.2% 50.9% 99.3% 42.6% -
* indicates main item
Copyright © 2014 Compass Group North America. ("CGNA") All Rights Reserved. The contents of this website, including all information viewed, downloaded or printed from this website, are
proprietary and confidential to CGNA and may not be copied, used or disclosed without the express written permission of CGNA.
Nutrient values in this report are based on data from the USDA and our suppliers. Unplanned product substitutions, changes in product specifications, and other factors may result in nutrient
content variations. Due to this inherent variability, data provided in this report should be used in conjunction with other information when planning menus for or treating individuals with medical
conditions. This report is for use by Webtrition-trained associates and for internal use.
Daily Value
% Daily Value
(+) Indicates partial nutritional values. (-) Indicates no nutritional value available.
Page 26 of 60

Menu Item Name Portion SizeWeight
(g)KCAL FAT (g) CHO (g)
CHOL
(mg)PRO (g) DFIB (g) Na (mg) K (mg) Ca (mg) Fe (mg)
Vit A
(RAE)
*CK12 French Toast, Sticks, WG (Aunt (34512.4)3 each 72.3 225.9 9.8 32.4 0 4.5 1.5 286.2 60.2 45.2 1.4 -
225.9 9.8 32.4 0 4.5 1.5 286.2 60.2 45.2 1.4 -
Menu Item Name Portion SizeWeight
(g)KCAL FAT (g) CHO (g)
CHOL
(mg)PRO (g) DFIB (g) Na (mg) K (mg) Ca (mg) Fe (mg)
Vit A
(RAE)
*Cereal, Cheerios Apple Cinnamon, Bow (59646)1 each 26.6 102.9 1.5 21.6 0 2 1.7 104 59.5 88.6 4 -
102.9 1.5 21.6 0 2 1.7 104 59.5 88.6 4 -
Menu Item Name Portion SizeWeight
(g)KCAL FAT (g) CHO (g)
CHOL
(mg)PRO (g) DFIB (g) Na (mg) K (mg) Ca (mg) Fe (mg)
Vit A
(RAE)
CK12 Juice, Assorted, 100%, 4 fl oz (34497)1 each 113.4 58.6 0.1 14.2 0 0.4 0.3 4.2 144.8 11.3 0.2 0.8
CK12 Fruit, Assorted, Fresh (34507) 1 each 144.5 93 0.3 24.2 0 1 3.8 1.2 291.8 17.6 0.3 5.4
CK12 Bread, Toast, Buttered, Whole G (34761.16)1 slice 42.3 156.1 10.9 12.1 3.2 3.5 1.7 231.1 81.9 45.6+ 0.7+ 0+
307.8 11.4 50.6 3.2 4.9 5.8 236.4 518.5 74.6+ 1.1+ 6.2+
Menu Item Name Portion SizeWeight
(g)KCAL FAT (g) CHO (g)
CHOL
(mg)PRO (g) DFIB (g) Na (mg) K (mg) Ca (mg) Fe (mg)
Vit A
(RAE)
CK12 Milk, Chocolate, Skim, 8 fl oz, (70682)1 each 226.8 120 0 20 5 8 0 180 420 300 0 -
CK12 Milk, White, 1% Low Fat, 8 fl o (69531)1 each 244 102.5 2.4 12.2 12.2 8.2 0 107.4 366 305 0.1 141.5
Milk, Strawberry, Skim, 8 oz, PC (58772)1 each 226.8 115.3 0.2 20 4.2 7.2 1 131.9 426.4 286.6 0.1 4.2
Jelly, Grape, PC (3378) 1 each 14.2 37.7 0 9.9 0 0 0.1 4.3 7.7 1 0 0
CK12 Syrup, 1 oz, Bulk (34503.1) 1 floz 39.2 91.8 0 24.1 0 0 0 32.2 5.9 1.2 0 0
467.4 2.5 86.2 21.4 23.4 1.1 455.7 1226 893.7 0.2 145.7
1104 25.2 190.8 24.6 34.9 10.1 1082.2 1864.2 1102.2+ 6.7+ 151.9+
* indicates main item
Copyright © 2014 Compass Group North America. ("CGNA") All Rights Reserved. The contents of this website, including all information viewed, downloaded or printed from this website, are
proprietary and confidential to CGNA and may not be copied, used or disclosed without the express written permission of CGNA.
Nutrient values in this report are based on data from the USDA and our suppliers. Unplanned product substitutions, changes in product specifications, and other factors may result in nutrient
content variations. Due to this inherent variability, data provided in this report should be used in conjunction with other information when planning menus for or treating individuals with medical
conditions. This report is for use by Webtrition-trained associates and for internal use.
Breakfast - Main Entrees Thursday - 12/18/2014
Main Entrees Totals
Breakfast - Alternate Entrees Thursday - 12/18/2014
Alternate Entrees Totals
Breakfast - Fruit & Vegetable Bar Thursday - 12/18/2014
Fruit & Vegetable Bar Totals
Breakfast - Milk & Condiments Thursday - 12/18/2014
Milk & Condiments Totals
Daily Totals for 12/18/2014
(+) Indicates partial nutritional values. (-) Indicates no nutritional value available.
Page 27 of 60

<2000 <65 <300 <300 - <25 <2400 <3500 <1000 <18 -
55.2% 38.8% 63.6% 8.2% - 40.6% 45.1% 53.3% 110.2% 37.2% -
* indicates main item
Copyright © 2014 Compass Group North America. ("CGNA") All Rights Reserved. The contents of this website, including all information viewed, downloaded or printed from this website, are
proprietary and confidential to CGNA and may not be copied, used or disclosed without the express written permission of CGNA.
Nutrient values in this report are based on data from the USDA and our suppliers. Unplanned product substitutions, changes in product specifications, and other factors may result in nutrient
content variations. Due to this inherent variability, data provided in this report should be used in conjunction with other information when planning menus for or treating individuals with medical
conditions. This report is for use by Webtrition-trained associates and for internal use.
Daily Value
% Daily Value
(+) Indicates partial nutritional values. (-) Indicates no nutritional value available.
Page 28 of 60

Menu Item Name Portion SizeWeight
(g)KCAL FAT (g) CHO (g)
CHOL
(mg)PRO (g) DFIB (g) Na (mg) K (mg) Ca (mg) Fe (mg)
Vit A
(RAE)
*CK12 Pancake, Sausage on a Stick (Sa (40463.8)1 each 82.2 220.6 11 23.1 25.1 8 1 451.2 - 40.1 1.4 -
220.6 11 23.1 25.1 8 1 451.2 - 40.1 1.4 -
Menu Item Name Portion SizeWeight
(g)KCAL FAT (g) CHO (g)
CHOL
(mg)PRO (g) DFIB (g) Na (mg) K (mg) Ca (mg) Fe (mg)
Vit A
(RAE)
*Cereal, Cocoa Puffs, 25% Less Sugar, (33398)1 each 30.1 114.8 1.5 25 0 1.9 1.7 156.6 86.2 100.1 4.5 -
114.8 1.5 25 0 1.9 1.7 156.6 86.2 100.1 4.5 -
Menu Item Name Portion SizeWeight
(g)KCAL FAT (g) CHO (g)
CHOL
(mg)PRO (g) DFIB (g) Na (mg) K (mg) Ca (mg) Fe (mg)
Vit A
(RAE)
CK12 Juice, Assorted, 100%, 4 fl oz (34497)1 each 113.4 58.6 0.1 14.2 0 0.4 0.3 4.2 144.8 11.3 0.2 0.8
CK12 Fruit, Assorted, Fresh (34507) 1 each 144.5 93 0.3 24.2 0 1 3.8 1.2 291.8 17.6 0.3 5.4
CK12 Bread, Toast, Buttered, Whole G (34761.16)1 slice 42.3 156.1 10.9 12.1 3.2 3.5 1.7 231.1 81.9 45.6+ 0.7+ 0+
307.8 11.4 50.6 3.2 4.9 5.8 236.4 518.5 74.6+ 1.1+ 6.2+
Menu Item Name Portion SizeWeight
(g)KCAL FAT (g) CHO (g)
CHOL
(mg)PRO (g) DFIB (g) Na (mg) K (mg) Ca (mg) Fe (mg)
Vit A
(RAE)
CK12 Milk, Chocolate, Skim, 8 fl oz, (70682)1 each 226.8 120 0 20 5 8 0 180 420 300 0 -
CK12 Milk, White, 1% Low Fat, 8 fl o (69531)1 each 244 102.5 2.4 12.2 12.2 8.2 0 107.4 366 305 0.1 141.5
Milk, Strawberry, Skim, 8 oz, PC (58772)1 each 226.8 115.3 0.2 20 4.2 7.2 1 131.9 426.4 286.6 0.1 4.2
Jelly, Grape, PC (3378) 1 each 14.2 37.7 0 9.9 0 0 0.1 4.3 7.7 1 0 0
CK12 Syrup, 1 oz, Bulk (34503.1) 1 floz 39.2 91.8 0 24.1 0 0 0 32.2 5.9 1.2 0 0
467.4 2.5 86.2 21.4 23.4 1.1 455.7 1226 893.7 0.2 145.7
1110.5 26.4 184.9 49.7 38.2 9.7 1299.8 1830.7 1108.5+ 7.3+ 151.9+
* indicates main item
Copyright © 2014 Compass Group North America. ("CGNA") All Rights Reserved. The contents of this website, including all information viewed, downloaded or printed from this website, are
proprietary and confidential to CGNA and may not be copied, used or disclosed without the express written permission of CGNA.
Nutrient values in this report are based on data from the USDA and our suppliers. Unplanned product substitutions, changes in product specifications, and other factors may result in nutrient
content variations. Due to this inherent variability, data provided in this report should be used in conjunction with other information when planning menus for or treating individuals with medical
conditions. This report is for use by Webtrition-trained associates and for internal use.
Breakfast - Main Entrees Friday - 12/19/2014
Main Entrees Totals
Breakfast - Alternate Entrees Friday - 12/19/2014
Alternate Entrees Totals
Breakfast - Fruit & Vegetable Bar Friday - 12/19/2014
Fruit & Vegetable Bar Totals
Breakfast - Milk & Condiments Friday - 12/19/2014
Milk & Condiments Totals
Daily Totals for 12/19/2014
(+) Indicates partial nutritional values. (-) Indicates no nutritional value available.
Page 29 of 60
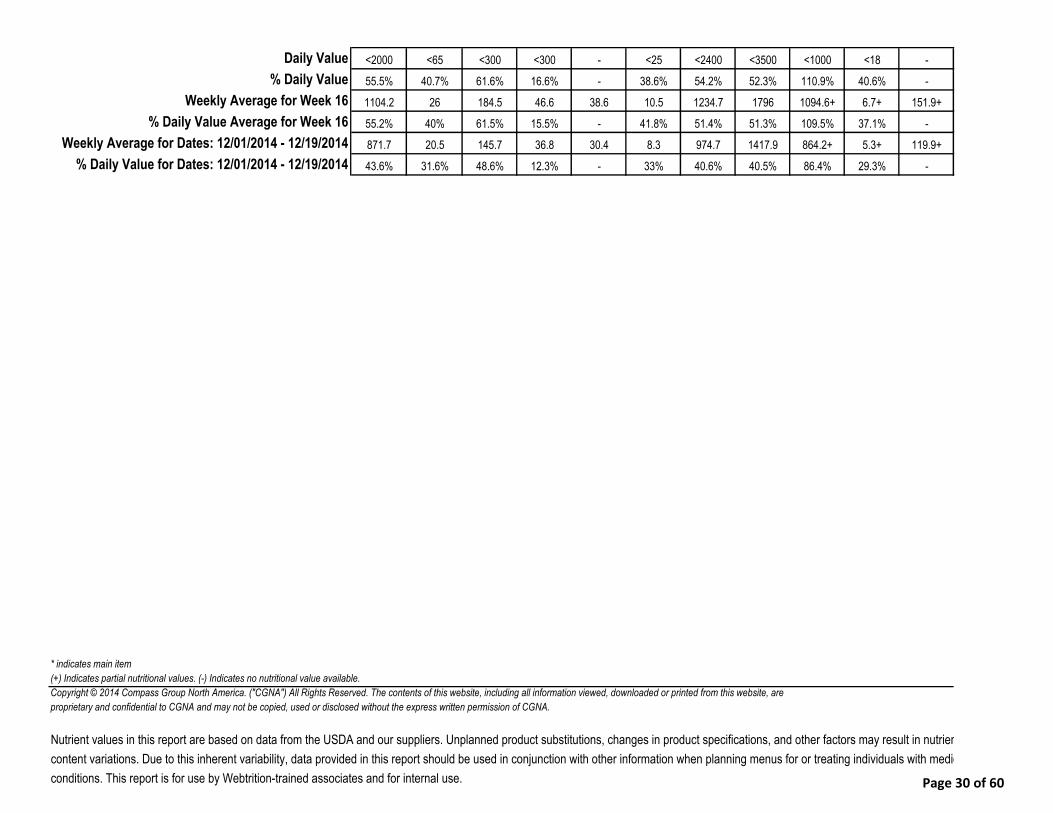
<2000 <65 <300 <300 - <25 <2400 <3500 <1000 <18 -
55.5% 40.7% 61.6% 16.6% - 38.6% 54.2% 52.3% 110.9% 40.6% -
1104.2 26 184.5 46.6 38.6 10.5 1234.7 1796 1094.6+ 6.7+ 151.9+
55.2% 40% 61.5% 15.5% - 41.8% 51.4% 51.3% 109.5% 37.1% -
871.7 20.5 145.7 36.8 30.4 8.3 974.7 1417.9 864.2+ 5.3+ 119.9+
43.6% 31.6% 48.6% 12.3% - 33% 40.6% 40.5% 86.4% 29.3% -
* indicates main item
Copyright © 2014 Compass Group North America. ("CGNA") All Rights Reserved. The contents of this website, including all information viewed, downloaded or printed from this website, are
proprietary and confidential to CGNA and may not be copied, used or disclosed without the express written permission of CGNA.
Nutrient values in this report are based on data from the USDA and our suppliers. Unplanned product substitutions, changes in product specifications, and other factors may result in nutrient
content variations. Due to this inherent variability, data provided in this report should be used in conjunction with other information when planning menus for or treating individuals with medical
conditions. This report is for use by Webtrition-trained associates and for internal use.
% Daily Value Average for Week 16
Weekly Average for Dates: 12/01/2014 - 12/19/2014
% Daily Value for Dates: 12/01/2014 - 12/19/2014
(+) Indicates partial nutritional values. (-) Indicates no nutritional value available.
Daily Value
% Daily Value
Weekly Average for Week 16
Page 30 of 60
Nutrient values in this report are based on data from the USDA and our suppliers. Unplanned product substitutions, changes in product specifications, and other factors may result in nutrient
content variations. Due to this inherent variability, data provided in this report should be used in conjunction with other information when planning menus for or treating individuals with medical
Report Run: Dec 01, 2014
Cost Analysis By: Sum All, Nutrient Analysis By: Sum All
List: All Items
Monday - 12/01/2014
Monday - 12/01/2014
Monday - 12/01/2014
Monday - 12/01/2014
Page 31 of 60

Nutrient values in this report are based on data from the USDA and our suppliers. Unplanned product substitutions, changes in product specifications, and other factors may result in nutrient
content variations. Due to this inherent variability, data provided in this report should be used in conjunction with other information when planning menus for or treating individuals with medical
Monday - 12/01/2014
Page 32 of 60

Nutrient values in this report are based on data from the USDA and our suppliers. Unplanned product substitutions, changes in product specifications, and other factors may result in nutrient
content variations. Due to this inherent variability, data provided in this report should be used in conjunction with other information when planning menus for or treating individuals with medical
Tuesday - 12/02/2014
Tuesday - 12/02/2014
Tuesday - 12/02/2014
Tuesday - 12/02/2014
Page 33 of 60

Nutrient values in this report are based on data from the USDA and our suppliers. Unplanned product substitutions, changes in product specifications, and other factors may result in nutrient
content variations. Due to this inherent variability, data provided in this report should be used in conjunction with other information when planning menus for or treating individuals with medical
Page 34 of 60

Nutrient values in this report are based on data from the USDA and our suppliers. Unplanned product substitutions, changes in product specifications, and other factors may result in nutrient
content variations. Due to this inherent variability, data provided in this report should be used in conjunction with other information when planning menus for or treating individuals with medical
Wednesday - 12/03/2014
Wednesday - 12/03/2014
Wednesday - 12/03/2014
Wednesday - 12/03/2014
Page 35 of 60

Nutrient values in this report are based on data from the USDA and our suppliers. Unplanned product substitutions, changes in product specifications, and other factors may result in nutrient
content variations. Due to this inherent variability, data provided in this report should be used in conjunction with other information when planning menus for or treating individuals with medical
Page 36 of 60

Nutrient values in this report are based on data from the USDA and our suppliers. Unplanned product substitutions, changes in product specifications, and other factors may result in nutrient
content variations. Due to this inherent variability, data provided in this report should be used in conjunction with other information when planning menus for or treating individuals with medical
Thursday - 12/04/2014
Thursday - 12/04/2014
Thursday - 12/04/2014
Thursday - 12/04/2014
Page 37 of 60

Nutrient values in this report are based on data from the USDA and our suppliers. Unplanned product substitutions, changes in product specifications, and other factors may result in nutrient
content variations. Due to this inherent variability, data provided in this report should be used in conjunction with other information when planning menus for or treating individuals with medical
Page 38 of 60

Nutrient values in this report are based on data from the USDA and our suppliers. Unplanned product substitutions, changes in product specifications, and other factors may result in nutrient
content variations. Due to this inherent variability, data provided in this report should be used in conjunction with other information when planning menus for or treating individuals with medical
Friday - 12/05/2014
Friday - 12/05/2014
Friday - 12/05/2014
Friday - 12/05/2014
Page 39 of 60

Nutrient values in this report are based on data from the USDA and our suppliers. Unplanned product substitutions, changes in product specifications, and other factors may result in nutrient
content variations. Due to this inherent variability, data provided in this report should be used in conjunction with other information when planning menus for or treating individuals with medical
Page 40 of 60

Nutrient values in this report are based on data from the USDA and our suppliers. Unplanned product substitutions, changes in product specifications, and other factors may result in nutrient
content variations. Due to this inherent variability, data provided in this report should be used in conjunction with other information when planning menus for or treating individuals with medical
Monday - 12/08/2014
Monday - 12/08/2014
Monday - 12/08/2014
Monday - 12/08/2014
Page 41 of 60

Nutrient values in this report are based on data from the USDA and our suppliers. Unplanned product substitutions, changes in product specifications, and other factors may result in nutrient
content variations. Due to this inherent variability, data provided in this report should be used in conjunction with other information when planning menus for or treating individuals with medical
Page 42 of 60

Nutrient values in this report are based on data from the USDA and our suppliers. Unplanned product substitutions, changes in product specifications, and other factors may result in nutrient
content variations. Due to this inherent variability, data provided in this report should be used in conjunction with other information when planning menus for or treating individuals with medical
Tuesday - 12/09/2014
Tuesday - 12/09/2014
Tuesday - 12/09/2014
Tuesday - 12/09/2014
Page 43 of 60

Nutrient values in this report are based on data from the USDA and our suppliers. Unplanned product substitutions, changes in product specifications, and other factors may result in nutrient
content variations. Due to this inherent variability, data provided in this report should be used in conjunction with other information when planning menus for or treating individuals with medical
Page 44 of 60

Nutrient values in this report are based on data from the USDA and our suppliers. Unplanned product substitutions, changes in product specifications, and other factors may result in nutrient
content variations. Due to this inherent variability, data provided in this report should be used in conjunction with other information when planning menus for or treating individuals with medical
Wednesday - 12/10/2014
Wednesday - 12/10/2014
Wednesday - 12/10/2014
Wednesday - 12/10/2014
Page 45 of 60

Nutrient values in this report are based on data from the USDA and our suppliers. Unplanned product substitutions, changes in product specifications, and other factors may result in nutrient
content variations. Due to this inherent variability, data provided in this report should be used in conjunction with other information when planning menus for or treating individuals with medical
Page 46 of 60

Nutrient values in this report are based on data from the USDA and our suppliers. Unplanned product substitutions, changes in product specifications, and other factors may result in nutrient
content variations. Due to this inherent variability, data provided in this report should be used in conjunction with other information when planning menus for or treating individuals with medical
Thursday - 12/11/2014
Thursday - 12/11/2014
Thursday - 12/11/2014
Thursday - 12/11/2014
Page 47 of 60

Nutrient values in this report are based on data from the USDA and our suppliers. Unplanned product substitutions, changes in product specifications, and other factors may result in nutrient
content variations. Due to this inherent variability, data provided in this report should be used in conjunction with other information when planning menus for or treating individuals with medical
Page 48 of 60

Nutrient values in this report are based on data from the USDA and our suppliers. Unplanned product substitutions, changes in product specifications, and other factors may result in nutrient
content variations. Due to this inherent variability, data provided in this report should be used in conjunction with other information when planning menus for or treating individuals with medical
Friday - 12/12/2014
Friday - 12/12/2014
Friday - 12/12/2014
Friday - 12/12/2014
Page 49 of 60

Nutrient values in this report are based on data from the USDA and our suppliers. Unplanned product substitutions, changes in product specifications, and other factors may result in nutrient
content variations. Due to this inherent variability, data provided in this report should be used in conjunction with other information when planning menus for or treating individuals with medical
Page 50 of 60

Nutrient values in this report are based on data from the USDA and our suppliers. Unplanned product substitutions, changes in product specifications, and other factors may result in nutrient
content variations. Due to this inherent variability, data provided in this report should be used in conjunction with other information when planning menus for or treating individuals with medical
Monday - 12/15/2014
Monday - 12/15/2014
Monday - 12/15/2014
Monday - 12/15/2014
Page 51 of 60

Nutrient values in this report are based on data from the USDA and our suppliers. Unplanned product substitutions, changes in product specifications, and other factors may result in nutrient
content variations. Due to this inherent variability, data provided in this report should be used in conjunction with other information when planning menus for or treating individuals with medical
Page 52 of 60

Nutrient values in this report are based on data from the USDA and our suppliers. Unplanned product substitutions, changes in product specifications, and other factors may result in nutrient
content variations. Due to this inherent variability, data provided in this report should be used in conjunction with other information when planning menus for or treating individuals with medical
Tuesday - 12/16/2014
Tuesday - 12/16/2014
Tuesday - 12/16/2014
Tuesday - 12/16/2014
Page 53 of 60

Nutrient values in this report are based on data from the USDA and our suppliers. Unplanned product substitutions, changes in product specifications, and other factors may result in nutrient
content variations. Due to this inherent variability, data provided in this report should be used in conjunction with other information when planning menus for or treating individuals with medical
Page 54 of 60

Nutrient values in this report are based on data from the USDA and our suppliers. Unplanned product substitutions, changes in product specifications, and other factors may result in nutrient
content variations. Due to this inherent variability, data provided in this report should be used in conjunction with other information when planning menus for or treating individuals with medical
Wednesday - 12/17/2014
Wednesday - 12/17/2014
Wednesday - 12/17/2014
Wednesday - 12/17/2014
Page 55 of 60

Nutrient values in this report are based on data from the USDA and our suppliers. Unplanned product substitutions, changes in product specifications, and other factors may result in nutrient
content variations. Due to this inherent variability, data provided in this report should be used in conjunction with other information when planning menus for or treating individuals with medical
Page 56 of 60

Nutrient values in this report are based on data from the USDA and our suppliers. Unplanned product substitutions, changes in product specifications, and other factors may result in nutrient
content variations. Due to this inherent variability, data provided in this report should be used in conjunction with other information when planning menus for or treating individuals with medical
Thursday - 12/18/2014
Thursday - 12/18/2014
Thursday - 12/18/2014
Thursday - 12/18/2014
Page 57 of 60

Nutrient values in this report are based on data from the USDA and our suppliers. Unplanned product substitutions, changes in product specifications, and other factors may result in nutrient
content variations. Due to this inherent variability, data provided in this report should be used in conjunction with other information when planning menus for or treating individuals with medical
Page 58 of 60

Nutrient values in this report are based on data from the USDA and our suppliers. Unplanned product substitutions, changes in product specifications, and other factors may result in nutrient
content variations. Due to this inherent variability, data provided in this report should be used in conjunction with other information when planning menus for or treating individuals with medical
Friday - 12/19/2014
Friday - 12/19/2014
Friday - 12/19/2014
Friday - 12/19/2014
Page 59 of 60

Nutrient values in this report are based on data from the USDA and our suppliers. Unplanned product substitutions, changes in product specifications, and other factors may result in nutrient
content variations. Due to this inherent variability, data provided in this report should be used in conjunction with other information when planning menus for or treating individuals with medical
Page 60 of 60