mental models risk communication to promote …...2018/11/03 · we used the mental models approach...
TRANSCRIPT

Mental models risk communication to promote private well testing in underserved minority communities
1
Frank Stillo III1; Erica Wood1; Wändi Bruine de Bruin2; Catherine Zimmer3; Jacqueline MacDonald Gibson1
1University of North Carolina at Chapel Hill, Gillings School of Global Public Health2Leeds University Business School, Behavioural Decision Research
3University of North Carolina at Chapel Hill, Odum Institute for Research in Social Science
November 1, 2018

Some Private Well Owners Are Surrounded by Municipal Water Supplies
2
Private Water Systems
• No monitoring requirements for residents
• Residents must rely on their own technical expertise
• Residents responsible for cost of testing and maintenance of water source
Source: Stillo et. al. 2017

Annually
Every 2-3 years
Every 4-5 years
Every 6-10 years
>10 years
Never
Other/ unspecified
0 1 2 3 4 5
Recommended Testing Frequencies
Bacteria: Annually
Inorganics (Lead, Copper): 2 years
Volatile organic compounds and Pesticides: 5 years
3
Homeowners Do Not Follow Recommended Testing Frequencies
Source: Fizer et. al. 2017
Testing Frequency of Homeowners

Research Objective
• Identify homeowner perceptions and knowledge gaps influencing private well owner decisions to test or not test their water quality– Focus on majority African American in peri-urban communities of Wake
County, NC, in close proximity to municipal water services
4

5
Methods

1. Identify what people need to know to make more informed decisions.
2. Identify what people already know and how they make their decisions.
3. Design communication content.
4. Test effectiveness of communication content.
We Used the Mental Models Approach to Risk Communication
Source: Bruine de Bruin and Granger et. al. 2013

Step 1: Identify What People Need to Know by Building Influence Diagram with Experts
We completed Step 1 in prior research.
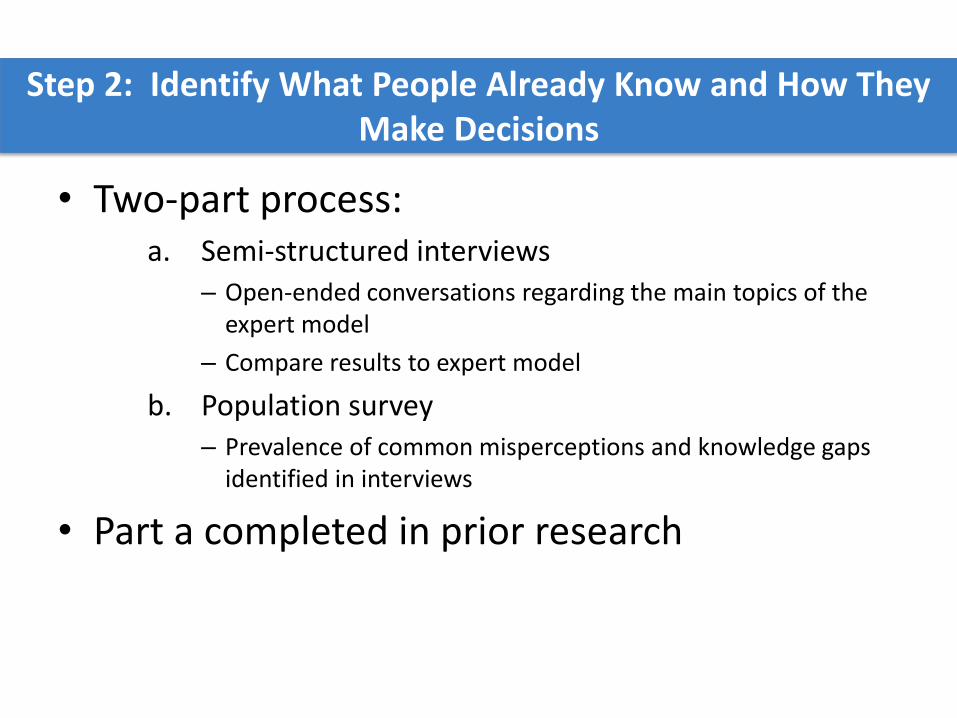
Two-Step Process
• Two-part process:a. Semi-structured interviews
– Open-ended conversations regarding the main topics of the expert model
– Compare results to expert model
b. Population survey– Prevalence of common misperceptions and knowledge gaps
identified in interviews
• Part a completed in prior research
Step 2: Identify What People Already Know and How They Make Decisions
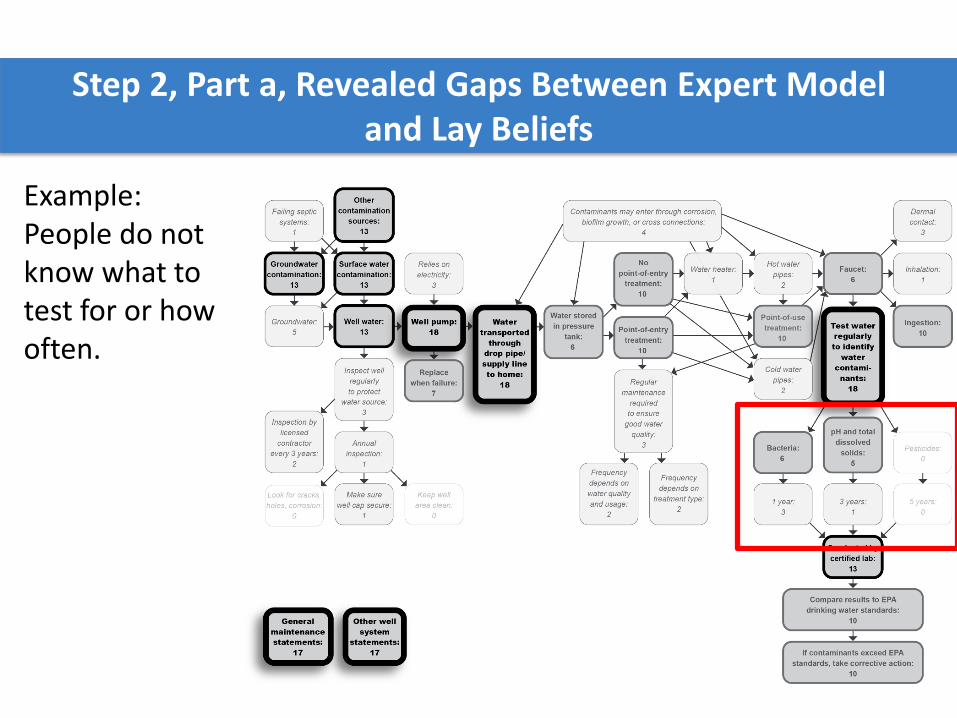
Step 2, Part a, Revealed Gaps Between Expert Model and Lay Beliefs
Example: People do not know what to test for or how often.
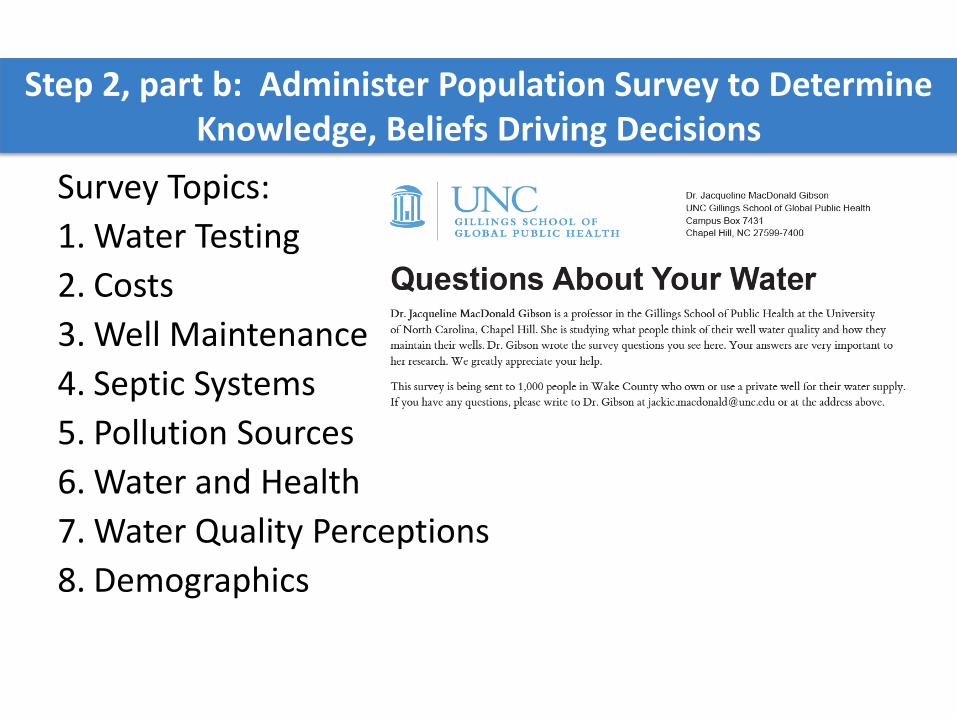
Survey Topics:
1. Water Testing
2. Costs
3. Well Maintenance
4. Septic Systems
5. Pollution Sources
6. Water and Health
7. Water Quality Perceptions
8. Demographics
Step 2, part b: Administer Population Survey to Determine Knowledge, Beliefs Driving Decisions

3. Design the risk communication intervention to target key knowledge, beliefs affecting behavior
4. Test via a randomized-controlled trial
Steps 3 and 4 Design and Test an Intervention

12
Results

Demographic Survey Study Participants
Male/ Female (n=71) 37% / 63%
Median participant age 64
Race (n=73)
African-American 53%
White 38%
Asian/Asian American 1.4%
Other 6.8%
Education (n=71)
Less than high school 13%
High school or GED 13%
Some college to
Bachelor's degree54%
Graduate school 21%
Median Household
Income62,000
Median age of well 35 years13
Characteristics of study participants and their wells (n=76)
• Majority African American
• Educated population
• Income slightly above the county average
• Old Wells

14
Few Survey Respondents Tested Their Water at the Frequencies Recommended by Health Departments
0.0%
10.0%
20.0%
30.0%
40.0%
50.0%
60.0%
70.0%
One Year Two Years Five Years Ten Years
Pe
rce
nta
ge o
f H
om
es
Test
ing
Private Well Water Testing Frequency

15
Three Factors and Well Age Predict Water Testing
SensoryPerceptions
Lack of Knowledge
andUrgency
Well Age
CostBarrier
Water Testedwithin Past
2 Years
r =
0.2
49
*
Exp(β) = 0.430**Exp(β) = 0.582**

16
Non-Testers Believe They Can “Sense” Contaminants
Factored QuestionsTested:
M(SD)
Non-Testers:
M (SD)
Factor 1: Sensory Perception Misconception 0.98 (1.07)** 1.68 (1.40)**
Water looks, smells, and tastes fine, so there is no
need to test 1.33 (1.32)* 1.78 (1.46)
No need to test, been using the water for years
without problems 0.71 (1.06)** 1.60 (1.55)**
My well water does not need to be tested because
it looks clear, has no smell, and tastes clean 0.90 (1.14)* 1.67 (1.54)*
*p ≤ 0.05; ** p ≤ 0.01

17
Non-Testers Don’t Know How to Test, Don’t Prioritize Testing
Factored QuestionsTested:
M(SD)
Non-Testers:
M (SD)
Factor 2: Lack of Knowledge and Urgency to Test 1.13 (1.15)** 2.12(1.11)**
Plan to test but haven’t gotten around to it. 1.52 (1.54)* 2.12 (1.11)**
No time to test 0.67 (1.02)* 1.25 (1.19)*
Don’t know where to test for 0.95 (1.47)* 1.69 (1.53)*
Don’t know how to test for 0.95 (1.47)* 1.74 (1.57)*
Don’t know what to test for 1.19 (1.60)** 2.19 (1.46)**
Wouldn’t know what to do if failed test 1.52 (1.67)* 2.33 (1.53)*
*p ≤ 0.05; ** p ≤ 0.01

18
Cost Is a Barrier to Testing
Factored QuestionsTested:
M(SD)
Non-Testers:
M (SD)
Factor 3: Cost Barrier to Testing1.37(0.95)** 2.14(1.01)**
I couldn’t afford the cost of testing my well water. 0.81 (1.36)** 1.93 (1.45)**
I couldn’t afford to fix my well water if
contaminated with bacteria.1.00 (1.30)** 1.91 (1.53)**
I couldn’t afford to fix my well water if
contaminated with chemicals. 1.05 (1.24)** 2.19 (1.51)**
I would prefer to drink city water if it were free. 1.52 (1.29) 1.65 (1.47)
Getting water from a well is free. 1.76 (1.37)** 2.60 (1.41)**
I would install a home water filter if I could afford
it. 2.39 (1.42) 2.63 (1.24)
*p ≤ 0.05; ** p ≤ 0.01

19
Results Informed the Design of a Risk Communication
Residents are unaware or unsure about their water
quality and who to contact to help
Right up front, we encourage a sense of
URGENCY
Using sensory perceptions to indicate when to test or to identify a problem
is common misconception
Wood et. al., in preparation

20
Results Informed Risk Communication Deisgn
Easy 2 step directions remove this barrier (how to
test) and make it urgent.
Since we also offer free testing, we wanted residents to know
discounted rates may be available
Offering FREE helpwas found to
influence testing and removed the “Now
what do I do” barrier.
Residents were unaware of testing frequency and which contaminants are
important
Wood et. al., in preparation

Randomized Controlled Trial Design
Financial Intervention Behavioral (Risk Communication) InterventionNo Risk Communication
Risk Communication
No Free Water Test Group 1 (control) Group 2
Free Water Test Group 3 Group 4
Ongoing Randomized-Controlled Trial Is Testing the Communication and Role of Cost

Conclusions
• Risk communications should
– emphasize correcting misconceptions that can contaminants be detected through sensory perception
– provide clear information about how and where to get water tested
• Subsidies or free testing could help increase testing rates
22

23
Acknowledgments
Co-AuthorsDr. Jackie MacDonald GibsonDr. Wändi Bruine de BruinDr. Catherine ZimmerErica Wood
FundingWater Resource Research Institute (WRRI) and NC Sea Grant Student Fellowship
EPA STAR Grant
NC Policy Collaborative
MacDonald Gibson Research TeamCeleste Carberry, Sara Colley, Abhishek Komandur, Sydney Lockhart, Zahra Al Hamdani, Ally Clonch, Walker Grimshaw, Riley Mulhern and many others!