memorandum of understanding between unep dtu …
TRANSCRIPT

TNA Ukraine
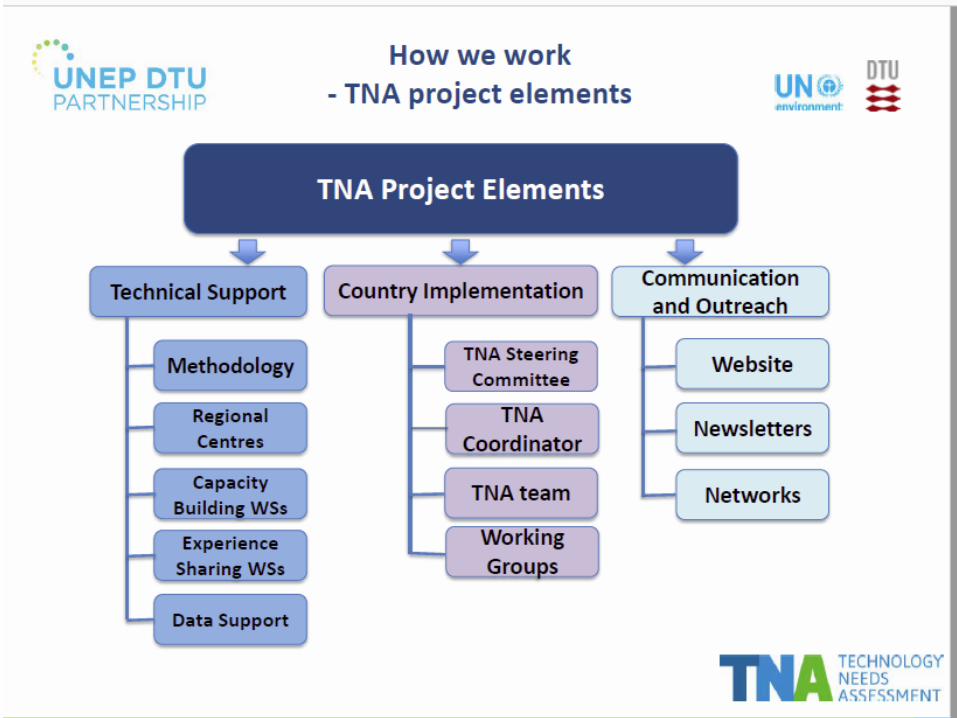
Technology Needs Assessment Project
No. 82356-A2a-03
From 12/10/ 2018 to 30/11/2020
https://menr.gov.ua/news/32993.html
MEMORANDUM OF UNDERSTANDING
BETWEEN UNEP DTU PARTNERSHIP AND Ministry of Ecology and Natural Resources
of Ukraine

http://unfccc.int/ttclear/support/technology-mechanism.html

http://unfccc.int/ttclear/tec
http://unfccc.int/ttclear/tec

http://unfccc.int/ttclear/support/national-designated-entity.html
http://unfccc.int/ttclear/support/national-designated-entity.html


http://unfccc.int/ttclear/support/poznan-strategic-programme.html
• POZNAN STRATEGIC PROGRAM ON TECHNOLOGY TRANSFER • Through the Poznan strategic program (PSP), the Global Environment Facility (GEF)
provides funding to climate technology development and transfer activities. The program has supported countries to undertake technology needs assessments (TNAs), develop technology pilot projects and implement hundreds of climate projects with objectives related to climate technologies.
• Countries created the PSP in 2007, when the Conference of the Parties (COP) requested the GEF to elaborate a strategic programme for scaling up the level of investment for technology transfer. This was undertaken with the aim of helping developing countries to address their needs for environmentally sound technologies. In 2008, the GEF Council approved a strategic programme on technology. The programme had three windows:
• Technology needs assessments • Piloting priority technology projects linked to
TNAs • Dissemination of GEF experience and
successfully demonstrated environmentally sound technologies

http://unfccc.int/ttclear/tna
Ukraine Priority sectors
MITIGATION ADAPTATION
AGRICULTURE AGRICULTURE
WASTE WATER
MITIGATION ADAPTATION
AGRICULTURE AGRICULTURE
WASTE WATER

1. A Technology Needs Assessment (TNA) report describing the prioritized technologies for mitigation and adaptation in selected sectors
2. A Barrier Analysis and Enabling Framework (BA&EF) report on exiting barriers for the prioritized technologies, and enabling framework to facilitate the deployment and diffusion of technology priorities. UDP will provide a template for the BA&EF report.
3. A Technology Action Plan (TAP) report for mitigation and adaptation including project ideas for the implementation of the TAP in the format agreed for the project with UDP. UDP will provide a template for the TAP report.
4. One Project Concept Note


One Project Concept Note
Vladimir Hecl
Sara Traerup


Ukraine Priority sectors
MITIGATION ADAPTATION
AGRICULTURE AGRICULTURE
WASTE WATER https://menr.gov.ua/news/32993.html


Potential using GIS for priotization technology and finding potential Stakeholders TNA
• Work on finding potential stakeholders for the transfer of new technologies can be performed using modern information systems GIS, spatial analyze & remote sensing.
• three main components - TIME and Space and SPECIFICS will help to identify potential customers. And then the same combinations will allow to unite them into interested groups.
• Consider a relevant examples.

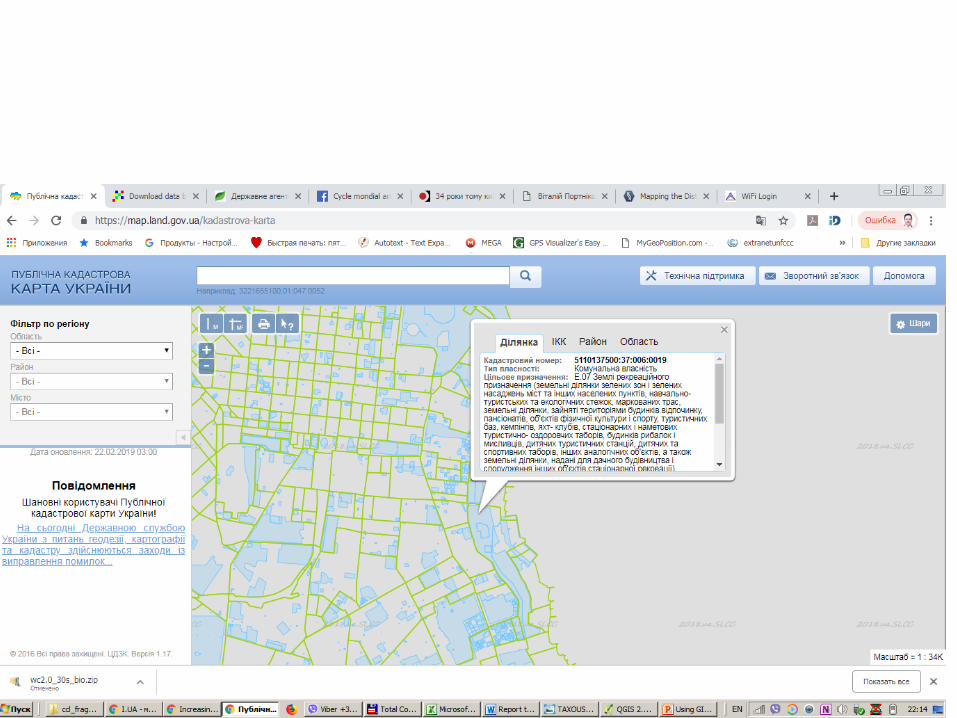
Land cadastre https://map.land.gov.ua/kadastrova-karta

Open sources of spatial information • OSM for all - https://www.openstreetmap.org/ • OSM for Africa countries -
https://download.geofabrik.de/africa.html • OSM for Ukraine
https://download.geofabrik.de/europe/ukraine.html • SRTM - https://glovis.usgs.gov/app?fullscreen=0 • https://www.genesys-pgr.org/ru/welcome • Soil
https://soilgrids.org/#!/?layer=ORCDRC_M_sl2_250m&vector=1 • CLIM data http://worldclim.org/version2
Free software • QGIS - https://qgis.org/en/site/forusers/download.html

Example Level of Sea influence for different level of stakeholders
• https://zakon.rada.gov.ua/laws/show/en/87-2001-%D0%BF • https://zakon.rada.gov.ua/laws/show/en/87-2001-%D0%BF?lang=en • http://ecoaction.org.ua/projects/sealevel/index.html
Ukrainian legislation requires the government to inform residents and land owners about the possibility of probabilistic flooding and propose appropriate changes and restrictions in land use.
based on open data, a very small non-governmental organization “Ekodia” (in which there are experts in the field of GIS) prepared an analysis of the flooding of the territory of Ukraine in the Black Sea, due to climate change

• (1) On relief base (SRTM) were formed two levels of Flood zone
• (2) Data from OSM (Open Street Map) were differenced on 6 group of layers
• Landuse
• Homelessed items
• Tourism and Rest
• Infrastructure
• Household
• Landscape and Ecology


Example 2 – Agricultural enterprises with potatoes production
• https://map.onesoil.ai/ • http://www.diva-gis.org/ • http://www.diva-gis.org/Data • https://www.bioversityinternational.org/e-
library/publications/training-materials/ • http://worldclim.org/version2 • https://map.land.gov.ua/kadastrova-karta
In Ukraine, the agricultural sector plays a huge role. Therefore, one of the important tasks is to unite the producers of specialized crops with the aim to implement common adaptation measures. For example, Potatoes are one of the most important crops in Ukraine.
The following example uses (1) data from a non-governmental Belarusian organization that created the ONE SOIL service. (2) Specialized GIS DIVA-GIS and related data sets allowing to simulate conditions for growing agricultural crops in the future and (3) cadastral map of Ukraine


POTATOS 2016

POTATOS 2017

POTATOS 2018

http://worldclim.org/version2 variable 10 minutes 5 minutes 2.5 minutes 30 seconds
minimum temperature (°C)
tmin 10m tmin 5m tmin 2.5m tmin 30s
maximum temperature (°C)
tmax 10m tmax 5m tmax 2.5m tmax 30s
average temperature (°C)
tavg 10m tavg 5m tavg 2.5m tavg 30s
precipitation (mm) prec 10m prec 5m prec 2.5m prec 30s
solar radiation (kJ m-
2 day-1) srad 10m srad 5m srad 2.5m srad 30s
wind speed (m s-1) wind 10m wind 5m wind 2.5m wind 30s
water vapor pressure (kPa)
vapr 10m vapr 5m vapr 2.5m vapr 30s
variable 10 minutes 5 minutes 2.5 minutes 30 seconds
Bioclimatic variables
bio 10m bio 5m bio 2.5m bio 30s

http://worldclim.org/bioclim https://rspatial.org/sdm/
• Bioclimatic variables • Bioclimatic variables are derived from the monthly temperature and rainfall values in order to
generate more biologically meaningful variables. These are often used in species distribution modeling and related ecological modeling techniques. The bioclimatic variables represent annual trends (e.g., mean annual temperature, annual precipitation) seasonality (e.g., annual range in temperature and precipitation) and extreme or limiting environmental factors (e.g., temperature of the coldest and warmest month, and precipitation of the wet and dry quarters). A quarter is a period of three months (1/4 of the year).
• They are coded as follows: • BIO1 = Annual Mean Temperature
BIO2 = Mean Diurnal Range (Mean of monthly (max temp - min temp)) BIO3 = Isothermality (BIO2/BIO7) (* 100) BIO4 = Temperature Seasonality (standard deviation *100) BIO5 = Max Temperature of Warmest Month BIO6 = Min Temperature of Coldest Month BIO7 = Temperature Annual Range (BIO5-BIO6) BIO8 = Mean Temperature of Wettest Quarter BIO9 = Mean Temperature of Driest Quarter BIO10 = Mean Temperature of Warmest Quarter BIO11 = Mean Temperature of Coldest Quarter BIO12 = Annual Precipitation BIO13 = Precipitation of Wettest Month BIO14 = Precipitation of Driest Month BIO15 = Precipitation Seasonality (Coefficient of Variation) BIO16 = Precipitation of Wettest Quarter BIO17 = Precipitation of Driest Quarter BIO18 = Precipitation of Warmest Quarter BIO19 = Precipitation of Coldest Quarter

• In DIVA-GIS, 12 possible growing seasons are considered, starting on the first of each month. To determine the suitability of a growing season for a certain crop, the following temperature parameters are used: KTMP: absolute temperature that will kill the plant TMIN: minimum average temperature at which the plant will grow TOPMN: minimum average temperature at which the plant will grow optimally TOPMX: maximum average temperature at which the plant will grow optimally TMAX: maximum average temperature at which the plant will cease to grow To estimate the suitability of the rainfall in an area for a particular crop, the following rainfall parameters are used: Rmin: minimum rainfall (mm) during the growing season Ropmin: optimal minimum rainfall (mm) during the growing season Ropmax: optimal maximum rainfall (mm) during the growing season Rmax: maximum rainfall (mm) during the growing season

https://www.facebook.com/MOUAKSaid/videos/365853754001501/

Potatos - Solanum tuberosum L.
Вид
Solanum tuberosum L.
Growing Time
Temperature
Rainfall
GMin 90
KTmp -1
Rmin 250
GMax 160
Tmin 7
ROPmn 500
GUsed 125
TOPmn 15
ROPmx 800
TOPmx 25
Rmax 2000
Tmax 30

2197 колонок*985 строчек
127 678 655
Orographic map (height) Matrix each cell = square kilometer 2197 columns * 985 lines = 2 million 164 thousand 045 cells
69 layers = 127 million 678 thousand 655 values

2008-2010
Solanum tuberosum L.

2020
Solanum tuberosum L.

2080
Solanum tuberosum L.
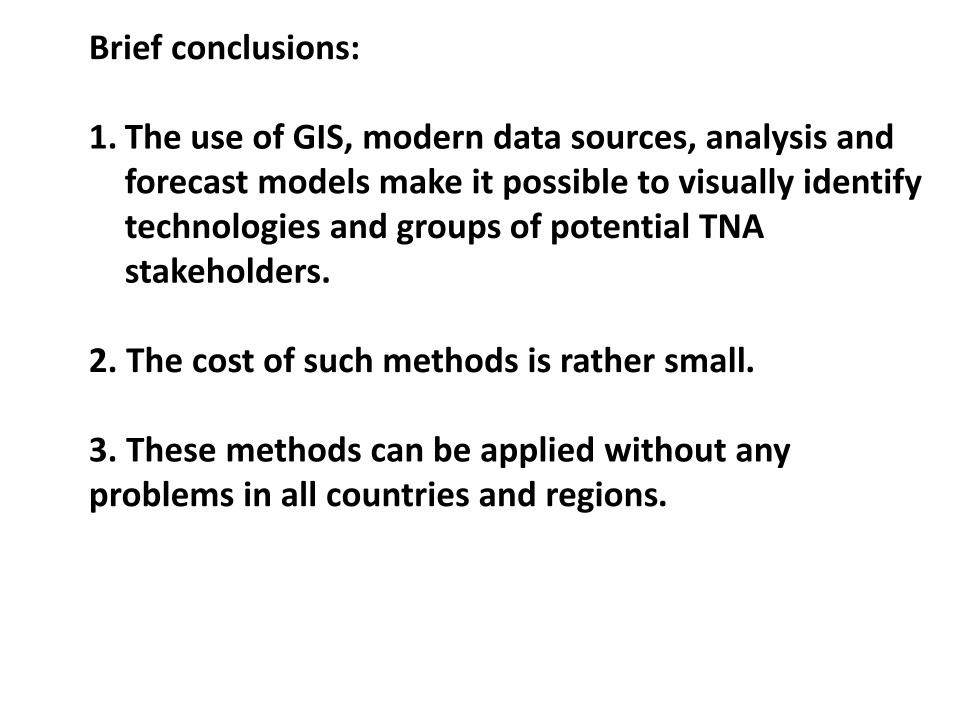
Brief conclusions: 1. The use of GIS, modern data sources, analysis and
forecast models make it possible to visually identify technologies and groups of potential TNA stakeholders.
2. The cost of such methods is rather small. 3. These methods can be applied without any problems in all countries and regions.

Questions ?
Thanks for attention !