memorandum - cooper unionfaculty.cooper.edu/bdavis/examplework/che142student1project.pdf ·...
TRANSCRIPT

MEMORANDUM
Attachments: Appendix I – Process Flow Diagram Appendix II – Capital and Operating Costs – 10 Year Plan Appendix III – Explanation of Size and Cost Estimations Appendix IV – Hand Calculations to Back Up Pro II Results Appendix V – Minimum Work vs. Actual Work Analysis
C Squared Consulting Associates 41 Cooper Square
New York, NY 10003 Date: November 28, 2011 To: Ms. Sam K. Safobeen From: Jorge Aguerrevere Re: Plant for Separation of Styrene, Ethyl Benzene, Ammonia, and Hydrogen Sulfide I was required to design a chemical plant for the separation of a mixture containing styrene, ethyl benzene, ammonia, and hydrogen sulfide into four 99% pure (by mole) streams. A requirement on the process is that at least 90% of the mass of the feed stream is to be recovered. The goal of the design is to minimize the cost of the plant, considering only capital costs of equipment and operating costs for a 10-year plant life. Plant design is currently sized to handle 1000 kg/hr of feed with the following composition: 40% styrene, 40% ethyl benzene, 15% ammonia, and 5% hydrogen sulfide by mass at 350 K and 2 atm.
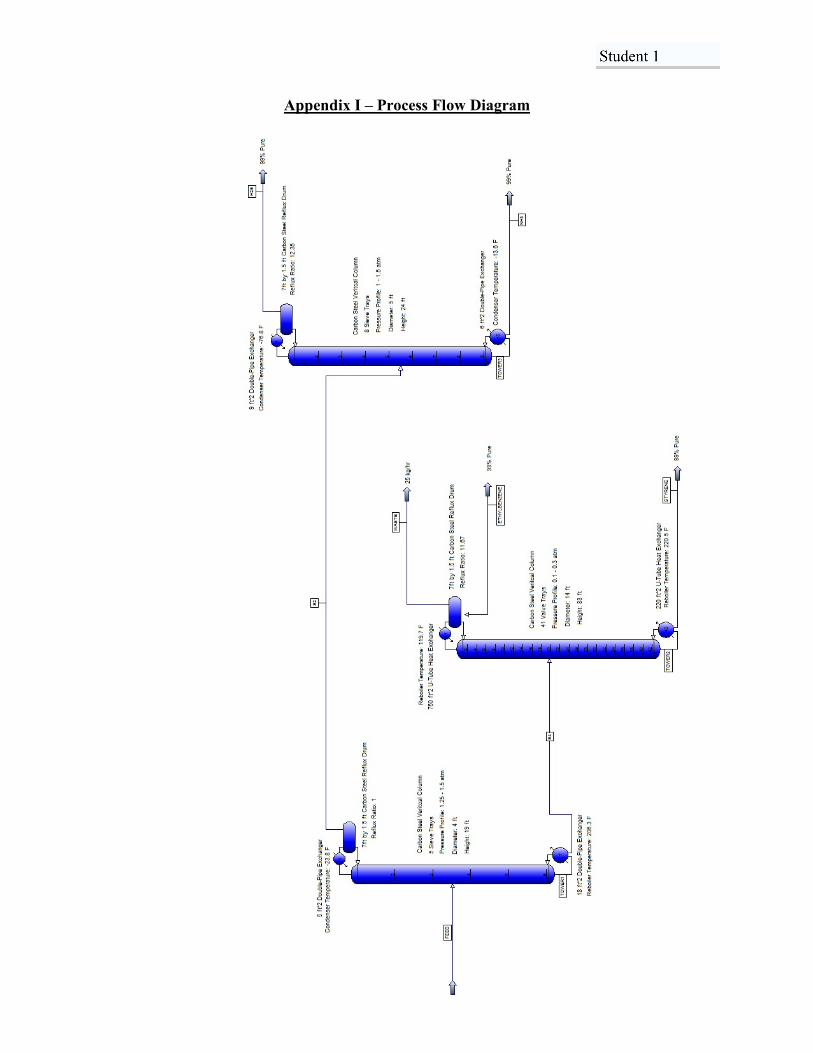
The design involves 3 distillation columns and the estimated capital cost is $476,750 with an operating cost of $3,314,400/year. The 10-year projection for the expenses of the project amounts to $33,620,750. The first column, which is 4ft in diameter and 19 ft high, separates the feed mixture into two streams: one containing mostly ethyl benzene and styrene, and another containing mostly ammonia and hydrogen sulfide. The separation is achieved with 5 sieve trays and a partial reboiler and partial condenser. I modeled this tower in Pro II, using the Peng-Robinson thermodynamic model to obtain thermodynamic data. The total estimated capital cost for this column is $22,550 with an estimated operating cost of $1,371,200/year. The operating costs are very high because liquid nitrogen is needed to operate the condenser.
The other two columns in the plant are designed to separate ethyl benzene from styrene, and ammonia from hydrogen sulfide. Due to their similar boiling points, ethyl benzene and styrene are very hard to separate. For this reason, the distillation column designed for this separation accounts for most of the capital costs of the plant. The column is 14ft in diameter and 84 feet tall, with an estimated capital cost of $422,200 and an operating cost of $67,800/year. The separation is achieved using 41 valve trays, a partial reboiler, and a partial condenser. A waste stream of 25 kg (or 2.5% of the feed) is evaporated out of the top of the column. The tower for separating ammonia and ethyl benzene is much smaller, but has higher operating costs because it requires liquid nitrogen to operate the condenser and it has a high reflux ratio of 12.35. The column has an estimated capital cost of $32,000 with an operating cost of $1,875,400/year.
This plant design is concise and has low capital costs; however, the yearly operating costs are extremely high due to the high volume of liquid nitrogen needed to operate the plant. A minimum work vs. actual work analysis showed that this process uses 4.53 times the minimum energy required for the separation. Over the next two weeks, I will explore other options that could be pursued to lower the operating costs of the plant in order to reduce expenses over the 10-year life of the plant.
MEMORANDUM
Attachments: Appendix VI – New Process Flow Diagram Appendix VII – New Capital and Operating Costs – 10 Year Plan Appendix VIII – Explanation of New Size and Cost Estimations Appendix IX – Hand Calculations to Back Up Pro II Results Appendix X – Minimum Work vs. Actual Work for New Design
C Squared Consulting Associates 41 Cooper Square
New York, NY 10003 Date: December 12, 2011 To: Ms. Sam K. Safobeen From: Jorge Aguerrevere Re: Improved Plant for Separation of Styrene, Ethyl Benzene, Ammonia, and Hydrogen Sulfide Two weeks ago, I proposed a plant design for the separation of styrene, ethyl benzene, ammonia, and hydrogen sulfide. I have designed a new plant, very similar to the previously proposed plant, which incorporates a membrane separation to reduce operating costs of the plant by reducing the operating costs of the distillation column used to separate ammonia and hydrogen sulfide. The new plant proposal contains the same three column designs as the last plant proposal, but the addition of the membrane separator allows the desired results to be achieved operating the column in a more cost effective manner. The capital cost of the new design is $2,096,750 but the operating cost of the plant is only $2,719,400/year, which reduces the yearly costs of operation by about $595,000/year.
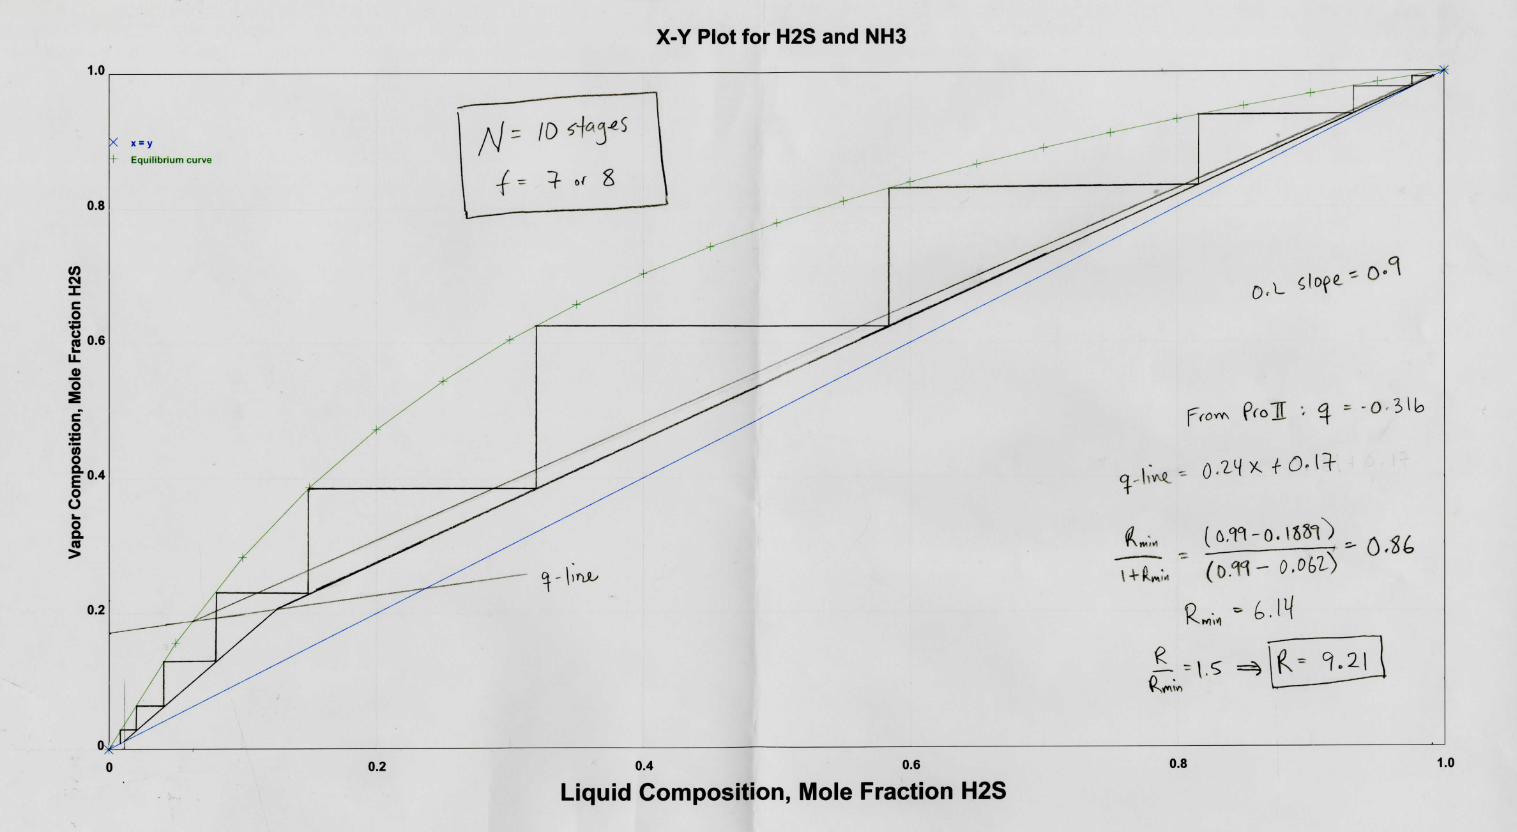
The main concept behind my implementation of the membrane unit comes from the fact that the reflux ratio of a column is heavily dependent on the feed conditions. If the feed to a column is has a low composition of the light component, then the reflux ratio is likely to be high due to small distillate product withdrawal. The feed to the distillation column in the initial design was composed of approximately 14% hydrogen, resulting in a reflux ratio of 12.35. The membrane unit introduced was a 3.5 micron thick film of polyphenylene sulfide (PPS), because the permeance of ammonia through the film is 5 times higher than that of hydrogen sulfide. This allows the concentration of hydrogen sulfide in the feed to the distillation column to be increased up to nearly 21%, allowing for operation with a reflux ratio of 9.74. Of the stream that permeates through the membrane, I decided to waste 70 kg (7% of the feed) while recycling the rest of the stream to the membrane feed. This greatly reduced cost, while remaining on specification.
In order to implement the membrane, I had to include a compressor to increase the pressure of the feed to the membrane unit, and an expander to decrease the pressure before feeding the stream to the distillation column. The cost of the compressor was $90,000 and the cost of the expander was $30,000. The membrane module, which is spiral-wound, costs $1,500,000 as a capital cost with a yearly membrane replacement cost of $40,000/year. This assumes that the membrane is replaced every year. Considering the increased capital costs, and the decreased operating costs, the 10-year projection for expenses is $29,290,750, which is $4,330,000 lower than that of the previous proposal.
I found that this process uses 6.82 times the minimum work required for the separation. This ratio is higher than for the previously proposed plant, but this plant is a better economic option because the energy used for the separation comes at a much lower cost.
Jorge Aguerrevere
Appendix I – Process Flow Diagram
Jorge Aguerrevere
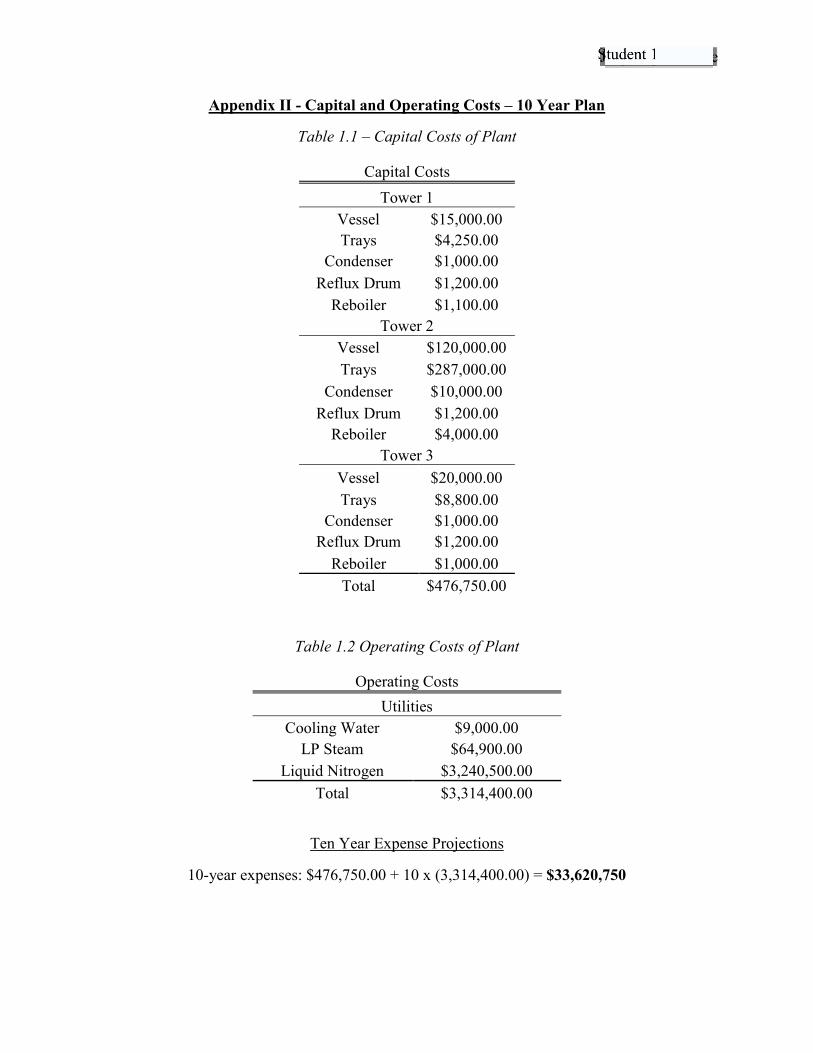
Appendix II - Capital and Operating Costs – 10 Year Plan
Table 1.1 – Capital Costs of Plant
Table 1.2 Operating Costs of Plant
Operating Costs Utilities
Cooling Water $9,000.00 LP Steam $64,900.00
Liquid Nitrogen $3,240,500.00 Total $3,314,400.00
Ten Year Expense Projections
10-year expenses: $476,750.00 + 10 x (3,314,400.00) = $33,620,750
Capital Costs Tower 1
Vessel $15,000.00 Trays $4,250.00
Condenser $1,000.00 Reflux Drum $1,200.00
Reboiler $1,100.00 Tower 2
Vessel $120,000.00 Trays $287,000.00
Condenser $10,000.00 Reflux Drum $1,200.00
Reboiler $4,000.00 Tower 3
Vessel $20,000.00 Trays $8,800.00
Condenser $1,000.00 Reflux Drum $1,200.00
Reboiler $1,000.00 Total $476,750.00

Jorge Aguerrevere
Appendix III – Explanation of Size and Cost Estimations
Distillation Columns:
I used the following heuristics for sizing the distillation columns1:
- Maximum velocity in the column is given by Fs �Xȡ0.5 where the vapor factor, Fs, was
taken to be 1.0 ft lb0.5 / s ft1.5 and the density of the vapor at its highest flow rate was used
- A spacing of 20’’ was left between trays for accessibility reasons
- Downcomers occupy 20% of the cross-sectional area of the column
- Sieve holes account for 10% of the area of a sieve tray
- Valve trays have 14 caps/ft2 of tray and each cap is 1.5’’ in diameter
- A height of 4 feet should be added at the top for vapor disengagement and a height of 6
feet should be added at the bottom for liquid hold up and reboiler return.
To size the column, I obtained the maximum vapor flow rate and the corresponding vapor density at that stage in the column from the text output file in Pro II. I used that density to compute the maximum velocity allowed in the column. With known maximum velocity and maximum vapor flow rate, I was able to calculate the area through which the vapor was flowing (the area of the holes). I then obtained the cross-sectional area of the column by relating the area of the holes to the area of the trays, and accounting for the area taken up by the downcomers according to the heuristics above. I used that cross-sectional area to determine the diameter of the column. I calculated the height of the column by using the number of trays in the column and multiplying it by the height. According to the heuristics, I added a height of 10 feet for the top and bottom.
With the height and diameter of the columns at hand, I was able to use the charts provided in Plant Design and Economics for Chemical Engineers by Peters and Timmerhaus2 in order to find the cost of each column. Once chart provided the cost of the column itself for a given diameter and height, and another provided the cost per tray for each diameter and type of tray. Towers 1 and 3 used sieve trays, while Tower 2 used valve trays to allow for a smaller diameter of the column.
1 Turton et al. Heuristics (Handout from Prof. Stock) 2 Peters, Max Stone, and Klaus D. Timmerhaus. Plant Design and Economics for Chemical Engineers. New York: McGraw-Hill, 1980. Print.
Jorge Aguerrevere
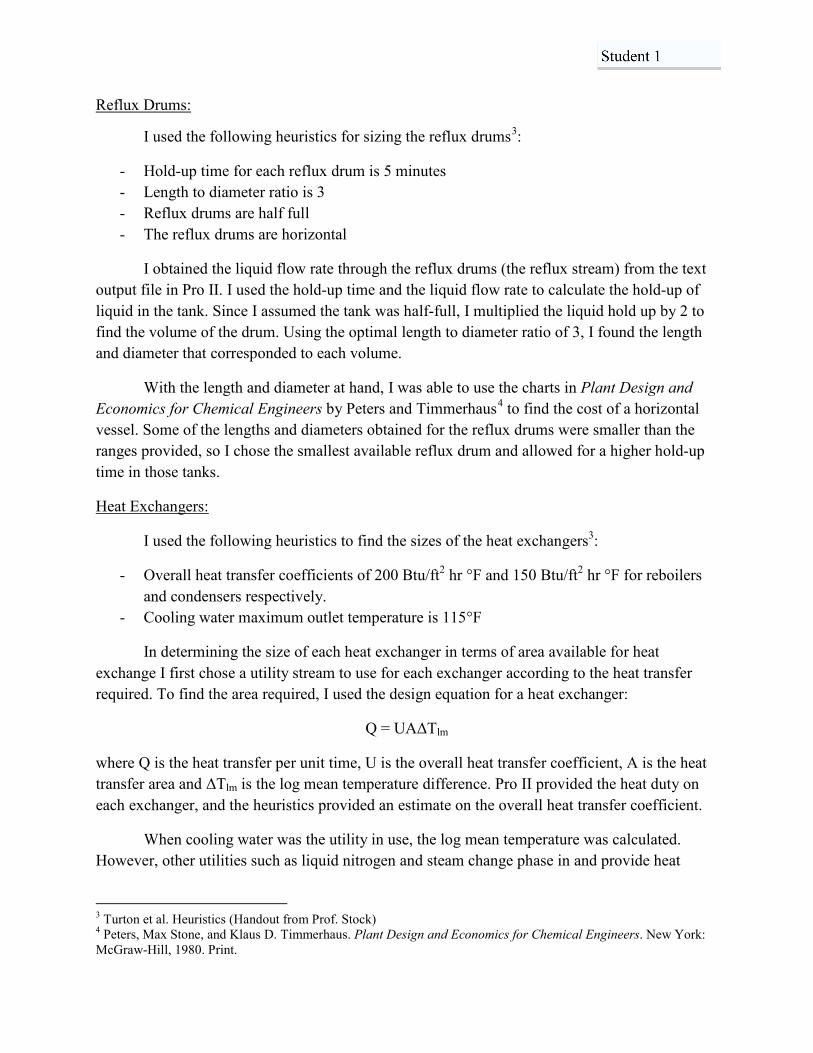
Reflux Drums:
I used the following heuristics for sizing the reflux drums3:
- Hold-up time for each reflux drum is 5 minutes - Length to diameter ratio is 3 - Reflux drums are half full - The reflux drums are horizontal
I obtained the liquid flow rate through the reflux drums (the reflux stream) from the text output file in Pro II. I used the hold-up time and the liquid flow rate to calculate the hold-up of liquid in the tank. Since I assumed the tank was half-full, I multiplied the liquid hold up by 2 to find the volume of the drum. Using the optimal length to diameter ratio of 3, I found the length and diameter that corresponded to each volume.
With the length and diameter at hand, I was able to use the charts in Plant Design and Economics for Chemical Engineers by Peters and Timmerhaus4 to find the cost of a horizontal vessel. Some of the lengths and diameters obtained for the reflux drums were smaller than the ranges provided, so I chose the smallest available reflux drum and allowed for a higher hold-up time in those tanks.
Heat Exchangers:
I used the following heuristics to find the sizes of the heat exchangers3:
- Overall heat transfer coefficients of 200 Btu/ft2 hr °F and 150 Btu/ft2 hr °F for reboilers and condensers respectively.
- Cooling water maximum outlet temperature is 115°F
In determining the size of each heat exchanger in terms of area available for heat exchange I first chose a utility stream to use for each exchanger according to the heat transfer required. To find the area required, I used the design equation for a heat exchanger:
4� �8$ǻ7lm
where Q is the heat transfer per unit time, U is the overall heat transfer coefficient, A is the heat WUDQVIHU�DUHD�DQG�ǻ7lm is the log mean temperature difference. Pro II provided the heat duty on each exchanger, and the heuristics provided an estimate on the overall heat transfer coefficient.
When cooling water was the utility in use, the log mean temperature was calculated. However, other utilities such as liquid nitrogen and steam change phase in and provide heat
3 Turton et al. Heuristics (Handout from Prof. Stock) 4 Peters, Max Stone, and Klaus D. Timmerhaus. Plant Design and Economics for Chemical Engineers. New York: McGraw-Hill, 1980. Print.

Jorge Aguerrevere
transfer from their latent heat, so I used the temperature difference between utility and process stream in place of the log mean temperature difference.
Once I knew the size of heat exchangers needed for each column, I chose a type of heat exchanger appropriate for the area. Most of the exchangers were small, so I used double pipe heat exchangers. The separation of ethylbenzene and styrene required larger heat exchangers so I used a U-tube heat exchangers for the condenser and reboiler.
Knowing the sizes of the heat exchangers and their respective types, I was able to use the charts in Plant Design and Economics for Chemical Engineers by Peters and Timmerhaus5 to find cost of each unit.
Utilities:
I calculated the costs of each utility by finding the flow rate of each utility required to obtain the heat duties that Pro II calculated for each heat exchanger. I obtained the heats of vaporization of liquid nitrogen and #20 steam at 77K and 260°F respectively from the DIPPR database. Similarly, I obtained the heat capacity of cooling water at 90°F and 115°F, which were extremely close. Using the following equations, I was able to find the flow rate of each stream that was required:
4� �PǻKvap for liquid nitrogen and #20 steam
and
Q = mcpǻ7�IRU�WKH�FRROLQJ�ZDWHU�VWUHDP
The equations above provided a mass flow rate for all streams, which I then converted to volumetric flow rate of liquid nitrogen and cooling water in order to figure out the utility costs from Table 1.3 below.
Table 1.3 – Available Utilities and Costs
Utility Cost
Liquid Nitrogen at 77K $0.1/Liter ����6WHDP�DW����Û) $7/metric ton
&RROLQJ�:DWHU�DW���Û) $0.08/1000 gallons
5 Peters, Max Stone, and Klaus D. Timmerhaus. Plant Design and Economics for Chemical Engineers. New York: McGraw-Hill, 1980. Print.
Jorge Aguerrevere
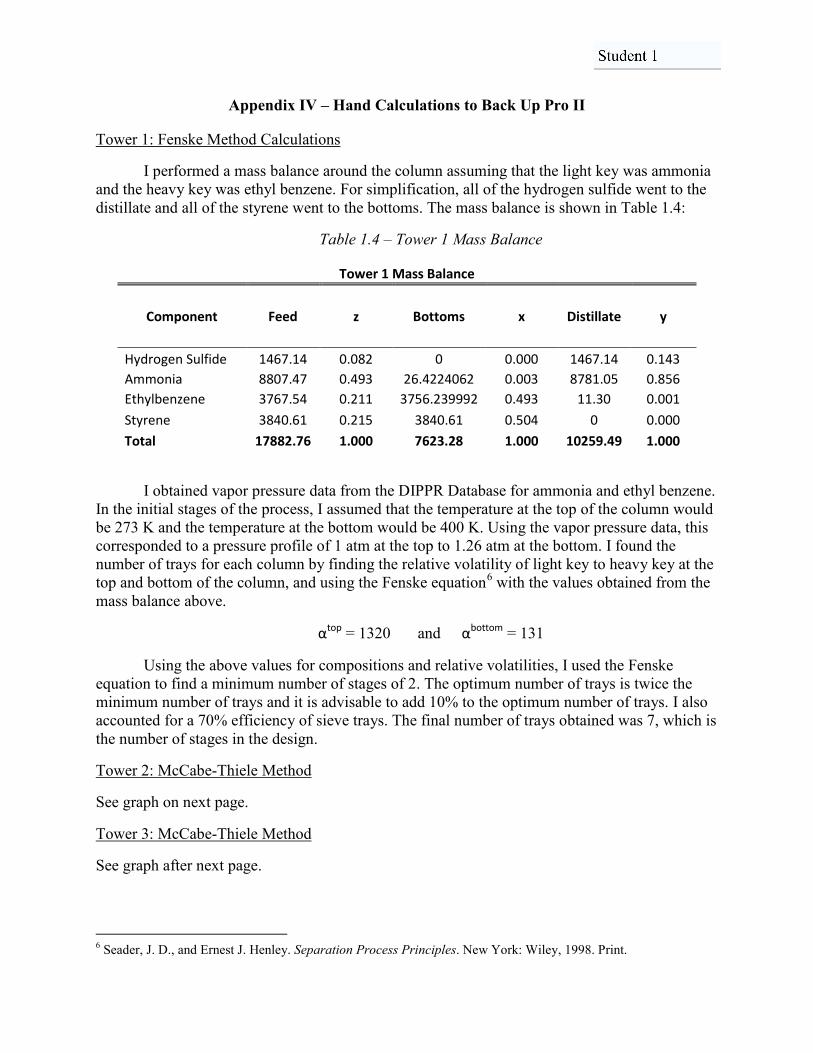
Appendix IV – Hand Calculations to Back Up Pro II
Tower 1: Fenske Method Calculations
I performed a mass balance around the column assuming that the light key was ammonia and the heavy key was ethyl benzene. For simplification, all of the hydrogen sulfide went to the distillate and all of the styrene went to the bottoms. The mass balance is shown in Table 1.4:
Table 1.4 – Tower 1 Mass Balance
Tower 1 Mass Balance
Component Feed z Bottoms x Distillate y
Hydrogen Sulfide 1467.14 0.082 0 0.000 1467.14 0.143 Ammonia 8807.47 0.493 26.4224062 0.003 8781.05 0.856 Ethylbenzene 3767.54 0.211 3756.239992 0.493 11.30 0.001 Styrene 3840.61 0.215 3840.61 0.504 0 0.000 Total 17882.76 1.000 7623.28 1.000 10259.49 1.000
I obtained vapor pressure data from the DIPPR Database for ammonia and ethyl benzene. In the initial stages of the process, I assumed that the temperature at the top of the column would be 273 K and the temperature at the bottom would be 400 K. Using the vapor pressure data, this corresponded to a pressure profile of 1 atm at the top to 1.26 atm at the bottom. I found the number of trays for each column by finding the relative volatility of light key to heavy key at the top and bottom of the column, and using the Fenske equation6 with the values obtained from the mass balance above.
ɲtop = 1320 and ɲbottom = 131
Using the above values for compositions and relative volatilities, I used the Fenske equation to find a minimum number of stages of 2. The optimum number of trays is twice the minimum number of trays and it is advisable to add 10% to the optimum number of trays. I also accounted for a 70% efficiency of sieve trays. The final number of trays obtained was 7, which is the number of stages in the design.
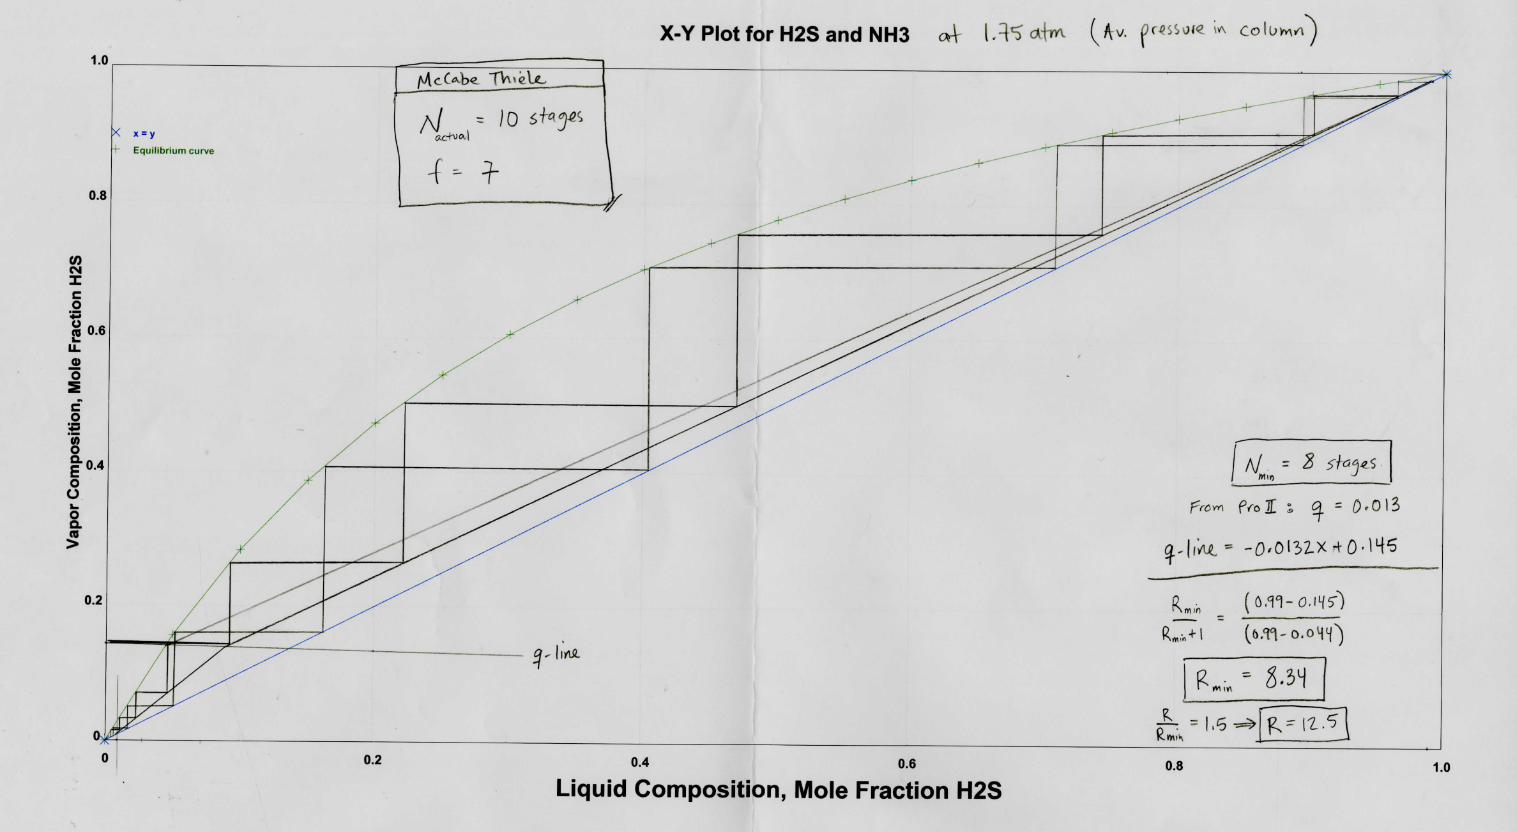
Tower 2: McCabe-Thiele Method
See graph on next page.
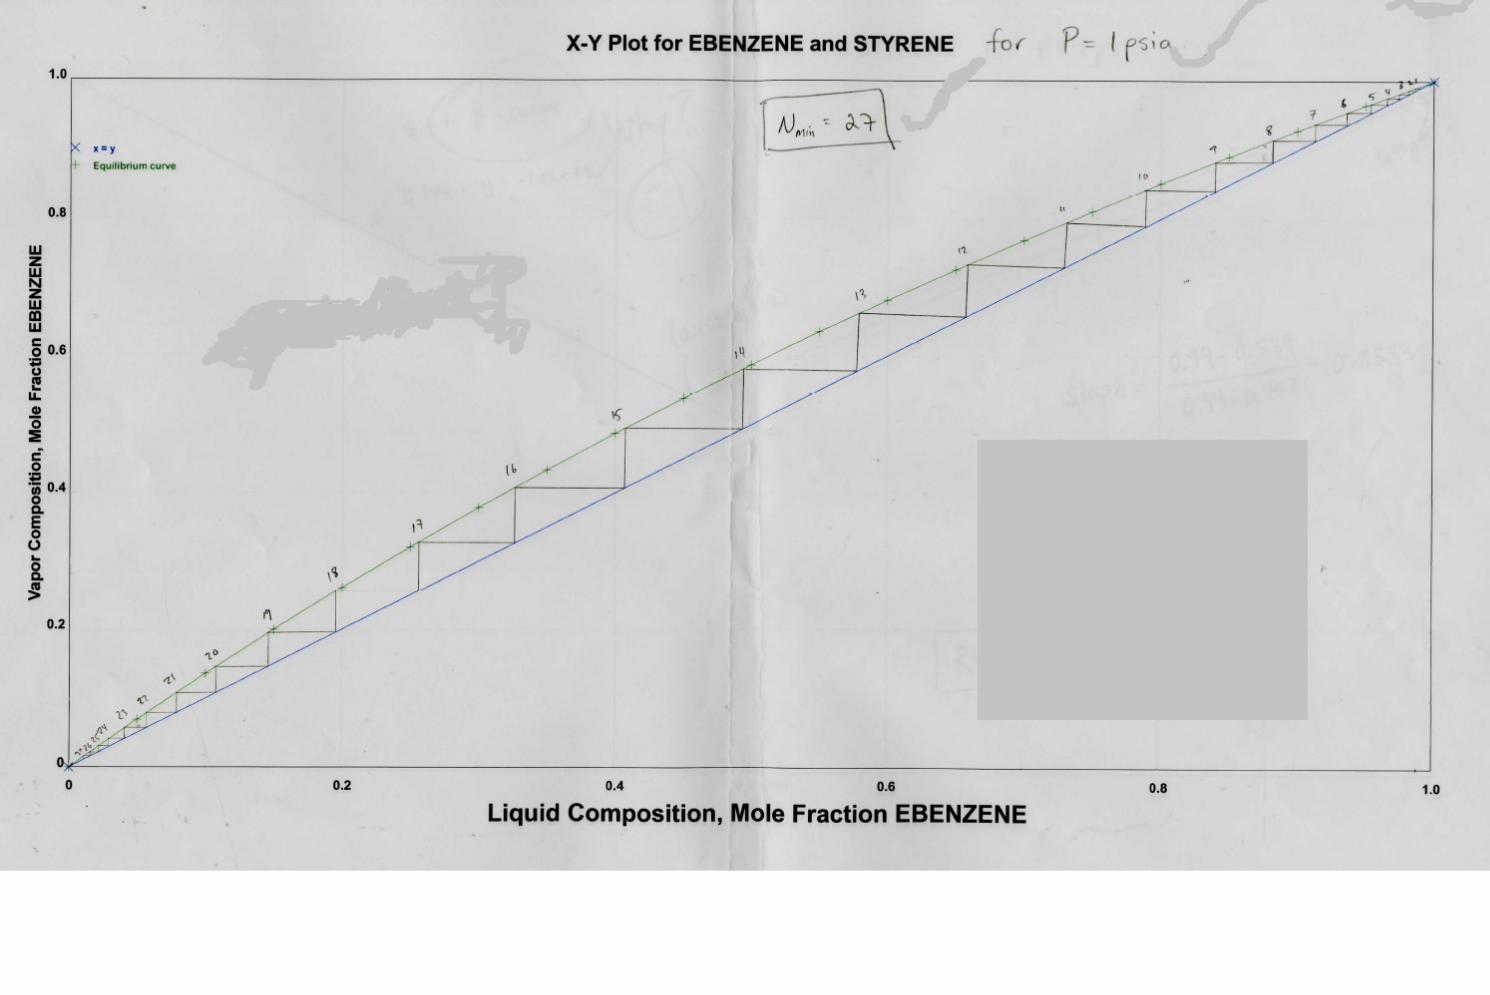
Tower 3: McCabe-Thiele Method
See graph after next page.
6 Seader, J. D., and Ernest J. Henley. Separation Process Principles. New York: Wiley, 1998. Print.


Jorge Aguerrevere
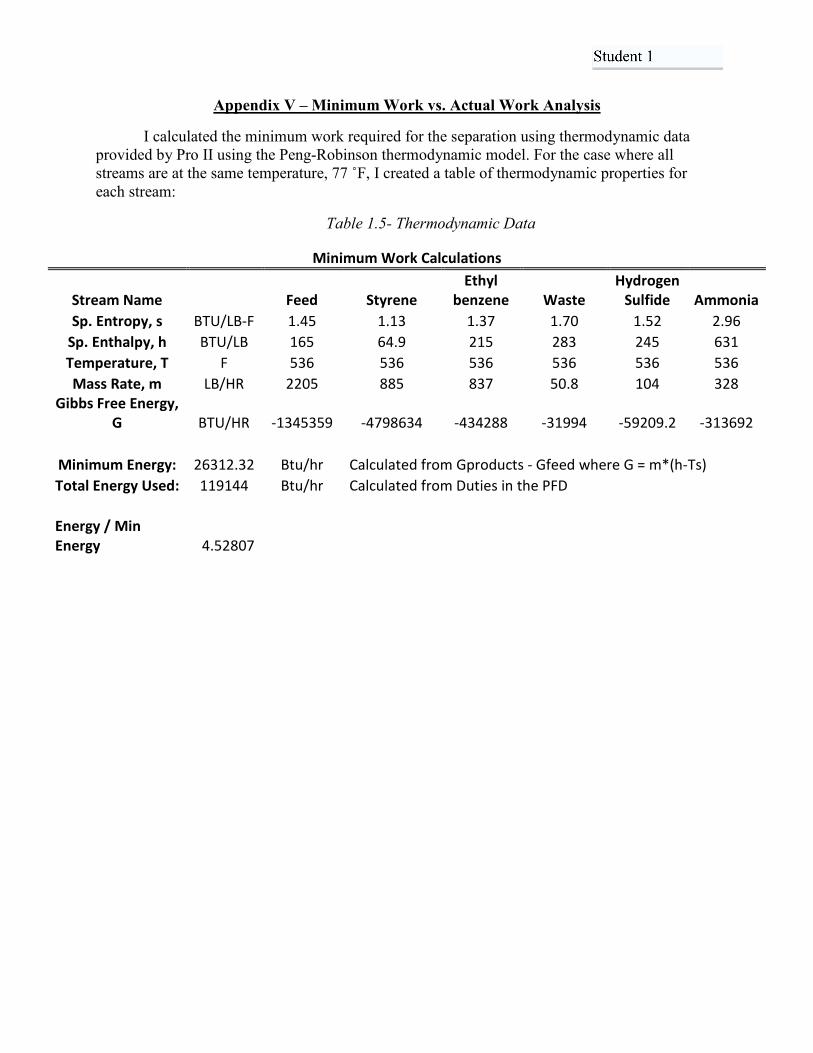
Appendix V – Minimum Work vs. Actual Work Analysis
I calculated the minimum work required for the separation using thermodynamic data provided by Pro II using the Peng-Robinson thermodynamic model. For the case where all streams are at the same temperature, 77 ÛF, I created a table of thermodynamic properties for each stream:
Table 1.5- Thermodynamic Data
Minimum Work Calculations
Stream Name
Feed Styrene Ethyl
benzene Waste Hydrogen
Sulfide Ammonia Sp. Entropy, s BTU/LB-F 1.45 1.13 1.37 1.70 1.52 2.96
Sp. Enthalpy, h BTU/LB 165 64.9 215 283 245 631 Temperature, T F 536 536 536 536 536 536 Mass Rate, m LB/HR 2205 885 837 50.8 104 328
Gibbs Free Energy, G BTU/HR -1345359 -4798634 -434288 -31994 -59209.2 -313692
Minimum Energy: 26312.32 Btu/hr Calculated from Gproducts - Gfeed where G = m*(h-Ts) Total Energy Used: 119144 Btu/hr Calculated from Duties in the PFD
Energy / Min Energy 4.52807

Jorge Aguerrevere
Appendix VI – New Process Flow Diagram

Jorge Aguerrevere
Appendix VII – New Capital and Operating Costs – 10 Year Plan
Table 2.1 – Capital Costs of Plant
Capital Costs PFD 2 Tower 1
Vessel $15,000.00 Trays $4,250.00
Condenser $1,000.00 Reflux Drum $1,200.00
Reboiler $1,100.00 Tower 2
Vessel $120,000.00 Trays $287,000.00
Condenser $10,000.00 Reflux Drum $1,200.00
Reboiler $4,000.00 Tower 3
Vessel $20,000.00 Trays $8,800.00
Condenser $1,000.00 Reflux Drum $1,200.00
Reboiler $1,000.00 Compressor 1
Compressor $90,000.00 Expander
Expander $30,000.00 Membrane 1
Membrane $1,500,000.00 Total $2,096,750.00

Jorge Aguerrevere
Table 2.2 – Operating Costs of Plant
PFD 2 Operating Costs Utility Costs ($/year)
Cooling Water $88,500.00 LP Steam $8,300.00
Liquid Nitrogen $2,574,100.00 Membrane Replacement $40,000.00
Electricity $8,500.00 Total $2,719,400.00
Ten-Year Expense Projections
10-year expenses: $2,116,750.00 + 10 x (2,719,400.00) = $29,290,750.00
Jorge Aguerrevere
Appendix VIII – Explanation of New Size and Cost Estimations
Compressor and Expander:
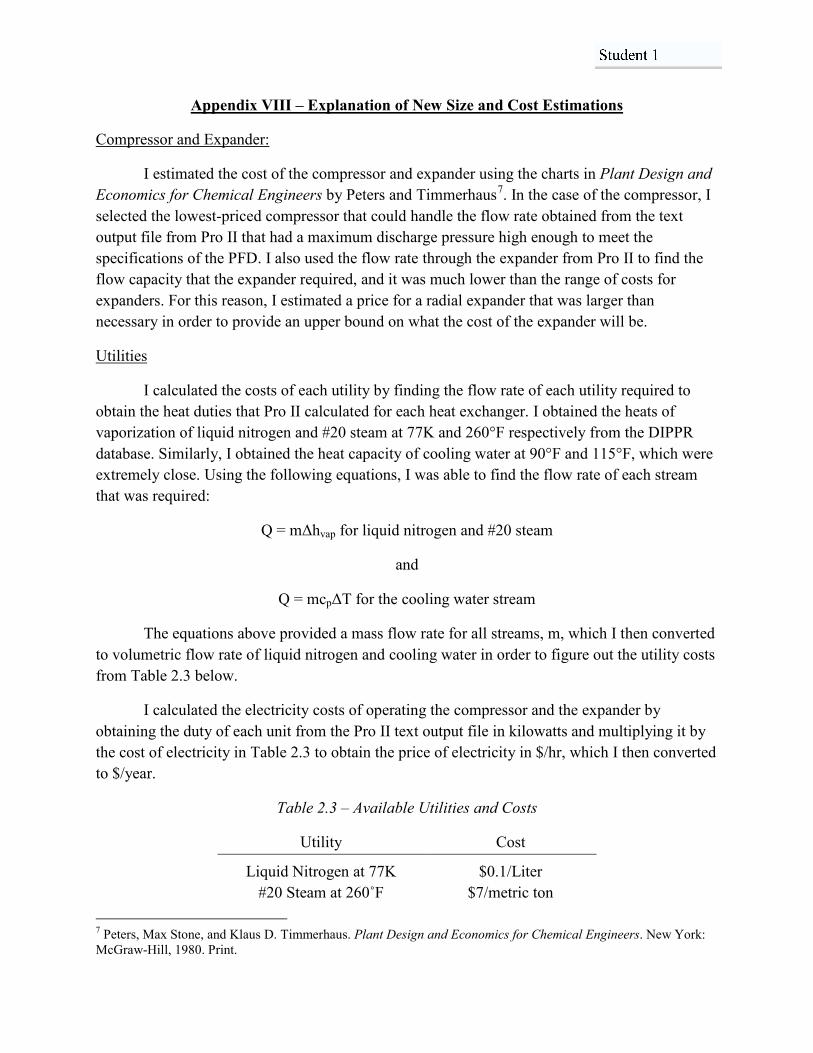
I estimated the cost of the compressor and expander using the charts in Plant Design and Economics for Chemical Engineers by Peters and Timmerhaus7. In the case of the compressor, I selected the lowest-priced compressor that could handle the flow rate obtained from the text output file from Pro II that had a maximum discharge pressure high enough to meet the specifications of the PFD. I also used the flow rate through the expander from Pro II to find the flow capacity that the expander required, and it was much lower than the range of costs for expanders. For this reason, I estimated a price for a radial expander that was larger than necessary in order to provide an upper bound on what the cost of the expander will be.
Utilities
I calculated the costs of each utility by finding the flow rate of each utility required to obtain the heat duties that Pro II calculated for each heat exchanger. I obtained the heats of vaporization of liquid nitrogen and #20 steam at 77K and 260°F respectively from the DIPPR database. Similarly, I obtained the heat capacity of cooling water at 90°F and 115°F, which were extremely close. Using the following equations, I was able to find the flow rate of each stream that was required:
4� �PǻKvap for liquid nitrogen and #20 steam
and
Q = mcpǻ7�IRU�WKH�FRROLQJ�ZDWHU�VWUHDP
The equations above provided a mass flow rate for all streams, m, which I then converted to volumetric flow rate of liquid nitrogen and cooling water in order to figure out the utility costs from Table 2.3 below.
I calculated the electricity costs of operating the compressor and the expander by obtaining the duty of each unit from the Pro II text output file in kilowatts and multiplying it by the cost of electricity in Table 2.3 to obtain the price of electricity in $/hr, which I then converted to $/year.
Table 2.3 – Available Utilities and Costs
Utility Cost
Liquid Nitrogen at 77K $0.1/Liter ����6WHDP�DW����Û) $7/metric ton
7 Peters, Max Stone, and Klaus D. Timmerhaus. Plant Design and Economics for Chemical Engineers. New York: McGraw-Hill, 1980. Print.
Jorge Aguerrevere
Cooling Water DW���Û) $0.08/1000 gallons Electricity $0.06/kWh
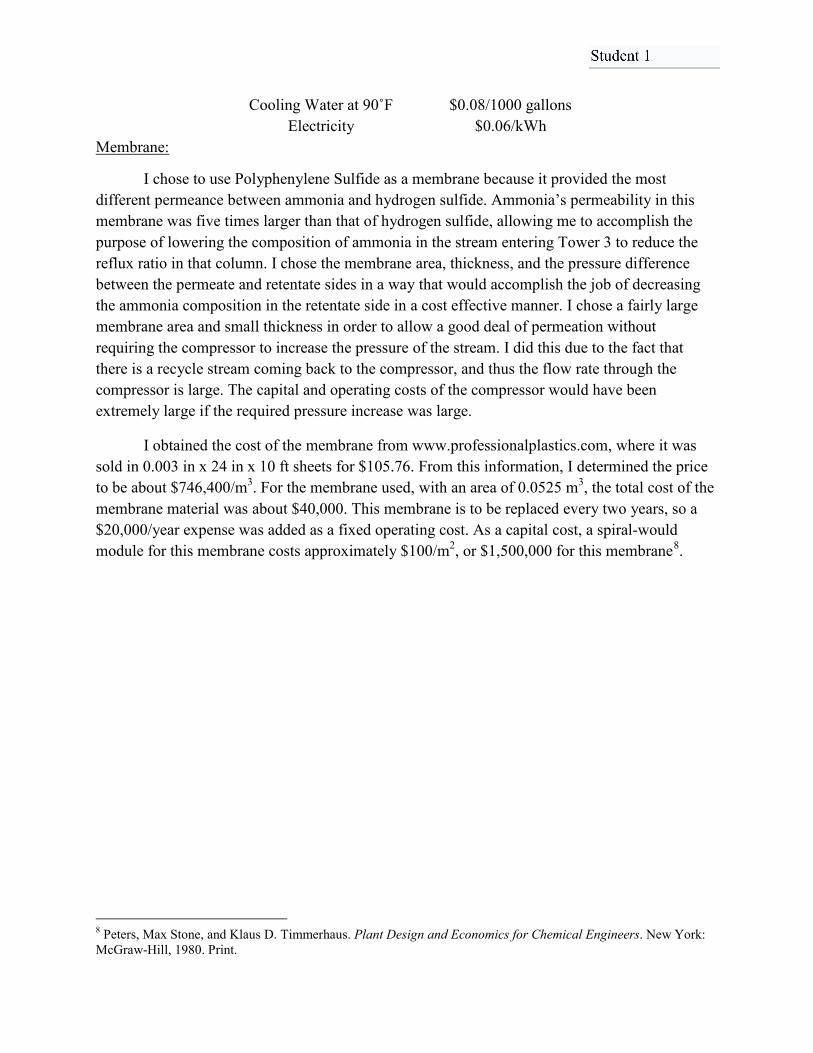
Membrane:
I chose to use Polyphenylene Sulfide as a membrane because it provided the most different permeance between ammonia and hydrogen sulfide. Ammonia’s permeability in this membrane was five times larger than that of hydrogen sulfide, allowing me to accomplish the purpose of lowering the composition of ammonia in the stream entering Tower 3 to reduce the reflux ratio in that column. I chose the membrane area, thickness, and the pressure difference between the permeate and retentate sides in a way that would accomplish the job of decreasing the ammonia composition in the retentate side in a cost effective manner. I chose a fairly large membrane area and small thickness in order to allow a good deal of permeation without requiring the compressor to increase the pressure of the stream. I did this due to the fact that there is a recycle stream coming back to the compressor, and thus the flow rate through the compressor is large. The capital and operating costs of the compressor would have been extremely large if the required pressure increase was large.
I obtained the cost of the membrane from www.professionalplastics.com, where it was sold in 0.003 in x 24 in x 10 ft sheets for $105.76. From this information, I determined the price to be about $746,400/m3. For the membrane used, with an area of 0.0525 m3, the total cost of the membrane material was about $40,000. This membrane is to be replaced every two years, so a $20,000/year expense was added as a fixed operating cost. As a capital cost, a spiral-would module for this membrane costs approximately $100/m2, or $1,500,000 for this membrane8.
8 Peters, Max Stone, and Klaus D. Timmerhaus. Plant Design and Economics for Chemical Engineers. New York: McGraw-Hill, 1980. Print.
Jorge Aguerrevere
Appendix IX – New Hand Calculations to Back Up Pro II
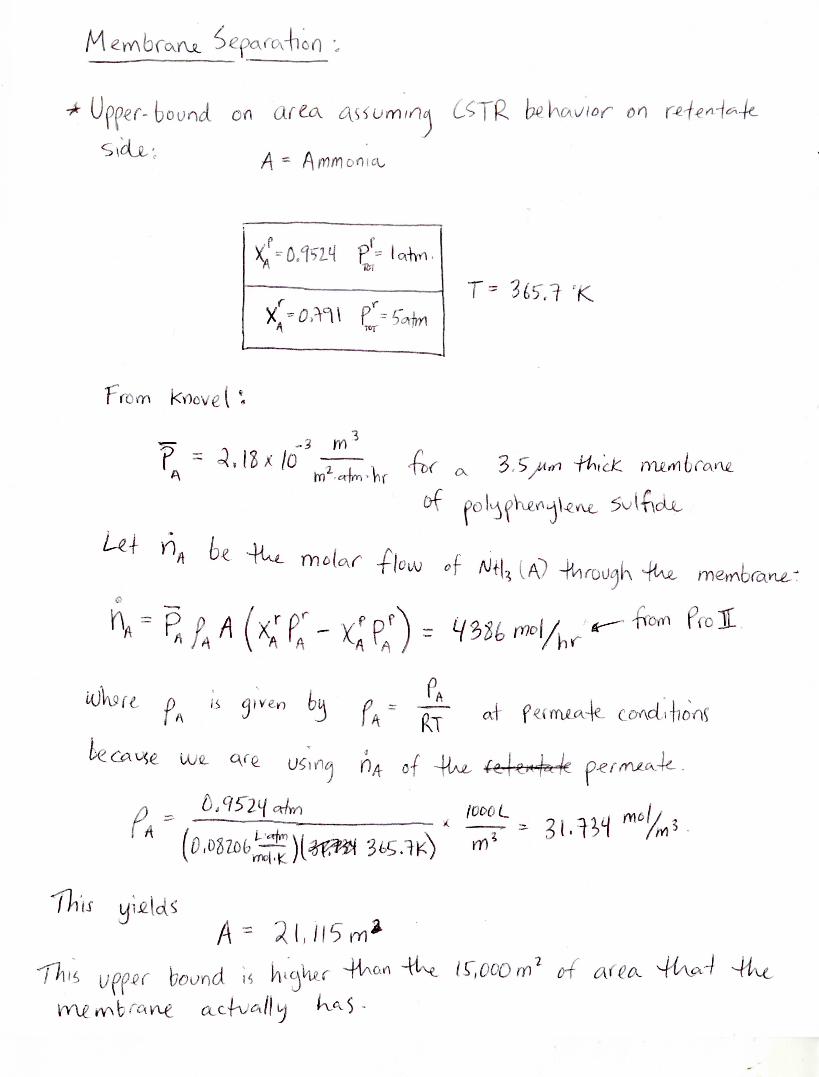
Membrane Unit: CSTR Assumption to Find Upper Bound on Area
See attached calculation.
Tower 3 Updated: McCabe-Thiele Method
See attached graph.
Jorge Aguerrevere
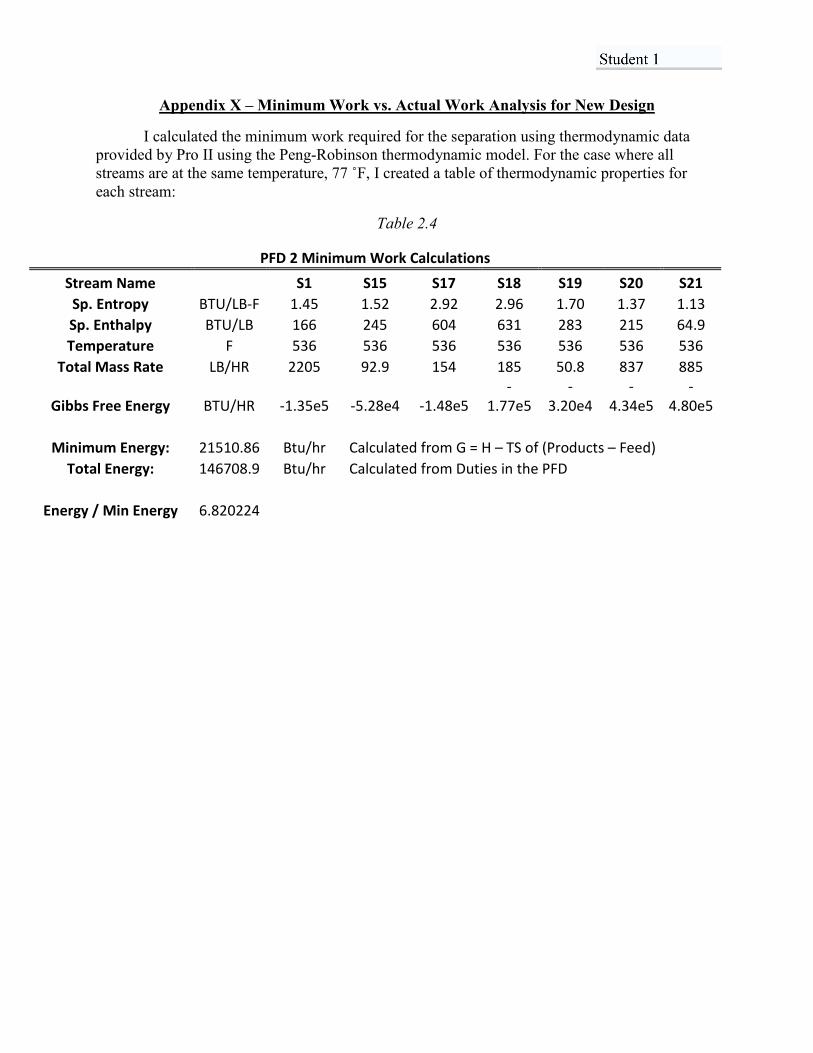
Appendix X – Minimum Work vs. Actual Work Analysis for New Design
I calculated the minimum work required for the separation using thermodynamic data provided by Pro II using the Peng-Robinson thermodynamic model. For the case where all streams are at the same temperature, 77 ÛF, I created a table of thermodynamic properties for each stream:
Table 2.4
PFD 2 Minimum Work Calculations Stream Name
S1 S15 S17 S18 S19 S20 S21
Sp. Entropy BTU/LB-F 1.45 1.52 2.92 2.96 1.70 1.37 1.13 Sp. Enthalpy BTU/LB 166 245 604 631 283 215 64.9 Temperature F 536 536 536 536 536 536 536
Total Mass Rate LB/HR 2205 92.9 154 185 50.8 837 885
Gibbs Free Energy BTU/HR -1.35e5 -5.28e4 -1.48e5 -
1.77e5 -
3.20e4 -
4.34e5 -
4.80e5
Minimum Energy: 21510.86 Btu/hr Calculated from G = H – TS of (Products – Feed) Total Energy: 146708.9 Btu/hr Calculated from Duties in the PFD
Energy / Min Energy 6.820224