membrane perturbation induced by interfacially adsorbed peptides
TRANSCRIPT

Membrane Perturbation Induced by Interfacially Adsorbed Peptides
Assaf Zemel,* Avinoam Ben-Shaul,* and Sylvio Mayy
*Department of Physical Chemistry and the Fritz Haber Research Center, The Hebrew University of Jerusalem, Jerusalem 91904,Israel; and yInstitut fur Molekularbiologie, Friedrich-Schiller-Universitat Jena, 07745 Jena, Germany
ABSTRACT The structural and energetic characteristics of the interaction between interfacially adsorbed (partially inserted)a-helical, amphipathic peptides and the lipid bilayer substrate are studied using a molecular level theory of lipid chain packingin membranes. The peptides are modeled as ‘‘amphipathic cylinders’’ characterized by a well-defined polar angle. Assumingtwo-dimensional nematic order of the adsorbed peptides, the membrane perturbation free energy is evaluated using a cell-likemodel; the peptide axes are parallel to the membrane plane. The elastic and interfacial contributions to the perturbation freeenergy of the ‘‘peptide-dressed’’ membrane are evaluated as a function of: the peptide penetration depth into the bilayer’shydrophobic core, the membrane thickness, the polar angle, and the lipid/peptide ratio. The structural properties calculatedinclude the shape and extent of the distorted (stretched and bent) lipid chains surrounding the adsorbed peptide, and theirorientational (C-H) bond order parameter profiles. The changes in bond order parameters attendant upon peptide adsorptionare in good agreement with magnetic resonance measurements. Also consistent with experiment, our model predicts thatpeptide adsorption results in membrane thinning. Our calculations reveal pronounced, membrane-mediated, attractive in-teractions between the adsorbed peptides, suggesting a possible mechanism for lateral aggregation of membrane-boundpeptides. As a special case of interest, we have also investigated completely hydrophobic peptides, for which we find a strongenergetic preference for the transmembrane (inserted) orientation over the horizontal (adsorbed) orientation.
INTRODUCTION
The broad-spectrum antimicrobial activity of many naturally
occurring a-helical amphipathic peptides such as melittin,
magainins, cecropins, ovispirin, dermaseptins, and others
most likely follows from their strong tendency to adsorb onto
lipid membranes and from their capacity to perforate them
(Hancock et al., 1995; Nicolas and Mor, 1995; Epand and
Vogel, 1999; Yamaguchi et al., 2001). Their activity is not
mediated by specific receptors, but rather correlated with
a number of characteristic structural motifs. Upon binding to
the lipid membrane they fold into an amphipathic a-helixcomprising complementary hydrophobic and hydrophilic
faces. The hydrophilic face typically includes between two
and six cationic charges. Most a-helical antimicrobial
peptides are short, with their length comparable to the
thickness of a lipid bilayer, namely 20–40 A (Bechinger,
1997). Due to their nonspecific (i.e., not receptor-mediated)
interaction with membranes, amphipathic peptides were
suggested as alternatives to conventional antibiotics. This
has initiated numerous experimental studies designed to
uncover the mechanisms of peptide-induced membrane
perforation (Matsuzaki, 1999; Bechinger, 2001; Dathe and
Wieprecht, 1999). For many amphipathic peptides, like those
mentioned above, solid state NMR, oriented circular di-
chroism, and Fourier transform infrared spectroscopy
(Bechinger, 1999), as well as x-ray measurements (Hristova
et al., 2001; White andWimley, 1998) all support the conclu-
sion that below a threshold peptide/lipid ratio of the order of
1:100 (depending on the lipid and the peptide type), the pep-
tides orient horizontally parallel to the lipid membrane inter-
face, with the polar part inserted between the lipid headgroups
and the hydrophobic face buried inside the hydrocarbon core.
At this particular spatial orientation, amphipathic peptides
modulate the physical properties of the host membrane. This
concerns, for example, a decrease of membrane thickness
(Ludtke et al., 1995), modifications of the molecular order
parameter along the lipid chains (Koenig et al., 1999), the
thermotropic phase behavior of the membrane (Jing et al.,
2003), or the peptide’s propensity to alter the preferred bilayer
curvature (Epand, 1997).
Peptide adsorption onto the membrane surface, which is
the subject matter of this study, constitutes an essential first
step in the membrane perforation mechanism. The inter-
facially adsorbed amphipathic peptides that self-assemble
within the membrane plane eventually aggregate into a
‘‘carpet’’ that leads tomembrane solubilization in a detergent-
like mechanism or undergoes a cooperative transition from
the ‘‘horizontal’’ (membrane-parallel) orientation to a ‘‘per-
pendicular’’ (membrane-inserted) state, whereby groups of
several peptides join to form transmembrane pores (Oren and
Shai, 1998; He et al., 1996; Zuckermann and Heimburg,
2001; Zemel et al., 2003).
Notwithstanding the progress in the biophysical charac-
terization of the peptide-dressed membrane, molecular-level
understanding of the structural and energetic characteristics
of the interaction between amphipathic peptides and lipid
membranes is still lacking. To a large extent, this is due to
the complexity of the underlying interactions, namely, the
electrostatic interactions between the peptide’s cationic
SubmittedAugust 21, 2003, and accepted for publicationDecember 18, 2003.
Address reprint requests to Sylvio May, Institut fur Molekularbiologie,
Winzerlaer Strasse 10, 07745 Jena, Germany. Tel.: 49-3641-657582;
E-mail: [email protected].
� 2004 by the Biophysical Society
0006-3495/04/06/3607/13 $2.00 doi: 10.1529/biophysj.103.033605
Biophysical Journal Volume 86 June 2004 3607–3619 3607
residues and the dipolar (or anionic) lipid headgroups, the
desolvation of hydrophobic side chains upon penetration into
the hydrocarbon core of the host membrane, and conforma-
tional changes of the peptide’s backbone, as well as changes
in the packing properties of the lipid chains in the vicinity of
the peptide (White andWimley, 1998). Modeling of peptide-
containing membranes can be helpful in understanding their
structural properties and energetics. For example, molecular
dynamics simulations provide atomic-level information,
typically within timescales of a few up to 100 ns (Shepherd
et al., 2003; Lin and Baumgartner, 2000; La Rocca et al.,
1999; Saiz et al., 2002). Often, however, the timescales of
interest, e.g., of peptide self-assembly in the membrane
plane, are much longer. An alternative (and computationally
much less expensive) approach to study membrane-mediated
interactions between peptides is provided by continuum,
membrane elasticity theories. This approach is commonly
applied to transmembrane peptides or proteins (Huang,
1986; Aranda-Espinoza et al., 1996; May and Ben-Shaul,
1999) and has proved to yield useful information for the
interpretation of experimental data (Nielsen et al., 1998;
Harroun et al., 1999). Its application to interfacially adsorbed
peptides requires additional approximations, associated with
the lower symmetry of the problem, reflecting the partial
penetration of the peptides (as compared to transmembrane)
into one monolayer of the membrane (Huang, 1995). Inter-
mediate between the continuum and atomic-level approaches
are molecular-level, mean-field theories of conformational
chain-packing statistics in lipid membranes, (and other, e.g.,
micellar, aggregates of amphiphilic molecules). In the past,
a theory of this kind has been employed to describe in detail
the conformational properties of lipid tails in various aggre-
gation geometries, showing very good agreement with ex-
perimental results pertaining to a variety of single molecule
properties, e.g., orientational bond order parameters of the
lipid tails, as well as thermodynamic membrane charac-
teristics such as the curvature elasticity of lipid bilayers
(Ben-Shaul, 1995). This approach has been extended to lipid-
protein systems, and used to calculate interaction energies
between a lipid bilayer and a membrane-spanning protein
(Fattal and Ben-Shaul, 1993), as well as the membrane-
mediated interaction between transmembrane proteins (May
and Ben-Shaul, 2000).
In this work, we extend and apply this chain-packing theory
to a lipid membrane that contains interfacially adsorbed
amphipathic peptides. That is, we calculate the contribution
of the lipid tails to the membrane-peptide interaction free
energy, as a function of the penetration depth of the peptide
into the membrane. The a-helical peptides are modeled as
cylinder-like rigid molecules that are oriented parallel to the
membrane surface. Their optimal penetration depth is deter-
mined by the balance between the interfacial (hydrophobic)
free energy, which depends on the polar angle (defining the
peptide’s sector spanned by the hydrophilic residues), and the
elastic perturbation free energy of the lipid chains constituting
the hydrophobic core of the host membrane. Our approach
treats the lipid chain packing within the hydrocarbon core of
the membrane in molecular detail; yet, to keep the model
computationally feasible, we have employed two significant
approximations: first, we impose the membrane to be flat,
and second, we assume that the thickness of its hydrophobic
core is uniform throughout, i.e., we allow for global but not
local modulations in membrane thickness. These additional
constraints may result in somewhat higher estimates of the
peptide-dressed membrane free energy. However, they
should not significantly affect the major conclusions of this
study pertaining to three central issues: i), the changes in
molecular packing characteristics of the lipid chains sur-
rounding the adsorbed peptides, e.g., their orientational bond
order parameters; ii), the peptide-induced modifications of
membrane thickness; and iii), the nature of the interaction
potential between the adsorbed peptides. Moreover, to com-
pare our calculationswith experimental results, we shall focus
on the regime of high peptide concentrations where the
average interhelical distances between peptides are not much
larger than the typical decay length of membrane thickness
variations.Membrane elasticity theory predicts that this decay
length is in the nanometer range (Harroun et al., 1999), sug-
gesting that local modulations in membrane thickness at high
peptide concentrations are minor.
THEORY
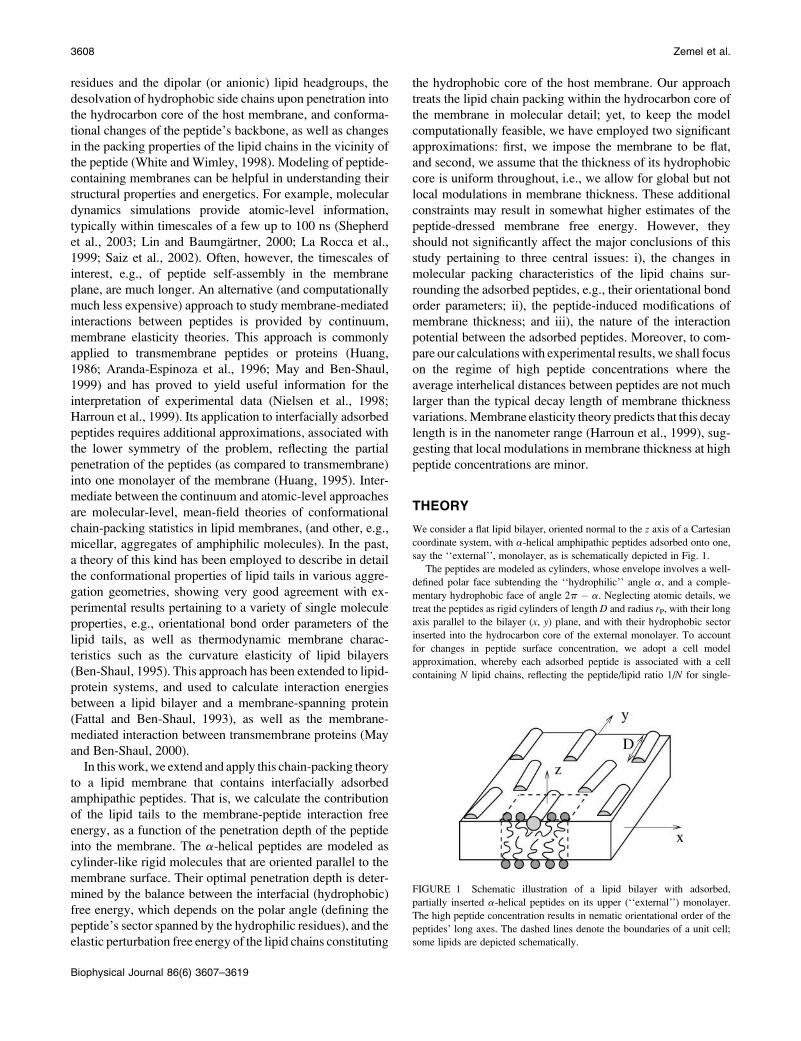
We consider a flat lipid bilayer, oriented normal to the z axis of a Cartesian
coordinate system, with a-helical amphipathic peptides adsorbed onto one,
say the ‘‘external’’, monolayer, as is schematically depicted in Fig. 1.
The peptides are modeled as cylinders, whose envelope involves a well-
defined polar face subtending the ‘‘hydrophilic’’ angle a, and a comple-
mentary hydrophobic face of angle 2p � a. Neglecting atomic details, we
treat the peptides as rigid cylinders of length D and radius rP, with their longaxis parallel to the bilayer (x, y) plane, and with their hydrophobic sector
inserted into the hydrocarbon core of the external monolayer. To account
for changes in peptide surface concentration, we adopt a cell model
approximation, whereby each adsorbed peptide is associated with a cell
containing N lipid chains, reflecting the peptide/lipid ratio 1/N for single-
FIGURE 1 Schematic illustration of a lipid bilayer with adsorbed,
partially inserted a-helical peptides on its upper (‘‘external’’) monolayer.
The high peptide concentration results in nematic orientational order of the
peptides’ long axes. The dashed lines denote the boundaries of a unit cell;
some lipids are depicted schematically.
3608 Zemel et al.
Biophysical Journal 86(6) 3607–3619

tailed lipids. (The corresponding number for the biologically more relevant
double-tailed lipids is 2/N. Yet, below we shall treat all lipid chains on the
same theoretical level so that the distinction between single-tailed and
double-tailed lipids becomes irrelevant. For simplicity, we thus shall focus
on single-tailed lipids.) Denoting the number of lipid chains in the external
monolayer by NE; the corresponding number in the apposed—peptide
free—(‘‘internal’’) monolayer, NI ¼ N � NE, is generally different from NE.
In all the calculations presented below, we shall determine these numbers
assuming that the system has reached complete equilibrium (including lipid
flip-flop between monolayers).
At high peptide concentration, the interhelical distance L is of order of
(possibly even smaller than) the peptide length D. Such a two-dimensional
(2D) fluid of membrane-bound peptides should exhibit a long range 2D
nematic order (roughly) when L falls below D. Based on this notion, we
simplify the definition of our cell model by assuming that all adsorbed
peptides are perfectly aligned along one, say the y (the ‘‘director’’) axis. For
this aligned ensemble of partially inserted peptides, the packing properties of
the lipids will mostly depend on the distances between neighboring peptides
along the x direction, with minor modulation along the y direction due to
modified chain packing around the peptide ends. Neglecting these end
effects renders the packing of the lipid molecules uniform in y direction, an
approximation that we shall adopt in this work. Accordingly, we treat the
membrane properties as translationally invariant along the y direction. The
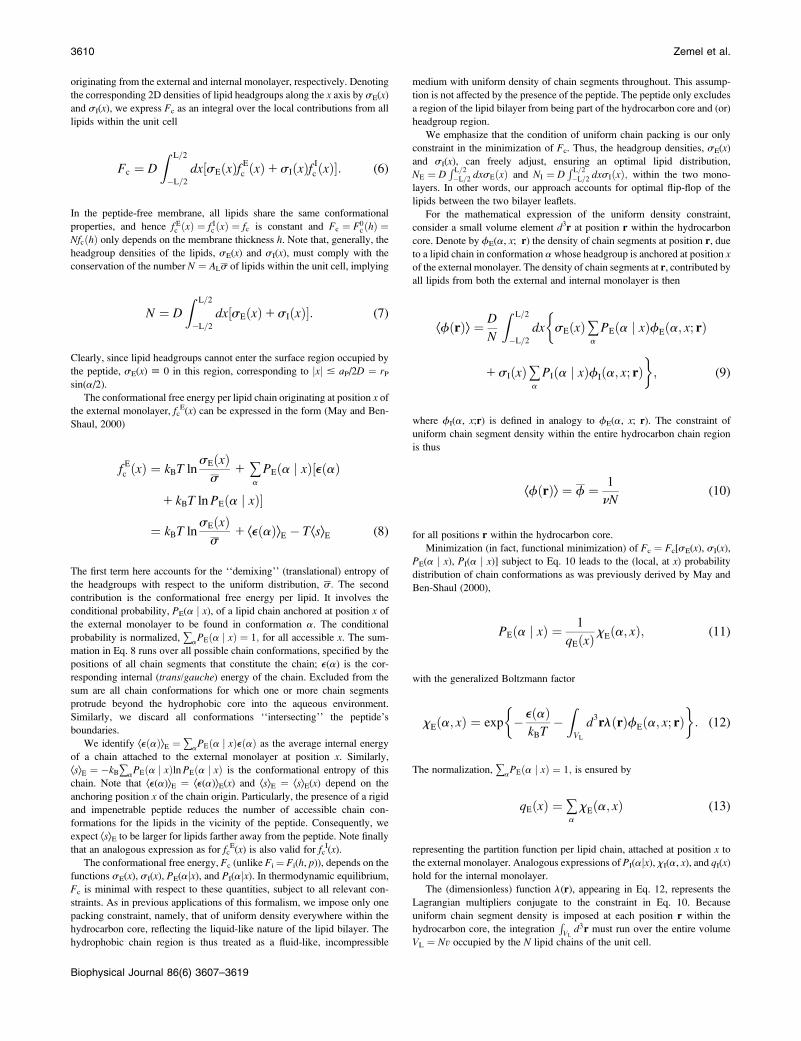
unit cell is a box of dimensions L 3 D 3 h, as depicted in Fig. 2, h
denoting the (uniform) thickness of the hydrophobic core.
Geometrical considerations
The volume
V ¼ LhD ¼ VL 1VP (1)
of the unit cell involves two contributions. The first, VL ¼ Nv, is the volume
occupied by the N lipid tails, each of molecular volume v. In this work we
consider fully saturated hydrocarbon chains of the form �(CH2)13 � CH3,
(or, in short, C-14 chains). Each methylene group, occupying a volume
n � 27 A3, is counted as one ‘‘chain segment’’ whereas the terminal methyl
group is approximately twice as large and will be counted as two chain
segments. The chain volume is thus v � 15 3 n ¼ 405 A3.
The second contribution to V is that of the membrane-inserted part of the
peptide, given by
VP ¼ r2
P
2Dð2p � a1 sinaÞ; (2)
where a is the ‘‘insertion angle’’ defined by the peptide’s sector facing the
aqueous region. Exposing the peptide’s hydrophobic face to the aqueous
phase involves a large energetic penalty of magnitude gPAexp, where Aexp is
the exposed contact area and gP the effective (unfavorable) surface tension
between the peptide’s nonpolar face and the aqueous solution. Although gPmay vary from one peptide to another (as discussed in more detail below; see
Eq. 26), for all reasonable values of gP (gP $ 0.02 kBT/A2), exposing
a significant part of the hydrophobic face to water inflicts an intolerable
energetic penalty. Hence, one can safely assume that, at equilibrium, the
insertion angle coincides with the peptide’s hydrophilic angle, which also
implies that this hydrophilic angle dictates the penetration depth, p, of thepeptide into the hydrophobic core. Explicitly, p¼ rP[11 cos(a/2)] (see Fig.
2). Thus, for fixed lipid/peptide ratio (N), and given peptide geometry (rP and
a), Eq. 1 provides a direct relationship between L and h.
Another important geometric determinant is the contact area, AL, be-
tween the lipid tails and the polar environment. It can be expressed as AL ¼2LD � aP, where
aP ¼ 2rPD sinða=2Þ (3)
is the cross-sectional area of the peptide, measured at the interfacial plane, z
¼ h/2. The quantity AL defines the average cross-sectional area per lipid tail,
aL ¼ AL/N, measured at the membrane interfaces (z ¼ 6h/2). Equivalently,
it defines the average headgroup density of the lipids, s ¼ 1=aL ¼ N=AL
(recall that we consider single-tailed lipids; for double-tailed lipids, s should
be multiplied by 1/2).
The free energy
For any given geometry of the unit cell, as specified by N, p, and h (or,
equivalently, D, L, and h), we write F ¼ F(N, p, h), the free energy per unit
cell (equivalently, per peptide), as a sum of two contributions
F ¼ Fi 1Fc: (4)
The first term, Fi, arises from the (unfavorable) interfacial energy associated
with the exposure of hydrophobic lipid chain segments to the aqueous
environment. As usual, this energy is modeled here using the familiar simple
form,
Fi ¼ NgaL; (5)
where AL ¼ NaL is the overall hydrocarbon-water contact area and g is the
surface tension, which should be on the order of the oil-water interfacial
tension, i.e., g � 0.1 kBT/A2, where kB is Boltzmann’s constant and T the
absolute temperature. Note that the area per lipid chain, aL, depends on both
h and p.
The second contribution, Fc, arises from the peptide-induced perturbation
to the packing properties of the lipid chains within the membrane. In the
presence of a peptide, the conformational free energy of a given lipid chain
depends on its position along the x axis: f Ec ¼ f Ec ðxÞ and f Ic ¼ f Ic ðxÞ for lipids
FIGURE 2 Schematic illustration of a lipid bilayer section (the ‘‘unit
cell’’) containing one, partially inserted, amphipathic peptide. The depth of
insertion p defines the insertion angle a corresponding to the peptide sector
facing the aqueous environment. In general, this angle is equal to the
peptide’s polar angle. The (average) interaxial distance between neighboring
peptides is L. Note that the thickness of the membrane’s hydrocarbon core,
h, is assumed to be constant throughout the membrane. Some lipids are
depicted schematically.
Peptide-Induced Membrane Perturbation 3609
Biophysical Journal 86(6) 3607–3619
originating from the external and internal monolayer, respectively. Denoting
the corresponding 2D densities of lipid headgroups along the x axis by sE(x)
and sI(x), we express Fc as an integral over the local contributions from all
lipids within the unit cell
Fc ¼ D
Z L=2
�L=2
dx½sEðxÞf Ec ðxÞ1sIðxÞf Ic ðxÞ�: (6)
In the peptide-free membrane, all lipids share the same conformational
properties, and hence f Ec ðxÞ ¼ f Ic ðxÞ ¼ fc is constant and Fc ¼ F0cðhÞ ¼
NfcðhÞ only depends on the membrane thickness h. Note that, generally, the
headgroup densities of the lipids, sE(x) and sI(x), must comply with the
conservation of the number N ¼ ALs of lipids within the unit cell, implying
N ¼ D
Z L=2
�L=2
dx½sEðxÞ1sIðxÞ�: (7)
Clearly, since lipid headgroups cannot enter the surface region occupied by
the peptide, sE(x) [ 0 in this region, corresponding to jxj # aP/2D ¼ rPsin(a/2).
The conformational free energy per lipid chain originating at position x of
the external monolayer, fcE(x) can be expressed in the form (May and Ben-
Shaul, 2000)
fE
c ðxÞ ¼ kBT lnsEðxÞs
1 +a
PEða j xÞ½eðaÞ
1 kBT lnPEða j xÞ�
¼ kBT lnsEðxÞs
1 ÆeðaÞæE � TÆsæE (8)
The first term here accounts for the ‘‘demixing’’ (translational) entropy of
the headgroups with respect to the uniform distribution, s: The second
contribution is the conformational free energy per lipid. It involves the
conditional probability, PE(a j x), of a lipid chain anchored at position x of
the external monolayer to be found in conformation a. The conditional
probability is normalized, +aPEða j xÞ ¼ 1; for all accessible x. The sum-
mation in Eq. 8 runs over all possible chain conformations, specified by the
positions of all chain segments that constitute the chain; e(a) is the cor-
responding internal (trans/gauche) energy of the chain. Excluded from the
sum are all chain conformations for which one or more chain segments
protrude beyond the hydrophobic core into the aqueous environment.
Similarly, we discard all conformations ‘‘intersecting’’ the peptide’s
boundaries.
We identify ÆeðaÞæE ¼ +aPEða j xÞeðaÞ as the average internal energy
of a chain attached to the external monolayer at position x. Similarly,
ÆsæE ¼ �kB+aPEða j xÞlnPEða j xÞ is the conformational entropy of this
chain. Note that Æe(a)æE ¼ Æe(a)æE(x) and ÆsæE ¼ ÆsæE(x) depend on the
anchoring position x of the chain origin. Particularly, the presence of a rigid
and impenetrable peptide reduces the number of accessible chain con-
formations for the lipids in the vicinity of the peptide. Consequently, we
expect ÆsæE to be larger for lipids farther away from the peptide. Note finally
that an analogous expression as for fcE(x) is also valid for fc
I(x).
The conformational free energy, Fc (unlike Fi ¼ Fi(h, p)), depends on thefunctions sE(x), sI(x), PE(ajx), and PI(ajx). In thermodynamic equilibrium,
Fc is minimal with respect to these quantities, subject to all relevant con-
straints. As in previous applications of this formalism, we impose only one
packing constraint, namely, that of uniform density everywhere within the
hydrocarbon core, reflecting the liquid-like nature of the lipid bilayer. The
hydrophobic chain region is thus treated as a fluid-like, incompressible
medium with uniform density of chain segments throughout. This assump-
tion is not affected by the presence of the peptide. The peptide only excludes
a region of the lipid bilayer from being part of the hydrocarbon core and (or)
headgroup region.
We emphasize that the condition of uniform chain packing is our only
constraint in the minimization of Fc. Thus, the headgroup densities, sE(x)
and sI(x), can freely adjust, ensuring an optimal lipid distribution,
NE ¼ DR L=2
�L=2 dxsEðxÞ and NI ¼ DR L=2
�L=2 dxsIðxÞ; within the two mono-
layers. In other words, our approach accounts for optimal flip-flop of the
lipids between the two bilayer leaflets.
For the mathematical expression of the uniform density constraint,
consider a small volume element d3r at position r within the hydrocarbon
core. Denote by fE(a, x; r) the density of chain segments at position r, dueto a lipid chain in conformation a whose headgroup is anchored at position x
of the external monolayer. The density of chain segments at r, contributed byall lipids from both the external and internal monolayer is then
ÆfðrÞæ ¼ D
N
Z L=2
�L=2
dx sEðxÞ+a
PEða j xÞfEða; x; rÞ�
1sIðxÞ+a
PIða j xÞfIða; x; rÞ�; (9)
where fI(a, x;r) is defined in analogy to fE(a, x; r). The constraint of
uniform chain segment density within the entire hydrocarbon chain region
is thus
ÆfðrÞæ ¼ f ¼ 1
nN(10)
for all positions r within the hydrocarbon core.
Minimization (in fact, functional minimization) of Fc ¼ Fc[sE(x), sI(x),PE(a j x), PI(a j x)] subject to Eq. 10 leads to the (local, at x) probability
distribution of chain conformations as was previously derived by May and
Ben-Shaul (2000),
PEða j xÞ ¼ 1
qEðxÞ xEða; xÞ; (11)
with the generalized Boltzmann factor
xEða; xÞ ¼ exp � eðaÞkBT
�ZVL
d3rlðrÞfEða; x; rÞ
� �: (12)
The normalization, +aPEða j xÞ ¼ 1; is ensured by
qEðxÞ ¼ +a
xEða; xÞ (13)
representing the partition function per lipid chain, attached at position x to
the external monolayer. Analogous expressions of PI(ajx), xI(a, x), and qI(x)hold for the internal monolayer.
The (dimensionless) function l(r), appearing in Eq. 12, represents the
Lagrangian multipliers conjugate to the constraint in Eq. 10. Because
uniform chain segment density is imposed at each position r within the
hydrocarbon core, the integrationRVL
d3r must run over the entire volume
VL ¼ Nv occupied by the N lipid chains of the unit cell.
3610 Zemel et al.
Biophysical Journal 86(6) 3607–3619
Minimization of Fc also leads to the equilibrium headgroup distributions
sEðxÞ ¼ sqEðxÞq
; sIðxÞ ¼ sqIðxÞq
(14)
with
q ¼ sD
N
Z L=2
�L=2
dx½qEðxÞ1 qIðxÞ� (15)
representing the partition function of the entire unit cell of the lipid bilayer.
Again, the partition function ensures proper normalization: inserting Eqs. 14
into Eq. 15 recovers Eq. 7.
Calculation of the chain conformational properties, specified by PE(ajx)and PI(ajx), and of the headgroup densities, sE(x) and sI(x), requires the
determination of the Lagrangian multipliers, l(r), at each point within the
volume, VL, of the hydrocarbon core. The function l(r) is obtained by
solving the self-consistency equations
0 ¼Z L=2
�L=2
dx +a
xEða; xÞ½fEða; x; rÞ � f��
1 +a
xIða; xÞ½fIða; x; rÞ � f��; (16)
which are obtained by inserting PE(ajx), PI(ajx), sE(x), and sI(x) (see Eq. 11
and Eqs. 14) into the constraint ÆfðrÞæ ¼ f (see Eq. 10) with the average
Æf(r)æ defined in Eq. 9.
The self-consistency equations are a coupled set of transcendental
equations for the function l(r) at all points r that are enclosed within VL. The
numerical procedure, employed to solve Eqs. 16, is based on a discretization
scheme and has been described in previous work (May and Ben-Shaul,
2000).
Once l(r) is known, we can calculate the conformational free energy, Fc,
of the membrane per peptide. Introducing the expressions for PE(a j x),PI(a j x), sE(x), and sI(x) into Fc, we arrive (after some algebra) at
Fc
NkBT¼ �ln q� f
ZVL
d3rlðrÞ: (17)
A convenient reference state for calculating the free energy is the peptide-
free bilayer. In this case, all physical quantities are constant along the x axis
(as they are along the y axis), i.e., qE(x)¼ qI(x)¼ q and sEðxÞ ¼ sIðxÞ ¼ s;
etc.; and the Lagrangian parameters, lðrÞ/lðzÞ; depend only on the normal
direction (the z direction) of the membrane. As already mentioned above, the
corresponding free energy then depends only on the membrane thickness, h,
and will be denoted by Fc0(h). Similarly, the overall free energy for the
peptide-free membrane (containing N lipids) will be denoted by F0(h).
RESULTS AND DISCUSSION
In this section, we present and discuss the results of cal-
culations pertaining to a number of central conformational
lipid chain properties, as well as the free energies of peptide-
dressed lipid bilayers. In all calculations, we use rP¼ 6 A for
the radius of the cylindrical peptide rod, and D¼ 30 A for its
length. As already mentioned, we shall present all results for
C-14 lipid chains, each of which occupies a volume of v ¼
405 A3 within the hydrophobic core in its liquid state. We
shall use g ¼ 0.08 kBT/A2 for the surface tension corre-
sponding to the hydrocarbon-water interface.
Single-chain properties
The average cross-sectional area per lipid chain (equivalently
per lipid headgroup for single-tailed lipids) in an unperturbed
(peptide-free) bilayer is typically in the range aL ¼ 30 – 35
A2; for concreteness, we choose aL ¼ 31.2 A2, implying
a thickness h* ¼ 2 v/aL ¼ 26 A of the hydrocarbon core.
Consider now a peptide-containing membrane with lipid/
peptide ratio N ¼ 80 (or, equivalently, N ¼ 40 for double-
chained lipids). This choice is motivated by recent ex-
perimental investigations in which similar lipid/peptide
ratios were used (Koenig et al., 1999; Ludtke et al., 1995;
Chen et al., 2003). The extension, L, of the corresponding
unit cell along the x axis is L ¼ (vN 1 VP)/(hD) (see Eq. 1).For example, the specific choice h ¼ h* ¼ 26 A and a ¼ presults in (see Eq. 2) VP ¼ pr2PD=2 and thus L ¼ 44 A.
Hence, our choice N ¼ 80 is representative for high peptide
concentrations because the interhelical distance compares
with the peptide length and with the perturbation decay
length as illustrated in Fig. 4 below. We note, however,
that even higher peptide concentrations with 1/N � 1/10
are commonly used in solid-state NMR investigations
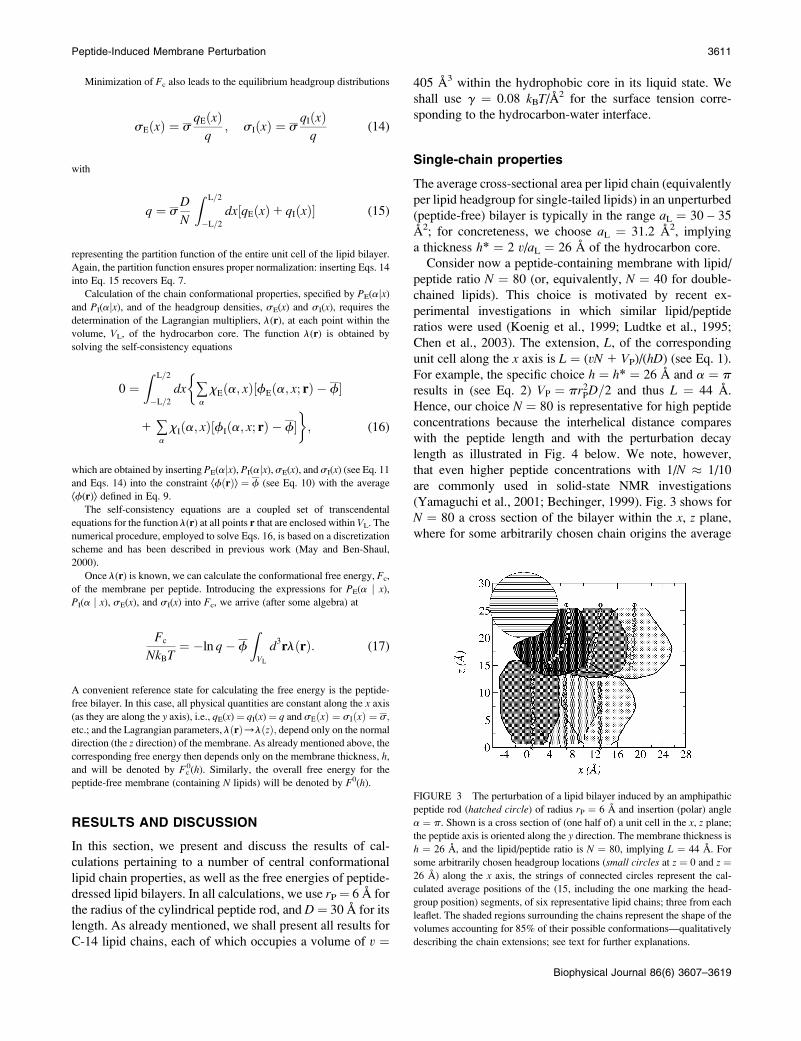
(Yamaguchi et al., 2001; Bechinger, 1999). Fig. 3 shows for
N ¼ 80 a cross section of the bilayer within the x, z plane,where for some arbitrarily chosen chain origins the average
FIGURE 3 The perturbation of a lipid bilayer induced by an amphipathic
peptide rod (hatched circle) of radius rP ¼ 6 A and insertion (polar) angle
a ¼ p. Shown is a cross section of (one half of) a unit cell in the x, z plane;the peptide axis is oriented along the y direction. The membrane thickness is
h ¼ 26 A, and the lipid/peptide ratio is N ¼ 80, implying L ¼ 44 A. For
some arbitrarily chosen headgroup locations (small circles at z ¼ 0 and z ¼26 A) along the x axis, the strings of connected circles represent the cal-
culated average positions of the (15, including the one marking the head-
group position) segments, of six representative lipid chains; three from each
leaflet. The shaded regions surrounding the chains represent the shape of the
volumes accounting for 85% of their possible conformations—qualitatively
describing the chain extensions; see text for further explanations.
Peptide-Induced Membrane Perturbation 3611
Biophysical Journal 86(6) 3607–3619
positions of the chain segments are displayed; 15 per chain,
corresponding to C-14 chains, with the first segment denoting
the headgroup position. Also shown are—for the same chain
origins x—the regions (shaded areas) within which the
corresponding lipid chain is found with a probability of 85%.
The calculation of this probability is based on the probability
density, PcEðr j xÞ; of a lipid chain attached at position x to the
external monolayer
Pc
Eðr j xÞ ¼n
v+a
PEða j xÞfEða; x; rÞ; (18)
where we recall that v/n ¼ 15 is the number of segments per
chain, (with the volume taken up by a CH3 counting as twice
the volume per CH2 group, n). Similar considerations apply
for the internal monolayer. For each position, x, at the
hydrocarbon interface, the probability density, PcEðr j xÞ;
fulfills the normalization condition
ZVL
Pc
Eðr j xÞd3r ¼ 1: (19)
The shaded areas in Fig. 3 enclose a volume VLc whose
boundary points fulfill PcEðr j xÞ ¼ const; and for whichR
VcL
PcEðr j xÞd3r ¼ 0:856 0:02:
Clearly, and as illustrated in Fig. 3, those chains in
immediate vicinity of the peptide must bend strongly to fill up
the hydrophobic core region ‘‘under’’ the adsorbed peptide.
Yet, lipid chains attached to the apposed (the internal)
monolayer are also affected by the presence of the peptide. In
fact, those chains opposite to the peptide ðj x j &10AÞ are
significantly stretched (on average) to help fill up the space
just under the peptide rod. Bending and stretching of the lipid
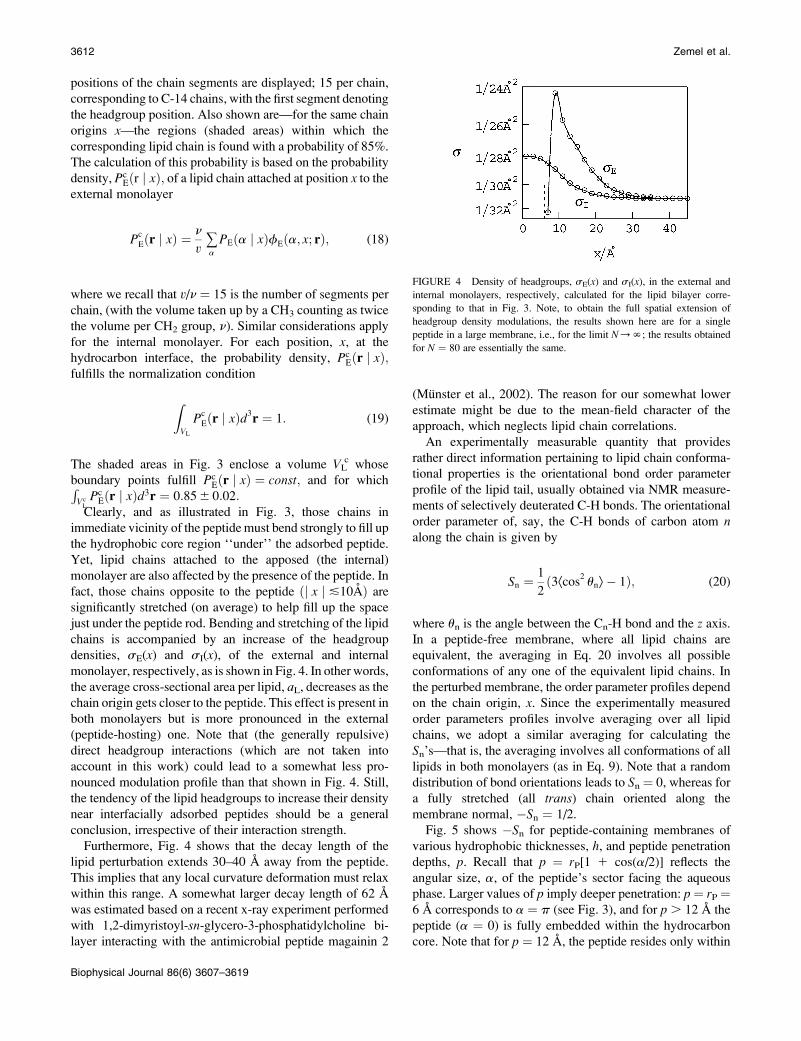
chains is accompanied by an increase of the headgroup
densities, sE(x) and sI(x), of the external and internal
monolayer, respectively, as is shown in Fig. 4. In other words,
the average cross-sectional area per lipid, aL, decreases as thechain origin gets closer to the peptide. This effect is present in
both monolayers but is more pronounced in the external
(peptide-hosting) one. Note that (the generally repulsive)
direct headgroup interactions (which are not taken into
account in this work) could lead to a somewhat less pro-
nounced modulation profile than that shown in Fig. 4. Still,
the tendency of the lipid headgroups to increase their density
near interfacially adsorbed peptides should be a general
conclusion, irrespective of their interaction strength.
Furthermore, Fig. 4 shows that the decay length of the
lipid perturbation extends 30–40 A away from the peptide.
This implies that any local curvature deformation must relax
within this range. A somewhat larger decay length of 62 A
was estimated based on a recent x-ray experiment performed
with 1,2-dimyristoyl-sn-glycero-3-phosphatidylcholine bi-
layer interacting with the antimicrobial peptide magainin 2
(Munster et al., 2002). The reason for our somewhat lower
estimate might be due to the mean-field character of the
approach, which neglects lipid chain correlations.
An experimentally measurable quantity that provides
rather direct information pertaining to lipid chain conforma-
tional properties is the orientational bond order parameter
profile of the lipid tail, usually obtained via NMR measure-
ments of selectively deuterated C-H bonds. The orientational
order parameter of, say, the C-H bonds of carbon atom nalong the chain is given by
Sn ¼ 1
2ð3Æcos2 unæ� 1Þ; (20)
where un is the angle between the Cn-H bond and the z axis.In a peptide-free membrane, where all lipid chains are
equivalent, the averaging in Eq. 20 involves all possible
conformations of any one of the equivalent lipid chains. In
the perturbed membrane, the order parameter profiles depend
on the chain origin, x. Since the experimentally measured
order parameters profiles involve averaging over all lipid
chains, we adopt a similar averaging for calculating the
Sn’s—that is, the averaging involves all conformations of all
lipids in both monolayers (as in Eq. 9). Note that a random
distribution of bond orientations leads to Sn ¼ 0, whereas for
a fully stretched (all trans) chain oriented along the
membrane normal, �Sn ¼ 1/2.
Fig. 5 shows �Sn for peptide-containing membranes of
various hydrophobic thicknesses, h, and peptide penetration
depths, p. Recall that p ¼ rP[1 1 cos(a/2)] reflects the
angular size, a, of the peptide’s sector facing the aqueous
phase. Larger values of p imply deeper penetration: p¼ rP ¼6 A corresponds to a ¼ p (see Fig. 3), and for p . 12 A the
peptide (a ¼ 0) is fully embedded within the hydrocarbon
core. Note that for p ¼ 12 A, the peptide resides only within
FIGURE 4 Density of headgroups, sE(x) and sI(x), in the external and
internal monolayers, respectively, calculated for the lipid bilayer corre-
sponding to that in Fig. 3. Note, to obtain the full spatial extension of
headgroup density modulations, the results shown here are for a single
peptide in a large membrane, i.e., for the limit N/N; the results obtained
for N ¼ 80 are essentially the same.
3612 Zemel et al.
Biophysical Journal 86(6) 3607–3619

one (namely the external) monolayer, just tangent to the
upper hydrocarbon-water interface, whereas for p ¼ h/2 1rP, its center is at the bilayer’s midplane. Fig. 5 compares
�Sn for different peptide penetration depth; p ¼ 6 A (solidcurve with open circles), p ¼ 14 A (arrowheads), and p ¼20 A (stars), with corresponding thickness h ¼ h* ¼ 26 A
of the hydrocarbon core. For comparison, we also show the
C-H bond order profile of the peptide-free membrane, Sn ¼Sn0, membrane (dashed curve). The peptide-induced change
in the C-H bond order parameter
nSn ¼ Sn � S0
n (21)
is shown in the inset of Fig. 5: p¼ 6 A increases the order of
the chain (nSn . 0), p ¼ 14 A leaves it unaffected (nSn �0), and p ¼ 20 A disorders the lipid tails (nSn , 0).
The peptide-dressed membrane can lower its free energy
by adjusting the thickness, h, of its hydrocarbon core.
Analyzing the possibility of membrane thickness variations,
more specifically the peptide-induced membrane thinning, is
one of the main goals of this work. Fig. 5 shows for p ¼ 6 A
(curves with open circles and diamonds) how membrane
thinning from h ¼ 26 A to h ¼ 24 A affects Sn and nSn.Clearly, even a change in membrane thickness as small as 1
A per monolayer thoroughly affects Sn. Particularly, for h ¼24 A, those chain segments in the middle of the chain exhibit
less orientational order than in an unperturbed membrane,
whereas the segments near the headgroups and near the chain
ends are marginally affected. Qualitatively the same
behavior—including a peptide-induced thinning of the chain
region of roughly h* � h& 1 A—has been observed exper-
imentally by Koenig et al. (1999), based on deuterium order
parameter profiles for membrane-bound amphipathic peptide
fragments of the envelope protein of human immunodefi-
ciency virus Type I (HIV-1). Comparable results have also
been obtained in a recent molecular dynamics simulation of
two antimicrobial peptides in the presence of a lipid bilayer,
(Shepherd et al., 2003). Membrane thickness and chain order
parameters are seen to decrease as the peptide penetrates
into the membrane. The order parameter profiles plotted for
the last 10 ns (where the peptide already penetrates the
hydrophobic core of the membrane) are in good qualitative
and quantitative agreement with our thermodynamic calcu-
lations.
The C-H bond order parameters, shown in Fig. 5 represent
averages over all lipids within the membrane. That is, all
spatial information is averaged out. Yet, our theoretical ap-
proach also allows us to compute the order parameters for
lipids that reside at specific x positions in either the external
or internal monolayer. In this case, the averaging in Eq. 20 is
carried out as introduced in Eq. 8 for either the external or
internal monolayer.
Fig. 6 shows �Sn for those lipids that are displayed in Fig.3 (from Fig. 3, we recall p ¼ 6 A and h ¼ h* ¼ 26 A). There
are distinct differences between the chains in the external and
internal monolayer. Those attached close to the peptide at the
external monolayer exhibit nonmonotonic modulations of Sncompared to Sn
0: Chain segments near the headgroup are
more ordered, and chain segments at the methyl end are less
ordered compared to an unperturbed lipid tail (dashed curvesin Figs. 5 and 6). The former is a manifestation of the rigidity
of the peptide backbone, and the latter reflects the bending of
the lipid tails needed to fill the space below the membrane-
penetrating peptide face. On the other hand, lipids ori-
FIGURE 5 Calculated C-H bond order parameter, �Sn, for various
hydrophobic thicknesses h and peptide penetration depths p. The different
curves refer to h ¼ 26 A, p ¼ 6 A (s); h ¼ 26 A, p ¼ 14 A (9); h ¼ 24 A,
p ¼ 6 A ()); and h ¼ 26 A, p ¼ 20 A (w). The values Sn ¼ Sn0, for an
unperturbed (peptide-free) bilayer of hydrophobic thickness h ¼ h* ¼ 26 A,
are indicated by the dashed line. The inset shows the corresponding
differences in order parameter, nSn ¼ Sn � S0n; relative to the unperturbed,
peptide-free bilayer.
FIGURE 6 C-H bond order parameters, �Sn, calculated for lipid chains
residing at positions x¼ 1 A (9), x¼ 7 A (s), x¼ 13 A ()), and x¼ 19 A
(w). As a comparison, the dashed lines show � Sn for an unperturbed lipid
layer. The calculation was performed for p¼ 6 A and h¼ h*¼ 26 A; the left
and right panels refer to the external and internal monolayer, respectively.
Note that the selected x positions in each monolayer match those for which
the chains are displayed in Fig. 3.
Peptide-Induced Membrane Perturbation 3613
Biophysical Journal 86(6) 3607–3619

ginating in the internal monolayer show a monotonic
increase in �Sn everywhere along the chain. The increase
is most pronounced at x � 0 and follows from the peptide-
induced stretching of the chains as evidenced by Fig. 3 and
sI(x) in Fig. 4.
Membrane thinning
Being fluid-like soft materials, lipid membranes are able to
adjust their thickness, h, upon the insertion of rigid peptides
into the hydrocarbon core. The degree of adjustment is
determined by the minimum in free energy F(N, p, h) withrespect to h, for any given peptide insertion depth, p, andlipid/peptide ratio, N. Recall that F consists of two
contributions (see Eq. 4): the interfacial free energy Fi ¼Fi(N, p, h) and the chain conformational free energy Fc ¼Fc(N, p, h). The former, Fi ¼ NgaL, depends on the average
cross-sectional area per lipid chain aL ¼ aL(N, p, h), whichcan be calculated as discussed in the Theory section. Because
we focus on high peptide concentration, we continue to use
N¼ 80 for the lipid/peptide ratio. In the upper panel of Fig. 7,
we show aL as a function of p for different values of h(with 22 A # h # 30 A). If the peptide does not enter into
the hydrocarbon core of the membrane (that is, p# 0) then aL¼ 2 v/h. Upon entry, aL initially decreases and then increases,which reflects the cylinder-like shape of the peptide. For
2 rP # p # h, the peptide is fully inserted and aL ¼2ðv1pr2PD=NÞ=h is constant and higher than for p ¼ 0.
Generally, larger h gives rise to smaller aL. Note also the
symmetry aL(p) ¼ aL(h 1 2rP � p).The second quantity that enters into F is the conforma-
tional free energy of the lipid chains Fc(p, h). (Because N ¼80 is fixed, we omit the argument N from Fc.) In the lower
panel of Fig. 7, we display results of our numerical cal-
culations for the average conformational free energy per lipid
chain
4Fcðp; hÞN
¼ Fcðp; hÞ � F0
cðh*ÞN
(22)
measured with respect to an unperturbed (peptide-free)
membrane of thickness h¼ h*¼ 26 A, as a function of p fordifferent values of h. The definition of the reference energy,
F0cðh*Þ, implies nFc(p ¼ 0, h ¼ h*)/N ¼ 0. Note that the
behavior of nFc(p, h) is somewhat opposite to that of aL(p,h). Increasing the membrane thickness, h, induces the lipid
chains to be more stretched on average; the corresponding
loss of conformational freedom implies higher conforma-
tional free energy. In addition to that, upon entry of the
peptide into the hydrocarbon core,nFc(p) initially increasesand then decreases. The maximal conformational perturba-
tion of the lipid bilayer is found for p � rP, where half of thepeptide body is inserted into the host membrane. This case
involves a particularly drastic energy penalty for membranes
of large thickness, h. No such increase in nFc is found for
fully inserted peptides (2rP # p # h) or for thin membranes.
Already these considerations suggest that membrane thin-
ning could be a mechanism to avoid the high conformational
energy penalty associated with interfacially associated am-
phipathic peptides.
The two panels in Fig. 7 contain all relevant information
to calculate the free energy per peptide of the membrane,
F(p, h) ¼ NgaL 1 Fc. As for Fc, we shall define an excess
free energy through
nFðp; hÞ ¼ Fðp; hÞ � F0ðh*Þ: (23)
That is, we use as a reference state that of an unperturbed,
peptide-free bilayer with corresponding free energy F0(h*)¼F(p ¼ 0, h ¼ h*). The effective surface tension, g, is chosensuch that the membrane thickness h ¼ h* ¼ 26 A represents
the equilibrium value of an unperturbed, peptide-free bilayer.
In Fig. 8 (the curve marked by open circles), we demonstrate
that this is the case for g ¼ 0.08 kBT/A2 (which is some-
what smaller than the oil-water interfacial tension of �0.12
FIGURE 7 Average cross-sectional area per lipid tail aL (upper panel)and average conformational free energy per lipid tail,nFc(p, h)/N, measured
with respect to an unperturbed (peptide-free) membrane of thickness h ¼h* ¼ 26 A (lower panel). In both panels. the different curves refer to h ¼ 22
A (*), h ¼ 24 A (w), h ¼ 26 A (9), h ¼ 28 A ()), and h ¼ 30 A (s). All
calculations are based on a lipid/peptide ratio of N ¼ 80. The curves are
plotted as a function of the peptide’s penetration depth, p (see Fig. 2),
starting at p ¼ 0 and ending at p ¼ h 1 2rP for which the peptide is
translocated through the whole hydrocarbon core of the bilayer.
3614 Zemel et al.
Biophysical Journal 86(6) 3607–3619
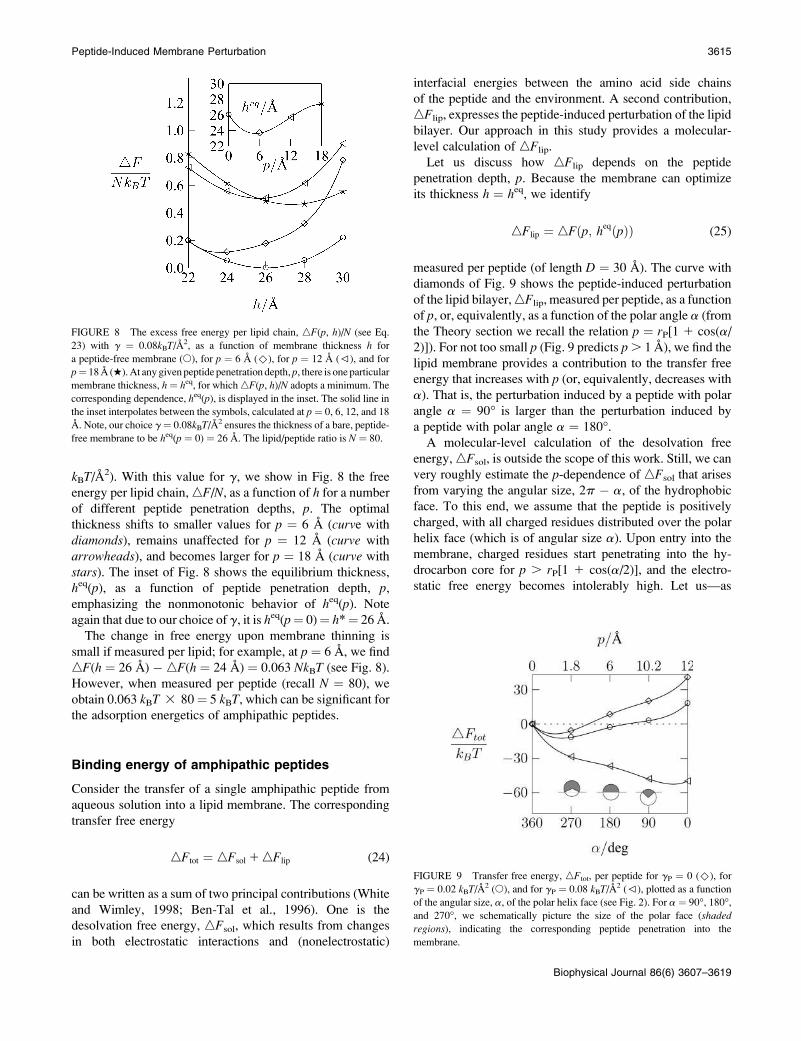
kBT/A2). With this value for g, we show in Fig. 8 the free
energy per lipid chain,nF/N, as a function of h for a number
of different peptide penetration depths, p. The optimal
thickness shifts to smaller values for p ¼ 6 A (curve with
diamonds), remains unaffected for p ¼ 12 A (curve with
arrowheads), and becomes larger for p ¼ 18 A (curve withstars). The inset of Fig. 8 shows the equilibrium thickness,
heq(p), as a function of peptide penetration depth, p,emphasizing the nonmonotonic behavior of heq(p). Note
again that due to our choice of g, it is heq(p¼ 0)¼ h*¼ 26 A.
The change in free energy upon membrane thinning is
small if measured per lipid; for example, at p ¼ 6 A, we find
nF(h ¼ 26 A) � nF(h ¼ 24 A) ¼ 0.063 NkBT (see Fig. 8).
However, when measured per peptide (recall N ¼ 80), we
obtain 0.063 kBT 3 80¼ 5 kBT, which can be significant forthe adsorption energetics of amphipathic peptides.
Binding energy of amphipathic peptides
Consider the transfer of a single amphipathic peptide from
aqueous solution into a lipid membrane. The corresponding
transfer free energy
nFtot ¼ nFsol 1nFlip (24)
can be written as a sum of two principal contributions (White
and Wimley, 1998; Ben-Tal et al., 1996). One is the
desolvation free energy, nFsol, which results from changes
in both electrostatic interactions and (nonelectrostatic)
interfacial energies between the amino acid side chains
of the peptide and the environment. A second contribution,
nFlip, expresses the peptide-induced perturbation of the lipid
bilayer. Our approach in this study provides a molecular-
level calculation of nFlip.
Let us discuss how nFlip depends on the peptide
penetration depth, p. Because the membrane can optimize
its thickness h ¼ heq, we identify
nFlip ¼ nFðp; heqðpÞÞ (25)
measured per peptide (of length D ¼ 30 A). The curve with
diamonds of Fig. 9 shows the peptide-induced perturbation
of the lipid bilayer,nFlip, measured per peptide, as a function
of p, or, equivalently, as a function of the polar angle a (from
the Theory section we recall the relation p ¼ rP[1 1 cos(a/2)]). For not too small p (Fig. 9 predicts p. 1 A), we find the
lipid membrane provides a contribution to the transfer free
energy that increases with p (or, equivalently, decreases witha). That is, the perturbation induced by a peptide with polar
angle a ¼ 90� is larger than the perturbation induced by
a peptide with polar angle a ¼ 180�.A molecular-level calculation of the desolvation free
energy,nFsol, is outside the scope of this work. Still, we can
very roughly estimate the p-dependence of nFsol that arises
from varying the angular size, 2p � a, of the hydrophobic
face. To this end, we assume that the peptide is positively
charged, with all charged residues distributed over the polar
helix face (which is of angular size a). Upon entry into the
membrane, charged residues start penetrating into the hy-
drocarbon core for p . rP[1 1 cos(a/2)], and the electro-
static free energy becomes intolerably high. Let us—as
FIGURE 8 The excess free energy per lipid chain, nF(p, h)/N (see Eq.
23) with g ¼ 0.08kBT/A2, as a function of membrane thickness h for
a peptide-free membrane (s), for p ¼ 6 A ()), for p ¼ 12 A (9), and for
p¼ 18 A (w). At any givenpeptide penetration depth,p, there is one particular
membrane thickness, h¼ heq, for whichnF(p, h)/N adopts a minimum. The
corresponding dependence, heq(p), is displayed in the inset. The solid line inthe inset interpolates between the symbols, calculated at p¼ 0, 6, 12, and 18
A. Note, our choice g ¼ 0.08kBT/A2 ensures the thickness of a bare, peptide-
free membrane to be heq(p ¼ 0) ¼ 26 A. The lipid/peptide ratio is N ¼ 80.
FIGURE 9 Transfer free energy, nFtot, per peptide for gP ¼ 0 ()), for
gP ¼ 0.02 kBT/A2 (s), and for gP ¼ 0.08 kBT/A
2 (9), plotted as a function
of the angular size, a, of the polar helix face (see Fig. 2). For a ¼ 90�, 180�,and 270�, we schematically picture the size of the polar face (shaded
regions), indicating the corresponding peptide penetration into the
membrane.
Peptide-Induced Membrane Perturbation 3615
Biophysical Journal 86(6) 3607–3619

a crude approximation—neglect all other electrostatic contrib-
utions that arise from interactions of the lipid headgroups
with the peptide and from solvation effects of the peptide’s
backbone dipoles (for detailed accounts of the solvation free
energies, see, for example, Kessel and Ben-Tal, 2002).
We thus assume that within the range 0 # p # rP[1 1cos(a/2)], the electrostatic energy remains constant. The
remaining (nonelectrostatic) interfacial energy between
the peptide and the aqueous environment is proportional to
the exposed contact area, Aexp ¼ (2p � a)rPD, between the
hydrophobic peptide face and the aqueous environment
nFsol � gPAexp ¼ gPð2p � aÞrPD; (26)
where gP is the corresponding surface tension. The
magnitude of gP depends on the strength of the peptide’s
hydrophobicity. In Fig. 9, we plotnFtot as a function of a for
different values of gP (note that the curve with diamonds is
derived for gP ¼ 0 and thus corresponds to nFlip).
Fig. 9 suggests that for sufficiently small gP, namely,
when the lipid perturbation dominates the interaction, the
transfer free energy decreases with a (or increases with the
penetration depth of the peptide, p). In fact, this finding is in
line with the results of a recent experiment that was designed
to investigate the influence of the polar angle on peptide
adsorption (Wieprecht et al., 1997). The experimentally used
model peptides all had similar structural properties (overall
charge, hydrophobicity, and hydrophobic moment); they
differed in the angle, a, subtended by the positively charged
(and thus polar) helix face. It was found that peptide
adsorption increases with a. Wieprecht et al. (1997) ex-
plained this result by the different interaction strengths
between the hydrophobic faces of the different peptides and
the aqueous environment. Indeed, different hydrophobicities
of the involved amino acids are supposed to affect gP. Ourcomplementary explanation derives from the lipid perturba-
tion, induced by amphipathic peptides that penetrate into the
hydrocarbon core of the lipid host. The corresponding free
energy penalty, nFlip, increases with the penetration depth,
p, of the peptide. Depending on the strength of the
desolvation free energy, nFsol, even the total transfer free
energy, nFtot, may increase with p and thus cause stronger
membrane binding for peptides that penetrate less deeply
into the membrane.
Hydrophobic peptides
For a ¼ 0, the peptide is completely hydrophobic, and the
membrane penetration depth is 2rP, p, h. In this case, Fig.8 predicts a thickening of the membrane rather than thinning
(as for P, 2rp). The increase in h is a direct consequence ofthe additional volume VP occupied by the peptide within the
membrane interior, without affecting the interfacial area
A ¼ AL. The lipid perturbation free energy associated with
fully inserting the hydrophobic peptide into the hydrocarbon
core is shown by the curve with diamonds for a¼ 0 in Fig. 9
(which is derived for gP ¼ 0 and thus nFtot ¼ nF). Itsamount nF(p ¼ 2rP) � 40kBT refers to the lipid’s
conformational free energy cost of inserting the peptide in
horizontal orientation fully into the bilayer, measured relative
to the unperturbed bilayer. Note, however, because the
peptide is entirely hydrophobic, there is no longer a driving
force to keep the peptide in horizontal orientation. Alterna-
tively, it may adopt a vertical, transmembrane orientation to
minimize the perturbation of the lipid bilayer. A trans-
membrane orientation may be particularly favorable if the
length, D, of the peptide roughly matches the thickness, h, ofthe host membrane.
Let us estimate whether transmembrane orientation is
more favorable than horizontal orientation. Assume that the
condition h � D applies. From previous calculations of the
perturbation free energy of rigid (and sufficiently large)
transmembrane inclusions (Fattal and Ben-Shaul, 1993; May
and Ben-Shaul, 2000), we recall a value of �0.3 – 0.4 kBT/1A length of the inclusion circumference. For a cylindrical rod
of radius rP ¼ 6 A in transmembrane orientation, this
amounts tonF¼ 11 – 15 kBT, which is much lower than the
value for horizontal insertion. Even a certain amount of
mismatch between D and h will easily be tolerated. Hence,
our results suggest a strong preference of completely
hydrophobic peptides for transmembrane orientation due to
the generally large lipid perturbation free energy for hori-
zontal insertion.
Recently, a completely hydrophobic ‘‘inert’’ model
peptide, consisting of the helix-promoting leucine and
alanine, was synthesized, and its interaction with lipid
membranes was analyzed by Yano et al. (2002). Most
remarkably, despite the lack of polar ‘‘stabilizing’’ residues
at the ends, the peptide adopted a stable transmembrane
orientation. Clearly, our calculations in this study suggest
that the lipid bilayer provides a sufficiently large energetic
incentive to stabilize the transmembrane orientation of
hydrophobic a-helices.
Peptide concentration effects
So far, all results were derived for a fixed lipid/peptide ratio
of N ¼ 80. We now investigate the membrane properties as
a function of N, which is an experimentally controllable
parameter. To this end, we focus on peptides with angular
size a ¼ p of the polar part. This leads to a peptide
penetration depth of p¼ rP ¼ 6 A. We recall from Fig. 7 that
this choice implies a particularly large conformational free
energy nFc.
According to the numerical scheme described in the
Theory section, we calculate the lipid perturbation free
energy, Fc, for different peptide-peptide distances, L. Forsimplicity, we continue to assume the same geometry of
the unit cell as introduced in the Theory section. That is, the
3616 Zemel et al.
Biophysical Journal 86(6) 3607–3619

peptides form long, orientationally ordered arrays so that
the membrane properties are invariant along the y direction
(see Fig. 1), and the lipid/peptide ratio N relates to L through
(see Eqs. 1 and 2)
N ¼ ðLh� p
2r2
PÞD
v: (27)
Note that Eq. 27 is not valid for L � D; we thus exclude thelimit of small peptide concentrations from our discussion.
In Fig. 10 we show the excess free energy per peptide,
nF, as a function of 1/L for different membrane thicknesses,
h. Note that Fig. 10 focuses on the range 20 , L/A , 100.
For L& 20 A (which corresponds roughly to N ¼ 20), the
peptide-peptide distance falls below the lateral extension of
individual (double chained) lipids. Hence, at such small
interpeptide separations, our continuum-like description of
the lipids along the x axis must fail.
Because of the reference state, only the curve correspond-
ing to h ¼ h* ¼ 26 A in Fig. 10 approaches a finite value in
the low peptide concentration limit where N; L/N: Allother curves, derived for h , h*, exhibit the limiting
behavior 4FðL/NÞ ¼ N; which is a consequence of our
assumption that the membrane thickness, h, is spatially
constant everywhere. Yet, more interesting than the dilute
limit is the intermediate region where L is on the order of D.Here, Fig. 10 clearly shows that membrane thinning lowers
the peptide-induced free energy penalty of the membrane.
The magnitude of the decrease in h depends on L. For eachL there is a thickness heq(L) that minimizesnF. These valuesare displayed in Fig. 10 by the broken line. The broken line
thus corresponds to the minimal excess free energy per
peptide, nF, with the optimization of the membrane
thickness taken into account. The inset (solid line) showsthe corresponding optimal thickness, heq, as a function of
1/N, where the relation between L and N is calculated
according to Eq. 27. The dependence heq(1/N) shows a linearrelation between membrane thickness and peptide/lipid ratio,
1/N.Indeed, a linear decrease of membrane thickness with
increasing peptide concentration has been measured exper-
imentally (He et al., 1996; Ludtke et al., 1995). A simple
rationale of this behavior was given as follows: assume that
NP membrane-associated peptides only increase the inter-
facial area, 2 A ¼ NLaL 1 NPaP, of the bilayer (aL and aP arethe fixed cross-sectional areas per lipid and peptide, re-
spectively, measured at the membrane interface), whereas the
entire hydrocarbon core (of volume V ¼ NLv ¼ Ah) of thebilayer is filled with the tails of NL lipids. In this case,
the optimal membrane thickness
h ¼ heq ¼ 2v
aL
1
11 aP=ðaLNÞ �2v
aL1� 1
N
aPaL
� �(28)
decreases linearly with the peptide/lipid ratio 1/N ¼ NP/NL.
Recall the numerical values aL ¼ 2v/h* ¼ 31.2 A2 and aP ¼2rPD ¼ 360 A2 (valid for p ¼ rP ¼ 6 A). The broken line in
the inset of Fig. 10 shows heq(1/N) according to Eq. 28. The
difference in the two curves of the inset in Fig. 10 reflects the
adjustment of the average cross-sectional area, aL, per lipidchain upon association between membrane and peptide.
Fig. 10 reveals another notable result: The peptide-
induced perturbation free energy, nF, monotonically de-
creases with decreasing distance, L, between the peptides.
Hence, two interfacially adsorbed peptides that are oriented
in parallel experience an attractive, membrane mediated
force. For a peptide length of D ¼ 30 A, the corresponding
gain in free energy can be large compared to kBT (see Fig.
10). Hence, for a sufficiently large concentration of peptides
in the membrane, we expect the separation into peptide-
enriched and peptide-depleted phases. We do not attempt to
calculate a phase diagram; instead we note that the phase
boundaries will be modulated by additional forces that are
not taken into account in the present approach; i.e.,
electrostatic repulsion between the (usually positively)
charged residues of the peptides or the orientational entropy
associated with the elongated (cylinder-like) shape of the
peptides. We also note that the attraction between mem-
brane-adsorbed peptides is expected to be less pronounced if
local thickness modulations of the bilayer are taken into
account (they are neglected in this work). Still, our results in
FIGURE 10 Excess free energy,nF, per peptide rod, as a function of 1/L
for h¼ 18 A (s), h¼ 20 A ()), h¼ 22 A (9), h¼ 24 A (*), and h¼ 26 A
(w). The broken line denotes the minimal value of nF, calculated for
optimal thickness, h ¼ heq(1/L). The corresponding values for the optimal
thickness, heq, are shown in the inset as a function of peptide/lipid ratio, 1/N
(solid line). The relation betweenN and L is given by Eq. 27. The broken line
in the inset shows the prediction for h ¼ heq(1/N) according to Eq. 28 with
aL ¼ 31.2 A2 and aP ¼ 360 A2. All results are derived for a peptide penetra-
tion depth of p ¼ rP ¼ 6 A.
Peptide-Induced Membrane Perturbation 3617
Biophysical Journal 86(6) 3607–3619
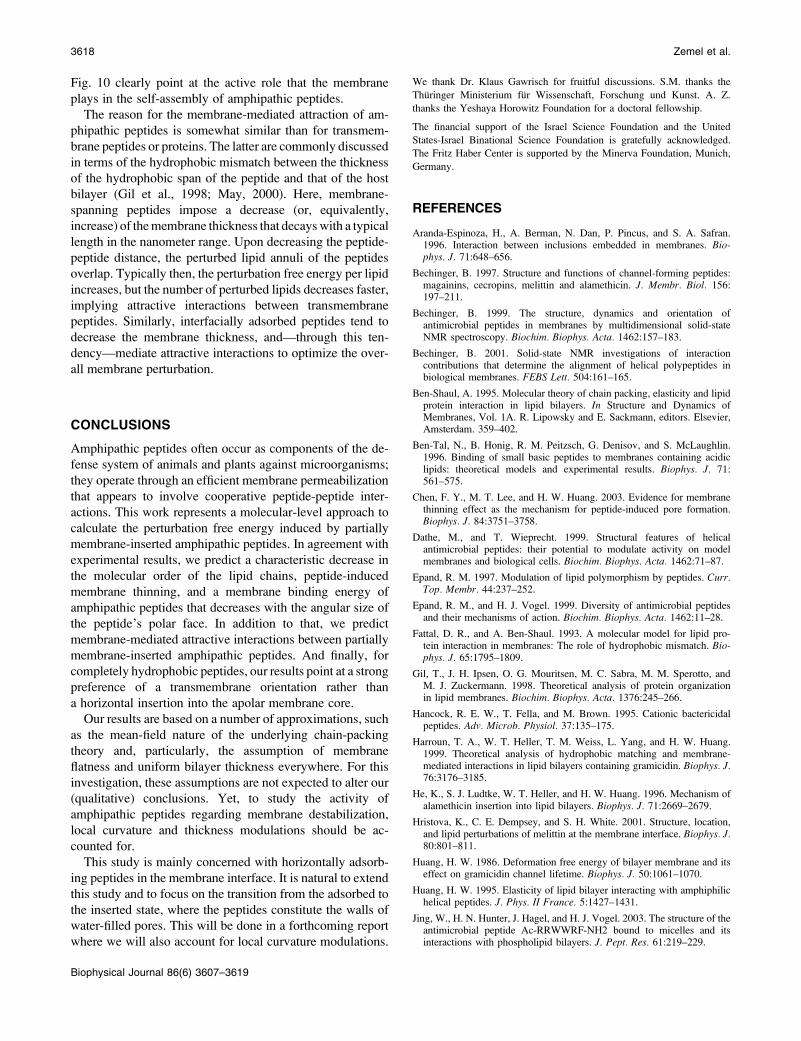
Fig. 10 clearly point at the active role that the membrane
plays in the self-assembly of amphipathic peptides.
The reason for the membrane-mediated attraction of am-
phipathic peptides is somewhat similar than for transmem-
brane peptides or proteins. The latter are commonly discussed
in terms of the hydrophobic mismatch between the thickness
of the hydrophobic span of the peptide and that of the host
bilayer (Gil et al., 1998; May, 2000). Here, membrane-
spanning peptides impose a decrease (or, equivalently,
increase) of themembrane thickness that decays with a typical
length in the nanometer range. Upon decreasing the peptide-
peptide distance, the perturbed lipid annuli of the peptides
overlap. Typically then, the perturbation free energy per lipid
increases, but the number of perturbed lipids decreases faster,
implying attractive interactions between transmembrane
peptides. Similarly, interfacially adsorbed peptides tend to
decrease the membrane thickness, and—through this ten-
dency—mediate attractive interactions to optimize the over-
all membrane perturbation.
CONCLUSIONS
Amphipathic peptides often occur as components of the de-
fense system of animals and plants against microorganisms;
they operate through an efficient membrane permeabilization
that appears to involve cooperative peptide-peptide inter-
actions. This work represents a molecular-level approach to
calculate the perturbation free energy induced by partially
membrane-inserted amphipathic peptides. In agreement with
experimental results, we predict a characteristic decrease in
the molecular order of the lipid chains, peptide-induced
membrane thinning, and a membrane binding energy of
amphipathic peptides that decreases with the angular size of
the peptide’s polar face. In addition to that, we predict
membrane-mediated attractive interactions between partially
membrane-inserted amphipathic peptides. And finally, for
completely hydrophobic peptides, our results point at a strong
preference of a transmembrane orientation rather than
a horizontal insertion into the apolar membrane core.
Our results are based on a number of approximations, such
as the mean-field nature of the underlying chain-packing
theory and, particularly, the assumption of membrane
flatness and uniform bilayer thickness everywhere. For this
investigation, these assumptions are not expected to alter our
(qualitative) conclusions. Yet, to study the activity of
amphipathic peptides regarding membrane destabilization,
local curvature and thickness modulations should be ac-
counted for.
This study is mainly concerned with horizontally adsorb-
ing peptides in the membrane interface. It is natural to extend
this study and to focus on the transition from the adsorbed to
the inserted state, where the peptides constitute the walls of
water-filled pores. This will be done in a forthcoming report
where we will also account for local curvature modulations.
We thank Dr. Klaus Gawrisch for fruitful discussions. S.M. thanks the
Thuringer Ministerium fur Wissenschaft, Forschung und Kunst. A. Z.
thanks the Yeshaya Horowitz Foundation for a doctoral fellowship.
The financial support of the Israel Science Foundation and the United
States-Israel Binational Science Foundation is gratefully acknowledged.
The Fritz Haber Center is supported by the Minerva Foundation, Munich,
Germany.
REFERENCES
Aranda-Espinoza, H., A. Berman, N. Dan, P. Pincus, and S. A. Safran.1996. Interaction between inclusions embedded in membranes. Bio-phys. J. 71:648–656.
Bechinger, B. 1997. Structure and functions of channel-forming peptides:magainins, cecropins, melittin and alamethicin. J. Membr. Biol. 156:197–211.
Bechinger, B. 1999. The structure, dynamics and orientation ofantimicrobial peptides in membranes by multidimensional solid-stateNMR spectroscopy. Biochim. Biophys. Acta. 1462:157–183.
Bechinger, B. 2001. Solid-state NMR investigations of interactioncontributions that determine the alignment of helical polypeptides inbiological membranes. FEBS Lett. 504:161–165.
Ben-Shaul, A. 1995. Molecular theory of chain packing, elasticity and lipidprotein interaction in lipid bilayers. In Structure and Dynamics ofMembranes, Vol. 1A. R. Lipowsky and E. Sackmann, editors. Elsevier,Amsterdam. 359–402.
Ben-Tal, N., B. Honig, R. M. Peitzsch, G. Denisov, and S. McLaughlin.1996. Binding of small basic peptides to membranes containing acidiclipids: theoretical models and experimental results. Biophys. J. 71:561–575.
Chen, F. Y., M. T. Lee, and H. W. Huang. 2003. Evidence for membranethinning effect as the mechanism for peptide-induced pore formation.Biophys. J. 84:3751–3758.
Dathe, M., and T. Wieprecht. 1999. Structural features of helicalantimicrobial peptides: their potential to modulate activity on modelmembranes and biological cells. Biochim. Biophys. Acta. 1462:71–87.
Epand, R. M. 1997. Modulation of lipid polymorphism by peptides. Curr.Top. Membr. 44:237–252.
Epand, R. M., and H. J. Vogel. 1999. Diversity of antimicrobial peptidesand their mechanisms of action. Biochim. Biophys. Acta. 1462:11–28.
Fattal, D. R., and A. Ben-Shaul. 1993. A molecular model for lipid pro-tein interaction in membranes: The role of hydrophobic mismatch. Bio-phys. J. 65:1795–1809.
Gil, T., J. H. Ipsen, O. G. Mouritsen, M. C. Sabra, M. M. Sperotto, andM. J. Zuckermann. 1998. Theoretical analysis of protein organizationin lipid membranes. Biochim. Biophys. Acta. 1376:245–266.
Hancock, R. E. W., T. Fella, and M. Brown. 1995. Cationic bactericidalpeptides. Adv. Microb. Physiol. 37:135–175.
Harroun, T. A., W. T. Heller, T. M. Weiss, L. Yang, and H. W. Huang.1999. Theoretical analysis of hydrophobic matching and membrane-mediated interactions in lipid bilayers containing gramicidin. Biophys. J.76:3176–3185.
He, K., S. J. Ludtke, W. T. Heller, and H. W. Huang. 1996. Mechanism ofalamethicin insertion into lipid bilayers. Biophys. J. 71:2669–2679.
Hristova, K., C. E. Dempsey, and S. H. White. 2001. Structure, location,and lipid perturbations of melittin at the membrane interface. Biophys. J.80:801–811.
Huang, H. W. 1986. Deformation free energy of bilayer membrane and itseffect on gramicidin channel lifetime. Biophys. J. 50:1061–1070.
Huang, H. W. 1995. Elasticity of lipid bilayer interacting with amphiphilichelical peptides. J. Phys. II France. 5:1427–1431.
Jing, W., H. N. Hunter, J. Hagel, and H. J. Vogel. 2003. The structure of theantimicrobial peptide Ac-RRWWRF-NH2 bound to micelles and itsinteractions with phospholipid bilayers. J. Pept. Res. 61:219–229.
3618 Zemel et al.
Biophysical Journal 86(6) 3607–3619

Kessel, A., and N. Ben-Tal. 2002. Free energy determinants of peptideassociation with lipid bilayers. In Current Topics in Membranes: Peptide-Lipid Interactions, Vol. 52. S. Simon and T. McIntosh, editors. AcademicPress, San Diego. 205–253.
Koenig, B. W., J. A. Ferretti, and K. Gawrisch. 1999. Site-specificdeuterium order parameters and membrane-bound behavior of a peptidefragment from the intracellular domain of HIV-1 gp41. Biochemistry.38:6327–6334.
Lin, J.-H., and A. Baumgartner. 2000. Stability of a melittin pore in a lipidbilayer: a molecular dynamics study. Biophys. J. 78:1714–1724.
Ludtke, S. J., K. He, and H. W. Huang. 1995. Membrane thinning causedby magainin 2. Biochemistry. 34:16764–16769.
Matsuzaki, K. 1999. Why and how are peptide-lipid interactions utilized forself-defense? Magainins and tachyplesins as archetypes. Biochim.Biophys. Acta. 1462:1–10.
May, S. 2000. Theories on structural perturbations of lipid bilayers. Curr.Op. Coll. Int. Sci. 5:244–249.
May, S., and A. Ben-Shaul. 1999. Molecular theory of lipid-proteininteraction and the La-HII transition. Biophys. J. 76:751–767.
May, S., and A. Ben-Shaul. 2000. A molecular model for lipid-mediatedinteraction between proteins in membranes. Phys. Chem. Chem. Phys.2:4494–4502.
Munster, C., A. Spaar, B. Bechinger, and T. Salditt. 2002. Magainin 2 inphospholipid bilayers: peptide orientation and lipid chain orderingstudied by x-ray diffraction. Biochim. Biophys. Acta. 1562:37–44.
Nicolas, P., and A. Mor. 1995. Peptides as weapons against micro-organisms in the chemical defense system of vertebrates. Annu. Rev.Microbiol. 49:277–304.
Nielsen, C., M. Goulian, and O. S. Andersen. 1998. Energetics of inclusion-induced bilayer deformations. Biophys. J. 74:1966–1983.
Oren, Z., and Y. Shai. 1998. Mode of action of linear amphipathic alpha-helical antimicrobial peptides. Biopolymers. 47:451–463.
La Rocca, P., P. C. Biggin, D. P. Tieleman, and M. S. P. Sansom. 1999.Simulation studies of the interaction of antimicrobial peptides and lipidbilayers. Biochim. Biophys. Acta. 1462:31–40.
Saiz, L., S. Bandyopadhyay, and M. L. Klein. 2002. Towards anunderstanding of complex biological membranes from atomisticmolecular dynamics simulations. Biosci. Rep. 22:151–173.
Shepherd, C. M., H. J. Vogel, and D. P. Tieleman. 2003. Interactions ofthe designed antimicrobial peptide MB21 and truncated dermaseptin S3with lipid bilayers: molecular-dynamics simulations. Biochem. J. 370:233–243.
White, S. H., and W. C. Wimley. 1998. Hydrophobic interactions ofpeptides with membrane surfaces. Biochim. Biophys. Acta. 1376:339–352.
Wieprecht, T., M. Dathe, R. M. Epand, M. Beyermann, E. Krause, W. L.Maloy, D. L. MacDonald, and M. Bienert. 1997. Influence of the anglesubtended by the positively charged helix face on the membrane activityof amphipathic, antibacterial peptides. Biochemistry. 36:12869–12880.
Yamaguchi, S., D. Huster, A. Waring, R. I. Lehrer, W. Kearney, B. F. Tack,and M. Hong. 2001. Orientation and dynamics of an antimicrobialpeptide in the lipid bilayer by solid-state NMR spectroscopy. Biophys. J.81:2203–2214.
Yano, Y., T. Takemoto, S. Kobayashi, H. Yasui, H. Sakurai, W. Ohashi,M. Niwa, S. Futaki, Y. Sugiura, and K. Matsuzaki. 2002. Topologicalstability and self-association of a completely hydrophobic modeltransmembrane helix in lipid bilayers. Biochemistry. 41:3073–3080.
Zemel, A., D. R. Fattal, and A. Ben-Shaul. 2003. Energetics and self-assembly of amphipathic peptide pores in lipid membranes. Biophys. J.84:2242–2255.
Zuckermann, M. J., and T. Heimburg. 2001. Insertion and pore formationdriven by adsorption of proteins onto lipid bilayer membrane-waterinterfaces. Biophys. J. 81:2458–2472.
Peptide-Induced Membrane Perturbation 3619
Biophysical Journal 86(6) 3607–3619