membrane-integrated hybrid bioremediation of...
TRANSCRIPT
26 © IWA Publishing 2013 Journal of Water Reuse and Desalination | 03.1 | 2013
Membrane-integrated hybrid bioremediation of industrial
wastewater: a continuous treatment and recycling
approach
Ramesh Kumar and Parimal Pal
ABSTRACT
A new membrane-integrated hybrid treatment system was investigated to turn highly hazardous
coke wastewater reusable. This could protect both air and surface water bodies from toxic
contaminants such as ammonia, phenol, cyanide, thiocyanate and other carcinogenic aromatic
compounds which are normally released into the environment during discharge of coke wastewater
and during quenching of coke by wastewater. Apart from these hazardous substances, oil, grease,
other organics and even trace elements could be very effectively removed from wastewater by
logical sequencing of chemical, biological and finally nanomembrane-based treatments in an
integrated hybrid plant. After almost 99% removal of highly toxic cyanide compounds in a well-
optimized Fenton’s treatment unit, subsequent biological treatment units could be very effective. All
these pretreatments helped achieve microbial nitrification and denitrification of more than 98% of
ammonia. Composite nanofiltration membranes selected through investigation could separate ionic
trace contaminants from water with a high degree of purification permitting recycling and reuse of
the treated water. A selected cross flowmembrane module allowed long hours of largely fouling-free
operation under a reasonably low transmembrane pressure of only 15 bars while yielding an
industrially acceptable flux of 80 L of pure water per hour per square meter of membrane surface.
doi: 10.2166/wrd.2013.157
Ramesh KumarParimal Pal (corresponding author)Environment and Membrane Technology
Laboratory,Department of Chemical Engineering,National Institute of Technology Durgapur,India-713209E-mail: [email protected]
Key words | biodegradation, hazardous substances, membrane separation, sustainable
development, wastewater management, water reclamation
INTRODUCTION
Coke making units, which are often located within steel
making industries or coal-based power plants, generate
enormous quantities of wastewater containing quite a
number of highly hazardous compounds such as cyanide,
phenol, ammonia, thiocyanate and other toxic and patho-
genic contaminants represented by high value of chemical
oxygen demand (COD) and biochemical oxygen demand
(BOD), as analysed by Liu et al. (). Effective treatment
of the organic and inorganic compounds present in coke
wastewater has remained a longstanding problem to the
industry operators. Failure of the treatment plants often
lead to discharge of heavily polluted water into natural
water bodies such as river and lakes causing serious
environmental pollution of surface water (Ghose & Roy
; Kumar et al. ). Many coke making industries use
hazardous wastewater in quenching hot coke resulting in
serious air pollution as carcinogenic aromatics, phenolic
compounds, cyanide compounds and ammonia eventually
pollute air bodies. The contaminants present in coke waste-
water often oppose effective treatment of each other.
Considering enormous volumes of coke wastewater, biologi-
cal treatment is often a low cost option for major
contaminants like phenol, ammonia and similar com-
pounds, but the presence of cyanide compounds makes
the environment difficult for the survival of microbes and
this often leads to failures of such plants (Li & Zhao ;

27 R. Kumar & P. Pal | Hybrid treatment of wastewater for reuse Journal of Water Reuse and Desalination | 03.1 | 2013
Ghose ). Phenol is the organic contaminant which con-
tributes most to the total COD in coke wastewater. Nitrogen
compounds (NH4þ–N, organic bound N and NO3
–) are other
major contaminants in coke wastewater and studies on
steam stripping (Minhalma & Pinho ), ion-exchange
and chemical precipitation (He et al. ) have been
attempted to reduce ammonia concentration in wastewater.
Though several studies have been carried out over the last
three decades on chemical, biological and physical treat-
ment for removal of individual contaminants such as
phenol, cyanide (CN�), thiocyanate (SCN�) and ammo-
nia–nitrogen (NH4þ–N) from wastewater (Akcil et al. ;
Roostaei & Tezel ; Jeong et al. ; Santafe-Moros
et al. ; Shen et al. ; Dash et al. ; Justino et al.
), studies on an integrated approach for removal of all
hazardous substances are very scarce. Some of the methods
such as ion-exchange are considered tedious, labour-
intensive and expensive and, often, not very effective for
large scale treatment. Quite a few studies have reported
degradation of cyanide by Fenton’s reagents. Pontes et al.
() have developed very good kinetic models, also for
scale up of phenol degradation by the Fenton method.
Ammonia may be removed by a stripping process, but this
is often an expensive proposition considering the require-
ment of chemical feed, stripping tower, pump and liquid
spray system, forced air and a carbonization system. In the
recent studies of Zhao et al. (), Korzenowski et al.
() and Kumar et al. (), attempts have been made to
treat coke wastewater using membranes. Though these
studies have indicated the potentiality of membrane use in
some stages in reducing individual toxic substances, there
is hardly any reported study on a fully membrane-integrated
plant that can make highly hazardous wastewater reusable.
Moreover, the majority of the reported studies have been
conducted with synthetic wastewater whereas the character-
istics of real wastewater substantially deviate from such
ideal compositions. Thus there is a necessity for developing
advanced treatment technology through investigation on
real wastewater. If such an advanced treatment option suc-
ceeds in treating the wastewater up to the reusable criteria
level, then this would lead to two-fold benefits to the water
resources in general. On the one hand, hazardous waste-
water will be prevented from polluting otherwise clean
surface water bodies where wastewater is normally
discharged and on the other hand, this will save on fresh
water consumption by the same industry. Integration of
chemical and biological treatments with membrane separ-
ation where each stage can facilitate success of the
subsequent stage has the potential of making hazardous
coke wastewater reusable. Pressure-driven nanofiltration
(NF) followed by microfiltration has the capability of per-
forming finishing or polishing treatment in the integrated
advanced treatment scheme. Sen et al. () has shown
that NF membranes in appropriate modules can offer a
very high degree of purification with reasonably high flux
under moderately low transmembrane pressure. Though lit-
erature abounds in research on treatment of the major
contaminants of coke wastewater, to our knowledge,
hardly any integrated approach has been adopted for turn-
ing wastewater reusable in a continuous treatment scheme.
The majority of the reported studies are on batch mode.
Moreover, optimization of chemical treatment using
response surface methodology in such cases has not been
reported. In the present work, response surface optimized
chemical treatment has been integrated with biological
and membrane-based treatments leading to a substantial
improvement in performance in all the steps. In the absence
of such reported studies, the present work intends to fill a
major technology gap through integration of chemical, bio-
logical and nanomembrane-based treatments with logical
sequencing of treatments on real coke wastewater rather
than a synthetic one with the purpose of developing a
novel scheme of water treatment and reuse that is likely to
be sustainable.
THEORETICAL
Chemical treatment
Cyanide oxidation by Fenton’s reagent is highly dependent
on pH and at high pH cyanide is present as CN– ions so it
reacts easily with H2O2 and Fe2þ ions, but in acidic con-
ditions, cyanide is present as HCN gas which is very
difficult to oxidize. Fenton’s treatment has two distinct
stages, namely Fenton’s oxidation (OH– generation) and
Fenton’s coagulation, which is mainly simple ferric coagu-
lation following the oxidation stage and resulting in

28 R. Kumar & P. Pal | Hybrid treatment of wastewater for reuse Journal of Water Reuse and Desalination | 03.1 | 2013
sludge. Sarla et al. () found that degradation of cyanide
using Fenton’s reagent follows first-order kinetics.
� d[CN�]dt
¼ k[CN�][CN�] (1)
Bae et al. () observed that Fe2þ added in the form of
FeSO4·7H2O acts as a catalyst and the peroxide radicals
(OH2• ) produced are capable of further oxidizing other
species including Fe2þ present in the reaction medium as
below:
HO�2þFe2þ ! O2þFe3þþHþ, k ¼ 1:26 × 106 M�1S�1 (2)
There is a possibility of autoregeneration of Fe2þ in this
system that may act as a catalyst.
Feþ3þH2O2 ! HO2�þFe2þþHþ (3)
Biological treatment
The degradation kinetics was obtained from the experiments
carried out in batches and then making it continuous. The
Monod model was selected as the most suitable for this
work. In the biological treatment process, the relationship
between the rate of growth of microorganisms and the rate
of substrate utilization can be expressed by:
dXdt
¼ Ydsdt
� Kd:X (4)
where X¼microbial concentration; Y¼ growth coefficient,
mass of microorganisms produced per unit mass of substrate
utilized; S¼ concentration of organic food substrate utilized
by microorganisms; Kd¼microbial decay coefficient, time–1.
Dividing both sides of Equation (4) by X, we obtain:
dX=dtX
¼ Y :dX=dtX
� Kd (5)
In the above equation, ðdx=dtÞ=X is the specific growth
rate, often represented by μ. The inverse of μ is referred to
as the solids retention time or mean cell retention time, θc.
θc ¼ XdX=dtX
(6)
The term ðds=dtÞ=s is the substrate utilization rate per
unit amount of biomass and is called the specific substrate
utilization rate. It can be approximated by the following
expression:
ds=dtX
¼ ks
ks þ s(7)
where ks¼maximum specific substrate utilization rate,
time–1.
Substituting Equations (6) and (7) into (5), we obtain:
1θc
¼ Yk:s
ks þ s
� �� Kd (8)
In an activated sludge system, it is assumed that the con-
tents in the aeration tank are completely mixed and that
there are no microbial solids in the raw wastewater influent.
It is further assumed that the influent substrate concen-
tration, S0, remains constant and that the system operates
under steady state conditions. The solids are wasted from
the sludge recycle line, although they may also be wasted
from the aeration tank.
For a completely mixed system, Equation (6) can be
written in terms of the system parameters. Thus, the solids
retention time can be expressed as:
θc ¼ V :XQw:Xr þ Q�Qwð ÞXe½ � (9)
An expression for Se can be obtained by rewriting
Equation (8) as:
1θc
¼ Yk:Se
ks þ Se
� �� kd (10)
Rearranging this expression, we obtain:
Se ¼ ks 1þ θc:kdð ÞθcY :k� 1þ θckdð Þ
� �(11)

29 R. Kumar & P. Pal | Hybrid treatment of wastewater for reuse Journal of Water Reuse and Desalination | 03.1 | 2013
The relationship between X and Se in all tanks can be
obtained by first considering a substrate material balance
around the tanks. This step gives the amount of substrate uti-
lized per unit time and per unit volume of the aeration tank:
dsdt
¼ Q So � Seð ÞV
(12)
A loading parameter that has been developed over the
years is the hydraulic retention time (HRT), q
q ¼ VQ
(13)
where V¼ volume of aeration tank, m3, and Q¼ sewage
inflow, m3/d; So¼ influent substrate organic matter, pollu-
tants (g/m3); Se¼ effluent substrate organic matter,
pollutants (g/m3).
A similar loading parameter is mean cell residence time
or sludge retention time (SRT), qc,
qc ¼ V :XQw:Xr þ Q�Qwð ÞXe
(14)
Under steady state operation the mass of waste activated
sludge is given by:
Qw:Xr ¼ YQ So � Seð Þ � kd:V :X (15)
where Q¼ influent flow rate, m3/d; Qw¼waste sludge flow
rate, m3/d; Xe¼ concentration of biomass in effluent, g
VSS/m3; Xr¼ concentration of biomass in the return line
from clarifier, g VSS/m3; Y¼maximum yield coefficient.
Membrane separation
NF is a liquid separation membrane technology positioned
between reverse osmosis (RO) and ultrafiltration mem-
branes and its performance is predicted in two separate
components: the pure water flux and the solute flux are inde-
pendent from each other; in each of the models the pure
water flux can be related to pressure (ΔP). The separation
of the solutes from the solution depends on two ways,
steric (sieving) and Donnan (electrostatic) (Strathmann
) mechanisms, based on whether solutes are charged
or uncharged, which can be explained by continuum hydro-
dynamic models such as that originally proposed by Ferry
() and the extended Nernst–Planck model, respectively.
In the hydrodynamic models, porous membranes are rep-
resented as a bundle of straight cylindrical pores and
solute transport is corrected for hindered conversion and
diffusion due to solute-membrane interactions. The solvent
velocity through the pores of NF membranes may be
expressed using the Hagen–Poiseuille equation, as shown
in Equation (16) (Bandini & Vezzani ).
Jw ¼ r2pΔP
8μδ(16)
where Jw¼ the pure water permeability; rp¼ pore radius;
ΔP¼ the difference in applied pressure across the mem-
brane; δ¼ the thickness of the membrane; μ¼ viscosity of
fluid. According to Equation (16), increasing the pressure
will increase the pure water flux, while the solute flux is pro-
portionally related to the solute concentration gradient
across the membrane.
The osmotic pressure difference, Δπ, may be calculated
using the Van’t Hoff equation:
Δπ¼ RTX
(Cis � Cip) (17)
where Cis, Cip are, respectively, feed and permeate side con-
centrations of the solute.
Fluxes of permeate and the solute may be computed
respectively as:
Jv ¼ Lw(ΔP� Δπ)=η (18)
Ji ¼ VCip (19)
where Lw is pure water permeability determined
experimentally.
Solute flux is defined using the extended Nernst–Planck
equation as shown in Equation (20):
Ji ¼ �Ddcidx
� �� Dizici
FRT
dψdx
� �þ KiciJv½ � (20)

30 R. Kumar & P. Pal | Hybrid treatment of wastewater for reuse Journal of Water Reuse and Desalination | 03.1 | 2013
where Ji¼ solute flux i; Di¼ diffusivity of solute i; ci¼ the
concentration of solute i at the surface of the membrane;
x¼mole fraction for solute i; zi¼ the valance of solute i;
F¼ Faraday’s constant; R¼ the gas constant; T¼ tempera-
ture; Ψ¼ the electric potential; Ki¼ the distribution
coefficient of solute i; Jv¼ the volume flux and can be esti-
mated based on the membrane area.
Three different terms of the Nernst–Planck equation
describes a different component of the solute flux. The
first term on the right hand side of Equation (20) represents
the component of the solute flux that results from solute
concentration difference across the membrane. The second
term quantifies the flux due to electrostatic forces (as a func-
tion of charge gradient) and the last represents the
convection of solute i at the surface of the membrane.
Ionic transport through NF membranes has widely been
explained by models based on the Donnan equilibrium
theory that states the equality of electrochemical potential
(Ψ) of the solutions on either side of the solution–membrane
interface. Charged molecule transport through NF mem-
branes has been explained by models based on the
Donnan equilibrium theory which states the equality of elec-
trochemical potential (Ψ) of the solutions on either side of
the solution–membrane interface.
The concentration at the surface of the membrane can
be estimated using the Donnan equilibrium as shown in
Equation (21):
ψD ¼ ψm � ψs or ci ¼ Ciexp �ziFRT
ΔψD
� �(21)
where Ci¼ the bulk (or feed) concentration of solute i;
Donnan potential (ΨD) is the difference between the electri-
cal potential of the solution (Ψs) and the electrical potential
of the membrane (Ψm).
The Nernst–Plank equation coupled with the Donnan
equilibrium has been shown to accurately predict the rejec-
tion of various salts by NF and RO membrane (Afonso et al.
; Bandini & Vezzani ). Equations (20) and (21)
show that solute concentrations at the surface of the mem-
brane determine its passage. If the charge (or electrical
potential) of the membrane increases, the concentration of
counter ions (ions with the opposite charge) increases. If
the ion is neutrally charged, then the concentration at the
membrane surface is unaffected by the charge of the mem-
brane (Afonso et al. ; Bandini & Vezzani ).
Most of the polyamide composite NF membranes pos-
sess negative zeta potential at pH values greater than 7.0
(Schafer et al. ). Due to the charged nature of the NF
membrane, solutes with an opposite charge compared to
the membrane (counter-ions) are attracted, while solutes
with a similar charge (co-ions) are repelled. In addition, at
the membrane surface, a distribution of co- and counter-
ions will occur, thereby causing more separation.
EXPERIMENTAL
Materials
Reagent grade chemicals were used without further purifi-
cation. Ammonia and cyanide were procured from Merck
(Germany). Methanol and phenol were procured from
Sigma–Aldrich and Merck, respectively. All working sol-
utions of different reagent concentrations were prepared
using deionized water from Milli-Q (Waters, MA, USA) for
calibrating the cyanide and ammonia electrodes and phenyl
column. Sodium hydroxide pellets, HCl, ferrous sulphate,
hydrogen peroxide and CaCO3 used during the analysis and
experiment were purchased from Merck. The set-up was
made-up of high grade stainless steel (SS-316) to avoid rusting
during long operation. Thin film composite polyamide NF
membranes (Sepro Inc., USA) of 165 μm thickness and aver-
age pore size of 0.5–1.5 nm (NF1, NF2, NF3, NF20) were
used in the flat sheet cross flow membrane module
(Table 1) and their basic differences were in membrane sur-
face charge (available as manufacturer’s data from Sepro).
Polyvinylidene fluoride (PVDF) microfiltration membranes
(0.45 μm thickness) were procured from Membrane Sol-
utions (USA). During the experimental investigation in an
integrated pilot unit, only real wastewater collected by grab
sampling from a coke making industry (Durgapur Projects
Limited, India) was used after stabilization.
Methods
The membrane-integrated bioremediation system used for
experimental investigations is presented in Figure 1. The

Table 1 | Features of the flat-sheet, polyamide composite NF membranes (Sepro, USA)
used
MembranesCharacteristics NF1 NF2 NF3 NF20
Solute rejection, %
MgSO4: 99.5 97 98 98
NaCl: 90.0 50 60 35
pH 2–11 2–11 2–11 2–11
Max. temp (WC) 50 50 50 50
Max. pressure (bar) 83 83 83 83
Pore radius (nm) 0.53 0.57 0.55 0.54
Thickness (μm) 165 165 165 165
Figure 1 | Flow-sheet of the laboratory unit of membrane integrated hybirid treatment schem
31 R. Kumar & P. Pal | Hybrid treatment of wastewater for reuse Journal of Water Reuse and Desalination | 03.1 | 2013
major characteristics of the industrial wastewater as used in
the investigations are presented in Table 2 and the final efflu-
ent standards in terms of major contaminants are well
within emission limit values (ELVs) for wastewater and trea-
ted effluent discharged to surface water. Wastewater was
recycled after three stages of treatment which included
chemical treatment for cyanide, biological treatment for
phenol and ammonia and finally a polishing step for the
removal of trace elements, mostly in ionic forms by NF
membrane. Fenton’s reagent (FeSO4·7H2O and H2O2) was
used in the chemical treatment unit at a volume of 120 L
for removal of cyanide in the first reactor of the series. pH
was monitored using a pH probe and was maintained in
e for coke wastewater.
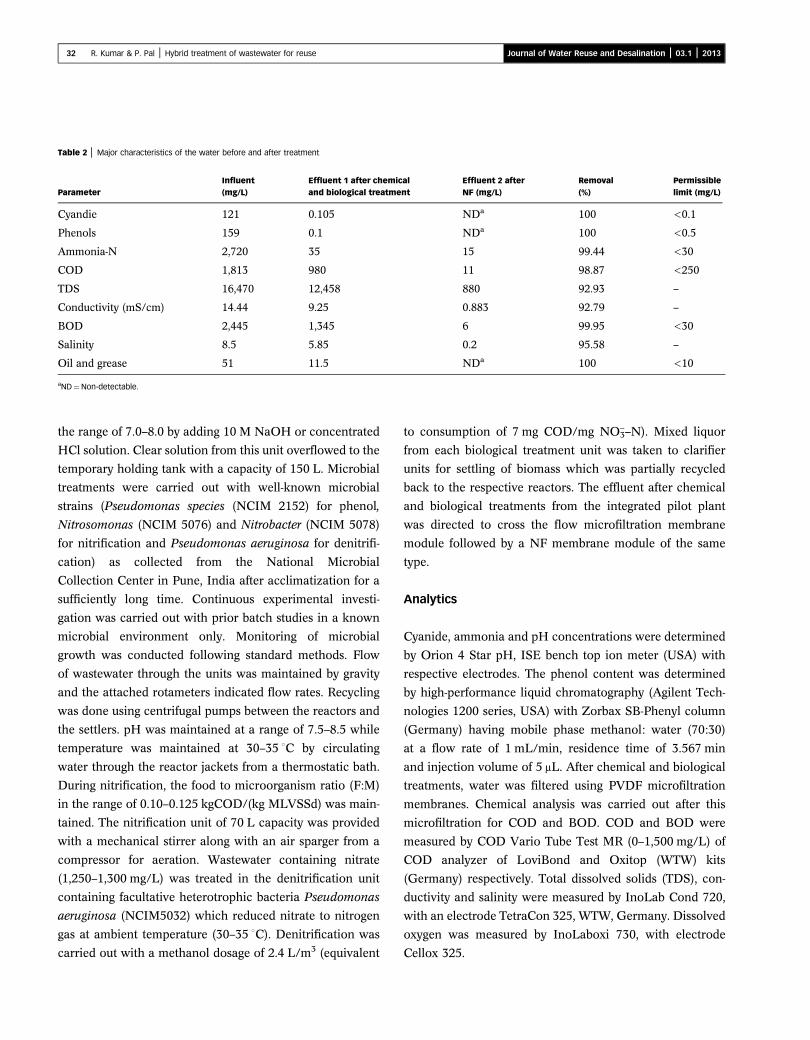
Table 2 | Major characteristics of the water before and after treatment
ParameterInfluent(mg/L)
Effluent 1 after chemicaland biological treatment
Effluent 2 afterNF (mg/L)
Removal(%)
Permissiblelimit (mg/L)
Cyandie 121 0.105 NDa 100 <0.1
Phenols 159 0.1 NDa 100 <0.5
Ammonia-N 2,720 35 15 99.44 <30
COD 1,813 980 11 98.87 <250
TDS 16,470 12,458 880 92.93 –
Conductivity (mS/cm) 14.44 9.25 0.883 92.79 –
BOD 2,445 1,345 6 99.95 <30
Salinity 8.5 5.85 0.2 95.58 –
Oil and grease 51 11.5 NDa 100 <10
aND¼Non-detectable.
32 R. Kumar & P. Pal | Hybrid treatment of wastewater for reuse Journal of Water Reuse and Desalination | 03.1 | 2013
the range of 7.0–8.0 by adding 10 M NaOH or concentrated
HCl solution. Clear solution from this unit overflowed to the
temporary holding tank with a capacity of 150 L. Microbial
treatments were carried out with well-known microbial
strains (Pseudomonas species (NCIM 2152) for phenol,
Nitrosomonas (NCIM 5076) and Nitrobacter (NCIM 5078)
for nitrification and Pseudomonas aeruginosa for denitrifi-
cation) as collected from the National Microbial
Collection Center in Pune, India after acclimatization for a
sufficiently long time. Continuous experimental investi-
gation was carried out with prior batch studies in a known
microbial environment only. Monitoring of microbial
growth was conducted following standard methods. Flow
of wastewater through the units was maintained by gravity
and the attached rotameters indicated flow rates. Recycling
was done using centrifugal pumps between the reactors and
the settlers. pH was maintained at a range of 7.5–8.5 while
temperature was maintained at 30–35 WC by circulating
water through the reactor jackets from a thermostatic bath.
During nitrification, the food to microorganism ratio (F:M)
in the range of 0.10–0.125 kgCOD/(kg MLVSSd) was main-
tained. The nitrification unit of 70 L capacity was provided
with a mechanical stirrer along with an air sparger from a
compressor for aeration. Wastewater containing nitrate
(1,250–1,300 mg/L) was treated in the denitrification unit
containing facultative heterotrophic bacteria Pseudomonas
aeruginosa (NCIM5032) which reduced nitrate to nitrogen
gas at ambient temperature (30–35 WC). Denitrification was
carried out with a methanol dosage of 2.4 L/m3 (equivalent
to consumption of 7 mg COD/mg NO–3–N). Mixed liquor
from each biological treatment unit was taken to clarifier
units for settling of biomass which was partially recycled
back to the respective reactors. The effluent after chemical
and biological treatments from the integrated pilot plant
was directed to cross the flow microfiltration membrane
module followed by a NF membrane module of the same
type.
Analytics
Cyanide, ammonia and pH concentrations were determined
by Orion 4 Star pH, ISE bench top ion meter (USA) with
respective electrodes. The phenol content was determined
by high-performance liquid chromatography (Agilent Tech-
nologies 1200 series, USA) with Zorbax SB-Phenyl column
(Germany) having mobile phase methanol: water (70:30)
at a flow rate of 1 mL/min, residence time of 3.567 min
and injection volume of 5 μL. After chemical and biological
treatments, water was filtered using PVDF microfiltration
membranes. Chemical analysis was carried out after this
microfiltration for COD and BOD. COD and BOD were
measured by COD Vario Tube Test MR (0–1,500 mg/L) of
COD analyzer of LoviBond and Oxitop (WTW) kits
(Germany) respectively. Total dissolved solids (TDS), con-
ductivity and salinity were measured by InoLab Cond 720,
with an electrode TetraCon 325, WTW, Germany. Dissolved
oxygen was measured by InoLaboxi 730, with electrode
Cellox 325.

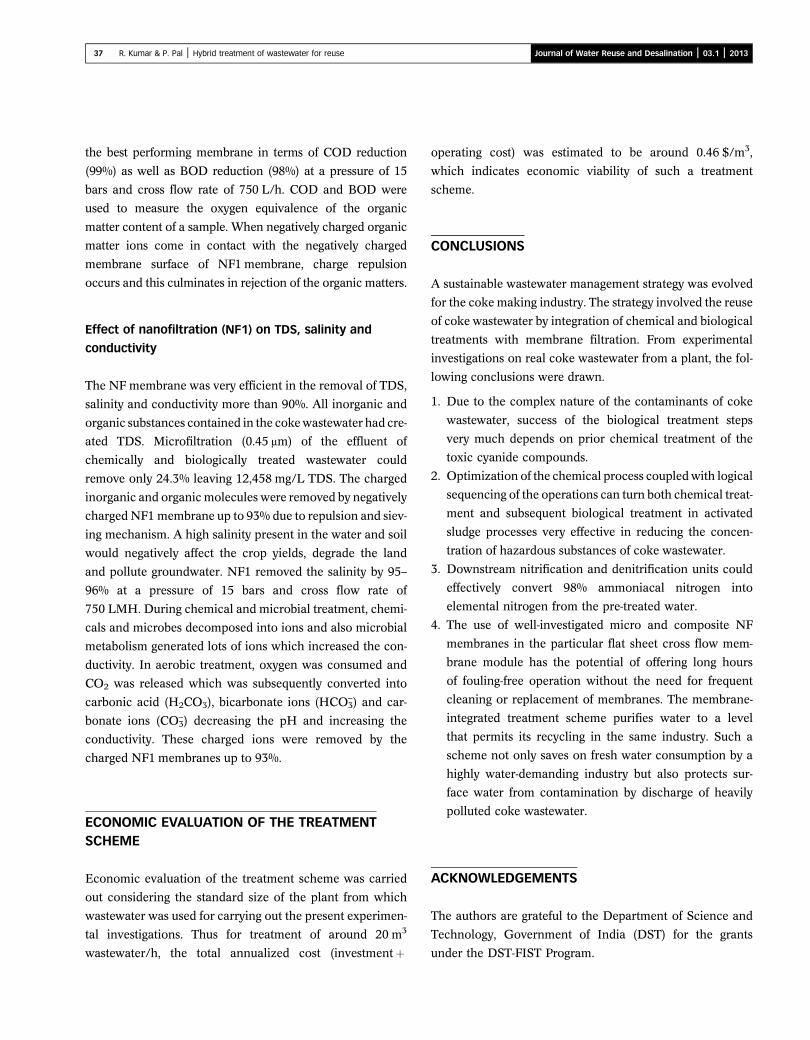
Table 3 | Experimental response under suggested operating conditions
STD RunH2O2 dose(g/L)
Iron saltdose (g/L) pH
Response cyanideremoval (%)
14 1 3.50 2.38 12.39 36
18 2 3.50 2.38 6.50 99
1 3 1.50 1.00 3.00 7
15 4 3.50 2.38 6.50 99
19 5 3.50 2.38 6.50 99
3 6 5.50 1.00 3.00 26
6 7 1.50 3.75 10.00 59
13 8 3.50 2.38 0.61 4
16 9 3.50 2.38 6.50 99
12 10 6.86 2.38 6.50 100
9 11 3.50 0.06 6.50 28
5 12 1.00 1.50 10.0 18
4 13 5.50 3.75 3.00 51
11 14 0.14 2.38 6.50 33
33 R. Kumar & P. Pal | Hybrid treatment of wastewater for reuse Journal of Water Reuse and Desalination | 03.1 | 2013
Calculations
The influent and effluents were periodically analysed for
residual contaminants (i.e. COD) for monitoring perform-
ance of the chemical, biological and membrane-based
processes. The samples were always kept under refrigeration
at 4 WC when immediate analysis could not be done. Nitrate,
oil and grease were determined by the cadmium reduction
method (4500 NO3–E) and partition-Gravimetric Method
(5520B) respectively as described in Standard Methods of
APHA (). During NF, the percentage removal of pollu-
tants was calculated using Equation (22) below:
% removal of COD ¼ 1� Cf
Ci
� �× 100 (22)
where Ci and Cf were COD in the feed and permeate
streams, respectively.
20 15 3.50 2.38 6.50 9910 16 3.50 4.69 6.50 100
8 17 5.50 3.75 10.0 98
17 18 3.50 2.38 6.50 99
7 19 5.50 1.00 10.00 83
2 20 1.50 3.75 3.00 35
Table 4 | Statistical parameters obtained from the ANOVA for the regression models
Response R2 Adj. R2 CV (%) S.D. A.P.
Cyanide removal 0.9962 0.9928 3.06 0.23 50.17
A.P., adequate precision; S.D., standard deviation; CV, coefficient of variance.
RESULTS AND DISCUSSION
Results of optimization study using design expert
software for chemical degradation of cyanide
Experiments were planned and conducted following central
composite design (CCD), considering the minimum and
maximum levels for hydrogen peroxide (1.50–5.50 g/L),
iron salt (1.00–3.75 g/L) and pH (3.0–10.0) and experimen-
tal results were incorporated in that design (Table 3). In
determining the interrelationships of these variables, a
second-order polynomial equation was fitted to the exper-
imental data, and the square root was chosen. From the fit
summary section in design, the model F-values as obtained
for cyanide removal (145.93) implied that models were sig-
nificant. A value of P (0.0001) in this case being less than
0.0500 also indicates that the model terms are significant.
The final regression equation made by analysis of variance
(ANOVA) shows the empirical relationship among the
target variables (cyanide removal) and the three operating
conditions or variables and the statistical parameters
obtained from the ANOVA for the cyanide removal is
listed in Table 4. The equation in terms of coded factors is
represented by Equation (23):
Sqrt cyanide removal %ð Þ ¼ þ9:94þ 1:28 ×H2O2 þ 1:31
× iron saltþ 1:23 × pH� 0:48 ×H2O2 × iron salt� 0:14
×H2O2 × pHþ 0:43 × iron salt × pH� 0:78 H2O2ð Þ2�0:70
iron saltð Þ2�2:07 pHð Þ2 (23)
It is clear from Equation (23) that the percentage
removal of cyanide is linear with respect to H2O2, iron
salt and pH and is also quadratic with respect to the same
parameters. The quality of the model developed was evalu-
ated based on the correlation coefficient R2 and standard
deviation value. The closer the R2 value to unity the smaller

34 R. Kumar & P. Pal | Hybrid treatment of wastewater for reuse Journal of Water Reuse and Desalination | 03.1 | 2013
the standard deviation, the more accurate the response
could be predicted by the model. The R2 value for Equation
(23) was found to be 0.9940 which indicated that 99.40% of
cyanide removal was attributed to the experimental vari-
ables studied. The value of adjusted determination
coefficient (adj R2 for cyanide and removal %¼ 0.9828)
was within reasonable agreement with the predicted R2
0.9685 (cyanide removal %) and it implies that the model
was significant. Effects of H2O2, iron salt and pH were
highly significant as the P values <0.0001 in both cases.
The high significance of the model was also established in
the plot of calculated values against the experimental
values of cyanide removal % (Figure 2). Clustering of
points around the diagonal line indicated capability of the
model to predict the experiments in both cases. Figure 3 pre-
sents the response surface modelling in a three dimensional
representation reflecting the effects of hydrogen peroxide,
iron salt and pH on the cyanide removal after 1 h of reac-
tion. As a general trend, it was observed that effects of
hydrogen peroxide and iron salt on removal of cyanide
was pH-dependent. At low pH, cyanide degradation by
hydrogen peroxide and iron salt is very difficult due to the
presence of cyanide mainly as HCN gas. At high pH,
Figure 2 | Distribution of experimentally determined values versus statistically predicted
values of cyanide removal (%).Figure 3 | Response surface plot showing the removal % of cyanide ((a), (b), (c)) with
variable parameters pH, iron salt and hydrogen peroxide.

35 R. Kumar & P. Pal | Hybrid treatment of wastewater for reuse Journal of Water Reuse and Desalination | 03.1 | 2013
cyanide presents as CN– ions, so it reacts easily with H2O2
and iron salt (Sarla et al. ). Using hydrogen peroxide
as a powerful oxidizing agent (oxidation potential 1.77 V),
cyanide was converted to cyanate and ammonia as inter-
mediate products.
The Fenton’s treatment was followed for cyanide degra-
dation uses H2O2 and iron salts as basic reagents, where
optimization of the concentrations of these reagents and
pH is essential for maximum conversion of cyanide with
minimum consumption of the chemicals. In the design of
the experiments, these aspects were duly considered. Some
optimized solutions with different criteria were suggested
by the software. From those suggested solutions, one accep-
table set of the optimum values of the concentration of the
reagents was 5.10 g/L of H2O2, 1.52 g/L of iron salt and
pH of 7.5 where expected removal of cyanide was 100%.
As the selected optimum criteria for variables were not
amongst the 20 experiments previously designed by CCD
and were rather assumptions, an experiment with selected
criteria was performed in a shaker flask and was found
that the predicted response was in close agreement with
the actual experimental value. The solution was accepted
as the complete removal of cyanide with minimum concen-
tration of iron salt which reduced the sludge generation
during treatment and avoided iron contamination in the
final effluent. Figure 4 shows the result of cyanide
Figure 4 | Cyanide and ammonia concentration profile during chemical pre-treatment.
Experimental conditions: influent cyanide concentration 121 mg/L; optimized
concentrations of FeSO4·7H2O¼ 1.52 g/L; H2O2¼ 5.1 g/L; pH¼ 7.5; tempera-
ture: 308 K.
concentration before Fenton’s treatment and after treatment
with optimized concentration. Cyanide first oxidized to cya-
nate, which further oxidized to ammonium and carbonate
ions as shown following the reactions as shown in Equations
(24) and (25) below:
CN�þH2O2 ! CNO�þH2O (24)
CNO�þ2H2O →H2O2
NH�4þCO�2
3 (25)
Cyanide may also be mineralized to bicarbonate and
ammonia following the reaction:
CN�þ2H2O →H2O2
NH�4þHCOO� (26)
Biological degradation of phenol and ammonia
The HRT was optimized for the successful treatment of the
phenol and it was found that in 17.5 h, phenol was degraded
up to a minimum detection level, as shown in Figure 5.
Phenol was almost completely removed regardless of
loading variation and the removal efficiency was always
higher than 99%. The influent ammonia concentration was
2,720 mg/L and its removal increased with increasing
HRT. After 35 h of retention time, removal almost stabilized.
The highest ammonia removal (98.7%) was achieved on
operation of the system for 70 h of HRT. The following
Figure 5 | Phenol, ammonia and nitrate removal efficiencies obtained in the biological
treatment of coke wastewater in seperate tank with respective microorgan-
ism. Operating condition: influent concentration of phenol¼ 159 mg/L and
ammonia¼ 2,720 mg/L.

36 R. Kumar & P. Pal | Hybrid treatment of wastewater for reuse Journal of Water Reuse and Desalination | 03.1 | 2013
equations describe the nitrification process:
NHþ4 þ1:5O2!2Hþþ2H2OþNO�
2 byNitrosomonas (27)
NOþ2 þ0:5O2!NO�
3 byNitrobacter (28)
During nitrification, the pH of the medium reduces due
to acid produced during nitrification. Hence pH was
adjusted by the addition of 5N NaOH. For proper nitrifica-
tion, the ratio of mass of CaCO3/mass of NH4þ–N is very
important. Alkalinity in the nitrification process was main-
tained at around 150–200 mg/L of the medium by adding
CaCO3 at rate of 5 g/L to achieve adequate buffering, as
shown by the following equation:
H2Oþ CO2 , H2CO3 , HCO�3þHþ , CO3þ2Hþ (29)
The initial concentration of nitrate in the nitrification
was found to be 1,254 mg/L due to conversion of ammonia
to nitrate by two subsequent biological reactions. Nitrate
was reduced to free nitrogen in the denitrification unit
which was carried out as the last step at a methanol
dosage of 2.4 L/m3 (equivalent to a consumption of 7 mg
COD/mg NO�3 –N) as external organic or inorganic carbon
sources are necessary for stable operation of the denitrifica-
tion unit. By maintaining almost an anoxic condition
(0.5 mg/L dissolved oxygen), nitrate was completely con-
verted to free nitrogen at a minimum HRT of 17.5 h.
Figure 6 | BOD and COD removal performance by different NF membranes with varying
pressure. Experimental conditions: cross flow rate¼ 750 LPH; pressure¼ 5–15
bars; pH¼ 7.6 and at temperature¼ 308 K.
Nanofiltration of biologically treated coke wastewater
Four different types of polyamide NF membranes (NF1,
NF2, NF3 and NF20) were investigated to find out the
best possible one in the present treatment. Effects of trans-
membrane pressure and cross flow velocity on flux as well
as on removal of COD, BOD, TDS, salinity and conductivity
were studied. Microfiltration with 0.45 μm PVDF membrane
in cross flow membrane module was done prior to NF. Sus-
pended solids and microbes were found to be largely
screened out during microfiltration paving the way for
better NF under a more conducive environment that per-
mitted long hours of largely fouling-free NF.
Effect of cross flow rate and pressure on flux
When pressure was increased from 5 to 15 bars flux at a
volumetric cross flow of 750 L/h (L/H), flux through NF2
membrane increased from 158 to 260 L/m2 h (LMH). A
similar tendency of increase of flux with increase of cross
flow rate was also shown by other membranes. The highest
flux was exhibited by NF2, due to its loosest type, i.e. highest
porosity among the four investigated membranes, followed
by NF3, NF20 and NF1, respectively. Whereas NF1 was
found to be the tightest, meaning the lowest porosity
among four types, so flux was the lowest. Adequate cross-
flow and transmembrane pressure help reduce membrane
fouling, optimization of membrane area requirement and
maximization of removal of the hazardous compounds.
Effect of transmembrane pressure on the rejection of
COD and BOD
Four different types of NF membranes were investigated at
different pressures to select the best possible membrane and
the optimum operating pressure in removing COD loading,
as shown in Figure 6. The first stage of treatment of coke
wastewater could remove 45 and 46% of influent BOD and
COD, respectively. In all the four membranes, rejection of
BOD and COD increased with an increase of applied
pressure. NF1 membrane with a flux of 79–80 LMH was
37 R. Kumar & P. Pal | Hybrid treatment of wastewater for reuse Journal of Water Reuse and Desalination | 03.1 | 2013
the best performing membrane in terms of COD reduction
(99%) as well as BOD reduction (98%) at a pressure of 15
bars and cross flow rate of 750 L/h. COD and BOD were
used to measure the oxygen equivalence of the organic
matter content of a sample. When negatively charged organic
matter ions come in contact with the negatively charged
membrane surface of NF1 membrane, charge repulsion
occurs and this culminates in rejection of the organic matters.
Effect of nanofiltration (NF1) on TDS, salinity and
conductivity
The NF membrane was very efficient in the removal of TDS,
salinity and conductivity more than 90%. All inorganic and
organic substances contained in the cokewastewater had cre-
ated TDS. Microfiltration (0.45 μm) of the effluent of
chemically and biologically treated wastewater could
remove only 24.3% leaving 12,458 mg/L TDS. The charged
inorganic and organic molecules were removed by negatively
chargedNF1 membrane up to 93% due to repulsion and siev-
ing mechanism. A high salinity present in the water and soil
would negatively affect the crop yields, degrade the land
and pollute groundwater. NF1 removed the salinity by 95–
96% at a pressure of 15 bars and cross flow rate of
750 LMH. During chemical and microbial treatment, chemi-
cals and microbes decomposed into ions and also microbial
metabolism generated lots of ions which increased the con-
ductivity. In aerobic treatment, oxygen was consumed and
CO2 was released which was subsequently converted into
carbonic acid (H2CO3), bicarbonate ions (HCO3–) and car-
bonate ions (CO3–) decreasing the pH and increasing the
conductivity. These charged ions were removed by the
charged NF1 membranes up to 93%.
ECONOMIC EVALUATION OF THE TREATMENTSCHEME
Economic evaluation of the treatment scheme was carried
out considering the standard size of the plant from which
wastewater was used for carrying out the present experimen-
tal investigations. Thus for treatment of around 20 m3
wastewater/h, the total annualized cost (investmentþ
operating cost) was estimated to be around 0.46 $/m3,
which indicates economic viability of such a treatment
scheme.
CONCLUSIONS
A sustainable wastewater management strategy was evolved
for the coke making industry. The strategy involved the reuse
of coke wastewater by integration of chemical and biological
treatments with membrane filtration. From experimental
investigations on real coke wastewater from a plant, the fol-
lowing conclusions were drawn.
1. Due to the complex nature of the contaminants of coke
wastewater, success of the biological treatment steps
very much depends on prior chemical treatment of the
toxic cyanide compounds.
2. Optimization of the chemical process coupledwith logical
sequencing of the operations can turn both chemical treat-
ment and subsequent biological treatment in activated
sludge processes very effective in reducing the concen-
tration of hazardous substances of coke wastewater.
3. Downstream nitrification and denitrification units could
effectively convert 98% ammoniacal nitrogen into
elemental nitrogen from the pre-treated water.
4. The use of well-investigated micro and composite NF
membranes in the particular flat sheet cross flow mem-
brane module has the potential of offering long hours
of fouling-free operation without the need for frequent
cleaning or replacement of membranes. The membrane-
integrated treatment scheme purifies water to a level
that permits its recycling in the same industry. Such a
scheme not only saves on fresh water consumption by a
highly water-demanding industry but also protects sur-
face water from contamination by discharge of heavily
polluted coke wastewater.
ACKNOWLEDGEMENTS
The authors are grateful to the Department of Science and
Technology, Government of India (DST) for the grants
under the DST-FIST Program.

38 R. Kumar & P. Pal | Hybrid treatment of wastewater for reuse Journal of Water Reuse and Desalination | 03.1 | 2013
REFERENCES
Afonso,M.D.,Hagmeyer, G.&Gimbel, R. Streaming potentialmeasurements to assess the variation of nanofiltrationmembranes surface charge with the concentration of saltsolutions. Sep. Purif. Technol. 22–3 (1–3), 529–541.
Akcil, A., Karahan, A. G., Ciftci, H. & Sagdic, O. Biologicaltreatment of cyanide by natural isolated bacteria(Pseudomonas sp.). Mineral Eng. 16, 643–649.
APHA Standard Methods for the Examination of Water andWastewater, 19th edition, American Public HealthAssociation/American Water Works Association/WaterEnvironment Federation, Washington, DC.
Bae, W., Lee, S. H. & Ko, G. B. Evaluation of predominantreaction mechanisms for the Fenton’s process in textile dyingwastewater treatment. Water Sci. Technol. 49 (4), 91–96.
Bandini, S. & Vezzani, D. Nanofiltration modelling: the roleof dielectric exclusion in membrane characterization. Chem.Eng. Sci. 58 (15), 3303–3326.
Dash, R. R., Balomajumder, C. & Kumar, A. Treatment ofmetal cyanide bearingwastewater by simultaneous adsorptionand biodegradation (SAB). J. Hazard. Mater. 152, 387–396.
Ferry, J. D. Ultrafilter membranes and ultrafiltration.Chemical Rev. 18, 373–455.
Ghose, M. K. Complete physico-chemical treatment for cokeplant effluents. Water Res. 36, 1127–1134.
Ghose, M. K. & Roy, S. Status of water pollution due to cokeoven effluent: a case study. J. Indian Pub. Health Eng. 3, 1–9.
He, S., Zhang, Y., Yang, M., Du, W. & Harada, H. Repeateduse of MAP decomposition residues for the removal of highammonium concentration from landfill leachate.Chemosphere 66, 2233–2238.
Jeong, Y., Park, B. G. & Chung, J. S. High performancebiofilm process for treating wastewater discharged from coalrefining plants containing nitrogen, cyanide and thiocyanate.Water Sci. Technol. 52, 325–334.
Justino, C., Marques, A. G., Duarte, K. R., Pereira, R., Rocha-Santos, T. & Freitas, A. C. Degradation of phenols inolive oil mill wastewater by biological, enzymatic, and photo-Fenton oxidation. Environ. Sci. Pollut. Res. 17, 650–656.
Korzenowski, C., Minhalma, M., Bernandes, A. M., Ferreira, J. Z.& Pinho, M. N. Nanofiltration for treatment of cokeplant ammoniacal wastewaters. Sep. Purif. Technol. 76,303–307.
Kumar, R., Bhakta, P., Chakraborty, S. & Pal, P. Separatingcyanide from coke wastewater by cross flow nanofiltration.Sep. Sci. Technol. 46, 2119–2127.
Li, X. & Zhao, Q. L. Efficiency of biological treatmentaffected by high strength of ammonium-nitrogen in leachateand chemical precipitation of ammonium-nitrogen aspretreatment. Chemosphere 44, 37–43.
Liu, J., Baozhen, W., Li, J., Chengji, L., Cao, X. & Wang, L. Removal of nitrogen from coal gasification and coke plantwastewater in anoxic–aerobic submerged biofilm activatedsludge (SBF-AS) hybrid system. Water Sci. Technol. 34 (10),17–24.
Minhalma, M. & Pinho, M. N. Integration of nanofiltration/steam stripping for the treatment of coke plant ammoniacalwastewaters. J. Membr. Sci. 242, 87–95.
Pontes, R. F. F., Moraes, J. E. F., Machulek, A. & Pinto, J. M. A mechanistic kinetic model for phenol degradation by theFenton process. J. Hazard. Mater. 176 (1–3), 402–413.
Roostaei, N. & Tezel, F. H. Removal of phenol fromaqueous solutions by adsorption. J. Environ. Manage. 70,157–164.
Santafe-Moros, A., Gozalvez-Zafrilla, J. M. & Lora-Garcia, J. Performance of commercial nanofiltration membranes in theremoval of nitrate ions. Desalination 185, 281–287.
Sarla, M., Pandit, M., Tyagi, D. K. & Kapoor, J. C. Oxidationof cyanide in aqueous solution by chemical andphotochemical process. J. Hazard. Mater. 116, 49–56.
Schafer, A. I., Nghiem, D. I. & Waite, T. D. Removal ofnatural hormone estrone from aqueous solutions usingnanofiltration and reverse osmosis. Environ. Sci. Technol. 37(1), 182–188.
Sen, M., Manna, A. K. & Pal, P. Removal of arsenic fromcontaminated groundwater by membrane-integrated hybridtreatment system. J. Membr. Sci. 354, 108–113.
Shen, Z., Han, B. & Wickramasinghe, S. R. Cyanide removalfrom industrial praziquantel wastewater using integratedcoagulation–gas-filled membrane absorption. Desalination195, 40–50.
Strathmann, H. Electrodialysis. In: Membrane Handbook (W.S. Ho & K. K. Sirkar, eds). Van Nostrand Reinhold,New York, pp. 218–262.
Zhao, W., Huang, X. & Lee, D. Enhanced treatment ofcoke plant wastewater using an anaerobic-anoxic-oxicmembrane bioreactor system. Sep. Purif. Technol. 66,279–286.
First received 23 May 2012; accepted in revised form 15 July 2012