membrane fusion guiding protein delivery into live cells … · s1 supporting information guiding...
TRANSCRIPT

S1
Supporting Information
Guiding Protein Delivery into Live Cells using DNA-Programmed Membrane Fusion
Lele Sun,a,b Yanjing Gao,a,b Yaoguang Wang,c Qin Wei,c Nan Chen,a Jiye Shi,a Di Li,*a,d Chunhai Fana
a Division of Physical Biology & Bioimaging Centre, Shanghai Synchrotron Radiation Facility, Key Laboratory of Interfacial Physics
and Technology, Shanghai Institute of Applied Physics, Chinese Academy of Sciences, Shanghai 201800, China.b University of Chinese Academy of Sciences, Beijing 100049, Chinac Key Laboratory of Chemical Sensing & Analysis in Universities of Shandong, School of Chemistry and Chemical Engineering,
University of Jinan, Jinan 250022, Chinad School of Chemistry and Molecular Engineering, East China Normal University, Shanghai, 200241, China
E-mail: [email protected]
Electronic Supplementary Material (ESI) for Chemical Science.This journal is © The Royal Society of Chemistry 2018

S2
Table of Content
Experimental Sections .........................................................................................................................S3
Supporting tables .................................................................................................................................S9
Supporting figures..............................................................................................................................S10
Reference: ..........................................................................................................................................S32

S3
Experimental Sections
Materials
1,2-dioleoyl-sn-glycero-3-phosphocholine (DOPC), 1,2-dioleoyl-sn-glycero-3-
phosphoethanolamine (DOPE), 1,2-dimyristoyl-sn-glycero-3-phosphoethanolamine-N-(7-nitro-2-
1,3-benzoxadiazol-4-yl) (NBD-PE), and 1,2-dimyristoyl-sn-glycero-3-phosphoethanolamine-N-
(lissamine rhodamine B sulfonyl) (Rh-PE) were obtained from Avanti Polar Lipids. Culture medium,
fetal bovine serum (FBS), trypsin-EDTA solution, cell tracker violet BMQC dye, cell tracker deep
red dye, phosphate buffered saline (PBS, pH 7.4) and Lysotracker (green) were purchased from
Thermal Fisher Scientific. Cholesterol, horseradish Peroxidase (HRP, EC 1.11.1.7), Amplex Red,
H2O2, resorufin, Cytochrome C, chlorpromazine (CPZ), methyl-beta-cyclodextrin (MβCD), 3-(4,5-
dimethyl-2-thiazolyl)-2,5-diphenyl-2-H-tetrazolium bromide (MTT), sodium dodecyl sulfate (SDS)
and hoechst 33258 were all purchased from Sigma-Aldrich. Polycarbonate (PC) membrane with a
pore diameter of 100 nm (Whatman, Fisher Scientific) was used in vesicle extrusion. Cholesterol
functionalized and unfunctionalized oligonucleotides were synthesized by Takara Bio (Dalian,
China). Peptides used in this study were synthesized by Top-peptide Co., Ltd (Shanghai, China).
Buffer solution containing 10 mM Tris-HCl and 140 mM NaCl (pH 7.4) was prepared with
deionized water, all of the regents used to prepare buffer solutions were obtained from Sigma-
Aldrich.
Cell Culture
L1210 cells (Murine lymphocyte leukemia cell line) were cultured in RPMI-1640 medium
supplemented with 10% v/v FBS (fetal calf serum), 1% penicillin, 1% streptomycin and 2 mM
glutamine as a complete growth medium. Cells were maintained in tissue culture dish with 10 mL of
medium and were incubated at 37 °C in an incubator with 5% v/v CO2 in humidified atmosphere.
Every 2 days the cells were subcultured by splitting the culture with fresh medium.
HeLa cells (Human cervix cancinoma cell line) were cultured in MEM medium containing 10%
v/v FBS, 1% penicillin, 1% streptomycin and 2 mM glutamine at 37 °C, in a humidified atmosphere
containing 5% v/v CO2. Replacement of the medium was carried out every 2 to 3 days. After

S4
reaching 70–80% of confluence, cells were detached using trypsin-EDTA solution and centrifuged
(1100 rpm) at 25 °C for 3 min. Cells were then washed and 2×10⁷ cells per big petri dish were used
to subculture.
Preparation and characterization of HRP encapsulated liposomes
DOPC, DOPE and cholesterol were mixed with an optimized molar ratio of 50:25:25 in
chloroform in a 5 mL glass vial.1 Fluorescent lipids (NBD-PE or Rh-PE) were added with desired
molar ratio. Then chloroform was evaporated with a rotary evaporator, and the lipid film was
thoroughly dried under a stream of N2. Small unilamellar vesicles (SUVs) were prepared by
hydrating the lipid film with 10 mM Tris-HCl buffer containing 140 mM NaCl (pH 7.4) to form a
final lipid concentration of 5 mg/mL, then agitated for half an hour with a magnetic stirrer and
extruded about 25 times through a 100 nm polycarbonate (PC) membrane. The averaged diameter of
vesicles was measured by dynamic light scattering (DLS, Malvern, Nano-ZS90) (Fig. S1).
To prepare protein encapsulated liposomes for membrane fusion experiments, 1% molar NBD-PE
was introduced, and 50 μM HRP solution (prepared by 10 mM Tris-HCl buffer, 140 mM NaCl, pH
7.4) was used to hydrate the lipid film to form a final lipid concentration of 5 mg/mL. Other
procedures were similar with the above methods. The number of HRP molecules (n) in one liposome
was obtained from HRP concentration (c) and the diameter of liposome (d) according to Equation 1,
and calculated to be 14, where N is Avogadro constant.
𝑛 = 𝑐 ×43
𝜋(𝑑2)3 𝑁 (1)
Untrapped HRP was removed by three times dialysis (12 h/per time) through cellulose ester dialysis
membranes under 4 °C with 10 mM Tris-HCl, 140 mM NaCl (pH 7.4) as dialysate. The liposomes
encapsulated HRP were kept at 4 °C and used within 48 h. Similar method was applied for preparing
Cytochrome C containing liposomes, except that the dried lipid film was hydrated by 100 μM
Cytochrome C solution (prepared by 10 mM Tris-HCl buffer, 140 mM NaCl, pH 7.4).
Membrane fusion between liposomes and live cells
NBD labeled liposomes containing HRP were preincubated with appropriate amounts of anchor 2
for 2 h to achieve an average copy number of 100 cholesterol-DNA per vesicle 2 and a final lipid

S5
concentration of 1 mg/mL. Then, for L1210 cells, 2×10⁶ cells were suspended in 100 μL serum free
medium and mixed with 5 μL of 100 μM anchor 1 (solved in a 60:40 mixture of acetonitrile:water).
After incubating with shock on thermostatic oscillator (400 rpm) for 10 min at 37 °C, excess anchor 1
was removed by two times centrifugation (1300g, 3 min). Then the anchor 1 modified cells were
resuspended in 60 μL serum free medium and incubated with 40 μL anchor 2-decorated NBD labeled
liposomes containing HRP for 20 min at 37 °C. After that, excess liposomes were removed by two
times centrifugation (1300g, 3 min) and resuspended in 400 μL serum free medium containing
Amplex Red (50 μM) H2O2 (500 μM) and hoechst 33258 with recommended concentration. After 20
min incubation at 25 °C, cells were washed two times by centrifugation (1300 g, 3 min) and
resuspended in serum free medium for imaging. Cell imaging was conducted with confocal
fluorescence microscopy (Leica, TCS SP8). 405nm laser, 488 nm laser and 561 nm laser were used
to excite hoechst 33258, NBD and resorufin (Ex/Em: 560/585 nm), respectively. Control
experiments were performed simultaneously with desired treatments. If lysosome staining was
needed, the cells were preincubated in complete medium containing Lysotracker with a
recommended concentration. Leica application suite advanced fluorescence software and ImageJ
were used for image analysis. For HeLa cells, cells were pre-seeded in glass-bottomed confocal
dishes (inner diameter 20 mm) at a concentration of 8×10⁴ and cultured for 12 h before membrane
fusion experiment, following procedures were similar with that of L1210 cells but performing in the
cellular adherent state.
Membrane fusion experiments under MβCD treatment: Cells were preincubated with 7 mM
MβCD for 30 min in complete medium,3 then washed three times with serum free medium.
Following procedures were the same as described above.
Membrane fusion experiments under CPZ treatment: Cells were preincubated with 5 μg/mL CPZ
for 30 min in complete medium.3 The procedures were the same as described above, except that
performing with serum free medium containing 5 μg/mL CPZ.
Membrane fusion experiments under 4 ℃ treatment: In this section, the anchor 1 modified cells
were incubated with anchor 2-decorated NBD labeled liposomes containing HRP for 30 min at 4 °C.
Other procedures were the same as described above.
Toxicity measurements
S6
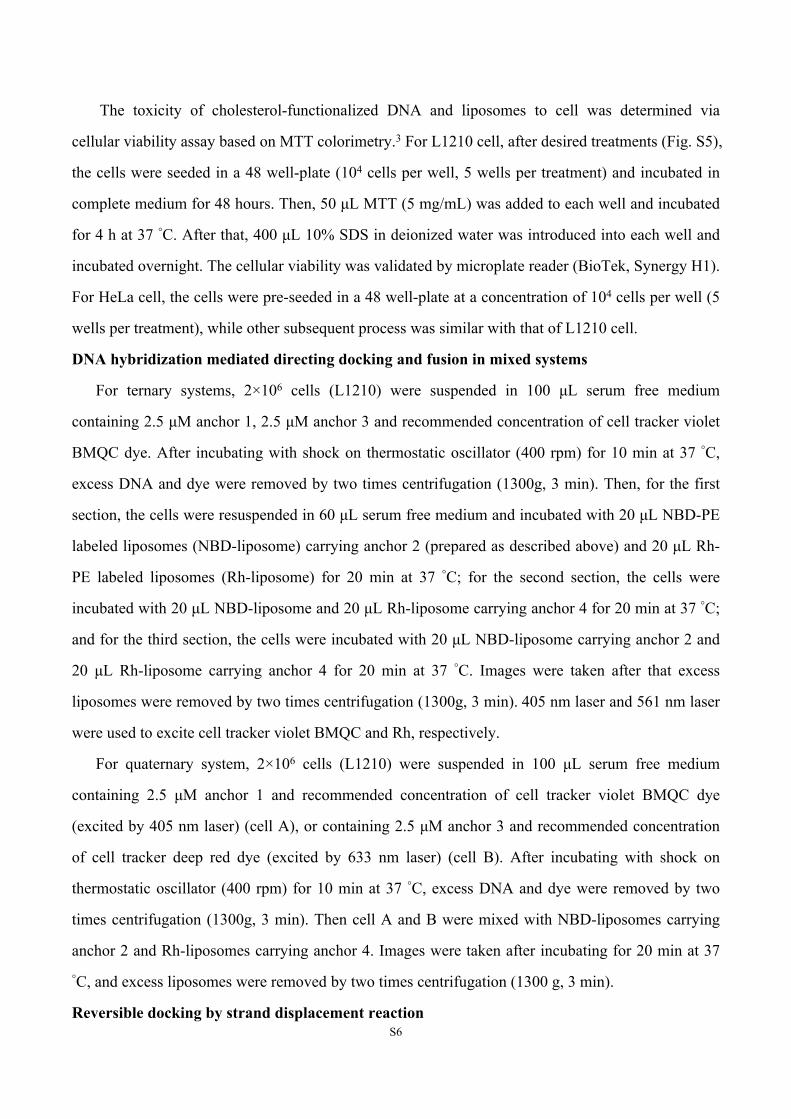
The toxicity of cholesterol-functionalized DNA and liposomes to cell was determined via
cellular viability assay based on MTT colorimetry.3 For L1210 cell, after desired treatments (Fig. S5),
the cells were seeded in a 48 well-plate (104 cells per well, 5 wells per treatment) and incubated in
complete medium for 48 hours. Then, 50 μL MTT (5 mg/mL) was added to each well and incubated
for 4 h at 37 °C. After that, 400 μL 10% SDS in deionized water was introduced into each well and
incubated overnight. The cellular viability was validated by microplate reader (BioTek, Synergy H1).
For HeLa cell, the cells were pre-seeded in a 48 well-plate at a concentration of 104 cells per well (5
wells per treatment), while other subsequent process was similar with that of L1210 cell.
DNA hybridization mediated directing docking and fusion in mixed systems
For ternary systems, 2×10⁶ cells (L1210) were suspended in 100 μL serum free medium
containing 2.5 μM anchor 1, 2.5 μM anchor 3 and recommended concentration of cell tracker violet
BMQC dye. After incubating with shock on thermostatic oscillator (400 rpm) for 10 min at 37 °C,
excess DNA and dye were removed by two times centrifugation (1300g, 3 min). Then, for the first
section, the cells were resuspended in 60 μL serum free medium and incubated with 20 μL NBD-PE
labeled liposomes (NBD-liposome) carrying anchor 2 (prepared as described above) and 20 μL Rh-
PE labeled liposomes (Rh-liposome) for 20 min at 37 °C; for the second section, the cells were
incubated with 20 μL NBD-liposome and 20 μL Rh-liposome carrying anchor 4 for 20 min at 37 °C;
and for the third section, the cells were incubated with 20 μL NBD-liposome carrying anchor 2 and
20 μL Rh-liposome carrying anchor 4 for 20 min at 37 °C. Images were taken after that excess
liposomes were removed by two times centrifugation (1300g, 3 min). 405 nm laser and 561 nm laser
were used to excite cell tracker violet BMQC and Rh, respectively.
For quaternary system, 2×10⁶ cells (L1210) were suspended in 100 μL serum free medium
containing 2.5 μM anchor 1 and recommended concentration of cell tracker violet BMQC dye
(excited by 405 nm laser) (cell A), or containing 2.5 μM anchor 3 and recommended concentration
of cell tracker deep red dye (excited by 633 nm laser) (cell B). After incubating with shock on
thermostatic oscillator (400 rpm) for 10 min at 37 °C, excess DNA and dye were removed by two
times centrifugation (1300g, 3 min). Then cell A and B were mixed with NBD-liposomes carrying
anchor 2 and Rh-liposomes carrying anchor 4. Images were taken after incubating for 20 min at 37
°C, and excess liposomes were removed by two times centrifugation (1300 g, 3 min).
Reversible docking by strand displacement reaction

S7
NBD labeled liposomes were preincubated with appropriate amounts of anchor 5 (Table S2) for
2 h to achieve an average copy number of 100 cholesterol-DNA per vesicle and a final lipid
concentration of 1 mg/mL. Then, 2×10⁶ L1210 cells in 100 μL were mixed with 2.5 μL of 100 μM
anchor 1. After incubating under shock on thermostatic oscillator (400 rpm) for 10 min at 37 °C,
excess anchor 1 was removed by two times centrifugation (1300g, 3 min). Then the anchor 1
modified cells were resuspended in 60 μL serum free medium and incubated with 40 μL anchor 5
decorated NBD labeled liposome (liposome A) for 20 min at 25 °C. After removing excess liposome
A by two times centrifugation (1300g, 3 min), the cells were suspended with 100 μL serum free
medium. Then 2.5 μL of 200 μM cDNA of anchor 5 was introduced and incubated under shock on
thermostatic oscillator (400 rpm), and at desired time point (0min, 2min, 5 min, 10 min, 15 min), 20
μL cell suspensions was taken out for confocal imaging. Control experiments without adding cDNA
of anchor 5 were performed at the same time (see Fig. S21).
Sequential docking by hybridization chain reaction
The DNA sequence design in hybridization chain reaction comes from previous report
(Supporting information, Table S3).4 NBD labeled and Rh labeled liposomes (B and C) were
preincubated with appropriate amounts of inducer strands and H2 strands (Supporting information,
Table S3), respectively, for 2h to achieve an average copy number of 100 cholesterol-DNA per
vesicle and a final lipid concentration of 1 mg/mL. Then, 2×10⁶ L1210 cells (stained by hoechst
33258) in 100 μL were mixed with 2.5 μL of 100 μM H1 strands. After incubating under shock on
thermostatic oscillator (400 rpm) for 10 min at 37 °C, excess H1 strands were removed by twice
centrifugation at 1300 g for 3 min. Then the H1 strands modified cells were resuspended in 60 μL
serum free medium and incubated with 20 μL inducer strands decorated NBD labeled liposome B
and 20 μL H2 strands decorated Rh labeled liposome C for 30 min at 37 °C. After that, excess
liposome B and C were removed and imaging the cells by confocal microscopy. 488 nm and 561 nm
laser were used to excite NBD and Rh, respectively. Control experiments with desired treatments
were performed simultaneously (see Fig. S22). Leica application suite advanced fluorescence
software and Image J were used for image analysis.
Regulating cell fate with direct cytoplasm delivery of Cytochrome C

S8
NBD labeled liposomes containing Cytochrome C were preincubated with appropriate amounts
of anchor 2 for 2h to achieve an average copy number of 100 cholesterol-DNA per vesicle and a final
lipid concentration of 1 mg/mL. After that, the same procedure as described in the membrane fusion
experiment between live cells and liposomes containing HRP was performed with L1210 cell and
HeLa cell. Then the cellular viability was determined with the procedure of MTT colorimetry as
described above. Control experiments were performed simultaneously.

S9
Supporting tables
Table S1. DNA design in membrane fusion experiments
Anchor 1: 5’-CGCAATCAGGATTCTCAACTCGTATTTT-3’-3cholesterol
Anchor 2: 3Cholesterol-5’-AAAATACGAGTTGAGAATCCTGATTGCG-3’
Anchor 1’: 5’-CGCAATCAGGATTCTCAACTCGTATTTT-3’-cholesterol
Anchor 2’: Cholesterol-5’-AAAATACGAGTTGAGAATCCTGATTGCG-3’
Anchor 3: 5’-TTTTTTTTTTTTTTTTTTTTTTTTTTTTTTTTTTT-3’-3cholesterol
Anchor 4: 3Cholesterol-5’-AAAAAAAAAAAAAAAAAAAAAAAAAAAAAAAAAAA-3’
Table S2. DNA design in strand displacement reaction
Anchor 1: 5’-CGCAATCAGGATTCTCAACTCGTATTTT-3’-3cholesterol
Anchor 5: 3Cholesterol-5’-AGAGAGAGAGAGAAAATACGAGTTGAGAATCCTGATTG
CG-3’
cDNA of anchor 5: 5’-CGCAATCAGGATTCTCAACTCGTATTTTCTCTCTCTCTCT-3’
Table S3. DNA design in hybridization chain reaction
H1 strand: 5’-
AGTCTAGGATTCGGCGTGGGTTAACACGCCGAATCCTAGACTACTTTGTT
TTT-3’-3Cholesterol
H2 strand: 3Cholesterol-5’-
TTTTTTTAACCCACGCCGAATCCTAGACTCAAAGTAGTCTAG
GATTCGGCGTG-3’
Inducer strand: 3Cholesterol-5'-TTTTTAGTCTAGGATTCGGCGTGGGTTAA-3'

S10
Supporting Figures
Fig. S1. Size distribution of the as prepared naked liposomes (a) and anchor 2 decorated liposomes
(b).
S11
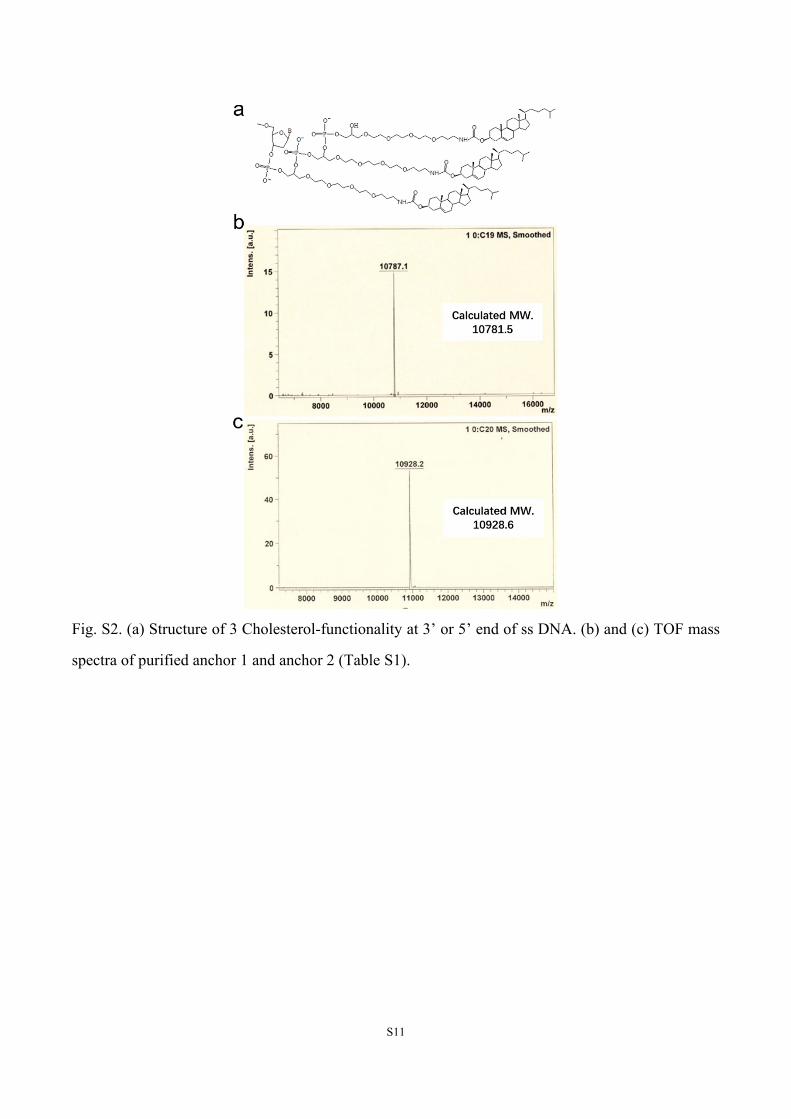
Fig. S2. (a) Structure of 3 Cholesterol-functionality at 3’ or 5’ end of ss DNA. (b) and (c) TOF mass
spectra of purified anchor 1 and anchor 2 (Table S1).

S12
Fig. S3. Confocal microscopy images showing the fluorescence of NBD-liposomes on the surface of
L1210 cells (a, c) and HeLa cells (b, d). The cells were incubated with 3 cholesterol-functionalized
DNA (anchor 1, a, b) or 1 cholesterol-functionalized DNA (anchor 1’, c, d) for 10 min, followed by
treatment with NBD-PE labeled liposomes encoded by anchor 2 (a, b) or anchor 2’ (c, d). Sale bar:
10 μm in a and c; 30 μm in b and d. (e) The mean fluorescence intensity of NBD-Liposome on the
outside surface of cells (extracted by ImageJ) in a and c.
S13
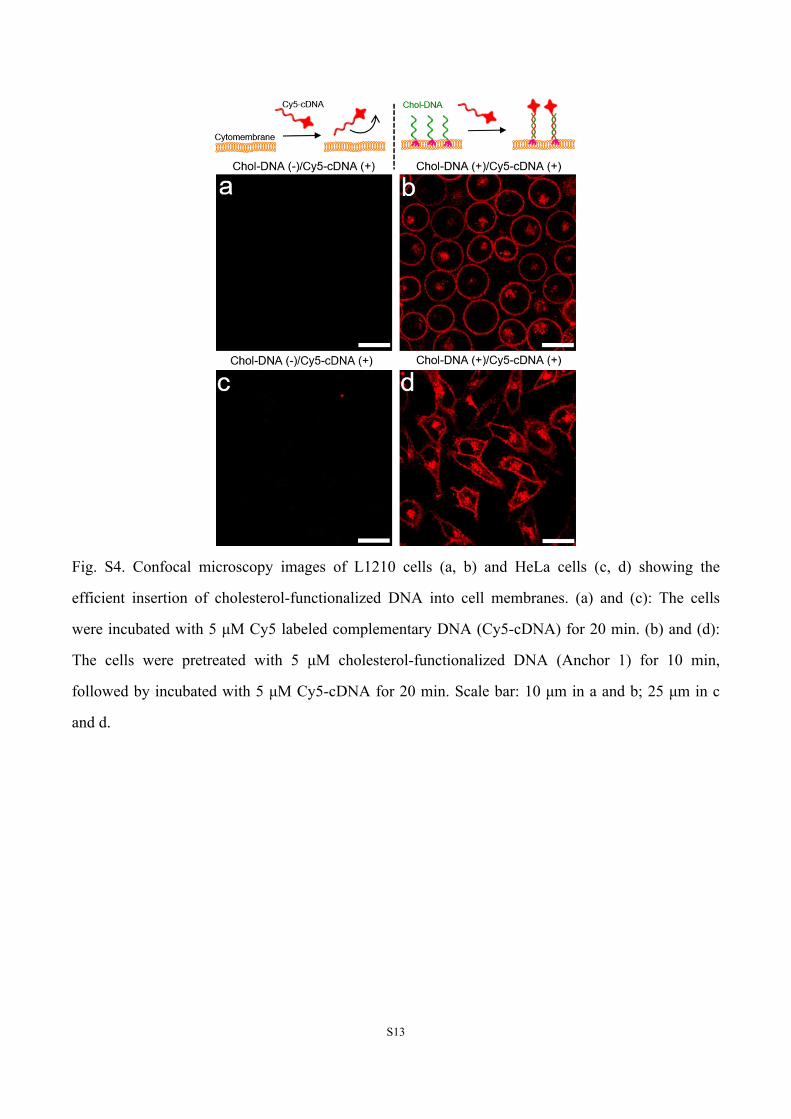
Fig. S4. Confocal microscopy images of L1210 cells (a, b) and HeLa cells (c, d) showing the
efficient insertion of cholesterol-functionalized DNA into cell membranes. (a) and (c): The cells
were incubated with 5 μM Cy5 labeled complementary DNA (Cy5-cDNA) for 20 min. (b) and (d):
The cells were pretreated with 5 μM cholesterol-functionalized DNA (Anchor 1) for 10 min,
followed by incubated with 5 μM Cy5-cDNA for 20 min. Scale bar: 10 μm in a and b; 25 μm in c
and d.

S14
Fig. S5. Viability assays of L1210 and HeLa cells after incubated with 5 μM anchor 1 for 30 min
(e1), 5 μM anchor 1 for 30 min and subsequently liposomes with final lipid concentration of 1
mg/mL for 24 h (e2), 5 μM anchor 1 for 30 min and subsequently anchor 2 encoded liposomes with
final lipid concentration of 1 mg/mL for 24 h (e3). Data are presented as the mean ± SD of 5 parallel
experiments.

S15
Fig. S6. Confocal microscopy images of L1210 cells (a) and HeLa (b) cells taken after the cells were
incubated with 20 μM Amplex Red and 500 μM H2O2 for 30 min. Red channel (a, b): fluorescence
of resorufin (product of HRP), overlay (c. d) is red channel plus bright field image. Scale bar: 15 μm
in a, 30 μm in b.

S16
Fig. S7. Confocal microscopy images of L1210 cells (a) and HeLa (b) cells taken after the cells were
incubated with 50 μM resorufin and 500 μM H2O2 for 30 min. Red channel (a, b): fluorescence of
resorufin (product of HRP), overlay (c, d) is red channel plus bright field image. Scale bar: 20 μm in
a, 30 μm in b.

S17
Fig. S8. Confocal microscopy images of L1210 cells (a, b) and HeLa cells (c, d). L1210 or HeLa
cells were preincubated with free HRP (5 M) for 30 min. After the excess HRP were removed by
wash, the cells were then incubated with Amplex Red (50 μM) and H2O2 (500 μM) for 30 min (a, c)
or 2 h (b, d). Red channel (a, b, c, d): fluorescence of resorufin (product of HRP), overlay is red
channel plus bright field image, enlarged view is a single cell from overlay channel. Scale bar: is 10
μm in a and b; 30 μm in c and d.

S18
Fig. S9. Confocal microscopy images of single L1210 (a) and HeLa cell (b) taken after membrane
fusion experiments. Green channel: fluorescence of NBD labeled liposomes, red channel:
fluorescence of resorufin (product of HRP), blue channel: nuclear stained by hoechst 33258, overlay
is green, red and blue channel plus bright field image.

S19
Fig. S10. (a) Confocal microscopy images of L1210 cells taken after membrane fusion experiments,
in which hybridization of cholesterol modified DNA was a “zipperlike” hybridization shown in inset.
(b) Confocal microscopy images of L1210 cells taken after membrane fusion experiments in which
anchor 2 was replaced by 3’ cholesterol-DNA complementary to anchor 1 for modifying liposomes
containing HRP, so that hybridization of cholesterol modified DNA was an “anti-zipperlike”
hybridization shown in inset. Green channel: fluorescence of NBD labeled liposomes, red channel:
fluorescence of resorufin (product of HRP), overlay is green and red channel plus bright field image.
Scale bar is 15 μm. (c) Result of flow cytometry showing the frequency distribution of the
fluorescence intensity of NBD-liposomes on the outside of cells under different conditions: no
hybridization, zipperlike hybridization, anti-zipperlike hybridization. (d) The fluorescence intensity
of resorufin inside the cells (extracted by ImageJ) in a and b. The above results suggested that
zipperlike hybridization is more efficient in inducing membrane fusion compared with anti-zipper
like hybridization.

S20
Fig. S11. (a) Schematic diagram of the experiment process. Confocal microscopy images of L1210
(b) and HeLa cells (c). The cells were preincubated with medium containing 5 μM anchor 1,
followed by treatment with empty liposomes (NBD labeled) carrying anchor 2 and free HRP (5 M)
for 30 min. After excess liposomes and HRP were removed, the cells were incubated with Amplex
Red (50 μM) and H2O2 (500 μM) for 30 min. Green channel: fluorescence of NBD labeled liposomes,
red channel: fluorescence of resorufin (product of HRP), overlay is green and red channel plus bright
field image, enlarged view is the fluorescent profile of single cell from overlay channel, the white
dashed circle showed a cluster spot of resorufin. Scale bar: 25 μm in b and c.

S21
Fig. S12. Confocal microscopy images of L1210 cells upon different treatments. The cells were
preincubated with medium containing 5 μM anchor 1 (a) or medium (b and c), followed by treatment
with liposomes containing HRP (a and c), anchor 2 modified liposomes containing HRP (b). After
excess liposomes and HRP were removed, the cells were incubated with Amplex Red (50 μM) and
H2O2 (500 μM) for 30 min. Green channel: fluorescence of NBD labeled liposomes, red channel:
fluorescence of resorufin (product of HRP), blue channel: nuclear stained by hoechst 33258, overlay
is green, red and blue channel plus bright field image, enlarged view is a single cell from overlay
channel. Scale bar: 20 μm.

S22
Fig. S13. Confocal microscopy images of HeLa cells upon different treatments. The cells were
preincubated with medium containing 5 μM anchor 1 (a) or medium (b and c), followed by treatment
with liposomes containing HRP (a and c), anchor 2 modified liposomes containing HRP (b). After
excess liposomes and HRP were removed, the cells were incubated with Amplex red (50 μM) and
H2O2 (500 μM) for 30 min. Green channel: fluorescence of NBD labeled liposomes, red channel:
fluorescence of resorufin (product of HRP), blue channel: nuclear stained by hoechst 33258, overlay
is green, red and blue channel plus bright field image, enlarged view is a single cell from overlay
channel. Scale bar: 30 μm.

S23
Fig. S14. Confocal microscopy images of L1210 cells (a-c) and Hela (d-f) cells. (a) and (d) The cells
were not pretreated with inhibitor and incubated with Rh-PE labeled liposomes (Rh-liposome) for 30
min. (b) and (e) The cells were pretreated by CPZ, then incubated with Rh-liposome and CPZ for 30
min. (c) and (f) The cells were pretreated by MβCD, then incubated with Rh-liposome. Red channel:
fluorescence of Rh-liposome, overlay is red channel plus bright field image. Scale bar: 20 μm in a-c;
40 μm in d-f.

S24
Fig. S15. (a) Schematic diagram of the experiment process. Confocal microscopy images of L1210
cells (b-e) and Hela (f-i) cells. The cells were preincubated with CPZ (b, f) or MβCD (c, g), followed
by treatment with 10 μM resorufin. CPZ (d, h) or MβCD (e, i) treated cells were preincubated with 5
μM free HRP for 30 min, followed by treatment with Amplex red (50 μM) and H2O2 (500 μM) for
30 min. Red channel: fluorescence of resorufin, overlay is red channel plus bright field image. Scale
bar: is 30 μm in b-i.

S25
Fig. S16. (a) Schematic diagram of the experiment process. Confocal microscopy images of L1210
cells (b, c) and HeLa cells (d, e). CPZ (b, d) or MβCD (c, e) treated cells were preincubated with 5
μM anchor 1 for 10 min, followed by treatment with empty liposomes carrying anchor 2 and 5μM
free HRP for 30 min. After excess liposomes and HRP were removed, the cells were incubated with
Amplex Red (50 μM) and H2O2 (500 μM) for 20 min. Green channel: fluorescence of NBD labeled
liposomes, red channel: fluorescence of resorufin, overlay is green and red channel plus bright field
image. Scale bar is 10 μm in b and c; 20 μm in d and e.

S26
Fig. S17. Confocal microscopy images of L1210 cells upon different treatments. The cells were
preincubated with medium containing 5 μM anchor 1 (a) or medium (b), followed by treatment with
anchor 2 modified Rh-PE labeled liposomes (Rh-liposomes) for 30 min. Images were taken after
removing excess liposomes. Red channel: fluorescence of Rh-liposomes, overlay is red channel plus
bright field image. Scale bar: 25 μm. There exists strong fluorescence of Rh-liposomes on cell
membranes through DNA hybridization (a). We did not observe comparable fluorescence of Rh in
(b), although the bare Rh-liposome is large excess, which was attributed to the limited uptake ability
of cells.

S27
Fig. S18. Confocal microscopy images of HeLa cells upon different treatments. The cells were
preincubated with medium containing 5 μM anchor 1 (a) or medium (b), followed by treatment with
anchor 2 modified Rh-liposomes for 30 min. Images were taken after removing excess liposomes.
Red channel: fluorescence of Rh-liposomes, overlay is red channel plus bright field image. Scale bar:
30 μm. There exists strong fluorescence of Rh-liposomes on cell membranes through DNA
hybridization (a). We did not observe comparable fluorescence of Rh in (b), although the bare Rh-
liposome is large excess, which was attributed to the limited uptake ability of cells.
S28
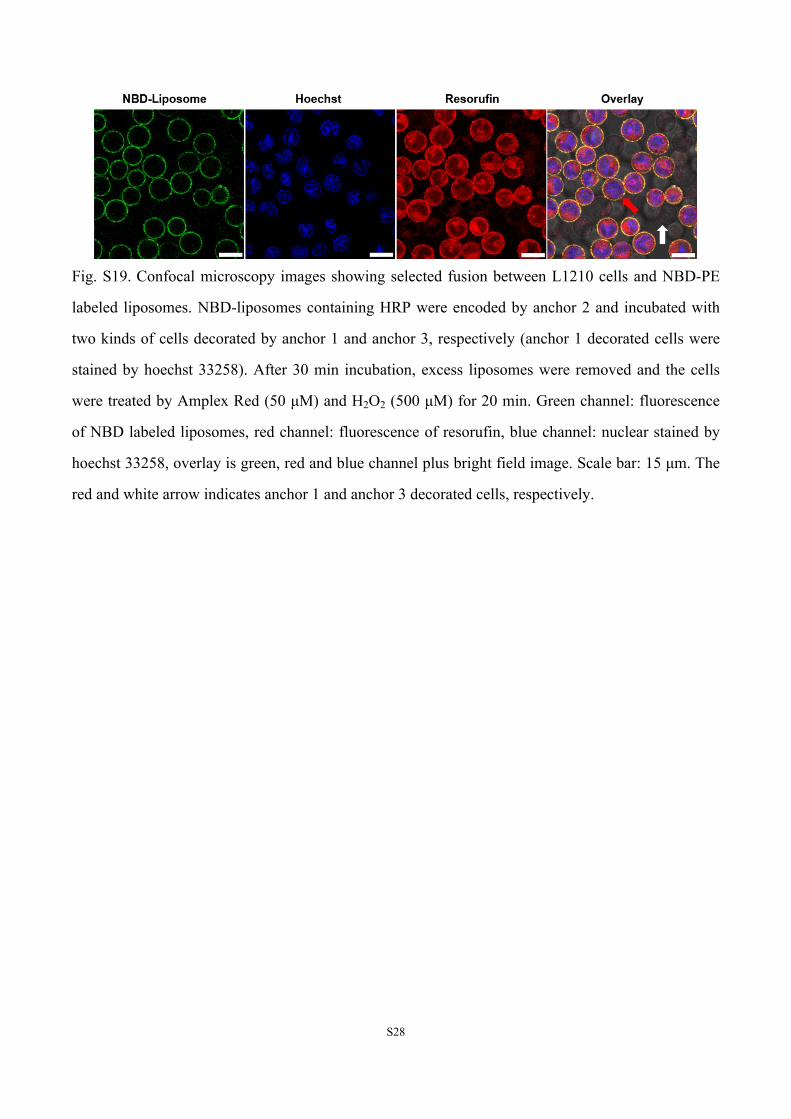
Fig. S19. Confocal microscopy images showing selected fusion between L1210 cells and NBD-PE
labeled liposomes. NBD-liposomes containing HRP were encoded by anchor 2 and incubated with
two kinds of cells decorated by anchor 1 and anchor 3, respectively (anchor 1 decorated cells were
stained by hoechst 33258). After 30 min incubation, excess liposomes were removed and the cells
were treated by Amplex Red (50 μM) and H2O2 (500 μM) for 20 min. Green channel: fluorescence
of NBD labeled liposomes, red channel: fluorescence of resorufin, blue channel: nuclear stained by
hoechst 33258, overlay is green, red and blue channel plus bright field image. Scale bar: 15 μm. The
red and white arrow indicates anchor 1 and anchor 3 decorated cells, respectively.

S29
Fig. S20. (a) and (b) Confocal microscopy images of L1210 and HeLa cells. The cells were
preincubated with 40 μM cationic amphiphilic peptides and 5 μM HRP in serum free medium for 30
min at 37 ℃, then incubated with Amplex Red (50 μM) and H2O2 (500 μM) for 30 min after
removing excess cationic amphiphilic peptides and HRP. Images were taken after washing 3 times.
Red channel: fluorescence of resorufin (product of HRP), overlay is red channel plus bright field
image. Scale bar: is 20 μm in a, 25 μm in b. (c) The sequence of the reported cationic amphiphilic
peptides and HPLC analysis results of the synthetic peptides.

S30
Fig. S21. (a) Schematic diagram of the experiment process. (b) Confocal microscopy images
showing the fluorescence on the outside of L1210 cells. Cells carrying anchor 1 were incubated with
NBD-labeled liposome A carrying anchor 5 (Supporting information, Table S2) for 30 min, after
removing excess liposomes by centrifugation, confocal imaging were performed at indicated time.
Scale bar:15 μm.

S31
Fig. S22. Confocal microscopy images of L1210 cells. (a) Cells carrying H1 strands were incubated
with NBD labeled liposome B carrying inducer strands and Rh-PE labeled liposome C (fig. a, inset).
(b) Cells carrying H1 strands were NBD-PE labeled liposomes carrying inducer strands and Rh
labeled liposomes carrying H2 strands (fig. b, inset). Scale bar:15 μm in a and b.

S32
Reference:
1 G. Stengel, R. Zahn and F. Hook, J. Am. Chem. Soc. 2007, 129, 9584-9585.
2 Y. H. M. Chan, B. van Lengerich, and S. G. Boxer, Proc. Natl. Acad. Sci. U. S. A. 2009, 106, 979-
984.
3 Y. Han, X. Li, H. Chen, X. Hu, Y. Luo, T. Wang, Z. Wang, Q. Li, C. Fan, J. Shi, L. Wang, Y.
Zhao, C. Wu and N. Chen, ACS Appl. Mater. Interfaces 2017, 9, 21200-21208.
4 R. M. Dirks and N. A. Pierce, Proc. Natl. Acad. Sci. U. S. A. 2004, 101, 15275-15278