melbourne it ltd (asx: mlb) 2017 annual report and ... · 4/26/2018 · melbourne it group is a...
TRANSCRIPT

Melbourne IT Ltd
ABN 21 073 716 793 ACN 073 716 793 Level 4, 1-3 Smail Street Ultimo NSW 2007 Australia www.melbourneit.info
26 April 2018 MELBOURNE IT LTD (ASX: MLB)
2017 Annual Report and Corporate Governance Statement
Following is the 2017 Annual Report for the year ended 31 December 2017, which will be sent to all shareholders today. The Annual Report will also be accessible from our corporate website at http://melbourneit.info/investor-centre/annual-reports. The Corporate Governance Statement, together with the Appendix 4G, is also enclosed. This Statement will also be accessible from the Corporate Governance page of our website at http://melbourneit.info/investor-centre/corporate-governance. Fraser Bearsley Company Secretary E: [email protected] T: +61 3 9628 3658 M: +61 411 028 561 ENDS. About Melbourne IT
Melbourne IT Group is a publicly listed company with offices in Melbourne, Sydney, Brisbane, and Auckland.
Melbourne IT has approximately 850 staff and operates two businesses marketed under 8 brands.
The Small and Medium Business Division (SMB) is Australia’s largest domains and hosting business with revenues of approximately $100m and 300 staff. The SMB business operates under the Melbourne IT, WebCentral, Netregistry, WME, Domainz and TPP brands.
The Enterprise Services Business (ES) is Australia’s leading provider of digital solutions to large enterprises and government organisations with revenues of approximately $95m and 430 staff. ES is based in Sydney, Melbourne and Brisbane and has a blue chip customer base. It operates under three brands, Melbourne IT, Infoready and Outware.
Visit: www.melbourneit.com.au F
or p
erso
nal u
se o
nly
2017
Melbourne ITGroup
For
per
sona
l use
onl
y
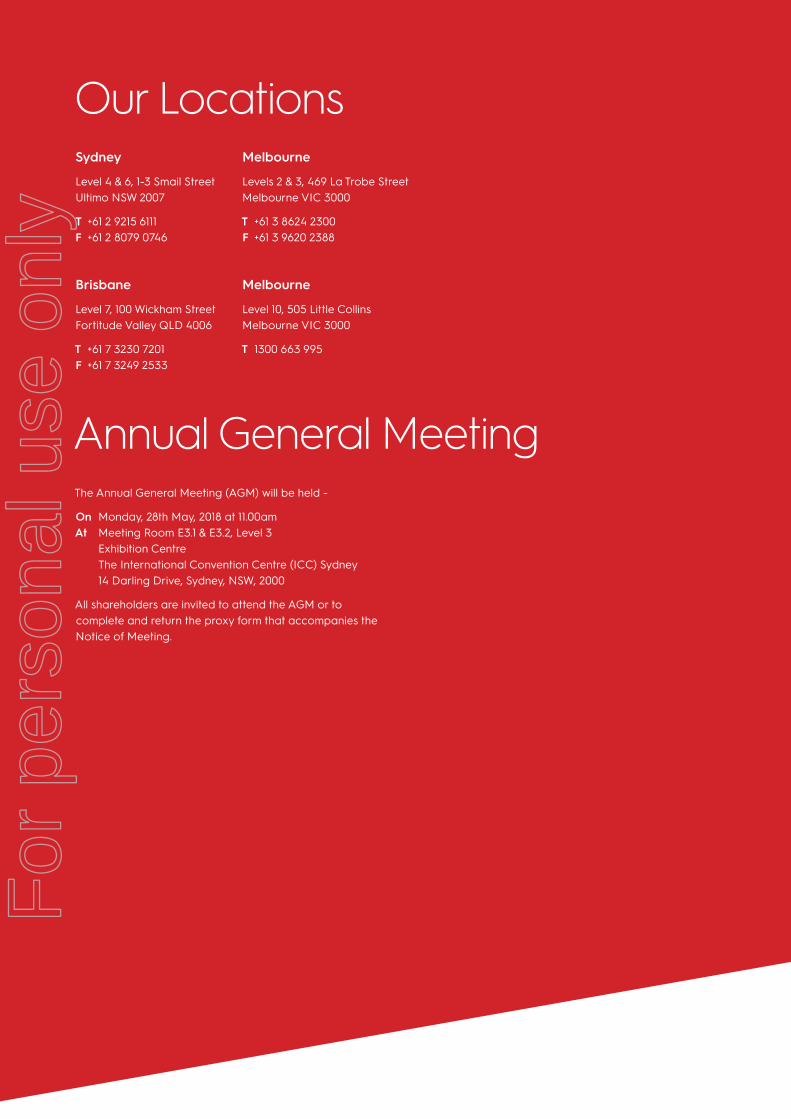
Sydney
Level 4 & 6, 1-3 Smail Street Ultimo NSW 2007
T +61 2 9215 6111 F +61 2 8079 0746
Melbourne
Levels 2 & 3, 469 La Trobe Street Melbourne VIC 3000
T +61 3 8624 2300 F +61 3 9620 2388
Melbourne
Level 10, 505 Little Collins Melbourne VIC 3000
T 1300 663 995
Brisbane
Level 7, 100 Wickham Street Fortitude Valley QLD 4006
T +61 7 3230 7201 F +61 7 3249 2533
Our Locations
Annual General MeetingThe Annual General Meeting (AGM) will be held -
On Monday, 28th May, 2018 at 11.00am At Meeting Room E3.1 & E3.2, Level 3 Exhibition Centre The International Convention Centre (ICC) Sydney 14 Darling Drive, Sydney, NSW, 2000
All shareholders are invited to attend the AGM or to complete and return the proxy form that accompanies the Notice of Meeting.
For
per
sona
l use
onl
y
Financial Highlights of 2017
Chair’s Review
CEO’s Report
SMB Solutions
Enterprise Services
Brand, People & Culture
Board of Directors
Directors’ Report & Financial Statements
Notes to the Financial Statements
Independent Auditor’s Report
Auditor’s Independence Declaration
ASX Additional Information
Contents
17
2
4
6
8
12
16
20
26
64
134
139
140
For
per
sona
l use
onl
y

Financial HighlightsOver the past four years, Melbourne IT has focused on growth and transformation. These efforts paid off in 2017, with strong returns across the company in both our SMB and Enterprise Services divisions.
of 2017
Revenue ($m)
Revenue has increased by 17% in 2017, and has increased by a compounded annual growth rate of 18% from 2013 to 2017.
Underlying EBITDA ($m)
Melbourne IT’s preferred method of profitability is underlying EBITDA (Earnings Before Interest, Taxation, Depreciation and Amortisation), which adjusts for one-off and non-recurring items and the pro forma impacts of acquisitions and divestments made in the financial period. Underlying EBITDA has increased by 36% in 2017, and has increased by a compounded annual growth rate of 61% from 2013 to 2017.
H2H1
Melbourne IT Group Annual Report 20172
For
per
sona
l use
onl
y

Acquisition of WMEIn May 2017, SMB gained critical capability in digital marketing for small and medium enterprises, as well as an established and highly effective account management capability through the purchase of WME. We acquired 100% of this leading provider of online marketing solutions for small and medium business customers for $38.7 million. With more than 130 employees across Australia and New Zealand, WME now operates within the SMB division, enhancing its ability to grow average revenue per user (ARPU).
The Group declared and paid an interim dividend of 3.5 cents per ordinary share, and declared a final dividend of 7.5 cents for 2017, an increase of 38%
over the prior year. Both the interim and final dividend are fully franked (100%
franked in the prior year).
11.0cents
Dividend CPS
Dividend CPS (Cents per Share) has increased by 38% in 2017, and has increased by a compounded annual growth rate of 30% from 2014 to 2017. A one-off special dividend of 25.0 CPS was paid in 2013 following the divestment of the Group’s DBS business unit. No other dividend was paid to shareholders in that year.
Underlying EPS (cents)
Underlying EPS (Earnings per Share) presents earnings per share after adjusting for one-off and non-recurring items, and the pro forma impact of acquisitions and divestments made in the financial period. Underlying EPS has increased by 20% in 2017, and has increased by a compounded annual growth rate of 23% from 2013 to 2017.
Melbourne IT Group Annual Report 2017 3
For
per
sona
l use
onl
y
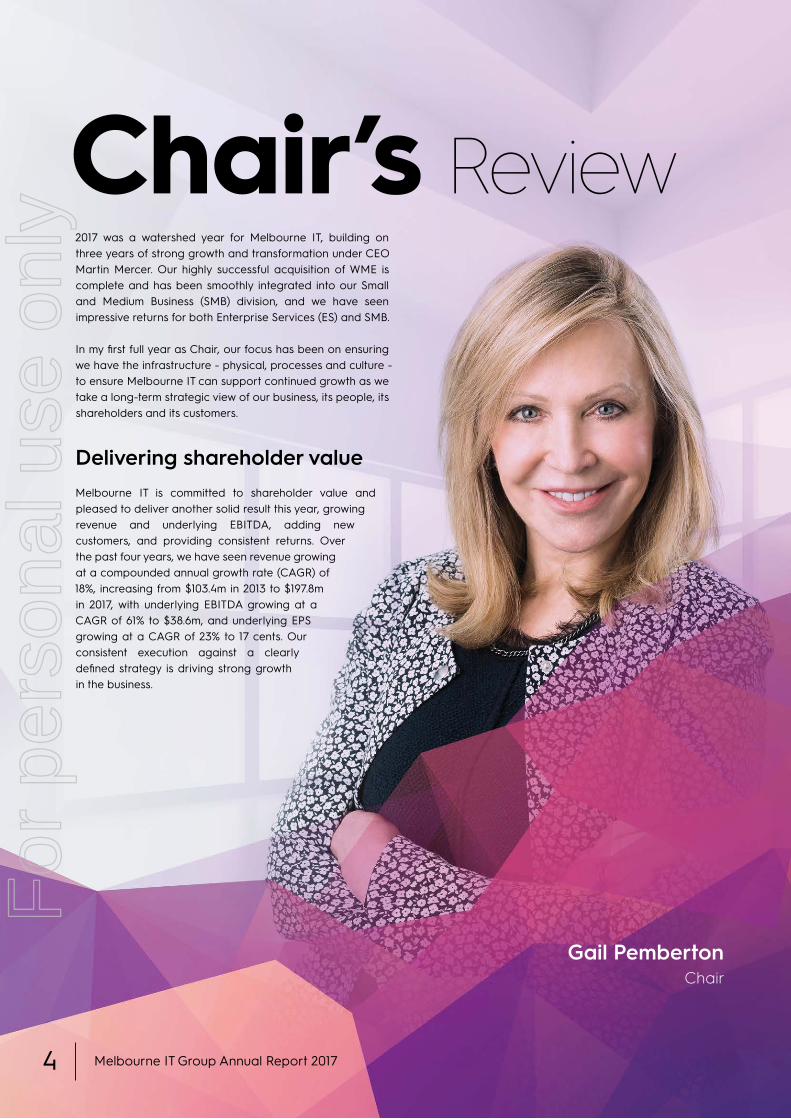
Gail Pemberton Chair
Chair’s Review 2017 was a watershed year for Melbourne IT, building on three years of strong growth and transformation under CEO Martin Mercer. Our highly successful acquisition of WME is complete and has been smoothly integrated into our Small and Medium Business (SMB) division, and we have seen impressive returns for both Enterprise Services (ES) and SMB.
In my first full year as Chair, our focus has been on ensuring we have the infrastructure - physical, processes and culture - to ensure Melbourne IT can support continued growth as we take a long-term strategic view of our business, its people, its shareholders and its customers.
Delivering shareholder valueMelbourne IT is committed to shareholder value and pleased to deliver another solid result this year, growing revenue and underlying EBITDA, adding new customers, and providing consistent returns. Over the past four years, we have seen revenue growing at a compounded annual growth rate (CAGR) of 18%, increasing from $103.4m in 2013 to $197.8m in 2017, with underlying EBITDA growing at a CAGR of 61% to $38.6m, and underlying EPS growing at a CAGR of 23% to 17 cents. Our consistent execution against a clearly defined strategy is driving strong growth in the business.
Melbourne IT Group Annual Report 20174
For
per
sona
l use
onl
y

As we complete our transition to a solutions business, we have maintained revenue quality, in the form of recurring annuity income and repeatable project revenue.
Considering the pleasing financial result for 2017, the Board of Melbourne IT has supported a 38% increase in our dividend to 11.0 cents per share ( fully franked).
Culture and growthThe culture at Melbourne IT is highly collaborative and is something we value immensely. Over 2017, we put a lot of effort into cultivating a positive and engaged workforce that not only enhances our employee value proposition, but also benefits the bottom line. Technology is a fast-moving industry and in order to continue to grow our workforce, and to attract and retain highly-skilled employees, we must invest in the right processes and platforms to support this. We recognise that our people are our greatest asset and our goal is to lift engagement to the highest level possible. We are well on track to achieve this.
During 2017, we also undertook a comprehensive review of our remuneration framework. The new remuneration and incentive structure will better align the interests of executives with those of shareholders, while allowing Melbourne IT to attract and retain top talent in a highly competitive market. It means we can deliver both strong shareholder value and a robust employee value proposition. It also offers flexibility, simplicity and transparency in our remuneration instruments.
The new framework is outlined in the Remuneration Report (page 52) and will be launched in 2018.
Cohesive brand strategyAs part of our commitment to having a compelling employee value proposition, as well as completing our transformation, the Board is delivering on its commitment to a new brand for Melbourne IT. Thanks to a highly-consultative process at all
levels of the organisation, the new look and feel - as well as the new name - has strong buy-in among staff, many of whom transitioned to Melbourne IT due to acquisitions and mergers. It will allow us to focus on what we are today, not what we were in the past.
The new brand will be launched at the Annual General Meeting, and I speak for the Board when I say we are very excited to reveal what we believe will be a unifying force as we move into the future.
Board refreshWe completed the board refresh,
which started in 2016, with the aim of bringing in the
right skills to support management for the
next chapter of the company’s growth. To that end, we welcomed Andrew Macpherson, who brings with him three decades of experience in enterprise services, and Simon Martin,
whose financial acumen strengthens
the Board’s merger and acquisition
capability.
Looking ahead2018 is shaping up to be another exciting
year. Not only are we launching our new brand and remuneration framework, but also we will be moving into larger and more modern premises in both Melbourne and Sydney, and strengthening our infrastructure to support the growing business.
Our continued investment in infrastructure is vital to ensure Melbourne IT is not only better positioned to partner with customers, but also a great place to work, now and well into the future.
As I mentioned in last year’s Annual Report, I am passionate about supporting Australian businesses who have innovation and technology as part of their core value proposition, and I am a strong believer in an inclusive and collaborative culture.
I thank CEO Martin Mercer, the executive, and all the Melbourne IT team for joining me and the Board on this journey to become a truly united company that is the best in its class.
“This sustained focus on the financial,
operational and cultural health of our company is transforming the business and delivering significant value to shareholders.”
For
per
sona
l use
onl
y

CEO’s Report
Martin Mercer Managing Director and CEO
A retrospective Over the past four years, the team at Melbourne IT has orchestrated a “root and branch” renovation & re-imagina-tion of our business.
Four short years ago, there were approximately 280 people in our business selling domain names and flavours of hosting. Today, we employ more than 800 people and most of them are working on projects, and performing roles that did not exist four years ago.
The changes are probably most evident in our ES division, which has changed from a team of 70 people selling hosting solutions and cloud managed services to a team of more than 400 supporting the largest corporate and government organisations in their transition to digital. Melbourne IT is arguably the leading provider of digital solutions to Australia’s largest organisations with widely recognised expertise in mobile, data and analytics, and cloud and security. This part of our business is enjoying organic growth of more than 25% pa and we expect to welcome more than 190 people into ES in 2018.
Melbourne IT Group Annual Report 20176
For
per
sona
l use
onl
y

While the changes in our SMB division are less obvious, they are no less significant. Over the past four years, the number of people working in SMB has grown by 53% to 248 people. And while the legacy products in domains and hosting still contribute the majority of the revenue and profit in SMB, our new managed marketing services have been growing at more than 40% pa and already account for more than 25% of total SMB Direct revenues. As these new solutions revenues become a larger and larger proportion of the total revenue in SMB, the growth in SMB will steadily accelerate.
Moreover, our SMB division has enjoyed very strong profit growth in the past few years on the back of savings realised from the integration of the acquired hosting businesses of Netregistry (February 2014) and Uber Global (April 2015). The integration of these businesses is now complete, and annualised savings of $10m have been realised.
Acquisitions have played a key part in the rapid reinvention of both ES and SMB. Over the past four years we have made five acquisitions including the acquisition of WME (the Australian leader in search engine optimisation services for small and medium businesses) in 2017. These acquisitions have been integrated into our operational business and are delivering the anticipated benefits. All of them have been highly accretive, and we are establishing a reputation for acquiring and integrating well.
The fruits of this rebuilding can be seen in the results of the past four years. In 2017, we delivered underlying EBITDA of $38.6m, representing year-on-year growth of 36%. The compound annual growth rate over the past four years has been 61%. Similarly, underlying Net Profit After Tax (NPAT) and underlying EPS have grown strongly over this four-year period. In terms of outcomes for shareholders, over this four-year period our market capitalisation is up more than 200%, and total shareholder return has averaged more than 40% pa. In 2017 alone, our share price almost doubled and total shareholder return was 90%.
In short, the team at Melbourne IT have delivered the plan that was articulated four years ago and in the process have restored the foundations of the business, delivered strong returns to shareholders, and set the business on a path to sustainable profit growth.
Looking aheadOur business has evolved from a platform business to one that scales with people. The solutions and services that are driving the strong growth of recent years are developed by people, delivered by people, and supported by people. In 2017, approximately 300 new people joined our business; and in 2018, we expect to welcome another 300 to 350 people.
Our evolution to a “people business” means that the focus we have had in previous years on building a dynamic organisation populated by committed people with a passion for delivering exceptional outcomes for customers and shareholders must intensify. The imperative of attracting, developing and retaining talented people while creating a vibrant workplace becomes even more acute. In this vein, I am pleased to report that our measured staff engagement grew very strongly in 2017, but there is still more to be done.
This will be a major focus for us this year and it traverses all those territories – remuneration and benefits, brand, culture, premises and platforms – that together will make us a destination for talent.
At our AGM, we will be unveiling a new brand for our business. While the Melbourne IT brand has a strong legacy, it no longer reflects what the business does. Moreover, a substantial share of our people have joined us through acquisition and do not identify with the Melbourne IT brand. The brand is confusing for customers, impedes our ability to recruit the talent we need for the existing and future business, and has legacy connotations that discourage potential investors from re-examining the investment case. It is time for a new brand and a simplified, contemporary brand structure that is aligned to our evolving business, one that:
• makes sense to our customers, investors and partners
• unites our people
• differentiates us from our competitors, and
• unshackles us from our past.
Coincidentally, we have outgrown our existing premises in Melbourne and Sydney – we are literally bulging at the seams – and we will be moving into new office space. This presents a wonderful opportunity at a critical moment to reinforce the re-branding and to also create a contemporary workspace that is flexible enough to meet our new agile and highly collaborative ways of working.
The re-branding and the office move create the ideal circumstances in which we can accelerate the cultural integration of all of the acquired businesses, an essential prerequisite to really capturing the revenue synergies from such integration. Together with a focus on hygiene factors such as market-competitive remuneration and the core platforms to enable us to recruit and on-board people at scale, it will form the “platform” that enables us to sustain this rapid growth.
A sustained focus on the financial, operational and cultural health of our company is transforming the business and delivering significant value to shareholders.
Melbourne IT Group Annual Report 2017 7
For
per
sona
l use
onl
y

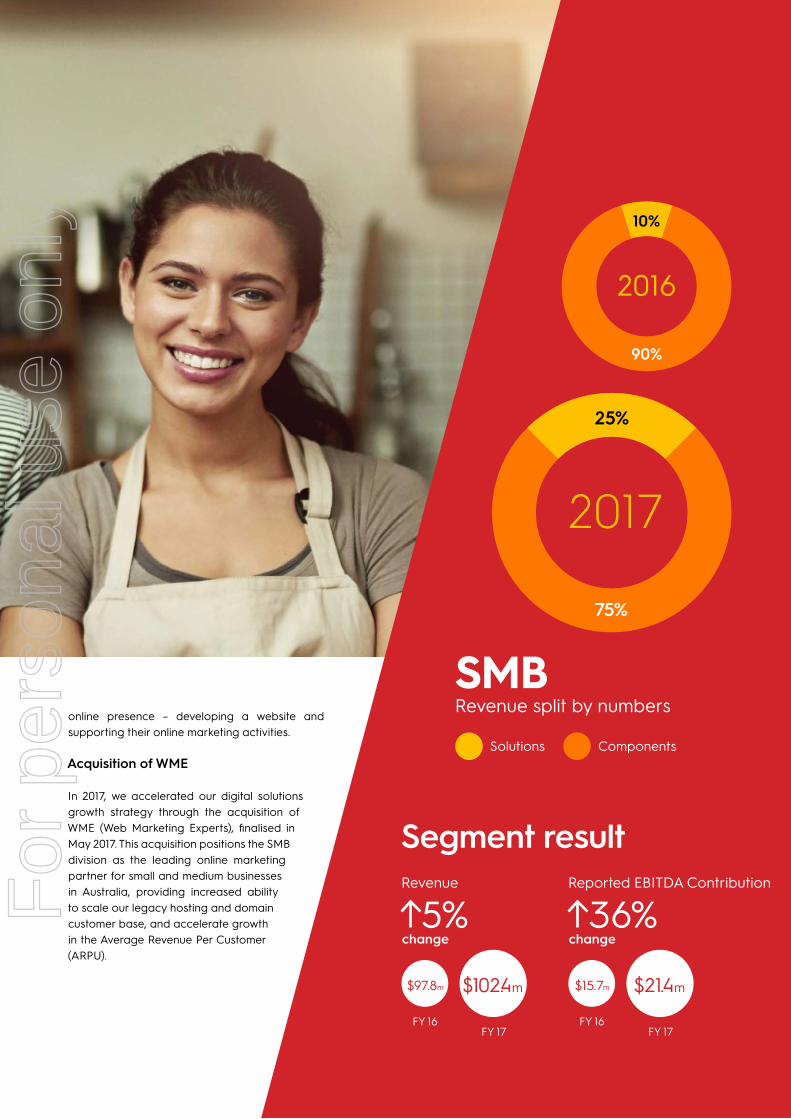
2017 was a year of strong growth in the SMB division, with revenue increasing 5% and reported EBITDA increasing 36%. These strong results validate our strategy of being the leading provider of online marketing services for Australian small businesses, with more than 500,000 businesses already benefiting from our solutions.
The SMB team provides these valuable and valued businesses the tools they need to grow and thrive online - from websites that Google and customers love, to managed marketing, email and online campaigns that boost their digital presence and help them remain visible in an increasingly noisy market.
When it comes to domains and hosting, Melbourne IT has approximately 40% market share of volume and 50% of revenue. Our strategy has always been to leverage this base into managed online solutions, from website design and
development, to creating high-performing digital campaigns across email, social and search engine marketing.
2017 HighlightsStrong revenue and EBITDA growth
Solutions revenue growth remained strong, growing at 194% vs the prior corresponding period, bolstered by the acquisition of WME in May. Revenue from our digital marketing services is now contributing 25% of direct SMB Revenue, up from 10% in 2016.
The realisation of strong operational efficiencies drove a substantial improvement in profitability, highlighted in reported EBITDA growth of 36%.
This growth supports our long-held view that there is a large market opportunity to support small businesses with their
SMB SOLUTIONS
Melbourne IT Group Annual Report 20178
For
per
sona
l use
onl
y
online presence – developing a website and supporting their online marketing activities.
Acquisition of WME
In 2017, we accelerated our digital solutions growth strategy through the acquisition of WME (Web Marketing Experts), finalised in May 2017. This acquisition positions the SMB division as the leading online marketing partner for small and medium businesses in Australia, providing increased ability to scale our legacy hosting and domain customer base, and accelerate growth in the Average Revenue Per Customer (ARPU).
SMBRevenue split by numbers
Solutions Components
75%
25%
10%
2016
90%
2017
FY 16FY 17
$97.8m $102.4m
5% change
Revenue
36% change
Reported EBITDA Contribution
FY 16FY 17
$15.7m $21.4m
Segment result
For
per
sona
l use
onl
y

By integrating WME’s world-class account management operating model and leading product offerings into Melbourne IT, we are better placed to support Australian small businesses with their online presence, and help them succeed in the ever-more cluttered market. With a full suite of services, we can host and build their website, deliver their marketing campaign across a range of online channels, and ultimately help our customers grow their business.
Completed integration program
The key to our continued success lies in gaining a deep understanding of our customer base so that we can engage and support them in a more personalised way. We need to know which industries they work in, how large their businesses are, who their target market is and what their online marketing priorities are.
To that end, in 2017, we completed the integration program, consolidating our large customer base - some legacy customers, some who came to us via acquisitions - onto a single platform. This not only enabled us to provide these customers a better experience, but also gave us the information we needed to help us better understand them and their needs.
This means we can talk to them about solutions and industry trends that are relevant to them, so that when they are ready for their next online marketing solution, we are front of mind.
In the process, we also realised $10m of annualised synergy savings.
Legacy business stabilised
Over the past few years, Melbourne IT has completely transformed from what was historically a hosting and domains business to a full-service online marketing and digital solutions business.
We have successfully stabilised our legacy business, and strong pricing yields on these domains and hosting services mean we are able to invest in our growth business of digital marketing services. Additionally, as an increasing proportion of our revenue comes from our solutions products, we are not exposed to the slowing market in these legacy portfolios.
A final highlight for 2017 was the increased employee engagement scores across the SMB teams. At 61%, this was a significant increase on last year.
Outlook for 2018Our priority in 2018 is to drive a significant acceleration in the solutions business helping more small businesses with their online journeys. To achieve this, we are focused on two key areas: how we help our customers understand our products and services; and how we engage with, and learn more about, our customers.
We understand that for many small business owners, the world of online marketing can be confusing. We may
as well be speaking a foreign language when we use jargon and acronyms such as as
PPC (Pay-Per-Click) and SEO (Search Engine Optimisation). To that end,
we will be repositioning our product and service portfolio
by speaking in language our customers understand and selling outcomes, not acronyms. It will also enable us to provide better packages, tailor our online marketing options and give customers simple,
straightforward solutions to grow their online business
and boost their bottom line.
This revolutionary approach to our product offering will help drive
the outcomes that businesses need to acquire new customers or better engage with
their existing customers.
The second key focus is to engage more deeply with our customers to help them be successful with their digital marketing campaigns. We will expand our existing account management capability more broadly across our high value customers in all brands.
With dedicated account managers and online marketing subject matter experts, we will be able to deliver exceptional web solutions and marketing campaigns, ensuring they are delivering tangible outcomes for these high-value customers.
With our strong growth in 2017 and focused plans for 2018, the SMB division will continue to build our legacy business and firmly establish ourselves as the leading provider of marketing solutions for small businesses across Australia.
“The revolutionary approach to our
product offering will help drive the outcomes that
businesses need.”
Melbourne IT Group Annual Report 201710
For
per
sona
l use
onl
y

SMB CASE STUDY
MY GARDEN CAREMelbourne IT customer and small business, My Garden Care, has grown over the past few years from a small side-hustle into a growing garden care business, thanks to our SMB division’s digital marketing strategies.
When Max Turkkan launched My Garden Care some four years ago, he started with a simple website, with hosting and a domain name. That soon developed into a more user-friendly site, with an online enquiry form, a clear sales funnel and an attractive look and feel.
After dipping his toes in the online world, Max’s relationship with Melbourne IT now covers digital marketing channels such as Pay-Per-Click advertising (Google AdWords) and social media marketing.
“They take care of everything, I just say yes or no, which is good. I don’t like sitting in front of a computer, so I like the aspect of someone taking care of the online marketing side,” Max said.
This marketing activity has been so successful that he has had to pause both campaigns while he catches up with work and goes on a much-needed holiday, proving that digital marketing offers impressive return on investment.
Melbourne IT measures the success of the campaigns, and Max receives a weekly report, which means it is easy to see what is working and adjust campaigns on the move.
Max’s business now has a solid online presence, including a healthy social media following and steady website traffic thanks to Pay-Per-Click advertising. The next step is to develop an e-commerce platform on the My Garden Care website, allowing Max to scale his business and generate additional income through offering an online marketplace for complementary businesses to sell their products.
“Most people are looking for things through Google and websites. Yellow Pages are a thing of the past these days, so you have to grow with the times.”
Melbourne IT Group Annual Report 2017 11
For
per
sona
l use
onl
y

2017 was a year of strong organic growth for Enterprise Services, with revenue up 35%, earnings up by 18%, and staff numbers increasing from 286 to 404, validating our strategic focus on designing, building and managing the most impactful digital products that our customers take to market.
Our customers demand the latest digital products to engage and interact with their consumers for their own competitive edge, and turn to a partner that can design, build and evergreen these new products. As a result, we have continued to secure significant new customer wins in 2017.
In this fast-moving consumer world, if a digital product does not have enough functionality or utility and it isn’t simple to use, consumers will look elsewhere.
The fact that we are so strong in both design and enterprise development capabilities means we build fully-featured products that are simple, intuitive and easy to use. It is that combination that gives us the edge in the market.
Put simply, we design, build and provide ongoing evergreening of the digital products that our clients provide to their customers. We pride ourselves on our long-term relationships and our ability to deliver truly standout digital products at scale.
In fact, many of our key clients have worked with us on more than one product; and as a result have given their customers access to intuitive, flexible, well-designed and functional new services.
ES ENTERPRISESERVICES
Melbourne IT Group Annual Report 201712
For
per
sona
l use
onl
y

2017 HighlightsContinued strong growth
Enterprise Services has capitalised on its impressive 2016 results, with revenue growth of 35% and over 40% increase in staff numbers.
In 2017, revenue grew 35% to $95.3m, while EBIDTA grew 18% to $17.3m as more and more high-end government and corporate clients recognised the need to innovate in order to remain competitive.
ESRevenue split by numbers
Multi Practice Customers
Single Practice Customers
34%
66%
31%
2016
69%
2017
FY 16FY 17
$70.4m $95.3m
35% change
Revenue
18% change
Reported EBITDA Contribution
FY 16FY 17
$14.6m $17.3m
Segment result
For
per
sona
l use
onl
y
Customer acquisition and retention remained healthy, as demonstrated by new partnerships with Suncorp, IAG, Aurecon, Woolworths, RACV, Village Cinemas, Sportsbet, Citibank, Landmark and Mastercard.
Our diverse customers now represent 40% of the ASX Top 20.
In 2017, 66% of our revenue is derived from multi practice customer engagements proving that our capability to deliver a range of end-to-end digital solutions. Our ability to build and evergreen customer facing products and services sets us apart and makes us a leader in our field.
Fully integrated capabilities
With an accelerated purchase of our final stake in Outware Mobile, we were able to integrate our sales operations across mobile (Outware), data and analytics (InfoReady) and cloud and security practices.
This also cleared the way for orderly succession in the mobile practice, and facilitated the re-deployment of Outware founders into broader leadership roles within Enterprise Services.
We have also invested heavily in innovation — products, knowledge and resources.
This means our customers have access to new digital ideas and experiences to help shape ongoing differentiation into the market. This in turn allows us to work with these business to continually extract maximum value from digital technologies, and bring new and innovative products to market.
Specialist knowledge
Permanent staff members grew from 286 in 2016 to 404 this year, bringing new ideas and new skills.
We have staff based in Queensland, NSW and Victoria; and we are committed to investing in and retaining the best talent in the industry across the foundation disciplines of customer-centered design, mobile, analytics, cloud and security, as well as combining these capabilities to innovate across the latest digital technologies.
Our employee value proposition is based on innovation, and the ability to work on high-profile, challenging projects, work with new design techniques and digital technologies, and
collaborate with other high achievers. The products we help build are used by millions of Australians.
This value proposition, along with our company culture, differentiates Enterprise Services in the evolving digital technologies market, and has led to our impressive Employee Engagement score of 71%.
Industry certification and awards
In 2017, we achieved AWS Premier Partner recertification, the AWS Marketing Competency, and the AWS Public Sector Competency, as well as ISO 9001, ISO 27001 and Microsoft Managed Services Provider partner certifications. Each year, these certifying agencies lift the bar and we continue to meet it.
The year also saw us named the leading Australian managed cloud provider and “Challenger” in Gartner’s Magic Quadrant for Public Cloud Infrastructure Managed Services Providers; and Worldwide and Infoready named in Gartner’s 2017 Market Guide for Data and Analytics Service Providers in Asia Pacific.
Our products won six TECH Design Awards (International Design Competition) (two gold for Coles Shopping App; two silver for Peoplecare App; two silver for Goodlife App).
Outlook for 2018Over the past few years, we
have demonstrated our ability to strongly execute
against the ES strategy of building and evergreening Australia’s most impactful digital products. But innovation never stops. Now we have integrated our core capabilities,
we can focus on digital innovations that will ensure
our customers continue to be differentiated using the latest
design techniques and digital technologies in the market.
Our target market is those organisations that are leading the way in bringing digital
products and services to market, and that are demanding fully-featured projects. In order to deliver this, it is clear that ES has to continue to integrate capabilities and keep abreast of emerging technologies to meet market demand.
Our commitment to integration and investment in innovation gives us the capacity to deliver best-in-class products that give our ASX 200 clients a competitive edge.
“We pride ourselves on our
long-term relationships and our ability to deliver
truly standout digital products at scale.”
Melbourne IT Group Annual Report 201714
For
per
sona
l use
onl
y
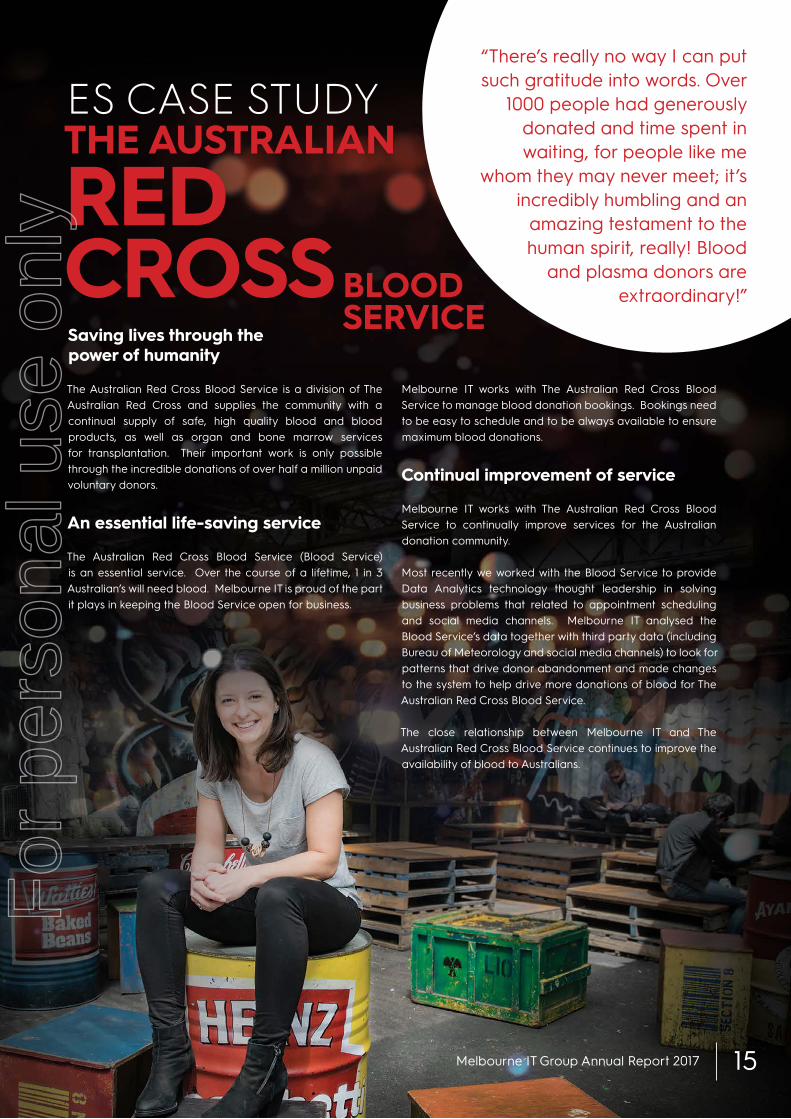
The Australian Red Cross Blood Service is a division of The Australian Red Cross and supplies the community with a continual supply of safe, high quality blood and blood products, as well as organ and bone marrow services for transplantation. Their important work is only possible through the incredible donations of over half a million unpaid voluntary donors.
An essential life-saving service
The Australian Red Cross Blood Service (Blood Service) is an essential service. Over the course of a lifetime, 1 in 3 Australian’s will need blood. Melbourne IT is proud of the part it plays in keeping the Blood Service open for business.
ES CASE STUDYTHE AUSTRALIAN
RED CROSS
Melbourne IT works with The Australian Red Cross Blood Service to manage blood donation bookings. Bookings need to be easy to schedule and to be always available to ensure maximum blood donations.
Continual improvement of service
Melbourne IT works with The Australian Red Cross Blood Service to continually improve services for the Australian donation community.
Most recently we worked with the Blood Service to provide Data Analytics technology thought leadership in solving business problems that related to appointment scheduling and social media channels. Melbourne IT analysed the Blood Service’s data together with third party data (including Bureau of Meteorology and social media channels) to look for patterns that drive donor abandonment and made changes to the system to help drive more donations of blood for The Australian Red Cross Blood Service.
The close relationship between Melbourne IT and The Australian Red Cross Blood Service continues to improve the availability of blood to Australians.
Saving lives through the power of humanity
BLOOD SERVICE
“There’s really no way I can put such gratitude into words. Over
1000 people had generously donated and time spent in waiting, for people like me
whom they may never meet; it’s incredibly humbling and an
amazing testament to the human spirit, really! Blood
and plasma donors are extraordinary!”
Melbourne IT Group Annual Report 2017 15
For
per
sona
l use
onl
y

In 2016, we had large organisational and structural changes, setting the foundations for 2017 and enabling our workforce to scale in line with our business demand and performance. As part of this, we have developed and recruited new leadership levels to support the growing teams. An important part of our business growth and people-focused culture has been a continued investment in our leadership development program, with more than 120 leaders trained in effective leadership and people management skills, as well as coaching and training support for individual development and career growth.
BRAND, PEOPLE & CULTUREContinued growth and developmentWe continued to grow our workforce during 2017. With organic recruitment and the acquisition of WME, our total permanent employee count has grown from 560 to more than 800.
For
per
sona
l use
onl
y
We have an established talent and capability review process, held quarterly across the organisation. In this process, senior leaders and executives identify and discuss high performance, developing talent and leadership, and agree on opportunities for performance improvement. The process has enabled the identification of key achievers and talented individuals across the business, in order to reward, retain, develop and promote. By embedding these reviews over the past two years, we have seen around a third of our workforce moved and promoted internally, both into new functional roles and management positions. This process has also enabled improved approaches to succession planning, ensuring key leadership roles have seamless transitions in the event of departures.
Our cultureOur business has been on a journey of cultural transformation over the the past three years. This has been an important focus, in particular due to the the number of business acquisitions the group has made. Each acquired business has brought its own culture, brand and identity, as well as great talent. Much of 2017 concentrated on bringing these businesses together, learning about each culture and planning intricate structural and system integrations to ensure the acquisitions are successful and that we retain talent.
Whilst it has been critical to recognise the uniqueness of our acquired business cultures, we have continued to work towards an aligned business strategy and operating model. Creating a collective vision, purpose and cultural identity that unites all of our businesses has been a work in progress in 2017.
This focus on aligning our businesses has laid important foundations on which the re-branding of the Melbourne IT group will be formalised in 2018. To ready for this re-brand, we have undertaken a highly consultative and collaborative process with key stakeholders in our business. This has involved identifying the values that resonate with our culture as well as inputs on the brand strategy. We have also involved key teams (such as creative designers and marketing teams) in the process of naming and the visual design of our new brand.
Our re-brand will play an important part in aligning our internal culture with our external brand. This alignment is important to continue to cultivate a healthy, engaged and sustainable
workforce that delivers cohesive and market-leading digital solutions to our clients and their customers. With a new brand comes the opportunity to position ourselves as a market leader for career and development opportunities to attract new talent and to be known as a great place to work.
An important part of our culture is the recognition that in order to succeed in the fast-paced tech industry, we must
create an environment that allows innovation to thrive. We are committed to investing in and
developing the skills, knowledge and leadership capabilities of our people,
as well as allowing the curiosity and creativity needed and valued
in a progressive business. We support our people in their hackathons, innovation hubs and tech-creative working groups. We celebrate experimentation and sharing thought leadership through blogs, guest speaking opportunities
and “proof of concept’’ development initiatives.
The engagement of our people continues to remain an important
focus. As part of management KPIs, employee engagement is measured and
reviewed annually. How our people feel, their employee experience and their feedback for improvements on areas such as the workplace, leadership, development, environment and communication is important to the ongoing cultivation of our culture.
Inclusion and wellbeingThe health of our people is important to us, and we take great pride in our diverse workforce. In 2017, we dedicated resources to our annual program around wellbeing and inclusion, and will look to build on this in 2018.
With more than 50 nationalities represented among our employees, we understand and enjoy celebrating cultural diversity in our business. During 2017, we crafted a program that highlights the diversity of our people and promotes inclusion through awareness, education and understanding. We celebrated key cultural events including Taste of Harmony, NAIDOC week, Rosh Hashanah, Ramadan, and more. We shared informative emails, blog posts and small tokens with our people marking particular celebrations, for example chocolate coins during Hanukkah, and lights during Diwali.
Our refreshed focus on “inclusion” is building on the diversity work of previous years. Our female representation across the
“We are pleased to have achieved 50/50
gender representation at leadership
levels within the business.”
Melbourne IT Group Annual Report 2017 17
For
per
sona
l use
onl
y

business has steadily improved, ending 2017 at 28%. We run internal campaigns for gender diversity and equality, hosting internal networking sessions including Ladies’ Hi-Tech Tea and Code Like a Girl; celebrating International Women’s Day and Equal Pay Day; sending key talent to conferences such as Women in Technology; and providing resources like our Women’s Emergency Supplies, and supportive amenities for breast-feeding mothers in our offices.
We are proud to support our LGBTQI community and talent, and affirm our support for the same sex marriage legislative change. We believe that all our people, both present and potential, should feel a sense of belonging, acceptance and support in our workplace.
We partner with an Employee Assistance Program provider, giving employees free access to counselling, meditation sessions, and other wellbeing support services. We also offer free local gym access, and undertake an annual program of
wellness initiatives, such as smoothie morning, yoga classes, free hearing and eyesight tests, flu vaccinations, meditation and stress reduction classes, board game nights and support for charitable initiatives.
Re-brandingDuring 2015-2017, we undertook a comprehensive internal and external brand review, with a new name, as well as look and feel, coming in 2018.
The Melbourne IT of today is unrecognisable compared to that of just four years ago when our business primarily sold domains and hosting. Where we once had fewer than 300 employees and our reported result was $5.8m of EBITDA, we now have more than 800 employees, our EBITDA has been growing at a Compound Annual Growth Rate of more than 60%, and we are one of the leading digital partners for businesses, large and small.
The Executive
Team
Martin Mercer Chief Executive
Officer
Amy Rixon Chief People
Officer
Fraser Bearsley Chief Financial
Officer
Brett Fenton Chief Technology
Officer
Peter Wright Managing Director, Enterprise Services
Emma Hunt Managing Director,
Small & Medium Business
Melbourne IT Group Annual Report 201718
For
per
sona
l use
onl
y

Planned relocationOver the past few years, our boost in staff numbers both through acquisition and recruitment has meant we have outgrown our Sydney and Melbourne offices. We have secured new premises in both cities, and are currently designing new and modern workplaces, consistent with our new brand and agile ways of working.
In Melbourne, we will be moving into new office space a short distance from the existing CBD premises (Little Collins St), and in Sydney we are moving from Ultimo into the CBD (World Square).
Re-branding and relocation are two significant changes for our people in 2018, and we are excited about the positive impacts that a new brand, aligned culture and fresh premises will have for our people.
With this exponential growth, combined with an aggressive acquisitions strategy absorbing people, culture and clients as we expand, Melbourne IT is no longer a brand that accurately reflects the markets it serves, nor the group’s value proposition to attract and retain high-performing, skilled team members.
Branding and re-branding is a detailed process, and is not to be taken lightly.
In 2015 and 2016, comprehensive brand reviews were conducted with an external research agency to assist in understanding the equity and awareness in each of our brands, and in context of our market positioning. We have also consulted widely with major investors, as well as sought input from our valued staff and stakeholders.
Using this information, we have developed a brand “architecture” that will unite and simplify all the group’s diverse brands.
We are excited to be able to launch this unifying brand in 2018, pending a resolution for a formal name change at this year’s AGM in May.
Melbourne IT Group Annual Report 2017 19
For
per
sona
l use
onl
y
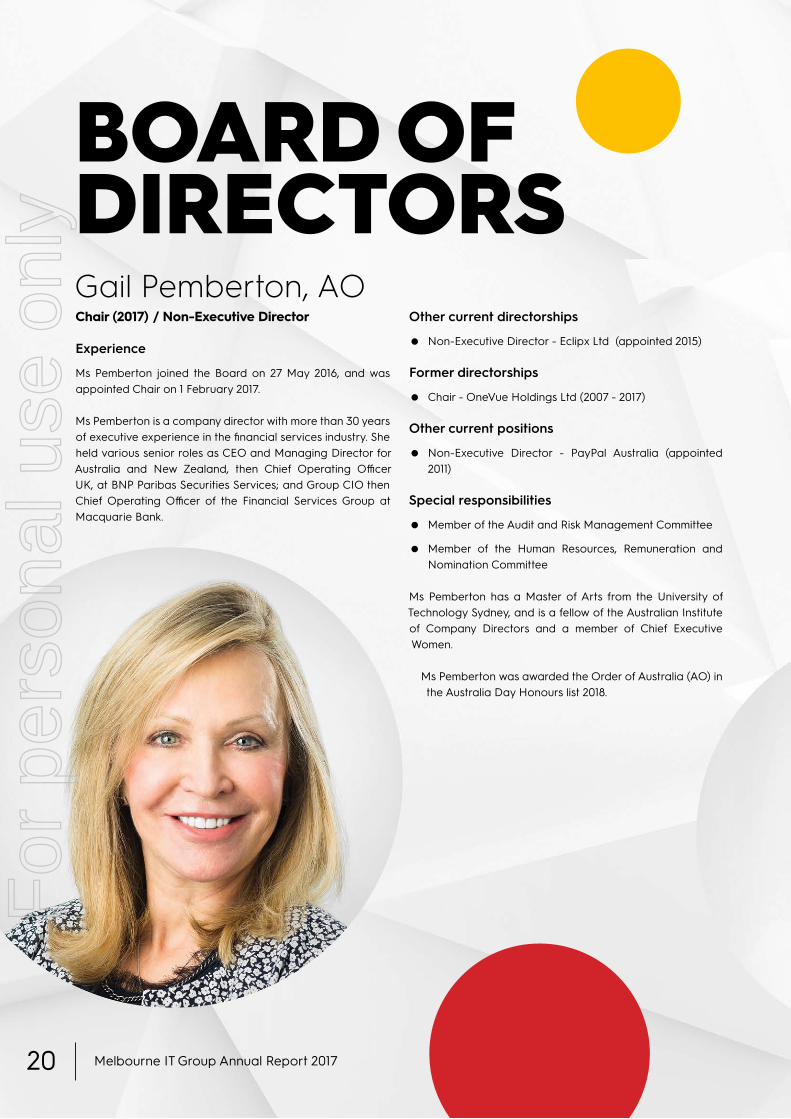
BOARD OFDIRECTORS Gail Pemberton, AOChair (2017) / Non-Executive Director
Experience
Ms Pemberton joined the Board on 27 May 2016, and was appointed Chair on 1 February 2017.
Ms Pemberton is a company director with more than 30 years of executive experience in the financial services industry. She held various senior roles as CEO and Managing Director for Australia and New Zealand, then Chief Operating Officer UK, at BNP Paribas Securities Services; and Group CIO then Chief Operating Officer of the Financial Services Group at Macquarie Bank.
Other current directorships
• Non-Executive Director - Eclipx Ltd (appointed 2015)
Former directorships
• Chair - OneVue Holdings Ltd (2007 - 2017)
Other current positions
• Non-Executive Director - PayPal Australia (appointed 2011)
Special responsibilities
• Member of the Audit and Risk Management Committee
• Member of the Human Resources, Remuneration and Nomination Committee
Ms Pemberton has a Master of Arts from the University of Technology Sydney, and is a fellow of the Australian Institute of Company Directors and a member of Chief Executive Women.
Ms Pemberton was awarded the Order of Australia (AO) in the Australia Day Honours list 2018.
Melbourne IT Group Annual Report 201720
For
per
sona
l use
onl
y

John ArmstrongNon-Executive Director
Experience
Mr Armstrong was appointed to the Board on 23 February 2016.
Mr Armstrong is an experienced company director and financial professional. He was the former CFO of SEEK Limited, a role he held for over 12 years, and Director of SEEK’s business in China, Zhaopin Ltd and SEEK Asia. He also held management roles at Carlton & United Breweries, and commenced his career at Ernst & Young.
Other current directorships
• Non-Executive Director - Blackmores Ltd (appointed May 2015)
Former directorships
• Non-Executive Director – iProperty (2014 – 2016)
Special responsibilities
• Member of the Audit and Risk Management Committee, and appointed Chairman of the Committee on 27 May 2016
Mr Armstrong holds a Bachelor of Business (Accounting) and is a member of the Australian Institute of Company Directors.
Martin MercerManaging Director & CEO
Experience
Mr Mercer was appointed as Managing Director and Chief Executive Officer on 7 April 2014.
Prior to joining Melbourne IT, he was Managing Director, Strategy and Fixed, at Optus following four successful years as CEO of Vividwireless, and ten years in a number of significant leadership positions at Telstra.
Mr Mercer has an impressive résumé in strategy, sales, marketing and product development, and general management, and brings with him a reputation for excellence in both strategy and execution.
Former directorships
• Non-Executive Director – Engin Ltd (2010 – 2011)
Mr Mercer has a BA (Hons) and an LLB from the University of Sydney, and a graduate diploma in Finance from the Securities Institute of Australia. He studied economics and finance at the Woodrow Wilson School of Public and International Affairs, Princeton University and is also a former Harkness Fellow.
For
per
sona
l use
onl
y
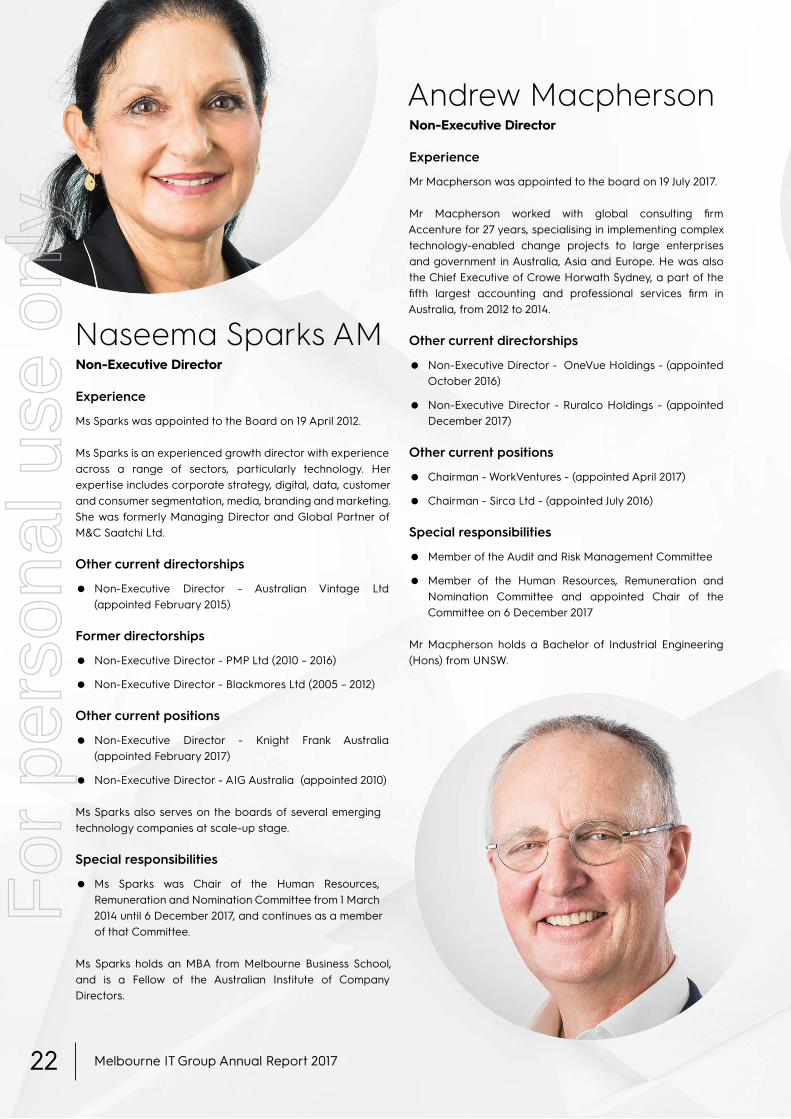
Naseema Sparks AMNon-Executive Director
Experience
Ms Sparks was appointed to the Board on 19 April 2012.
Ms Sparks is an experienced growth director with experience across a range of sectors, particularly technology. Her expertise includes corporate strategy, digital, data, customer and consumer segmentation, media, branding and marketing. She was formerly Managing Director and Global Partner of M&C Saatchi Ltd.
Other current directorships
• Non-Executive Director - Australian Vintage Ltd (appointed February 2015)
Former directorships
• Non-Executive Director - PMP Ltd (2010 – 2016)
• Non-Executive Director - Blackmores Ltd (2005 – 2012)
Other current positions
• Non-Executive Director - Knight Frank Australia (appointed February 2017)
• Non-Executive Director - AIG Australia (appointed 2010)
Ms Sparks also serves on the boards of several emerging technology companies at scale-up stage.
Special responsibilities
• Ms Sparks was Chair of the Human Resources, Remuneration and Nomination Committee from 1 March 2014 until 6 December 2017, and continues as a member of that Committee.
Ms Sparks holds an MBA from Melbourne Business School, and is a Fellow of the Australian Institute of Company Directors.
Andrew MacphersonNon-Executive Director
Experience
Mr Macpherson was appointed to the board on 19 July 2017.
Mr Macpherson worked with global consulting firm Accenture for 27 years, specialising in implementing complex technology-enabled change projects to large enterprises and government in Australia, Asia and Europe. He was also the Chief Executive of Crowe Horwath Sydney, a part of the fifth largest accounting and professional services firm in Australia, from 2012 to 2014.
Other current directorships
• Non-Executive Director - OneVue Holdings - (appointed October 2016)
• Non-Executive Director - Ruralco Holdings - (appointed December 2017)
Other current positions
• Chairman - WorkVentures - (appointed April 2017)
• Chairman - Sirca Ltd - (appointed July 2016)
Special responsibilities
• Member of the Audit and Risk Management Committee
• Member of the Human Resources, Remuneration and Nomination Committee and appointed Chair of the Committee on 6 December 2017
Mr Macpherson holds a Bachelor of Industrial Engineering (Hons) from UNSW.
Melbourne IT Group Annual Report 201722
For
per
sona
l use
onl
y
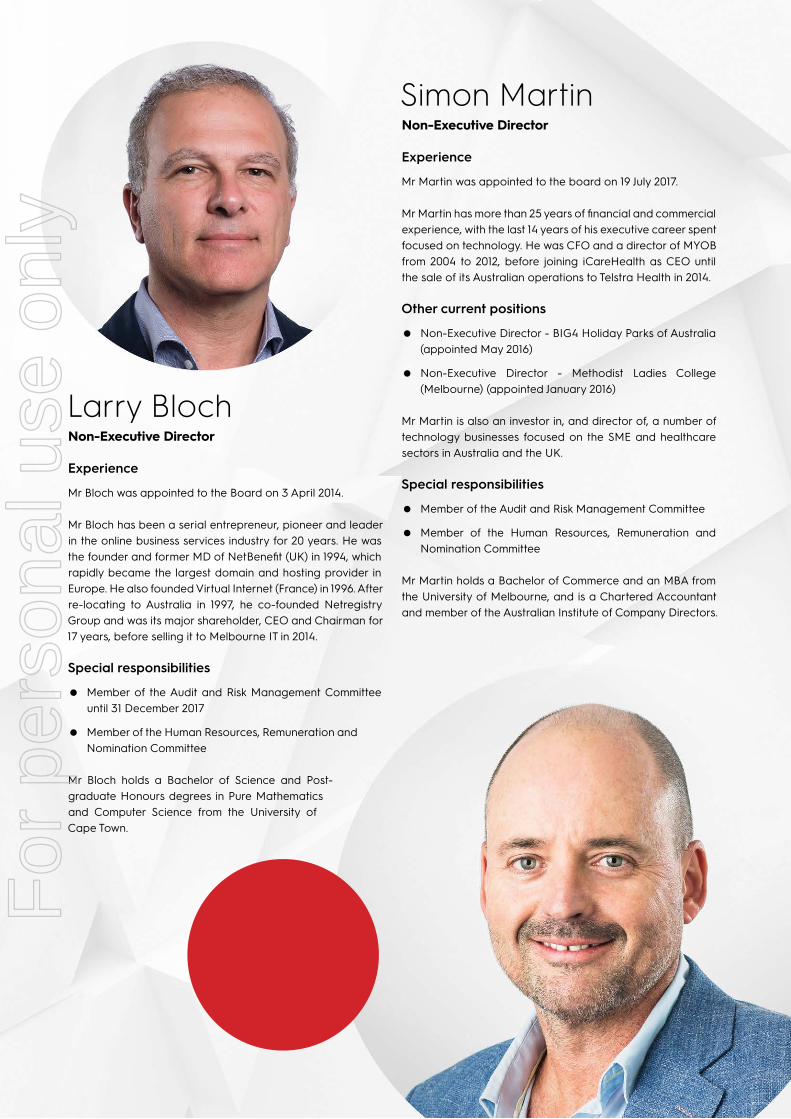
Simon MartinNon-Executive Director
Experience
Mr Martin was appointed to the board on 19 July 2017.
Mr Martin has more than 25 years of financial and commercial experience, with the last 14 years of his executive career spent focused on technology. He was CFO and a director of MYOB from 2004 to 2012, before joining iCareHealth as CEO until the sale of its Australian operations to Telstra Health in 2014.
Other current positions
• Non-Executive Director - BIG4 Holiday Parks of Australia (appointed May 2016)
• Non-Executive Director - Methodist Ladies College (Melbourne) (appointed January 2016)
Mr Martin is also an investor in, and director of, a number of technology businesses focused on the SME and healthcare sectors in Australia and the UK.
Special responsibilities
• Member of the Audit and Risk Management Committee
• Member of the Human Resources, Remuneration and Nomination Committee
Mr Martin holds a Bachelor of Commerce and an MBA from the University of Melbourne, and is a Chartered Accountant and member of the Australian Institute of Company Directors.
Larry BlochNon-Executive Director
Experience
Mr Bloch was appointed to the Board on 3 April 2014.
Mr Bloch has been a serial entrepreneur, pioneer and leader in the online business services industry for 20 years. He was the founder and former MD of NetBenefit (UK) in 1994, which rapidly became the largest domain and hosting provider in Europe. He also founded Virtual Internet (France) in 1996. After re-locating to Australia in 1997, he co-founded Netregistry Group and was its major shareholder, CEO and Chairman for 17 years, before selling it to Melbourne IT in 2014.
Special responsibilities
• Member of the Audit and Risk Management Committee until 31 December 2017
• Member of the Human Resources, Remuneration and Nomination Committee
Mr Bloch holds a Bachelor of Science and Post-graduate Honours degrees in Pure Mathematics and Computer Science from the University of Cape Town.
For
per
sona
l use
onl
y
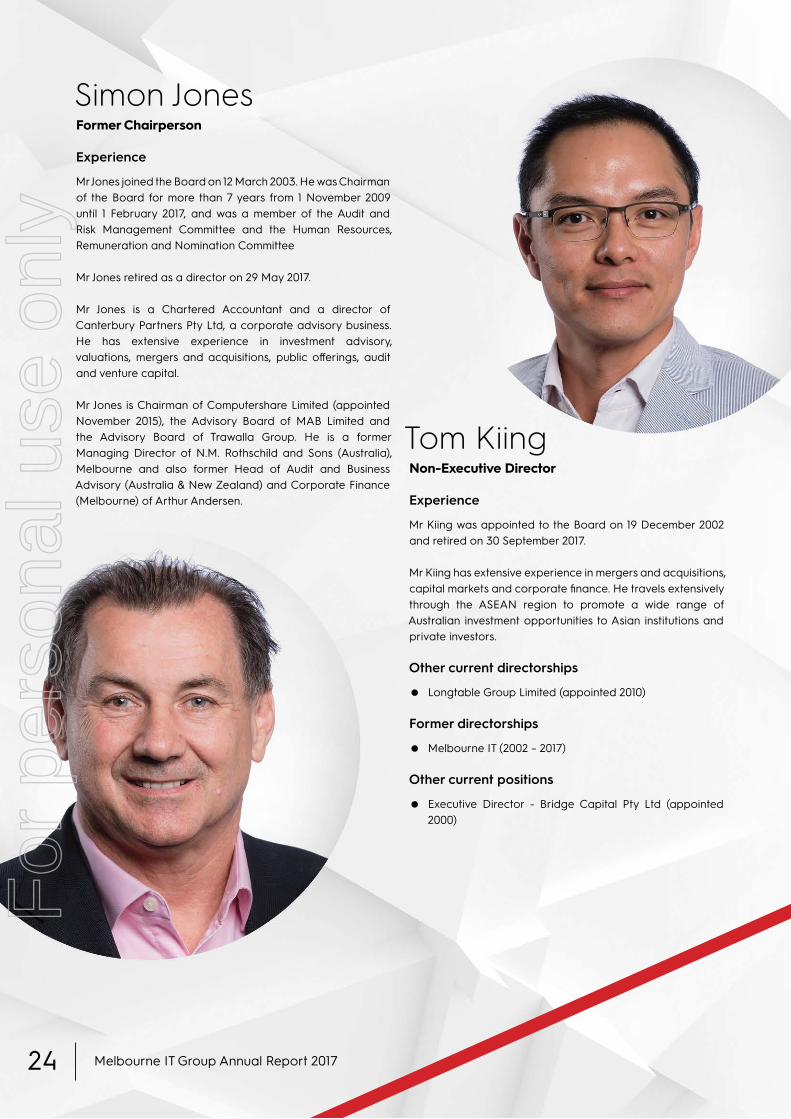
Simon JonesFormer Chairperson
Experience
Mr Jones joined the Board on 12 March 2003. He was Chairman of the Board for more than 7 years from 1 November 2009 until 1 February 2017, and was a member of the Audit and Risk Management Committee and the Human Resources, Remuneration and Nomination Committee
Mr Jones retired as a director on 29 May 2017.
Mr Jones is a Chartered Accountant and a director of Canterbury Partners Pty Ltd, a corporate advisory business. He has extensive experience in investment advisory, valuations, mergers and acquisitions, public offerings, audit and venture capital.
Mr Jones is Chairman of Computershare Limited (appointed November 2015), the Advisory Board of MAB Limited and the Advisory Board of Trawalla Group. He is a former Managing Director of N.M. Rothschild and Sons (Australia), Melbourne and also former Head of Audit and Business Advisory (Australia & New Zealand) and Corporate Finance (Melbourne) of Arthur Andersen.
Tom KiingNon-Executive Director
Experience
Mr Kiing was appointed to the Board on 19 December 2002 and retired on 30 September 2017.
Mr Kiing has extensive experience in mergers and acquisitions, capital markets and corporate finance. He travels extensively through the ASEAN region to promote a wide range of Australian investment opportunities to Asian institutions and private investors.
Other current directorships
• Longtable Group Limited (appointed 2010)
Former directorships
• Melbourne IT (2002 – 2017)
Other current positions
• Executive Director - Bridge Capital Pty Ltd (appointed 2000)
Melbourne IT Group Annual Report 201724
For
per
sona
l use
onl
y

We fuel our customers’
success through the smart use of
technology. We aspire to be Australia’s most
impactful digital technology
partner.
Melbourne IT Group Annual Report 2017 25
For
per
sona
l use
onl
y
Directors’ Report
For
per
sona
l use
onl
y

Your directors submit their report for the year ended 31 December 2017.
Directors were in office for the entire period unless otherwise noted.
Directors
Ms Gail Pemberton, AO (Appointed Chair 1 February 2017)
Mr Martin Mercer (Managing Director)
Mr Simon Jones (Chair to 1 February 2017, Retired on 29 May 2017)
Mr Tom Kiing (Retired on 30 September 2017)
Ms Naseema Sparks, AM
Mr Larry Bloch
Mr John Armstrong
Mr Simon Martin (Appointed on 19 July 2017)
Mr Andrew Macpherson (Appointed on 19 July 2017)
Company Secretary
Ms Edelvine Rigato (Resigned on 31 August 2017)
Mr Drew Robinson (Appointed on 31 August 2017 (contract ended on 15 December 2017))
Mr Fraser Bearsley (Appointed on 15 December 2017)
Details of directors’ experience, expertise and directorshipsFull details of the directors’ experience, expertise and directorships can be found on the Melbourne IT website at www.melbourneit.info.
Interests in the shares and performance rights of the company
As of the date of this report, directors hold the following interests in the shares and performance rights in the company:
Ordinary sharesPerformance rights¹
over ordinary shares
Ms Gail Pemberton, AO (Chair) 109,416 -
Mr John Armstrong 20,000 -
Mr Larry Bloch 9,208,383 -
Ms Naseema Sparks, AM 18,689 -
Mr Simon Martin 33,588 -
Mr Andrew Macpherson 38,000 -
Mr Martin Mercer 348,983 751,853
1 Performance rights are zero-priced options over the ordinary shares of Melbourne IT Ltd.
Table 1: Director shares and performance rights
Melbourne IT Group Annual Report 2017 27
For
per
sona
l use
onl
y

Principal activitiesThe principal activities of the Group during the year by operating segment are:
Enterprise Services (ES)
Enterprise Services provides services including cloud, mobile application development, data and analytics to Australian enterprise and government organisations.
SMB Solutions
SMB Solutions provides domain name registrations and renewals, website and email hosting, website development, search engine optimisation and analysis for businesses in Australia and New Zealand.
Review and results of operationsEarnings per share
Dividends
During the year, a final dividend for the year ended 31 December 2016 of 6.0 cents per share, amounting to $6,091,000 was paid on 28 April 2017, and an interim dividend for the year ended 31 December 2017 of 3.5 cents per share, amounting to $4,090,000 was paid on 29 September 2017.
After 31 December 2017, a final dividend for the year ended 31 December 2017 of 7.5 cents per share amounting to $8,803,000 was declared by the directors. The final dividend has not been recognised as a liability as at 31 December 2017.
2017 Cents
2016 Cents
Basic earnings per share 12.56 10.86
Diluted earnings per share 12.39 10.67
Review of operationsOverview
The Group recorded a 17.4% increase in consolidated revenue during the year ended 31 December 2017, from $168,436,000 to $197,760,000. The increase has been driven by continued growth in the Group’s Enterprise Services business and SMB Solutions, which was assisted through the acquisition of Web Marketing Experts Pty Ltd, Nothing But Web Pty Ltd and Results First Ltd (together the “WME Group”) on 31 May 2017.
The Group recorded a 15.6% decrease in registration revenue during the year ended 31 December 2017, from $44,916,000 to $37,912,000. The decrease was driven by the sale of the International Domain Name Registration (IDNR) business on 31 March 2016, as disclosed in note A7 to the financial statements. IDNR contributed $5,355,000 revenue in FY16. Revenue is disclosed in note A1 to the financial statements.
The Group achieved earnings before interest, tax, depreciation and amortisation (EBITDA) of $31,944,000 (2016: $28,206,000), an increase of 13.3% from the previous year. Consolidated net profit after tax was $14,279,000 (2016: $12,708,000), up 12.4% from the previous year.
In 2017, the Group entered into two leases for new office space in Melbourne and Sydney respectively to support forecast headcount expansion driven by continued growth in the Solutions businesses, the expansion of the SMB Solutions account management model, and investments in shared services. As part of the two new office spaces, the Group has engaged fit-out consultants to assist in project management and architectural and services design.
Integration activities relating to the acquisition of Netregistry and Uber concluded in 2017, achieving savings of $10,000,000 in operating costs on a go-forward basis. Integration activities primarily consisted of migration of Netregistry and Uber customers to a common platform, consolidation of hosting infrastructure and an organisational restructure and workforce changes.
The Group generated $13,444,000 of cash flows from operating activities in 2017, a decrease of 6.4% compared with 2016. The decline in cash flows from the prior year was primarily driven by an increase in the net working capital requirements of the Group, driven by continued strong growth in the ES and SMB Solutions revenue, which is billed in arrears.
Melbourne IT Group Annual Report 201728
Directors’ ReportF
or p
erso
nal u
se o
nly
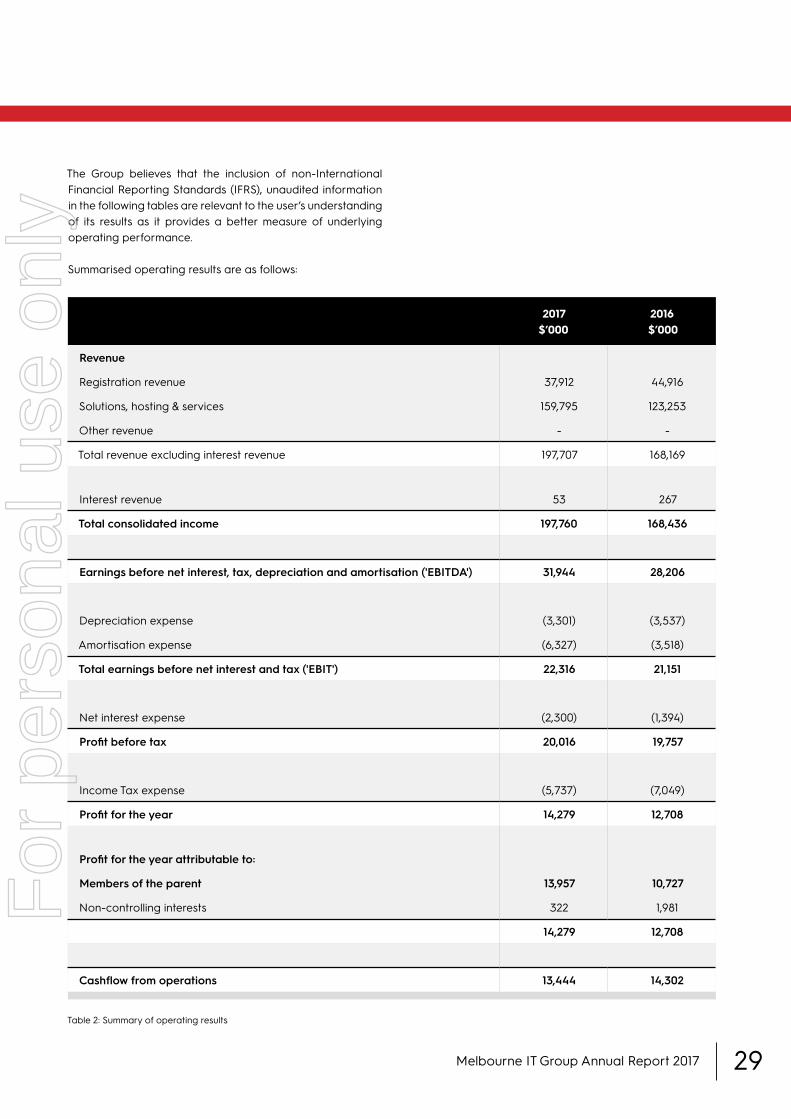
The Group believes that the inclusion of non-International Financial Reporting Standards (IFRS), unaudited information in the following tables are relevant to the user’s understanding of its results as it provides a better measure of underlying operating performance.
Summarised operating results are as follows:
Table 2: Summary of operating results
2017 $’000
2016 $’000
Revenue
Registration revenue 37,912 44,916
Solutions, hosting & services 159,795 123,253
Other revenue - -
Total revenue excluding interest revenue 197,707 168,169
Interest revenue 53 267
Total consolidated income 197,760 168,436
Earnings before net interest, tax, depreciation and amortisation ('EBITDA') 31,944 28,206
Depreciation expense (3,301) (3,537)
Amortisation expense (6,327) (3,518)
Total earnings before net interest and tax ('EBIT') 22,316 21,151
Net interest expense (2,300) (1,394)
Profit before tax 20,016 19,757
Income Tax expense (5,737) (7,049)
Profit for the year 14,279 12,708
Profit for the year attributable to:
Members of the parent 13,957 10,727
Non-controlling interests 322 1,981
14,279 12,708
Cashflow from operations 13,444 14,302
Melbourne IT Group Annual Report 2017 29
For
per
sona
l use
onl
y
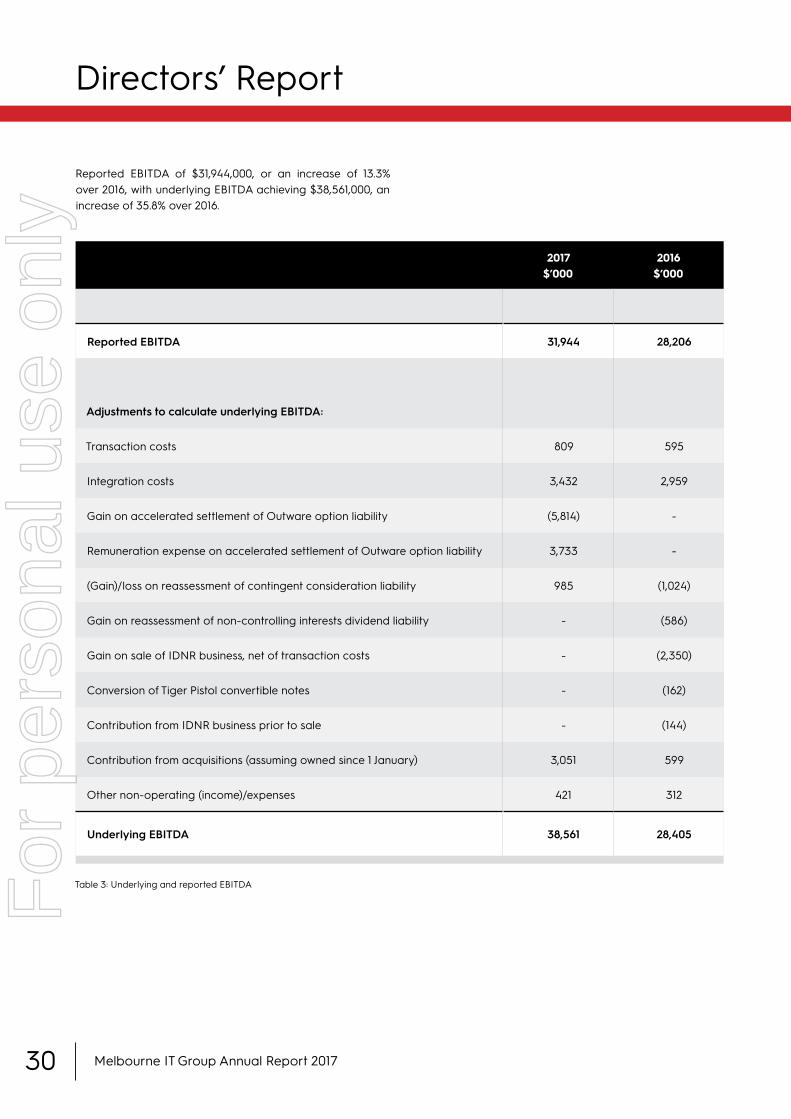
Reported EBITDA of $31,944,000, or an increase of 13.3% over 2016, with underlying EBITDA achieving $38,561,000, an increase of 35.8% over 2016.
Table 3: Underlying and reported EBITDA
2017 $’000
2016 $’000
Reported EBITDA 31,944 28,206
Adjustments to calculate underlying EBITDA:
Transaction costs 809 595
Integration costs 3,432 2,959
Gain on accelerated settlement of Outware option liability (5,814) -
Remuneration expense on accelerated settlement of Outware option liability 3,733 -
(Gain)/loss on reassessment of contingent consideration liability 985 (1,024)
Gain on reassessment of non-controlling interests dividend liability - (586)
Gain on sale of IDNR business, net of transaction costs - (2,350)
Conversion of Tiger Pistol convertible notes - (162)
Contribution from IDNR business prior to sale - (144)
Contribution from acquisitions (assuming owned since 1 January) 3,051 599
Other non-operating (income)/expenses 421 312
Underlying EBITDA 38,561 28,405
Melbourne IT Group Annual Report 201730
Directors’ ReportF
or p
erso
nal u
se o
nly

Underlying net profit after tax (‘Underlying NPAT’) for the year ended 31 December 2017 was $19,866,000 (2016: $14,344,000), an increase of 38.5%. This resulted in strong underlying EPS growth in 2017, achieving 17.00 cents, an increase of 19.5% from the prior year.
Table 4: Underlying NPAT
2017 $’000
2016 $’000
Profit after tax attributable to members of the Parent 13,957 10,727
Adjustments to calculate underlying NPAT:
Profit after tax attributable to non-controlling interests of Outware 153 1,839
Transaction costs (tax effected) 668 501
Integration costs (tax effected) 2,402 2,071
Unwinding of discount on other financial liabilities 189 504
Gain on accelerated settlement of Outware option liability (5,814) -
Remuneration expense on accelerated settlement of Outware option liability 3,733 -
(Gain)/loss on reassessment of contingent consideration liability 985 (1,024)
Amortisation of WebCentral brand intangible asset 1,247 -
Gain on reassessment of non-controlling interests dividend liability - (586)
Sale of IDNR business, net of transaction costs and taxation - 74
Conversion of Tiger Pistol convertible notes - (162)
Imputed interest income on convertible note receivables - (133)
Contribution from IDNR business prior to sale (tax effected) - (101)
Contribution from acquisitions (assuming 100% owned since 1 January) (tax effected) 2,051 416
Other non-operating (income)/expenses (tax effected) 295 218
Underlying NPAT 19,866 14,344
Melbourne IT Group Annual Report 2017 31
For
per
sona
l use
onl
y

Outlook 2018 and beyondThe Group will continue to focus on the following eight key areas in 2018:
• Continuing the integration of our acquisitions to generate operational, financial and cultural benefits throughout the organisation
• Development of a deep understanding of our customers’ needs through the use of data analytics in order to provide managed marketing solutions that are tailored to their individual needs as they progress along their online journey
• Reposition our product and service portfolio for small to medium business owners to focus on selling digital marketing outcomes, rather than services for our customers
• Expand our existing account management capability across our high value customers to ensuring they are delivering tangible outcomes
• Continued development of Enterprise Services managed services and new capabilities to offer clients a complete suite of digital services
• Continued investment in innovation to bring together the latest digital technologies to develop leading digital products and services for our customers
• The implementation and upgrade of enterprise-grade support systems and shared services to support continued growth, and
• The repositioning of our brand in both the Enterprise and SMB market, and cementing our position as an employer of choice in the Australian market.
Risks reviewThe Group’s ability to achieve its strategic objectives and secure its future financial prospects may be impacted by the following key risks:
• Competition – the online business world is rapidly evolving with a heightened environment of change characterised by disruptive technologies. The Group remains abreast of the competitive landscape by investing in new products and customer experience. The acquisitions of Netregistry, Uber Global and WME Group assist in risk mitigation with access to a larger customer pool, increased skill sets, funds available for market investment and product enhancements.
• Markets – a material proportion of registration revenue is derived from the performance of its reseller channel and ES professional services revenue from corporate and government customers. These revenue streams can be difficult to predict. Melbourne IT works closely with its customers to understand their challenges in order to mitigate these risks.
• Regulatory – The Group operates in highly-regulated global markets. Success can be impacted by changes to the regulatory environment. The Group plays an active role in consulting with regulators on changes that could impact our business.
Risk managementThe Group takes a proactive approach to risk management and an active risk management plan is in place. The Group’s approach to risk management is to determine the material areas of risk it is exposed to in running the organisation and to put in place plans to manage and/or mitigate those risks.
In addition, risk areas are reviewed by the Group’s risk management staff, with the assistance of external advisors on specific matters, where appropriate.
Internal audit of key business processes is scheduled across the Group. The entire risk management plan is reviewed at least annually.
The Audit and Risk Management Committee is responsible for the governance of the risks management framework, including the effectiveness of risk management and compliance systems and the internal control framework.
Melbourne IT Group Annual Report 201732
Directors’ ReportF
or p
erso
nal u
se o
nly

Significant changes in the state of affairsOn 16 February 2017, the Group entered into a Deed of Variation and Option Exercise with the owners of the non-controlling interest of Outware Systems Pty Ltd to purchase the remaining 24.9% of share capital for a total consideration of $28,692,000. Of the consideration paid, 521,720 ordinary shares in Melbourne IT Ltd was held in escrow, and $2,683,000 was held in escrow in cash as at 31 December 2017, contingent on the employment of the vendors of the non-controlling interest by the Group until that date. This has extinguished the Group’s put option and dividend liability to non-controlling interests in Outware. No further payment is due to the vendors of Outware. The total consideration paid for Outware (net of cash acquired) was $60,615,000, implying a forward EBITDA multiple of 4.9 times. The acquisition of the remaining non-controlling interest was brought forward in order to accelerate the integration of the Outware operations into the Group.
On 25 May 2017, Melbourne IT successfully completed a fully-underwritten non-renounceable rights offer capital raising of $29,415,000 (net of transaction costs). The underwritten non-renounceable accelerated entitlement offer to shareholders was completed at an issue price of $2.10 per share. The 14,609,443 new shares issued ranked pari passu with existing ordinary shares on issue.
On 31 May 2017, Melbourne IT acquired 100% of Web Marketing Experts Pty Ltd, Nothing But Web Pty Ltd and Results First Ltd, a leading provider of end-to-end digital marketing solutions including search engine optimisation, search engine advertising and web design to the SMB market, for purchase consideration of $38,687,000 (including working capital and net debt adjustments). The provisional accounting for the acquisition in accordance with AASB 3 ‘Business Combinations’ as disclosed in note D1(a) to the financial statements.
On 31 October 2017, Melbourne IT approved a group-wide brand review. The Group has engaged consultants to assist in brand identity development and brand launch initiatives. As part of the Group-wide brand review, Melbourne IT
approved the retirement of the WebCentral brand. The Group anticipates the retirement of the WebCentral brand will be complete within 12 months, and as a result the useful life of the related brand intangible asset has been revised to 12 months ending 31 October 2018 as disclosed in note B4 to the financial statements. As a result, $1,782,000 of accelerated amortisation expense has been recognised in the Statement of Comprehensive Income.
Other than as stated above, there have been no other significant changes in the state of affairs during the year ended 31 December 2017.
Significant events after balance dateOn 20 February 2018, the directors declared a final dividend of 7.5 cents per ordinary share, franked at 100%, amounting to $8,803,000. The expected payment date of the dividend is 30 April 2018.
On 31 December 2017, the owners of the non-controlling interest of Outware met the service conditions of the Deed of Variation and Option Exercise. 521,720 ordinary shares in Melbourne IT Ltd, and $2,683,000 in cash was transferred to the vendors on 3 January 2018 as per the Deed of Variation and Option Exercise. This has extinguished the Group’s remuneration liability to non-controlling interests in Outware.
Other than the above, there has not been any other matter or circumstance in the interval between the end of the year and the date of this report that has materially affected or may materially affect the operations of the consolidated entity, the results of those operations or the state of affairs of the consolidated entity in subsequent financial periods.
Likely developments and expected resultsFor further information about the likely developments and expected results of the Group, refer to the ‘Outlook 2018’ section on page 32 of this report.
Melbourne IT Group Annual Report 2017 33
For
per
sona
l use
onl
y

Indemnification and insurance of directors and officersThe company has entered into a Deed of Insurance and Indemnity with each of the non-executive directors, certain officers and executive directors of controlled entities. Under the Deed, the company has agreed to indemnify these directors and officers against any claim or for any costs, which may arise as a result of work performed in their capacity as directors and officers, to the extent permitted by law.
During the financial year, the company paid an insurance premium in respect of a Directors and Officers Liability Policy covering all directors and officers of the company and related bodies corporate. The contract of insurance prohibits disclosure of the nature of the liability and the amount of the premium.
To the extent permitted by law, the company has agreed to indemnify its auditors, Ernst & Young Australia, as part of the terms of its audit engagement agreement against claims by third parties arising from the audit (for an unspecified amount). No payment has been made to indemnify Ernst & Young during or since the financial year.
Performance rightsUnissued shares
As at the date of this report, there were 1,473,982 unissued ordinary shares under performance rights (2016: 1,705,684). Refer to Note E4 to the Financial Statements for further details of the performance rights outstanding. Performance right holders do not have any right, by virtue of the performance right rules, to participate in any share issue of the company or any related body corporate or in the issue of any other registered scheme.
Shares issued as a result of the vesting of performance rights
A total of 659,913 performance rights were vested during the year ended 31 December 2017 (2016: Nil).
During the financial year, there were 539,398 rights granted (2016: 529,178 rights) and 111,187 rights forfeited (2016: Nil).
Directors’ meetingsAs at the date of this report, the company had an Audit and Risk Management Committee (‘ARMC’) and a Human Resources, Remuneration and Nomination Committee (‘HRRNC’) of the Board of Directors.
The members of the ARMC are Mr J. Armstrong (Chairman), Mr L. Bloch*, Mr S. Martin, Mr A. Macpherson and Ms G. Pemberton.
The members of the HRRNC are Mr A. Macpherson (Chairman), Ms N. Sparks, Mr L. Bloch, Mr S Martin and Ms G. Pemberton.
The Managing Director and Chief Executive Officer attends each ARMC and each HRRNC by invitation.
* Mr L. Bloch retired from the ARMC on 31 December 2017.
Melbourne IT Group Annual Report 201734
Directors’ ReportF
or p
erso
nal u
se o
nly

The below table shows the numbers of meetings of directors held during 2017. The table also shows the number of meetings attended by each director and the number of meetings each committee member was eligible to attend. Directors who are not members of a committee may attend as permanent guests.
RoundingThe amounts contained in this report and in the financial report have been rounded to the nearest $1,000 (where applicable) under the option available to the company under ASIC Corporations (Rounding in Financial / Directors’ Report) Instrument 2016/191 (Instrument 2016/191). The company is an entity to which the Class Order applies.
Directors’ Meetings Meetings of Committees
ARMC HRRNC
No. of meetings held in 2017 17 5 5
Eligible Attended Eligible Attended Eligible Attended
Mr Simon Jones 12 9 2 2 1 1
Mr Martin Mercer 17 17 - - - -
Mr Tom Kiing 15 15 - - 3 3
Ms Naseema Sparks, AM 17 17 - - 5 5
Mr Larry Bloch 17 15 5 5 5 5
Mr John Armstrong 17 16 5 4 - -
Ms Gail Pemberton, AO 17 17 5 5 5 5
Mr Simon Martin 4 4 2 2 2 2
Mr Andrew Macpherson 4 4 2 2 2 2
Corporate governanceIn recognising the need for the highest standards of corporate behaviour and accountability, the directors of Melbourne IT Ltd support and have adhered to the principles of corporate governance.
The company’s Corporate Governance Statement is available on the Company’s website (www.melbourneit.info).
Table 5: Board and Committee meetings
Melbourne IT Group Annual Report 2017 35
For
per
sona
l use
onl
y
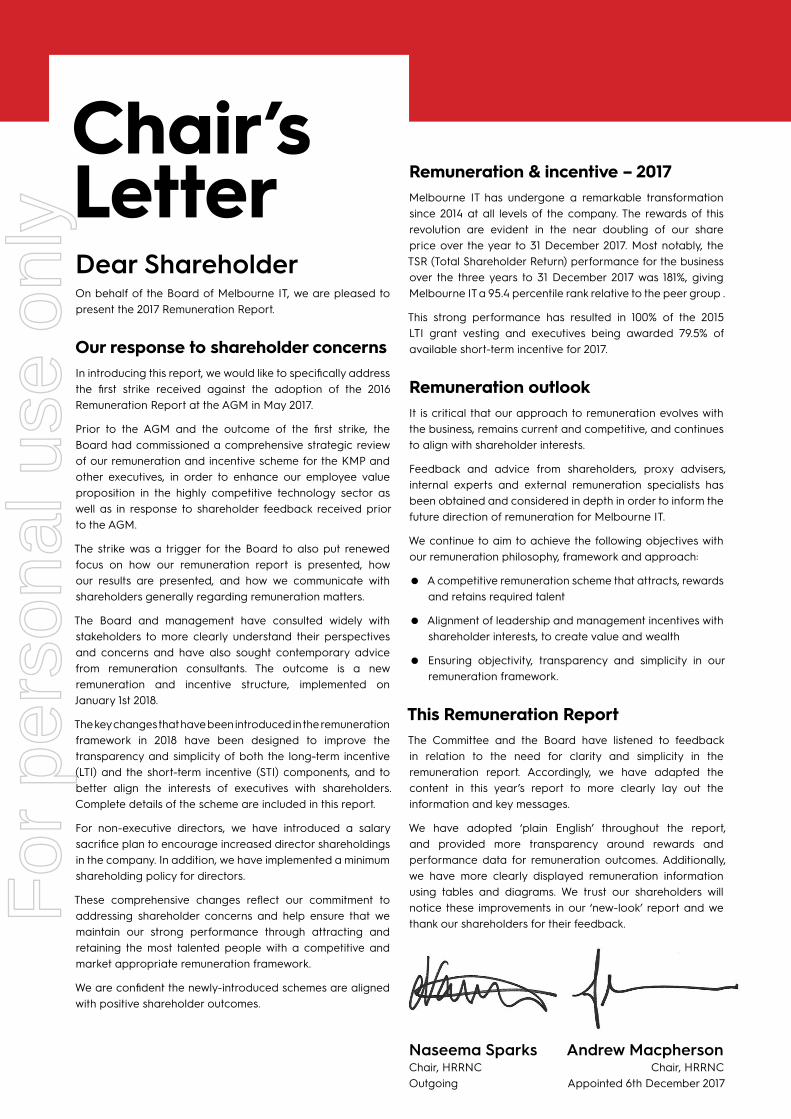
Dear ShareholderOn behalf of the Board of Melbourne IT, we are pleased to present the 2017 Remuneration Report.
Our response to shareholder concernsIn introducing this report, we would like to specifically address the first strike received against the adoption of the 2016 Remuneration Report at the AGM in May 2017.
Prior to the AGM and the outcome of the first strike, the Board had commissioned a comprehensive strategic review of our remuneration and incentive scheme for the KMP and other executives, in order to enhance our employee value proposition in the highly competitive technology sector as well as in response to shareholder feedback received prior to the AGM.
The strike was a trigger for the Board to also put renewed focus on how our remuneration report is presented, how our results are presented, and how we communicate with shareholders generally regarding remuneration matters.
The Board and management have consulted widely with stakeholders to more clearly understand their perspectives and concerns and have also sought contemporary advice from remuneration consultants. The outcome is a new remuneration and incentive structure, implemented on January 1st 2018.
The key changes that have been introduced in the remuneration framework in 2018 have been designed to improve the transparency and simplicity of both the long-term incentive (LTI) and the short-term incentive (STI) components, and to better align the interests of executives with shareholders. Complete details of the scheme are included in this report.
For non-executive directors, we have introduced a salary sacrifice plan to encourage increased director shareholdings in the company. In addition, we have implemented a minimum shareholding policy for directors.
These comprehensive changes reflect our commitment to addressing shareholder concerns and help ensure that we maintain our strong performance through attracting and retaining the most talented people with a competitive and market appropriate remuneration framework.
We are confident the newly-introduced schemes are aligned with positive shareholder outcomes.
Remuneration & incentive – 2017Melbourne IT has undergone a remarkable transformation since 2014 at all levels of the company. The rewards of this revolution are evident in the near doubling of our share price over the year to 31 December 2017. Most notably, the TSR (Total Shareholder Return) performance for the business over the three years to 31 December 2017 was 181%, giving Melbourne IT a 95.4 percentile rank relative to the peer group .
This strong performance has resulted in 100% of the 2015 LTI grant vesting and executives being awarded 79.5% of available short-term incentive for 2017.
Remuneration outlook It is critical that our approach to remuneration evolves with the business, remains current and competitive, and continues to align with shareholder interests.
Feedback and advice from shareholders, proxy advisers, internal experts and external remuneration specialists has been obtained and considered in depth in order to inform the future direction of remuneration for Melbourne IT.
We continue to aim to achieve the following objectives with our remuneration philosophy, framework and approach:
• A competitive remuneration scheme that attracts, rewards and retains required talent
• Alignment of leadership and management incentives with shareholder interests, to create value and wealth
• Ensuring objectivity, transparency and simplicity in our remuneration framework.
This Remuneration ReportThe Committee and the Board have listened to feedback in relation to the need for clarity and simplicity in the remuneration report. Accordingly, we have adapted the content in this year’s report to more clearly lay out the information and key messages.
We have adopted ‘plain English’ throughout the report, and provided more transparency around rewards and performance data for remuneration outcomes. Additionally, we have more clearly displayed remuneration information using tables and diagrams. We trust our shareholders will notice these improvements in our ‘new-look’ report and we thank our shareholders for their feedback.
Andrew MacphersonChair, HRRNC
Appointed 6th December 2017
Naseema SparksChair, HRRNC Outgoing
Chair’s Letter
For
per
sona
l use
onl
y
The Board has listened to our
stakeholders and made changes to our executiveremuneration practices.
These changes better align KMP remuneration with shareholder experience and expectations, and
to market.
2017 REMUNERATION REPORT
Melbourne IT Group Annual Report 2017 37
For
per
sona
l use
onl
y

At the last AGM in May 2017, 38% of votes cast were registered against the 2016 Remuneration Report. In response, the Board Chair and HRRNC Committee Chair held face-to-face meetings with key shareholders and advisers in order to develop a much better understanding of shareholder views and in particular emerging preferences with regard to executive remuneration.
Following these sessions, we incorporated that feedback into the broader scope of changes we had identified to the remuneration arrangements in place for Melbourne IT’s executive key management personnel (KMP). These changes seek to address shareholder concerns and are described in further detail throughout this report, and are summarised below.
Use of EPS and TSR as vesting hurdles for LTIWhat was the issue?Specifically, concerns were raised about the lack of clarity regarding LTI calculations and whether EPS was the most appropriate measure for a company like Melbourne IT that is undertaking mergers and acquisitions (M&A) activity.
What will change in 2018?We have removed EPS as one of the two vesting hurdles, and for 2018 will only use relative total shareholder return (TSR) as a vesting hurdle. The comparator group for TSR purposes will continue to consist of the ASX Small Ordinaries Index excluding energy, mining and property trusts.
Why has it been changed?Acquisitions and divestments make the setting of multi-year EPS targets very difficult. Some investors may also hold the view that M&A activity allows executives to “buy” their way to achieving their LTI targets. We see properly executed M&A activity as a legitimate factor in shareholder value creation and believe that management should be rewarded for doing this successfully. However, it is a contentious topic and we have decided that, for now, it is prudent to remove EPS growth as a vesting hurdle for the purposes of the LTI.
STI does not include any deferred componentWhat was the issue? To date, the short-term incentive (STI) incentive has been granted totally in cash, after achievement of the relevant KPI targets, and at the end of the assessment year. There are some who believe that this may not lead to strong alignment with shareholders. In addition, management also recognises the importance of remuneration and incentive practices in attracting, retaining and motivating our key executives. A cash-only STI, with no equity component is not competitive in the current labour environment.
What will change in 2018? We have changed the STI make-up so that a portion will be paid in cash at the end of each year, subject to achieving the annual KPIs. The other portion of the STI will be awarded in the form of equity rights that vest over the subsequent two years, half each year. In order for the rights to be granted, the annual performance condition must be met. Subsequent to this, in order for the rights to vest, a “service” condition must also be met ie. the recipient must be a Melbourne IT employee at the time of vesting.
Why has it been changed? This change reflects contemporary practice and helps in aligning our remuneration and incentive arrangements with shareholder interests. Also, to be competitive in today’s labour environment, we need to increase our at risk remuneration for executives, in particular, in the form of equity.
Non-executive directors do not have enough investedWhat was the issue? A concern was raised that independent directors don’t have sufficient share ownership and this does not lead to strong alignment between director and shareholder interests.
What will change in 2018? In 2018, two changes have been made to directors’ remuneration arrangements. Firstly, a minimum shareholding policy has been implemented whereby each director needs to be holding the equivalent of at least one year’s fees in shares. This condition needs to be met within three years of commencement. Secondly, each director can sacrifice up to 50% of their fees to acquire shares.
Why has it been changed? Requiring directors to hold a material number of shares facilitates greater alignment of interests with shareholders.
Melbourne IT Group Annual Report 201738
OUR RESPONSE TO YOUR FEEDBACK
For
per
sona
l use
onl
y

This Remuneration Report outlines the remuneration arrangements in place during 2017 and the outcomes achieved for Melbourne IT’s KMP during that period.
Melbourne IT’s KMP are those people who have a meaningful capacity to shape and influence the group’s strategic direction and performance through their actions, either collectively (in the case of the Board) or as individuals acting under delegated authorities (in the case of the CEO and his direct reports).
The names and positions of individuals who were KMP during 2017 and non-executive directors are below.
KMP movements:Peter Findlay (CFO) resigned on 20 January 2017
Stuart Bland (CFO) resigned on 30 September 2017
Fraser Bearsley appointed CFO on 1 October 2017
Simon Jones retired as Chair on 1 February 2017, and retired on 29 May 2017
Gail Pemberton, AO, appointed as Chair on 1 February 2017
Tom Kiing retired from board 30 September 2017
Andrew Macpherson appointed to board on 19 July 2017
Simon Martin appointed to board on 19 July 2017
Martin Mercer Managing Director
and CEO
Gail Pemberton,
AO Chair
Fraser Bearsley
Chief Financial Officer
John Armstrong Chair, ARMC
Peter Wright Managing Director,
ES
Naseema Sparks, AM Outgoing Chair,
HRRNC
Emma Hunt Managing Director,
SMB
Larry Bloch
Brett Fenton Chief Technology
Officer
Andrew Macpherson
Chair, HRRNC Appointed 6th December 2017
Simon Martin
Amy Rixon Chief Brand,
People & Culture Officer
3. KMP information
3(a) Executives
3(b) Non-Executive Directors
2017 REMUNERATION REPORT
Melbourne IT Group Annual Report 2017 39
For
per
sona
l use
onl
y

The charts and table below highlights Melbourne IT’s performance against key metrics for the past five years.
Underlying financial information presented excludes one-off and non-recurring expenses/income, and includes the pro forma impacts of acquisitions/divestments made in the financial
period as if that acquisition/divestment had applied for the entire financial period.
2014 2015 2016 2017
Total Shareholder Return (TSR) 56% 61% -4% 90%
Market Capitalisation 134.77m 198.90m 188.61m 424.86m
Staff Engagement 35% 44% 33% 67%
Table 7: Performance against key metrics
1. A one-off special dividend of 25.0 cents per share was paid in 2013 following the divestment of the Group’s DBS business unit. No other dividend was paid to shareholders in that year.
100
50
200
250
150
2013 2014 2015
Revenue ($m)
2016 2017
20
10
40
30
50
2013 2014 2015
Underlying EBITDA ($m)
2016 2017
10
20
2013 2014 2015
Underlying EPS (cents)
2016 2017
10
5
15
2013 2014 2015
Dividend ($m)
2016 2017
103.4
52.1
124.7
150.3
51.3
65.1
59.6
81.1
69.2
168.4
85.6
82.8
197.8
106.1
91.75.82.1
16.3
22.0
3.7
10.2
6.1
12.0
10.0
28.4
17.8
10.6
38.6
21.8
16.8
7.5
2.8
9.5 11.5
4.7
6.2
3.3
6.5
5.0
14.2
H1 H2
9.6
4.6
17.0
10.2
6.8
5.0 5.0
4.0
1.0
4.0
1.0
8.0
6.0
2.0
11.0
7.5
3.5
4YR CAGR 61%4YR CAGR 18%
3YR CAGR 30% 4YR CAGR 23%
Figure 6: Peformance against key metrics
Melbourne IT Group Annual Report 201740
4. Five-year performance summary
For
per
sona
l use
onl
y
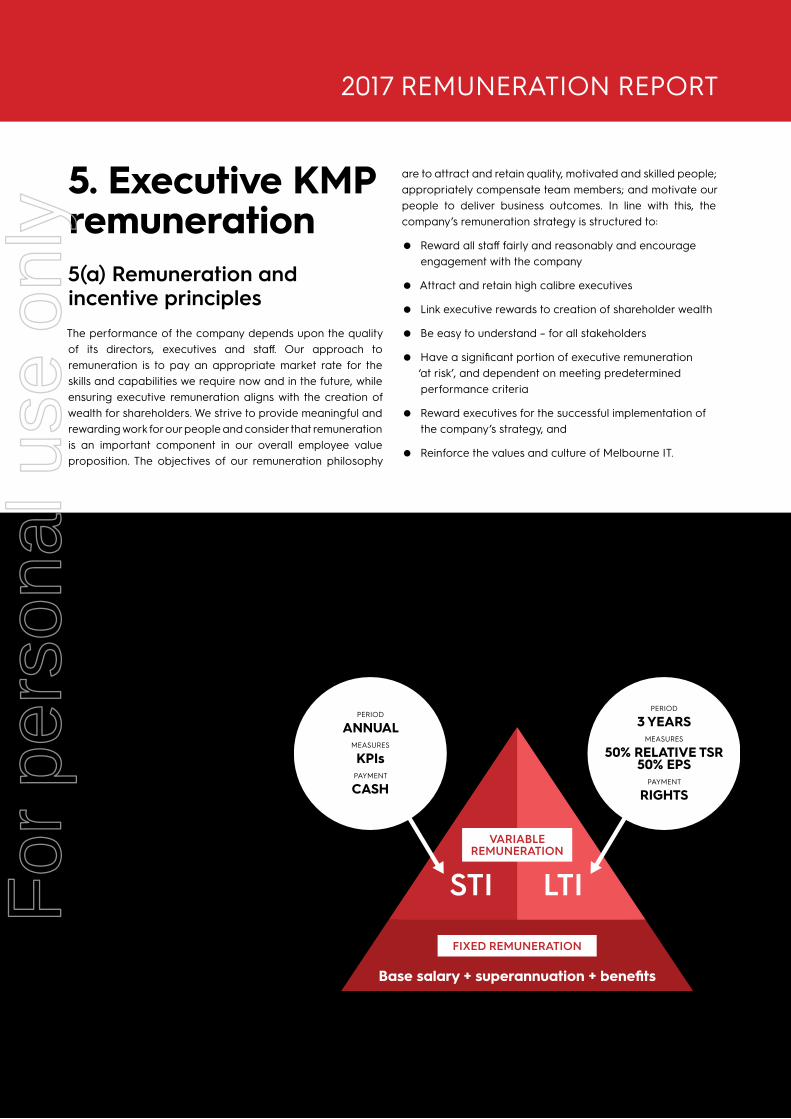
5(a) Remuneration and incentive principlesThe performance of the company depends upon the quality of its directors, executives and staff. Our approach to remuneration is to pay an appropriate market rate for the skills and capabilities we require now and in the future, while ensuring executive remuneration aligns with the creation of wealth for shareholders. We strive to provide meaningful and rewarding work for our people and consider that remuneration is an important component in our overall employee value proposition. The objectives of our remuneration philosophy
5. Executive KMP remuneration
Fixed remuneration
The HRRNC reviews fixed remuner-ation annually. The process includes a review of company-wide, business unit and individual performance, relevant comparative remuneration in the market and internally, and where appropriate, external advice on policies and practices. The HRRNC has access to external advice inde-pendent of management.
Executives receive their fixed (primary) remuneration in cash. The details of the fixed remuneration component received by executives in 2017 is included in tables 14 & 15.
Variable remuneration
The HRRNC reviews variable remu-neration annually. The process for the STI Plan includes the setting and reviewing of annual KPIs aligned with business plans (the details of which are outlined in tables 8 and 16). For the LTI, performance hurdles are set and reviewed by the HRRNC and the Board (outlined in tables 9 and 13).
2017 Remuneration Framework
are to attract and retain quality, motivated and skilled people; appropriately compensate team members; and motivate our people to deliver business outcomes. In line with this, the company’s remuneration strategy is structured to:
• Reward all staff fairly and reasonably and encourage engagement with the company
• Attract and retain high calibre executives
• Link executive rewards to creation of shareholder wealth
• Be easy to understand – for all stakeholders
• Have a significant portion of executive remuneration ‘at risk’, and dependent on meeting predetermined performance criteria
• Reward executives for the successful implementation of the company’s strategy, and
• Reinforce the values and culture of Melbourne IT.
STI LTI
FIXED REMUNERATION
VARIABLEREMUNERATION
Base salary + superannuation + benefits
PERIOD
ANNUALMEASURES
KPIsPAYMENT
CASH
PERIOD
3 YEARSMEASURES
50% RELATIVE TSR50% EPS
PAYMENT
RIGHTS
2017 REMUNERATION REPORT
Melbourne IT Group Annual Report 2017 41
For
per
sona
l use
onl
y

5(b) How performance is linked to STI outcomes
Objective
The STI Plan aims to link the achievement of the Group’s operational and financial targets with the remuneration received by the executives charged with meeting those targets. The total potential STI amount available provides an incentive to the executives and senior leaders to achieve the targets, while also being a reasonable cost to the Group.
Structure
The percentage of total remuneration that constitutes an executive’s STI varies depending on the size of the role and its impact on the attainment of the Group’s short-term targets. STI payments are made if the relevant targets are achieved. If the targets are not achieved, then any STI payment is discretionary and will only be made if the executive has demonstrated exceptional performance in meeting other objectives.
The total STI payment amount is determined by reference to an executive’s performance against Group and individual targets (‘performance targets’). These targets represent the key performance indicators for the short-term success of the business, and provide a framework for delivering long-term value. Achievement against the performance targets is assessed annually, within three months of the EOFY, and all payments are both reviewed and approved by the HRRNC. The STI limits range from nil to 150% for the Group measures, and nil to 100% for the individual measures.
STI performance targets
Group and divisional performance targets consist of revenue, underlying EBITDA and underlying Net Profit After Tax (NPAT) KPIs. These are ‘hard’ targets used to set STI payments. In addition, the underlying EBITDA target is a gateway target; if it is not achieved then no STI is payable irrespective of the achievement against the other KPIs.
The table below shows the KPIs for each of the KMP, for 2017 the weighting attached to that KPI, the actual achievement relative to each KPI and the overall achievement relative to their potential payment.
ROLE Group Targets ES SMB Other Target Sub-Total Disc¹ TOTAL
EBITDA Revenue NPAT EBITDA EBITDA Engagement Synergies OTE2 Act³
Target Actual Target Actual Target Actual Target Actual Target Actual Target Actual Target Actual
CEO (Mercer) 50% 39% 30% 18% 20% 13% 100% 70% 10% 80%
CFO (Bearsley) 50% 39% 10% 6% 40% 26% 100% 71% 71%
MD, ES (Wright) 30% 23% 20% 12% 50% 0% 100% 35% 25% 60%
MD, SMB (Hunt) 30% 23% 20% 12% 50% 50% 100% 85% 85%
CBP&CO (Rixon)
50% 39% 10% 6% 40% 40% 100% 85% 10% 95%
CTO (Fenton) 50% 39% 10% 6% 40% 40% 100% 85% 85%
Table 8: Key management personnel KPIs
1. Disc are instances where the board exercised its discretion to increase/decrease the amount payable due to considerations unique to the individual’s performance. In the case of Martin Mercer and Amy Rixon the additional amount was in recognition of their efforts in the successful acquistion of WME and in the case of Peter Wright it was in recognition of the exceptional performance in successfully delivering a complex change program over the past 12 months. Peter Wright must be an employee on 1 January 2019 to recieve this payment.
2. The on-target amount or potential amount of the individual’s STI entitlement that will be realised if the target for 100% achievement on each metric is realised
3. The actual achievement based on performance relative to each key performance indicator (KPI)
For
per
sona
l use
onl
y
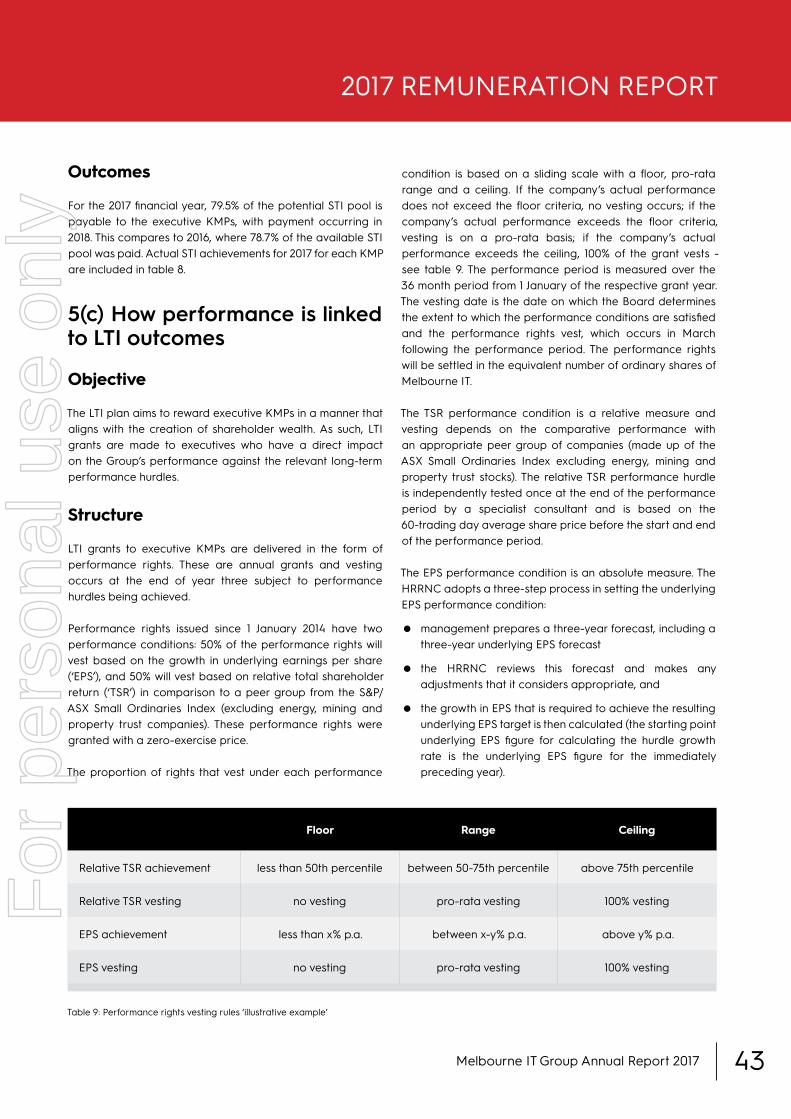
5(c) How performance is linked to LTI outcomes
Objective
The LTI plan aims to reward executive KMPs in a manner that aligns with the creation of shareholder wealth. As such, LTI grants are made to executives who have a direct impact on the Group’s performance against the relevant long-term performance hurdles.
Structure
LTI grants to executive KMPs are delivered in the form of performance rights. These are annual grants and vesting occurs at the end of year three subject to performance hurdles being achieved.
Performance rights issued since 1 January 2014 have two performance conditions: 50% of the performance rights will vest based on the growth in underlying earnings per share (‘EPS’), and 50% will vest based on relative total shareholder return (‘TSR’) in comparison to a peer group from the S&P/ASX Small Ordinaries Index (excluding energy, mining and property trust companies). These performance rights were granted with a zero-exercise price.
The proportion of rights that vest under each performance
condition is based on a sliding scale with a floor, pro-rata range and a ceiling. If the company’s actual performance does not exceed the floor criteria, no vesting occurs; if the company’s actual performance exceeds the floor criteria, vesting is on a pro-rata basis; if the company’s actual performance exceeds the ceiling, 100% of the grant vests - see table 9. The performance period is measured over the 36 month period from 1 January of the respective grant year. The vesting date is the date on which the Board determines the extent to which the performance conditions are satisfied and the performance rights vest, which occurs in March following the performance period. The performance rights will be settled in the equivalent number of ordinary shares of Melbourne IT.
The TSR performance condition is a relative measure and vesting depends on the comparative performance with an appropriate peer group of companies (made up of the ASX Small Ordinaries Index excluding energy, mining and property trust stocks). The relative TSR performance hurdle is independently tested once at the end of the performance period by a specialist consultant and is based on the 60-trading day average share price before the start and end of the performance period.
The EPS performance condition is an absolute measure. The HRRNC adopts a three-step process in setting the underlying EPS performance condition:
• management prepares a three-year forecast, including a three-year underlying EPS forecast
• the HRRNC reviews this forecast and makes any adjustments that it considers appropriate, and
• the growth in EPS that is required to achieve the resulting underlying EPS target is then calculated (the starting point underlying EPS figure for calculating the hurdle growth rate is the underlying EPS figure for the immediately preceding year).
Floor Range Ceiling
Relative TSR achievement less than 50th percentile between 50-75th percentile above 75th percentile
Relative TSR vesting no vesting pro-rata vesting 100% vesting
EPS achievement less than x% p.a. between x-y% p.a. above y% p.a.
EPS vesting no vesting pro-rata vesting 100% vesting
Table 9: Performance rights vesting rules ‘illustrative example’
Outcomes
For the 2017 financial year, 79.5% of the potential STI pool is payable to the executive KMPs, with payment occurring in 2018. This compares to 2016, where 78.7% of the available STI pool was paid. Actual STI achievements for 2017 for each KMP are included in table 8.
2017 REMUNERATION REPORT
Melbourne IT Group Annual Report 2017 43
For
per
sona
l use
onl
y
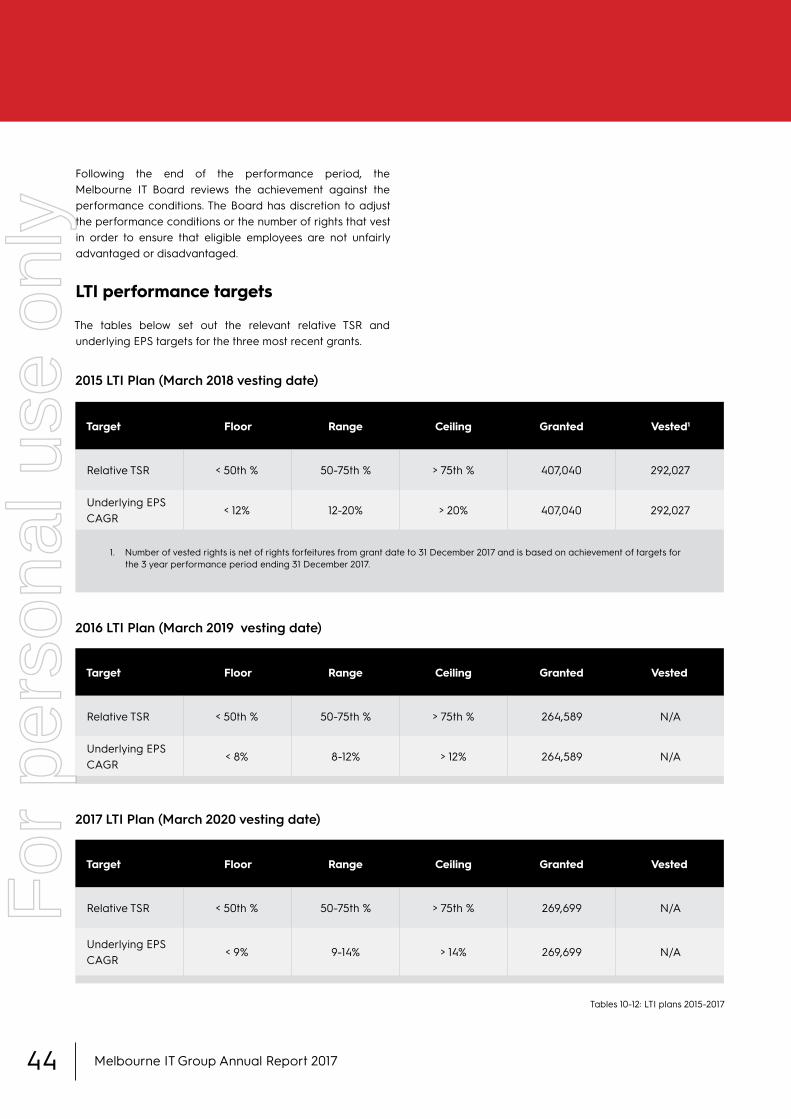
Following the end of the performance period, the Melbourne IT Board reviews the achievement against the performance conditions. The Board has discretion to adjust the performance conditions or the number of rights that vest in order to ensure that eligible employees are not unfairly advantaged or disadvantaged.
LTI performance targets
The tables below set out the relevant relative TSR and underlying EPS targets for the three most recent grants.
Target Floor Range Ceiling Granted Vested¹
Relative TSR < 50th % 50-75th % > 75th % 407,040 292,027
Underlying EPS CAGR
< 12% 12-20% > 20% 407,040 292,027
2016 LTI Plan (March 2019 vesting date)
2015 LTI Plan (March 2018 vesting date)
2017 LTI Plan (March 2020 vesting date)
Target Floor Range Ceiling Granted Vested
Relative TSR < 50th % 50-75th % > 75th % 264,589 N/A
Underlying EPS CAGR
< 8% 8-12% > 12% 264,589 N/A
Target Floor Range Ceiling Granted Vested
Relative TSR < 50th % 50-75th % > 75th % 269,699 N/A
Underlying EPS CAGR
< 9% 9-14% > 14% 269,699 N/A
1. Number of vested rights is net of rights forfeitures from grant date to 31 December 2017 and is based on achievement of targets for the 3 year performance period ending 31 December 2017.
Tables 10-12: LTI plans 2015-2017
Melbourne IT Group Annual Report 201744
For
per
sona
l use
onl
y

Outcomes
2017 LTI Plan
539,398 performance rights were granted to all eligible participants on 29 May 2017, including the CEO’s grant of 247,382 rights. Shareholders at the Annual General Meeting on 29 May 2017 approved the grant to the CEO.
2016 LTI Plan
529,178 performance rights relating to the 2016 LTI Plan were granted to all eligible participants on 27 May 2016, including the CEO’s grant of 219,219 rights. Shareholders at the Annual General Meeting on 27 May 2016 approved the grant to the CEO.
2015 LTI Plan
528,828 performance rights relating to the 2015 LTI Plan were granted to all eligible participants (except for the CEO) on 30 March 2015. The CEO received a grant of 285,252 rights on 29 June 2015, following approval by shareholders at the Annual General Meeting on 27 May 2015. As at 31 December 2017, 584,054 rights (or 100%) vested based on actual achievement of the 2015 LTI Plan performance targets. The balance of 230,026 rights were cancelled following the resignation of the rights’ holders.
Grant Year Target EPS1 Actual EPS 2017 Actual EPS 2018 Actual EPS 2019 Rights Vested2 %
2015 11.55 173 100
2016 16.23 N/A N/A
2017 15.10 N/A N/A
1. This is the forecast underlying EPS target that was approved by the HRRNC and from which the hurdle rate is calculated.
2. The percentage of the EPS component that has vested (Note: 50% of the rights vest if the EPS hurdle is achieved and the other 50% are subject to a relative TSR test).
3. An underlying EPS result of 17c per share represents a 21.3% compound annual growth rate (CAGR) over the three-year performance period. The target CAGR required for the 2015 performance rights to vest was 7%. Accordingly, 100% of the rights subject to the EPS performance condition have vested. For completeness we note that there is a discrepancy between the published hurdle rate for the EPS performance condition for the 2015 Grant of 20% (this was contained in the Notice of Meeting for the 2015 AGM) and the target growth rate required for 100% of the rights to vest (ie 7%). This discrepancy arose because an estimate of the starting EPS was used in the calculation of the hurdle rate for the 2015 grant. When the audited accounts were finalised the actual base EPS differed from the estimate. While regrettable, this had no practical consequence, the target EPS (see note 1 above) was correctly determined and it is achievement of the target EPS that determines whether or not the rights vest. Having said this, the actual CAGR over the three-year performance period was 21.3%, which was more than three times the required growth (ie 7%) for 100% vesting, and was also greater than the top of the published range (ie 20%). Fortunately, the use of an incorrect starting point in the calculation of the official hurdle rates was of no consequence
The table below sets out the relevant underlying EPS targets for the three most recent grants.
Table 13: Relevant underlying EPS targets
2017 REMUNERATION REPORT
Melbourne IT Group Annual Report 2017 45
For
per
sona
l use
onl
y
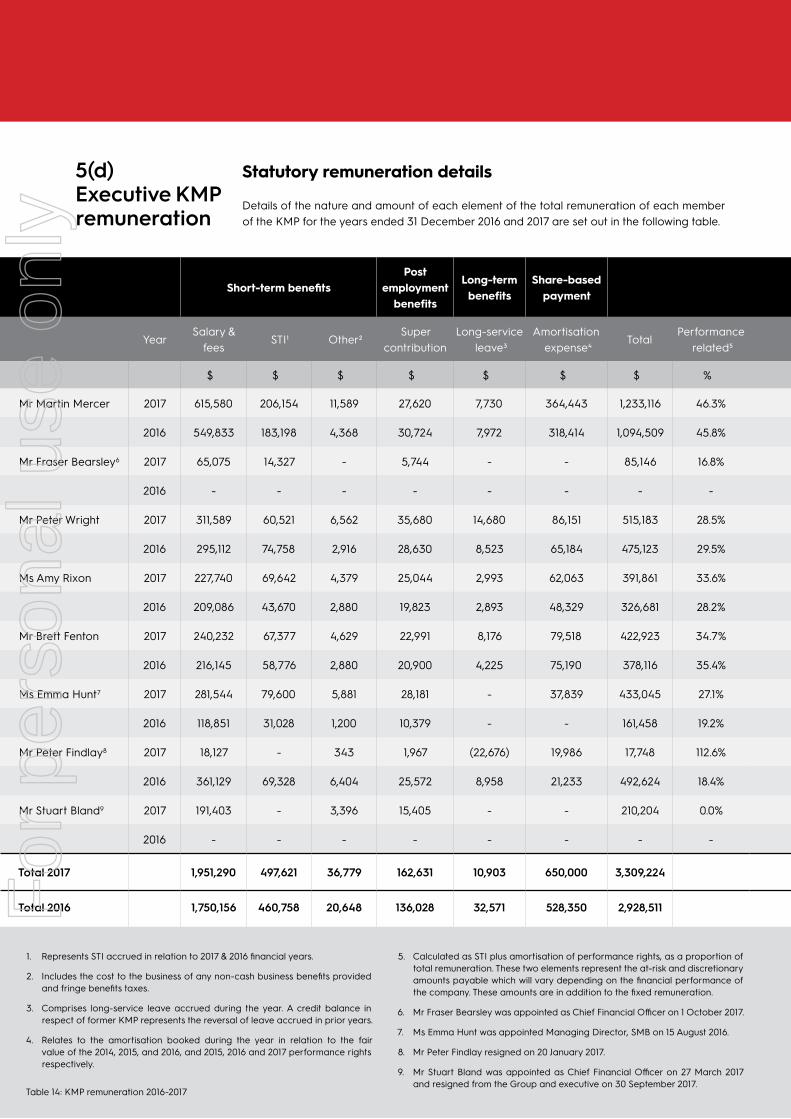
5(d) Executive KMP remuneration
Short-term benefitsPost
employment benefits
Long-term benefits
Share-based payment
YearSalary &
feesSTI¹ Other²
Super contribution
Long-service leave³
Amortisation expense⁴
TotalPerformance
related⁵
$ $ $ $ $ $ $ %
Mr Martin Mercer 2017 615,580 206,154 11,589 27,620 7,730 364,443 1,233,116 46.3%
2016 549,833 183,198 4,368 30,724 7,972 318,414 1,094,509 45.8%
Mr Fraser Bearsley6 2017 65,075 14,327 - 5,744 - - 85,146 16.8%
2016 - - - - - - - -
Mr Peter Wright 2017 311,589 60,521 6,562 35,680 14,680 86,151 515,183 28.5%
2016 295,112 74,758 2,916 28,630 8,523 65,184 475,123 29.5%
Ms Amy Rixon 2017 227,740 69,642 4,379 25,044 2,993 62,063 391,861 33.6%
2016 209,086 43,670 2,880 19,823 2,893 48,329 326,681 28.2%
Mr Brett Fenton 2017 240,232 67,377 4,629 22,991 8,176 79,518 422,923 34.7%
2016 216,145 58,776 2,880 20,900 4,225 75,190 378,116 35.4%
Ms Emma Hunt7 2017 281,544 79,600 5,881 28,181 - 37,839 433,045 27.1%
2016 118,851 31,028 1,200 10,379 - - 161,458 19.2%
Mr Peter Findlay8 2017 18,127 - 343 1,967 (22,676) 19,986 17,748 112.6%
2016 361,129 69,328 6,404 25,572 8,958 21,233 492,624 18.4%
Mr Stuart Bland9 2017 191,403 - 3,396 15,405 - - 210,204 0.0%
2016 - - - - - - - -
Total 2017 1,951,290 497,621 36,779 162,631 10,903 650,000 3,309,224
Total 2016 1,750,156 460,758 20,648 136,028 32,571 528,350 2,928,511
Statutory remuneration details
Details of the nature and amount of each element of the total remuneration of each member of the KMP for the years ended 31 December 2016 and 2017 are set out in the following table.
Table 14: KMP remuneration 2016-2017
1. Represents STI accrued in relation to 2017 & 2016 financial years.
2. Includes the cost to the business of any non-cash business benefits provided and fringe benefits taxes.
3. Comprises long-service leave accrued during the year. A credit balance in respect of former KMP represents the reversal of leave accrued in prior years.
4. Relates to the amortisation booked during the year in relation to the fair value of the 2014, 2015, and 2016, and 2015, 2016 and 2017 performance rights respectively.
5. Calculated as STI plus amortisation of performance rights, as a proportion of total remuneration. These two elements represent the at-risk and discretionary amounts payable which will vary depending on the financial performance of the company. These amounts are in addition to the fixed remuneration.
6. Mr Fraser Bearsley was appointed as Chief Financial Officer on 1 October 2017.
7. Ms Emma Hunt was appointed Managing Director, SMB on 15 August 2016.
8. Mr Peter Findlay resigned on 20 January 2017.
9. Mr Stuart Bland was appointed as Chief Financial Officer on 27 March 2017 and resigned from the Group and executive on 30 September 2017.
For
per
sona
l use
onl
y
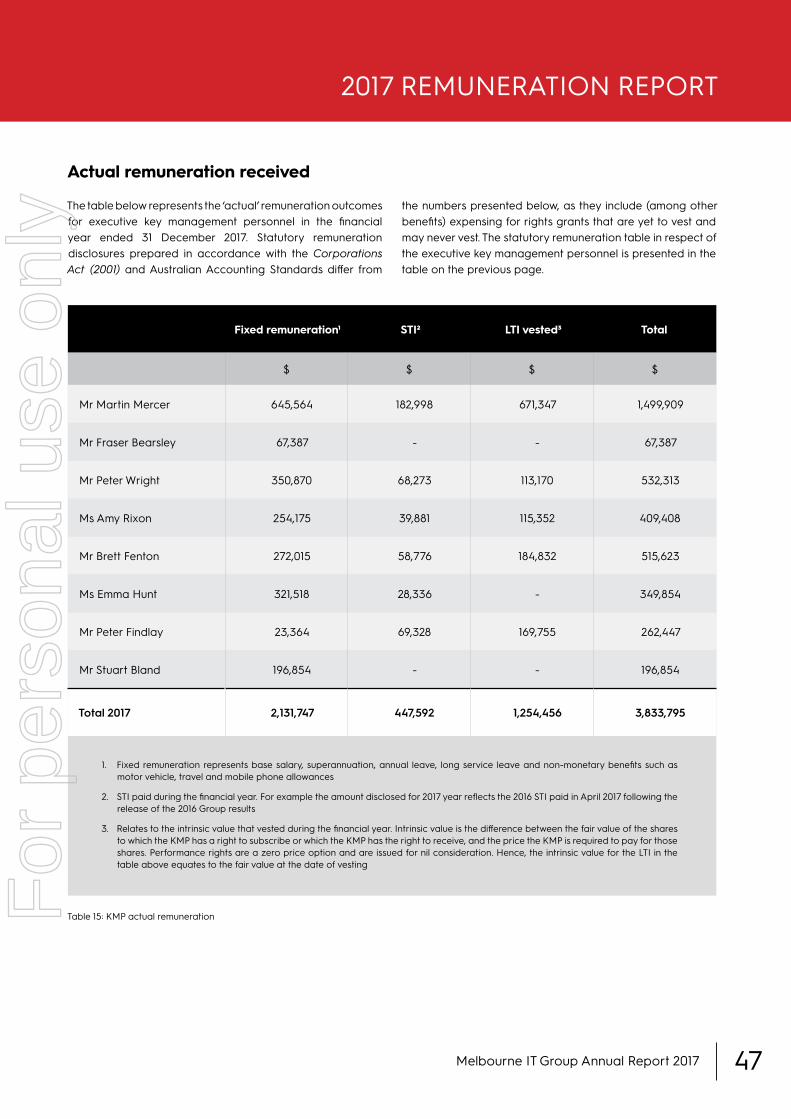
Actual remuneration received
The table below represents the ‘actual’ remuneration outcomes for executive key management personnel in the financial year ended 31 December 2017. Statutory remuneration disclosures prepared in accordance with the Corporations Act (2001) and Australian Accounting Standards differ from
the numbers presented below, as they include (among other benefits) expensing for rights grants that are yet to vest and may never vest. The statutory remuneration table in respect of the executive key management personnel is presented in the table on the previous page.
Fixed remuneration¹ STI² LTI vested³ Total
$ $ $ $
Mr Martin Mercer 645,564 182,998 671,347 1,499,909
Mr Fraser Bearsley 67,387 - - 67,387
Mr Peter Wright 350,870 68,273 113,170 532,313
Ms Amy Rixon 254,175 39,881 115,352 409,408
Mr Brett Fenton 272,015 58,776 184,832 515,623
Ms Emma Hunt 321,518 28,336 - 349,854
Mr Peter Findlay 23,364 69,328 169,755 262,447
Mr Stuart Bland 196,854 - - 196,854
Total 2017 2,131,747 447,592 1,254,456 3,833,795
1. Fixed remuneration represents base salary, superannuation, annual leave, long service leave and non-monetary benefits such as motor vehicle, travel and mobile phone allowances
2. STI paid during the financial year. For example the amount disclosed for 2017 year reflects the 2016 STI paid in April 2017 following the release of the 2016 Group results
3. Relates to the intrinsic value that vested during the financial year. Intrinsic value is the difference between the fair value of the shares to which the KMP has a right to subscribe or which the KMP has the right to receive, and the price the KMP is required to pay for those shares. Performance rights are a zero price option and are issued for nil consideration. Hence, the intrinsic value for the LTI in the table above equates to the fair value at the date of vesting
Table 15: KMP actual remuneration
2017 REMUNERATION REPORT
Melbourne IT Group Annual Report 2017 47
For
per
sona
l use
onl
y

Short-term incentives
The following table present the STI targets and achievements for the financial years ending 31 December 2016 and 2017.
The performance rights, issued for nil consideration, are issued in accordance with performance guidelines established by the directors of Melbourne IT Ltd. Each performance right carries an entitlement to one fully paid ordinary share in Melbourne IT Ltd. The table on the following page discloses the number of performance rights granted, vested, exercised or forfeited as remuneration.
Performance rights awarded, vested and forfeited during the year
KMP Years STI
Target $
Achieved %
M Mercer (CEO) 2017 258,500 79.75%
2016 213,500 85.81%
F Bearsley¹ (CFO) 2017 20,250 70.75%
2016 - -
P Wright (MD ES) 2017 100,950 60.00%
2016 90,750 75.23%
E Hunt² (MD SMB) 2017 93,623 85.02%
2016 93,623 33.14%
A Rixon (CBP&CO) 2017 73,500 94.75%
2016 58,753 67.88%
B Fenton (CTO) 2017 79,500 84.75%
2016 72,270 81.33%
P Findlay (CFO)³ 2017 - -
2016 100,000 69.33%
S Bland (CFO)⁴ 2017 79,219 -
2016 - -
1. F Bearsley was appointed on 1 October 2017.
2. E Hunt was appointed 15 August 2016 as MD for SMB and did not have 2016 KPIs set. In 2016, pro-rata STI was paid.
3. P Findlay resigned on 20 January 2017.
4. S Bland was appointed as Chief Financial Officer on 27 March 2017 and resigned from the Group and executive on 30 September 2017.
Table 16: STI targets and achievements
Melbourne IT Group Annual Report 201748
For
per
sona
l use
onl
y

YearsRights
Granted Award Date
Fair value of right at award date
Volume weighted average
price1
Vesting date
Total Vested
Total Forfeited
Value of rights
granted during
the year
Value of rights vested during
the year
Market value of
rights vested
during the year²
$ $ $
Mr Martin Mercer 2017 247,382 29 May 2017 1.99 1.91 31 March 2020 - - 491,053 - -
2016 219,219 27 May 2016 1.29 2.08 31 March 2019 - - - - -
2015 285,252 27 May 2015 1.12 1.39 31 March 2018 - - - - -
2014 296,610 27 May 2014 1.19 1.18 31 March 2017 296,610 - - 352,966 671,347
Mr Peter Wright 2017 61,662 29 May 2017 1.99 1.91 31 March 2020 - - 122,399 - -
2016 54,231 27 May 2016 1.29 2.08 31 March 2019 - - - - -
2015 66,763 30 Mar 2015 0.99 1.39 31 March 2018 - - - - -
2014 50,000 12 Jan 2015 1.19 1.08 31 March 2017 50,000 - - 59,500 113,170
Mr Brett Fenton 2017 55,497 29 May 2017 1.99 1.91 31 March 2020 - - 110,162 - -
2016 46,327 27 May 2016 1.29 2.08 31 March 2019 - - - - -
2015 69,324 30 Mar 2015 0.99 1.39 31 March 2018 - - - - -
2014 81,661 12 Jan 2015 1.19 1.08 31 March 2017 81,661 - - 97,177 184,832
Ms Amy Rixon 2017 51,309 29 May 2017 1.99 1.91 31 March 2020 - - 101,848 - -
2016 31,071 27 May 2016 1.29 2.08 31 March 2019 - - - - -
2015 44,706 30 Mar 2015 0.99 1.39 31 March 2018 - - - - -
2014 50,964 12 Jan 2015 1.19 1.08 31 March 2017 50,964 - - 60,647 115,352
Ms Emma Hunt 2017 57,187 29 May 2017 1.99 1.91 31 March 2020 - - 113,516 - -
Mr Stuart Bland 2017 66,361 29 May 2017 1.99 1.91 31 March 2020 - 66,361 131,727 - -
Mr Peter Findlay 2016 79,327 27 May 2016 1.29 2.08 31 March 2019 - 57,692 - - -
2015 118,748 30 Mar 2015 0.99 1.39 31 March 2018 - 86,374 - - -
2014 75,000 12 Jan 2015 1.19 1.08 31 March 2017 75,000 - - 89,250 169,755
TOTAL 2,108,601 554,235 210,427 1,070,705 659,540 1,254,456
1. The volume weighted average price (VWAP) for the 20 trading days preceding the start of the performance period (ie 1 January) is used to determine the number of rights that are issued to a participant in the LTI scheme. The number of rights issued is simply the nominal dollar value of the entitlement of a participant per their remuneration package divided by the VWAP.
2. This is the market value (at the issue date) of the shares that were issued following the vesting of the rights. Table 17: Performance rights granted, vested, exercised or forfeited
2017 REMUNERATION REPORTF
or p
erso
nal u
se o
nly

Rights holdings of key management personnel as at 31 December 2017
The table below discloses a summary of performance rights granted under the LTI plans.
Shares issued on vesting of rights
During the year ended 31 December 2017, 554,235 shares were issued to the KMP (2016: 0) upon the vesting of 554,235 performance rights related to the 2014 LTI Plan. The table to the right presents the number of shares issued on the vesting of rights related to the 2014 LTI Plan.
Opening balance 1 January
2017
Rights granted as
remuneration
Rights vested and exercised
Rights forfeited
Closing balance
31 December 2017
Vested and exercisable at 31 December
2017
Vested and not exercisable at 31 December
2017
Mr Martin Mercer 801,081 247,382 (296,610) - 751,853 - -
Mr Peter Wright 170,994 61,662 (50,000) - 182,656 - -
Mr Brett Fenton 197,312 55,497 (81,661) - 171,148 - -
Ms Amy Rixon 126,741 51,309 (50,964) - 127,086 - -
Ms Emma Hunt - 57,187 - - 57,187 - -
Mr Stuart Bland - 66,361 - (66,361) - - -
TOTAL 1,296,128 539,398 (479,235) (66,361) 1,289,930 - -
Number of shares issued
Paid per share cents
Mr Martin Mercer 296,610 -
Mr Peter Wright 50,000 -
Mr Brett Fenton 81,661 -
Ms Amy Rixon 50,964 -
Mr Peter Findlay 75,000 -
TOTAL 554,235 -
Table 18: Performance rights granted
Table 19: Shares issued on the vesting of rights, 2014 LTI plan
Melbourne IT Group Annual Report 201750
For
per
sona
l use
onl
y
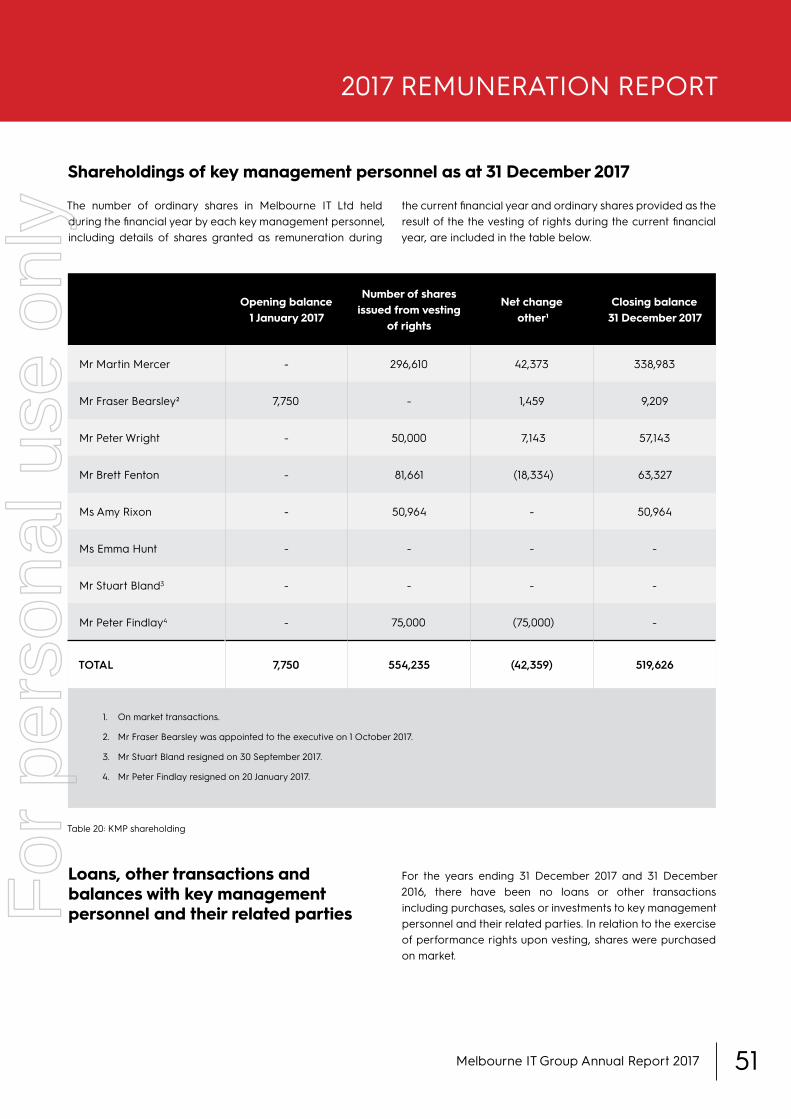
The number of ordinary shares in Melbourne IT Ltd held during the financial year by each key management personnel, including details of shares granted as remuneration during
Opening balance 1 January 2017
Number of shares issued from vesting
of rights
Net change other¹
Closing balance 31 December 2017
Mr Martin Mercer - 296,610 42,373 338,983
Mr Fraser Bearsley² 7,750 - 1,459 9,209
Mr Peter Wright - 50,000 7,143 57,143
Mr Brett Fenton - 81,661 (18,334) 63,327
Ms Amy Rixon - 50,964 - 50,964
Ms Emma Hunt - - - -
Mr Stuart Bland3 - - - -
Mr Peter Findlay4 - 75,000 (75,000) -
TOTAL 7,750 554,235 (42,359) 519,626
1. On market transactions.
2. Mr Fraser Bearsley was appointed to the executive on 1 October 2017.
3. Mr Stuart Bland resigned on 30 September 2017.
4. Mr Peter Findlay resigned on 20 January 2017.
the current financial year and ordinary shares provided as the result of the the vesting of rights during the current financial year, are included in the table below.
For the years ending 31 December 2017 and 31 December 2016, there have been no loans or other transactions including purchases, sales or investments to key management personnel and their related parties. In relation to the exercise of performance rights upon vesting, shares were purchased on market.
Loans, other transactions and balances with key management personnel and their related parties
Shareholdings of key management personnel as at 31 December 2017
Table 20: KMP shareholding
2017 REMUNERATION REPORT
Melbourne IT Group Annual Report 2017 51
For
per
sona
l use
onl
y

5(e) What is the remuneration outlook for 2018?Recruiting and retaining talent is a key challenge for all technology companies in order to drive growth in a highly-competitive environment. We need a contemporary employee value proposition, a key part of which is a compelling model for remuneration and reward. In 2018, we are enhancing
our remuneration framework by increasing the proportion of at-risk remuneration in executive compensation and introducing a greater degree of equity-based compensation in at risk remuneration. We are also increasing the group of eligible scheme participants across the business who can receive at-risk remuneration.
The below diagram illustrates the existing remuneration scheme, alongside the 2018 scheme that is being introduced.
Remuneration Frameworks
2017
2018
STI LTI
FIXED REMUNERATION
VARIABLEREMUNERATION
Base salary + Superannuation + Benefits
PERIOD
ANNUALMEASURES
KPIsPAYMENT
CASH
PERIOD
3 YEARSMEASURES
50% RELATIVE TSR50% EPS
PAYMENT
RIGHTS
STI LTI
FIXED REMUNERATION
VARIABLEREMUNERATION
Base salary + Superannuation + Benefits
PERIOD
3 YEARSMEASURES
KPIsPAYMENT
CASH &DEFERRED
RIGHTS
PERIOD
3 YEARSMEASURES
RELATIVE TSRPAYMENT
RIGHTFor
per
sona
l use
onl
y

The key changes to remuneration components in 2018 are noted as follows.
LTI
KMP will continue to be the only participants in the scheme. We will be enhancing this scheme to be simpler and more transparent for both investors and executives. We will do so by reducing the current two vesting criteria (of relative TSR and underlying EPS growth) to one (namely, relative TSR). The comparator group for TSR will continue to be the ASX Small Ordinaries Index excluding energy, mining and property trust stocks.
STI
We will adjust the STI scheme so that half the STI payment will be in cash, and half will be “deferred”. The deferred component is awarded in the form of rights which vest equally after years two and three (dependent on the achievement of a service condition - ie the recipient remains employed at the second and third anniversaries).
All STI payments will be based on the achievement of the annual KPIs.
We believe that these enhancements are appropriate in order to better align the interests of our shareholders and management. We also see them as being important factors in helping us to attract and retain key talent in these competitive times.
5(f) Executive KMPs service agreementsThe Managing Director and Chief Executive Officer, Mr Martin Mercer, is employed under an ongoing contract from 7 April
2014, and continues until such time that his employment is terminated. Under the terms of the contract:
• He receives fixed remuneration plus superannuation per year, reviewed annually
• He is eligible for a discretionary annual STI opportunity up to a maximum of 41% of fixed remuneration
• He is eligible to participate in the LTI plans on terms determined by the Board, subject to receiving shareholders’ approval
• He may resign from this position and thus terminate the contract by giving six months’ notice
• The company may terminate this employment contract by providing 12 months’ notice (except in circumstances where the employment has been terminated for cause).
All other executives are on standard contracts and are remunerated as stipulated in this report. For executives other than the CEO, termination of employment requires three months‘ notice.
Upon termination, the provisions for KMP are as follows:
• Total fixed remuneration will be paid as usual, until the agreed last working day
• STI and LTI arrangements are treated in accordance with the respective plan rules
• Should termination for cause occur, only fixed remuneration and accrued leave is paid until the final working day and any variable rewards or benefits are forfeited, and
• Company restraint periods of 12 months post termination restrict KMP from engaging in competitive business activity and solicitation of clients or staff.
This table outlines the participants of each scheme.
Senior Leaders (30)
KMP (6)
STI (Cash) STI (Deferred)
Senior Managers/Professionals (24)
LTI
2017 REMUNERATION REPORT
Melbourne IT Group Annual Report 2017 53
For
per
sona
l use
onl
y
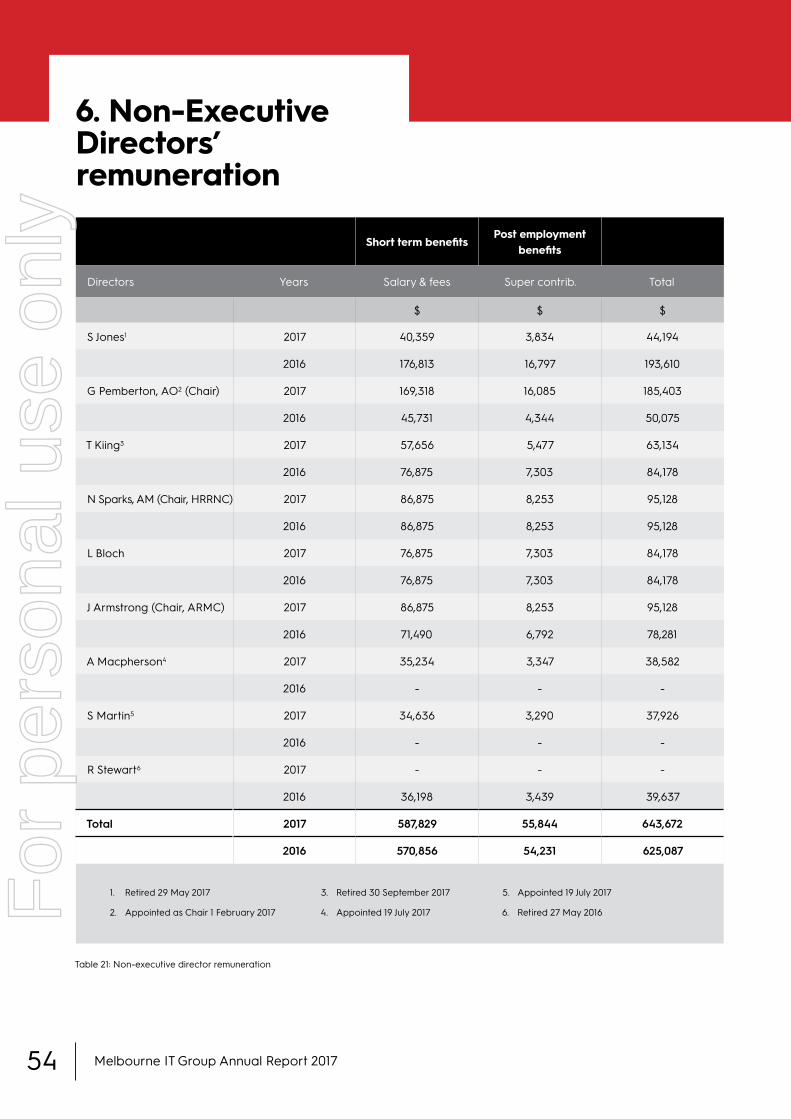
Short term benefitsPost employment
benefits
Directors Years Salary & fees Super contrib. Total
$ $ $
S Jones1 2017 40,359 3,834 44,194
2016 176,813 16,797 193,610
G Pemberton, AO2 (Chair) 2017 169,318 16,085 185,403
2016 45,731 4,344 50,075
T Kiing3 2017 57,656 5,477 63,134
2016 76,875 7,303 84,178
N Sparks, AM (Chair, HRRNC) 2017 86,875 8,253 95,128
2016 86,875 8,253 95,128
L Bloch 2017 76,875 7,303 84,178
2016 76,875 7,303 84,178
J Armstrong (Chair, ARMC) 2017 86,875 8,253 95,128
2016 71,490 6,792 78,281
A Macpherson4 2017 35,234 3,347 38,582
2016 - - -
S Martin5 2017 34,636 3,290 37,926
2016 - - -
R Stewart6 2017 - - -
2016 36,198 3,439 39,637
Total 2017 587,829 55,844 643,672
2016 570,856 54,231 625,087
1. Retired 29 May 2017
2. Appointed as Chair 1 February 2017
3. Retired 30 September 2017
4. Appointed 19 July 2017
5. Appointed 19 July 2017
6. Retired 27 May 2016
Table 21: Non-executive director remuneration
Melbourne IT Group Annual Report 201754
6. Non-Executive Directors’ remuneration
For
per
sona
l use
onl
y
6(a) Remuneration principles
Objective
The Board seeks to set aggregate remuneration at a level that provides the company with the ability to attract and retain directors of the highest calibre, while incurring a cost that is acceptable to shareholders.
Structure
The Constitution and the ASX Listing Rules specify that the aggregate remuneration of non-executive directors shall be determined by a general meeting. The last such determination was at the AGM on 20 May 2008, when shareholders approved an aggregate remuneration of $1,000,000 per year.
The amount of aggregate remuneration sought to be approved by shareholders and how it is apportioned amongst directors is reviewed periodically. The Board considers advice from external consultants, the fees paid to non-executive directors of comparable companies, as well as company performance when undertaking the annual review process.
Each director receives a fee for being a director of the company and is expected to be a member of at least one committee (except for non-independent directors who are invited guests to all committees). In recognition of the additional time commitment and responsibility required, an additional fee is paid for chairing a Board committee. The remuneration of non-executive directors is reviewed annually. As it is considered good governance for directors to have a
stake in a company on whose board they sit, non-executive directors are now required to hold shares in the company. This new shareholding policy was introduced in December 2017 and is discussed further below in section 6(b).
Details of the nature and amount of each element of the remuneration of each non-executive director of Melbourne IT Ltd for the past two financial years are shown in the table on page 54.
6(b) Minimum shareholding requirementsIn December 2017, the Board approved a policy requiring all non-executive directors to hold a minimum shareholding in the company to the value of their annual fixed remuneration. This requirement needs to be met by December 2020 for all existing directors, and within three years of their appointment date for new directors.
As at 31 December 2017, non-executive directors hold the value of shares in the company as shown in the table on page 56.
6(c) Salary sacrifice schemeTo encourage and assist non-executive directors to acquire and retain shares in the company, directors are allowed to sacrifice up to 50% of their annual fees to purchase company shares. These shares are purchased on-market by a third party agency.
2017 REMUNERATION REPORT
Melbourne IT Group Annual Report 2017 55
For
per
sona
l use
onl
y

7(a) Human Resources, Remuneration and Nomination Committee (HRRNC) The HRRNC of the Board of Directors of Melbourne IT determines and reviews compensation policy and arrangements for directors, executives and staff. The HRRNC periodically assesses the appropriateness of the nature and amount of remuneration of directors and executives by reference to relevant employment market conditions and the overall objective of ensuring maximum stakeholder benefit from the retention of a high-quality, high-performing directors and executive team.
7. Governance
Opening balance 1 January 2017
Net change other1Closing balance
31 December 2017
Mr Simon Jones2 157,201 25,295 182,496
Ms Gail Pemberton, AO 51,285 25,031 76,316
Ms Naseema Sparks, AM 6,612 12,077 18,689
Mr Larry Bloch 9,458,363 (900,000) 8,558,363
Mr John Armstrong - 20,000 20,000
Mr Simon Martin - 25,627 25,627
Mr Andrew Macpherson - 30,000 30,000
Mr Tom Kiing3 5,721,488 (3,083,340) 2,638,148
TOTAL 15,394,949 (3,845,310) 11,549,639
1. On market transactions.
2. Mr Simon Jones retired on 29 May 2017 and his holdings represent his closing balance at this date.
3. Mr Tom Kiing retired on 30 September 2017 and his holdings represent his closing balance at this date.
Shareholdings of Non-Executive Directors as at 31 December 2017
Table 22: Non-executive director shareholding
Review and approvalBOARD
Company-wide remuneration framework and policy. Executive & NED remuneration outcomes
HRRNC
Recommendations on remuneration outcomes for executive team
MANAGEMENTExternal
and independentremuneration advice
and information
REMUNERATION CONSULTANTS
For
per
sona
l use
onl
y

7(c) Securities trading policyThe company has approved a Share Trading Policy aimed at ensuring that no director or employee of the company makes use of his or her position or information acquired by being a director or employee to gain (directly or indirectly) an advantage for any person or to cause detriment to the company.
The policy provides guidance on what share trading activities by directors or employees are deemed acceptable and those which are not. Such guidance includes identifying conduct that may constitute insider trading, how an employee or director can minimise the risk of insider trading, and the closed periods during which directors, officers and key management personnel (and parties related to them) are not permitted to trade in Melbourne IT shares.
The policy also details the steps for directors and employees to take when buying or selling shares in Melbourne IT which includes requiring any director or key management personnel buying or selling Melbourne IT’s shares, or exercising any options, to first obtain approval from the Chair of the Board (for directors) or from the Chief Executive Officer (for key management personnel).
Remuneration consultant Services provided Fees paid
EYExecutive remuneration framework review
and advice in relation to shareholder concerns
67,980
Crichton & Associates Executive remuneration benchmarking 3,418
Gilbert + TobinRemuneration strike obligation and
response advices10,915
TOTAL 82,313
7(b) Use of remuneration consultantsThe HRRNC directly engages independent external advisers to provide input to the process of reviewing NED and executive remuneration. The HRRNC receives executive remuneration recommendations directly from external independent remuneration consultants. Table 23 below shows the fees paid to independent external remuneration consultants during 2017. Under communications and engagement protocols adopted by the company, the market data reports and the
recommendations were provided directly to the committee chair, and the consultants provided a statement to the committee that the reports and recommendations had been prepared free of undue influence from KMP. The committee had full oversight of the review process and therefore it, and the Board, were satisfied that the recommendations made by the consultants were free from undue influence by KMP.
Table 23: Remuneration consultant services and fees
2017 REMUNERATION REPORT
Melbourne IT Group Annual Report 2017 57
For
per
sona
l use
onl
y
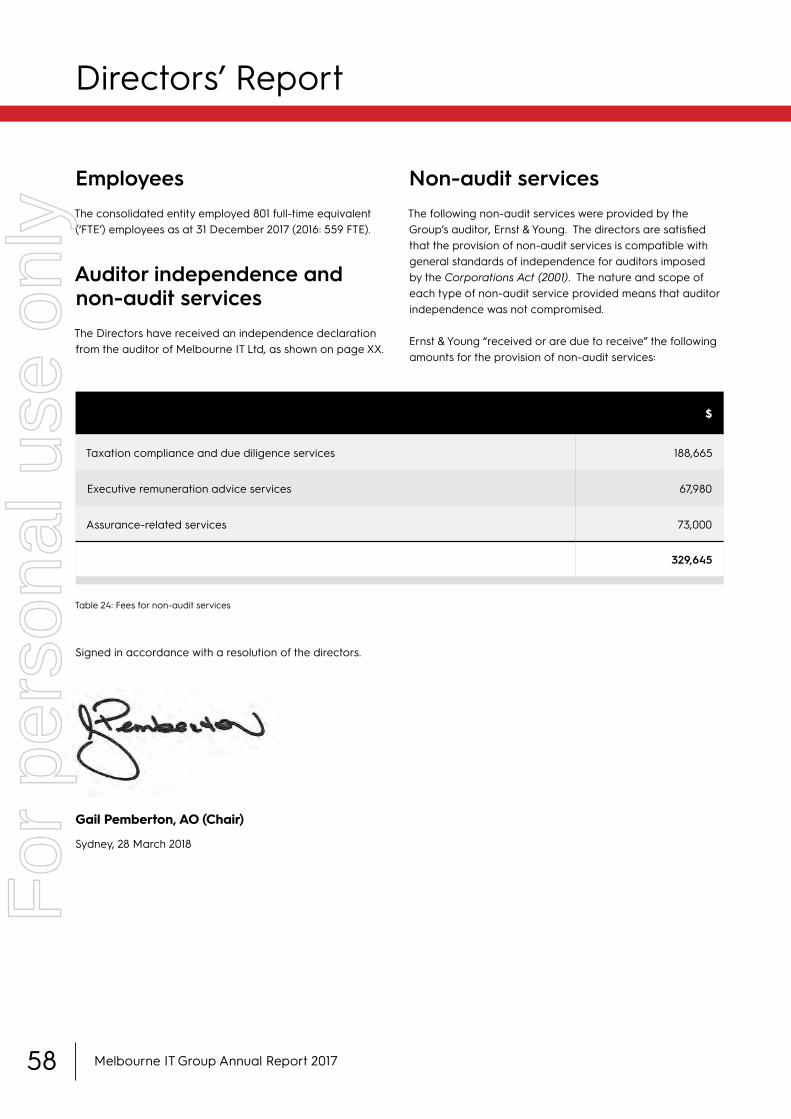
EmployeesThe consolidated entity employed 801 full-time equivalent (‘FTE’) employees as at 31 December 2017 (2016: 559 FTE).
Auditor independence and non-audit servicesThe Directors have received an independence declaration from the auditor of Melbourne IT Ltd, as shown on page XX.
Non-audit servicesThe following non-audit services were provided by the Group’s auditor, Ernst & Young. The directors are satisfied that the provision of non-audit services is compatible with general standards of independence for auditors imposed by the Corporations Act (2001). The nature and scope of each type of non-audit service provided means that auditor independence was not compromised.
Ernst & Young “received or are due to receive” the following amounts for the provision of non-audit services:
$
Taxation compliance and due diligence services 188,665
Executive remuneration advice services 67,980
Assurance-related services 73,000
329,645
Signed in accordance with a resolution of the directors.
Gail Pemberton, AO (Chair)
Sydney, 28 March 2018
Table 24: Fees for non-audit services
Melbourne IT Group Annual Report 201758
Directors’ ReportF
or p
erso
nal u
se o
nly

Directors’ DeclarationIn accordance with a resolution of the directors of Melbourne IT Ltd, I state that:
(1) In the opinion of the directors:
(a) the consolidated financial statements and notes of Melbourne IT Ltd for the financial year ended 31 December 2017 are in accordance with the Corporations Act (2001), including
(i) giving a true and fair view of the consolidated entity’s financial position as at 31 December 2017 and of its performance for the year ended on that date
(ii) complying with Accounting Standards and the Corporations Regulations (2001)
(b) the consolidated financial statements and notes also comply with International Financial Reporting Standards as disclosed in Notes to the Financial Statements
(c) there are reasonable grounds to believe that the company will be able to pay its debts as and when they become due and payable
(2) This declaration has been made after receiving the declarations required to be made to the directors in accordance with section 295A of the Corporations Act (2001) for the financial year ended 31 December 2017
(3) In the opinion of the directors, as at the date of this declaration, there are reasonable grounds to believe that the members of the Closed Group, as identified in Note E9, as parties to a Deed of Cross Guarantee, will be able to meet any obligations or liabilities to which they are, or may become subject to, under the deed as described in Note E8.
On behalf of the Board
Gail Pemberton, AO (Chair)
Sydney, 28 March 2018
Melbourne IT Group Annual Report 2017 59
For
per
sona
l use
onl
y

Directors’ Report and Financial Statements
Financial Statements
60 l Melbourne IT Group Annual Report 2017
Consolidated statement of financial position As at 31 December 2017
The above consolidated statement of financial position should be read in conjunction with the accompanying notes.
Notes 2017 2016ASSETS $’000 $’000Current AssetsCash and cash equivalents E1 20,250 16,426 Trade and other receivables B1 25,245 18,093 Prepayments of domain name registry charges 6,888 7,134 Derivative financial instruments C7 - 4 Other assets B2 11,191 4,484 Total Current Assets 63,574 46,141
Non-Current AssetsPlant and equipment B3 6,017 6,739 Intangible assets B4 259,096 224,741 Deferred tax assets A3 5,106 4,438 Prepayments of domain name registry charges 2,952 3,392 Non-current financial assets B5 2,085 1,795 Other assets 266 38 Total Non-Current Assets 275,522 241,143
TOTAL ASSETS 339,096 287,284
LIABILITIESCurrent LiabilitiesTrade and other payables B6 20,065 18,804 Interest-bearing loans and borrowings C4 9,029 92 Provisions B7 4,293 3,461 Current tax liabilities 2,845 1,684 Derivative financial instruments C7 128 - Income received in advance 25,533 25,166 Other financial liabilities C6 5,034 31,089 Total Current Liabilities 66,927 80,296
Non-Current LiabilitiesInterest-bearing loans and borrowings C4 65,992 36,536 Deferred tax liabilites A3 7,591 5,685 Provisions B7 901 803 Income received in advance 8,429 10,067 Other financial liabilities C6 6,593 8,315 Other liabilities 1,046 - Total Non-Current Liabilities 90,552 61,406
TOTAL LIABILITIES 157,479 141,702
NET ASSETS 181,617 145,582
EQUITYContributed equity C2(a) 83,507 51,026 Treasury shares C2(c) (1,884) - Foreign currency translation reserve C3 (547) (593) Share based payments reserve C3 2,331 1,398 Other reserve C3 (211) 8,526 Retained earnings 98,321 85,074 Equity attributable to Equity holders of the parent 181,517 145,431 Non-controlling interest 100 151 TOTAL EQUITY 181,617 145,582
For
per
sona
l use
onl
y

Directors’ Report and Financial Statements
Financial Statements
Melbourne IT Group Annual Report 2017 l 61
Consolidated statement of comprehensive income For the year ended 31 December 2017
The above consolidated statement of comprehensive income should be read in conjunction with the accompanying notes.
Notes 201 7 201 6$’000 $’000
Continuing operationsRevenue A1 1 97,760 1 68,436 Registry, hosting and sundry other product costs A2(a) (87,993) (74,1 98) Gross profit 1 09,767 94,238
Other income A8 5,81 4 1 ,61 0 Salaries and employee benefit expenses A2(a) (62,620) (54,1 62) Depreciation expenses A2(b) (3,301 ) (3,537) Amortisation of identifiable intangible assets A2(c) (6,327) (3,51 8) Transaction costs relating to the acquis itions (809) (595) Finance costs A2(d) (3,847) (3,1 25) Other expenses A2(e) (1 8,661 ) (1 3,504) Gain on sale of IDNR business , net of transaction costs A7 - 2,350 Profit before tax 20,01 6 1 9,757 Income tax expense A3 (5,737) (7,049)Profit for the year 1 4,279 1 2,708
Other com prehens ive incom eItems that are reclass ified to the profit or loss :Currency trans lation differences 46 (20)Items that may be reclass ified to the profit or loss :Net gains/(losses) on cashflow hedges (net of tax) - 85Net gains/(losses) on fair value of available-for-sale (AFS) financial assets (82) 48Recycling of AFS reserve upon derecognition of AFS financial asset - (546)Other comprehensive income/ (loss) for the year, net of tax (36) (433)
TOTAL COMPREHENSIVE INCOME FOR THE YEAR 1 4,243 1 2,275
Profit for the year attributable to:Equity holders of the parent 1 3,957 1 0,727Non-controlling interests 322 1 ,981
1 4,279 1 2,708
Total comprehens ive income attributable to:Equity holders of the parent 1 3,921 1 0,294Non-controlling interests 322 1 ,981
1 4,243 1 2,275
Earnings per share 201 7 201 6Cents Cents
Basic earnings per share A5 1 2.56 1 0.86Diluted earnings per share A5 1 2.39 1 0.67
For
per
sona
l use
onl
y

Directors’ Report and Financial Statements
Financial Statements
62 l Melbourne IT Group Annual Report 2017
Consolidated statement of changes in equity For the year ended 31 December 2017
The above consolidated statement of changes in equity should be read in conjunction with the accompanying notes.
Foreign currency
reserve
Options reserve
Other reserves
Contributed equity
Treasury shares
Retained earnings
TotalNon-
controlling interest
Total equity
$’000 $’000 $’000 $’000 $’000 $’000 $’000 $’000 $’000
As at 1 January 2017 (593) 1,398 8,526 51,026 - 85,074 145,431 151 145,582Profit for the year - - - - - 13,957 13,957 322 14,279Other comprehensive income 46 - (82) - - - (36) - (36)Total comprehensive income for the year 46 - (82) - - 13,957 13,921 322 14,243
Transactions with owners in their capacity as owners:Share-based payment - 1,718 - - - - 1,718 - 1,718Issue of shares for long term incentive plan - (785) - - - 785 - - - Dividend reinvestment plan - - - 3,082 - - 3,082 - 3,082Capital raising - - - 29,415 - - 29,415 - 29,415Equity dividends - - - - - (10,181) (10,181) (220) (10,401)Transfer (from)/to other reserve - - (8,523) - - 8,676 153 (153) - Share repurchase - - - (16) (1,884) - (1,900) - (1,900)Transfer from/(to) financial liabilities - - (132) - - 11 (121) - (121)As at 31 December 2017 (547) 2,331 (211) 83,507 (1,884) 98,321 181,517 100 181,617
As at 1 January 2016 (573) 776 4,062 35,629 - 80,379 120,273 310 120,583Profit for the year - - - - - 10,727 10,727 1,981 12,708Fair value of AFS financial assets - - 48 - - - 48 - 48Derecognition of AFS financial asset - - (546) - - - (546) - (546)Other comprehensive income (20) - 85 - - - 65 - 65Total comprehensive income for the year (20) - (413) - 0 10,727 10,294 1,981 12,275
Transactions with owners in their capacity as owners:Share-based payment - 622 - - - - 622 - 622Dividend reinvestment plan - - - 821 - - 821 - 821Capital raising - - - 14,576 - - 14,576 - 14,576Equity dividends - - - - - (6,032) (6,032) (300) (6,332)Transfer to other reserve - - 4,877 - - - 4,877 (4,877) - Transfer from/(to) financial liabilities - - - - - - - 3,037 3,037As at 31 December 2016 (593) 1,398 8,526 51,026 - 85,074 145,431 151 145,582
For
per
sona
l use
onl
y

Directors’ Report and Financial Statements
Financial Statements
Melbourne IT Group Annual Report 2017 l 63
Consolidated statement of cash flows For the year ended 31 December 2017
The above statement of cash flows should be read in conjunction with the accompanying notes.
Notes 2017 2016
$’000 $’000
Cash flows from operating activities
Receipt of service revenue and recoveries 206,066 179,286
Payments to suppliers and employees (183,195) (158,509)
Interest received 53 134
Interest paid (2,164) (1,157)
Bank charges and credit card merchant fees (1,494) (1,464)
Income tax refunds 259 1,989
Income tax paid (6,081) (5,977)Net cash flows from operating activities E1 13,444 14,302
Cash flows from investing activities
Purchase of plant and equipment and intangible assets (4,042) (4,874)
Proceeds from sale of IDNR business, net of transaction costs - 7,424
Acquisition of InfoReady D1(b) (620) (15,382)
Acquisition of Outware, net of cash acquired (27,692) (10,622)
Acquisition of WME Group D1(a) (38,300) -
Repayment of WME Group loans 4,000 -
Acquisition of Outware - payment for equity consideration (1,900) -
Transaction costs relating to acquisitions D1 (794) (616)
Net cash flows (used in) investing activities (69,348) (24,070)
Cash flows from financing activities
Proceeds from capital raising C2 30,680 15,000
Transaction costs on capital raising C2 (1,807) (605)
Proceeds from borrowings C4 38,492 10,600
Repayment of borrowings C4 - (4,100)
Payment of dividend on ordinary shares (7,099) (5,211)
Payment of dividend to non-controlling interests (485) (1,629)
Payment of finance lease liabilities (99) (214)Net cash flows from financing activities 59,682 13,841
Net increase/ (decrease) in cash and cash equivalents 3,778 4,073
Net foreign exchange differences 46 (17)
Cash and cash equivalents at beginning of year 16,426 12,370
CASH AND CASH EQUIVALENTS AT END OF YEAR E1 20,250 16,426
For
per
sona
l use
onl
y
Directors’ Report and Financial Statements
Notes to Financial Statements
64 l Melbourne IT Group Annual Report 2017
Section A: Financial performance A1 Revenue A2 Expenses A3 Income tax A4 Dividends A5 Earnings per share A6 Segment reporting A7 Gain on sale of International Domain Name Registration (IDNR) business A8 Other income
Section B: Operating assets and liabilities B1 Trade and other receivables B2 Other assets B3 Plant and equipment B4 Intangible assets B5 Non-current financial assets B6 Trade and other payables B7 Provisions
Section C: Capital and financial risk management C1 Financial risk management objectives and policies C2 Contributed equity C3 Reserves C4 Borrowings C5 Commitments C6 Other financial liabilities C7 Derivative financial liabilities and assets C8 Fair value measurement
Section D: Group structure D1 Business combinations D2 Controlled entities
For
per
sona
l use
onl
y
Directors’ Report and Financial Statements
Notes to the Financial Statements
Melbourne IT Group Annual Report 2017 l 65
Section E: Other information E1 Cash Flow Statement information E2 Related party disclosures E3 Key management personnel (KMP) disclosures E4 Performance rights E5 Auditors' remuneration E6 Contingent assets and liabilities E7 Events subsequent to balance date E8 Information relating to Melbourne IT Ltd (Parent Entity) E9 Closed group class order disclosures E10 New accounting policies
For
per
sona
l use
onl
y
66 l Melbourne IT Group Annual Report 2017
Directors’ Report and Financial Statements
Notes to Financial StatementsFor the year ended 31 December 2017
About this report This is the financial report of Melbourne IT Ltd ('the company' or 'Melbourne IT') and of its controlled entities (collectively 'the Group') for the year ended 31 December 2017. The financial report was authorised for issue in accordance with a resolution of the directors on 28 March 2018.
It is a general-purpose financial report, which has been prepared in accordance with the requirements of the Corporations Act (2001), Australian Accounting Standards, and other authoritative pronouncements of the Australian Accounting Standards Board. The financial report complies with Australian Accounting Standards and International Financial Reporting Standards ('IFRS') as issued by the International Accounting Standards Board.
Melbourne IT Ltd is a company limited by shares incorporated and domiciled in Australia whose shares are publicly traded on the Australian Stock Exchange. The company is a for-profit entity.
Basis of preparation The financial report has been prepared on a historical cost basis, except for derivative financial instruments that have been measured at fair value and certain assets where an impairment loss has been charged. The carrying values of recognised assets and liabilities that are hedged with fair value hedges are adjusted to record changes in the fair values attributable to the risks that are being hedged.
The financial report is presented in Australian dollars and all values are rounded to the nearest thousand dollars ($’000), unless otherwise stated, under the option available to the company under ASIC Corporations (Rounding in Financial/Directors' Report) Instrument 2016/191 (Instrument 2016/191). The company is an entity to which Instrument 2016/191 applies.
The financial report has been prepared on a going-concern basis, which assumes that the Group will be able to meet its obligations as and when they fall due. The Group’s current liabilities exceed current assets by $3,353,000 as at 31 December 2017 (2016: $34,155,000). This mainly arises due to the revenue recognition policy for domain names and hosting services resulting in income in advance of $25,533,000 being recognised as a current liability.
Significant accounting policies Accounting policies are selected and applied in a manner that ensures that the resulting financial information satisfies the concept of relevance and reliability, thereby ensuring that the substance of the underlying transactions or other events is reported.
(a) Basis of consolidationThe consolidated financial statements comprise the financial statements of Melbourne IT Ltd and its subsidiaries as at 31 December each year ('the Group'). The Group controls a subsidiary if and only if the Group has:
● power over the subsidiary (i.e. existing rights that give it the current ability to direct the relevant activities of thesubsidiary)
● exposure, or rights, to variable returns from its involvement with the subsidiary
For
per
sona
l use
onl
y

Directors’ Report and Financial Statements
Notes to the Financial Statements
Melbourne IT Group Annual Report 2017 l 67
● the ability to use its power over the subsidiary to affect its returns.The financial statements of subsidiaries are prepared for the same reporting period as the parent company, using consistent accounting policies. In preparing the consolidated financial statements, all intercompany balances and transactions, including unrealised profits arising from intra-group transactions, have been eliminated in full.
Subsidiaries are fully consolidated from the date on which control is transferred to Melbourne IT Ltd and cease to be consolidated from the date on which control is transferred out of Melbourne IT Ltd.
Investments in subsidiaries held by Melbourne IT Ltd are accounted for at cost in the separate financial statements of the parent entity less any impairment charges. Dividends received from subsidiaries are recorded as a component of other revenues in the separate income statement of the parent entity, and do not impact the recorded cost of the investment. Upon receipt of dividend payments from subsidiaries, the parent will assess whether any indicators of impairment of the carrying value of the investment in the subsidiary exist. Where such indicators exist, to the extent that the carrying value of the investment exceeds its recoverable amount, an impairment loss is recognised.
The acquisition of subsidiaries is accounted for using the acquisition method of accounting. The acquisition method of accounting involves recognising at acquisition date, separately from goodwill, the identifiable assets acquired, the liabilities assumed and any non-controlling interest in the acquiree. The identifiable assets acquired and the liabilities assumed are measured at their acquisition date fair values. The difference between the above items and the fair value of the consideration (including the fair value of any pre-existing investment in the acquiree) is goodwill or a discount on acquisition.
After initial recognition, goodwill is measured at cost less any accumulated impairment losses. For the purpose of impairment testing, goodwill acquired in a business combination is, from the acquisition date, allocated to each of the Group’s cash-generating units that are expected to benefit from the combination, irrespective of whether other assets or liabilities of the acquirer are assigned to those units. Where goodwill forms part of a cash-generating unit and part of the operation within that unit is disposed of, the goodwill associated with the operation disposed of is included in the carrying amount of the operation when determining the gain or loss on disposal of the operation. Goodwill disposed of in this circumstance is measured based on the relative values of the operation disposed of and the portion of the cash-generating unit retained.
Acquisitions of subsidiaries that include put options to acquire non-controlling interests in the future are accounted for in accordance with AASB 10 Consolidated Financial Statements (AASB 10). During the period the non-controlling interests put options remain unexercised, the non-controlling interests are calculated and immediately derecognised as though it was acquired at that date. A financial liability with respect to put options is recognised in accordance with AASB 139 Financial Instruments: Recognition and Measurement. The difference between derecognition of the non-controlling interests and recognition of the financial liabilities is accounted for as an equity transaction, and disclosed as a separate reserve within equity (refer to 'Other Reserves' disclosed in the Statement of Changes in Equity).
Where there is loss of control of a subsidiary, the consolidated financial statements include the results for the part of the reporting period during which Melbourne IT Ltd has control. A change in the ownership interest of a subsidiary that does not result in a loss of control, is accounted for as an equity transaction.
On the loss of control of a subsidiary, the Group derecognises the assets and liabilities of the subsidiary, and the other components of equity related to the subsidiary. Any surplus or deficit arising on the loss of control is recognised in profit or loss. F
or p
erso
nal u
se o
nly
68 l Melbourne IT Group Annual Report 2017
Directors’ Report and Financial Statements
Notes to Financial Statements(b) Foreign currency transactionsBoth the functional and presentation currency of Melbourne IT Ltd and its Australian subsidiaries is Australian dollars (AUD).
Transactions in foreign currencies are initially recorded in the functional currency at the exchange rates ruling at the date of the transaction. Monetary assets and liabilities denominated in foreign currencies are retranslated at the rate of exchange ruling at the reporting date. Non-monetary items that are measured in terms of historical cost in a foreign currency are translated using the exchange rate as at the date of the initial transaction.
The functional currency of each overseas subsidiary is as follows:
Investment in New Zealand subsidiary - NZD (New Zealand Dollar)Investment in US subsidiaries - USD (United States Dollar)
The assets and liabilities of these overseas subsidiaries are translated into the presentation currency of Melbourne IT Ltd at the rate of exchange ruling at the reporting date and the statement of comprehensive income is translated at the weighted average exchange rates for the period.
The exchange differences arising on retranslation are taken directly to other comprehensive income. On disposal of a foreign entity, the deferred cumulative amount recognised in other comprehensive income relating to that particular foreign operation is recognised in the determination of profit and loss for the year.
On consolidation, exchange differences arising from the translation of any net investment in foreign entities, and of borrowings and other financial instruments designed as hedges of such investments are taken to the foreign currency translation reserve in equity. When a foreign operation is sold, or any borrowings forming part of the net investment are repaid, a proportionate share of such exchange differences are recognised in the Statement of Comprehensive Income, as part of the gain on sale or loss on sale where applicable.
(c) Financial assets
(i) Recognition and measurement
Financial assets are classified, at initial recognition, as financial assets at fair value through profit or loss, loans and receivables, held-to-maturity investments, available for sale ('AFS') financial assets, or as derivatives designated as hedging instruments in an effective hedge, as appropriate.
Financial assets at fair value through profit or loss
Financial assets at fair value through profit or loss include financial assets held for trading and financial assets designated upon initial recognition at fair value through profit or loss. Derivatives, including separated embedded derivatives, are also classified as held for trading unless they are designated as effective hedging instruments as defined by AASB 139 Financial assets at fair value through profit or loss are carried in the statement of financial position at fair value with net changes in fair value presented in the statement of profit or loss. F
or p
erso
nal u
se o
nly

Directors’ Report and Financial Statements
Notes to the Financial Statements
Melbourne IT Group Annual Report 2017 l 69
Available-for-sale (AFS) financial assets
AFS financial assets include equity investments and debt securities. Equity investments classified as AFS are those that are neither classified as held for trading nor designated at fair value through profit or loss.
After initial measurement, AFS financial assets are subsequently measured at fair value with unrealised gains or losses recognised as other comprehensive income ('OCI') and credited in the AFS reserve until the investment is derecognised, at which time the cumulative gain or loss is recognised in other operating income in the statement of profit or loss, or the investment is determined to be impaired when the cumulative loss is reclassified from the AFS reserve to the statement of profit or loss in finance costs. Interest earned while holding AFS financial assets is reported as interest income using the effective interest rate ('EIR') method in the statement of profit or loss.
Loans and receivables
Loans and receivables are non-derivative financial assets with fixed or determinable payments that are not quoted in an active market. After initial measurement, such financial assets are measured at amortised cost using the EIR method, less impairment. Amortised cost is calculated by taking into account any discount or premium on acquisition and fees or costs that are an integral part of the EIR. The EIR amortisation is included in finance income in the statement of profit or loss. The losses arising from impairment are recognised in the statement of profit or loss in finance costs for loans and other operating expenses for receivables.
(ii) Impairment of financial assets
The Group assesses, at each reporting date, whether there is objective evidence that a financial asset or a group of financial assets is impaired. An impairment exists if one or more events that has occurred since the initial recognition of the asset (an incurred ‘loss event’) has an impact on the estimated future cash flows of the financial asset or the group of financial assets that can be reliably estimated. Evidence of impairment may include indications that the debtor or a group of debtors is experiencing significant financial difficulty, default or delinquency in interest or principal payments, the probability that they will enter bankruptcy or other financial reorganisation and observable data indicating that there is a measurable decrease in the estimated future cash flows, such as changes in arrears or economic conditions that correlate with defaults.
Financial assets carried at amortised cost
For financial assets carried at amortised cost, the Group first assesses whether impairment exists individually for financial assets that are individually significant, or collectively for financial assets that are not individually significant. If the Group determines that no objective evidence of impairment exists for an individually-assessed financial asset, whether significant or not, it includes the asset in a group of financial assets with similar credit risk characteristics and collectively assesses them for impairment. Assets that are individually assessed for impairment and for which an impairment loss is, or continues to be, recognised are not included in a collective assessment of impairment.
The amount of any impairment loss identified is measured as the difference between the asset’s carrying amount and the present value of estimated future cash flows (excluding future expected credit losses that have not yet been incurred). The present value of the estimated future cash flows is discounted at the financial asset’s original EIR.
Available-for-sale ('AFS') financial assets
For AFS financial assets, the Group assesses at each reporting date whether there is objective evidence that an investment or a group of investments is impaired.
For
per
sona
l use
onl
y

70 l Melbourne IT Group Annual Report 2017
Directors’ Report and Financial Statements
Notes to Financial StatementsIn the case of equity investments classified as AFS, objective evidence would include a significant or prolonged decline in the fair value of the investment below its cost. ’Significant’ is evaluated against the original cost of the investment and ’prolonged’ against the period in which the fair value has been below its original cost. When there is evidence of impairment, the cumulative loss – measured as the difference between the acquisition cost and the current fair value, less any impairment loss on that investment previously recognised in the statement of profit or loss – is removed from OCI and recognised in the statement of profit or loss. Impairment losses on equity investments are not reversed through the statement of profit or loss; increases in their fair value after impairment are recognised directly in OCI.
The determination of what is ‘significant’ or ‘prolonged’ requires judgement. In making this judgement, the Group evaluates, among other factors, the duration or extent to which the fair value of an investment is less than its cost.
(d) Financial liabilitiesFinancial liabilities are classified, at initial recognition, as financial liabilities at fair value through profit or loss, loans and borrowings, payables or as derivatives designated as hedging instruments in an effective hedge, as appropriate. All financial liabilities are recognised initially at fair value and, in the case of loans and borrowings and payables, net of directly attributable transaction costs.
A financial liability is derecognised when the obligation under the liability is discharged or cancelled or expires. When an existing financial liability is replaced by another from the same lender on substantially different terms, or the terms of an existing liability are substantially modified, such an exchange or modification is treated as the derecognition of the original liability and the recognition of a new liability. The difference in the respective carrying amounts is recognised in the statement of profit or loss.
(e) Prepayment of domain name registry chargesDomain name registry charges are deferred in the Statement of Financial Position and are recognised in the Statement of Comprehensive Income using the same principles as revenue from the sale of domain names, as explained in accounting policy in note A1.
Significant accounting estimates and judgements The preparation of the financial statements requires management to make judgements, estimates and assumptions that affect reported amounts in the financial statements. Management continually evaluates its judgements and estimates in relation to assets, liabilities, contingent liabilities, revenues and expenses. Management bases its judgements and estimates on historical experience and on other various factors it believes to be reasonable under the circumstances, the result of which form the basis of the carrying values of assets and liabilities that are not readily apparent from other sources. Actual results may differ from these estimates under different assumptions and conditions.
Management has identified the following critical accounting policies for which significant judgements, estimates and assumptions are made. Actual results may differ from these estimates under different assumptions and conditions and may materially affect financial results or the financial position reported in future periods.
For
per
sona
l use
onl
y
Directors’ Report and Financial Statements
Notes to the Financial Statements
Melbourne IT Group Annual Report 2017 l 71
Information on significant estimates and judgements considered when applying the accounting policies can be found in the following notes:
Accounting estimates and judgements Note
Taxation A3
Impairment of goodwill and intangibles and useful lives B4
Remuneration liability and contingent consideration liability C6
Share-based payment transactions E4
For
per
sona
l use
onl
y

72 l Melbourne IT Group Annual Report 2017
Directors’ Report and Financial Statements
Notes to Financial StatementsSection A: Financial performance A1.
Revenue
Revenue recognition Revenue is recognised to the extent that it is probable that the economic benefits will flow to the entity and the revenue can be reliably measured. The following specific recognition criteria must also be met before revenue is recognised:
Rendering of services – registration revenue
Revenue is recognised by reference to percentage of completion method. The percentage of completion is determined by reference to the extent of services performed to date on the agreement as a percentage of total services to be performed under the agreement. Revenue is recognised in the financial period in which services are rendered. Where cash has been received for services yet to be performed pursuant to the agreement, the amount has been classified in the statement of financial position as “Income received in advance”.
The following table summarises the domain name registration revenue and registry cost recognition policy for the Group, outlining the monthly revenue percentage of the transaction amount recognised in the Statement of Comprehensive Income based on the length of the domain name registration:
2017 2016
$’000 $’000
Registration revenue 37,912 44,916
Solutions, hosting & services 159,795 123,253
Total revenue excluding interest income 197,707 168,169
Interest revenue 53 267
Total consolidated revenue 197,760 168,436
Length of Registration First month Per other month1 Year 78.00% 2.00%2 Years 54.00% 2.00%3 Years 36.00% 1.83%4 Years 27.00% 1.55%5 Years 21.60% 1.33%6 Years 18.00% 1.15%7 Years 15.43% 1.02%8 Years 13.50% 0.91%9 Years 12.00% 0.82%10 Years 10.80% 0.75%F
or p
erso
nal u
se o
nly

Directors’ Report and Financial Statements
Notes to the Financial Statements
Melbourne IT Group Annual Report 2017 l 73
Rendering of services – solutions, hosting & other services
Revenue from provision of other services is recognised when the services are performed or by reference to the stage of completion. Stage of completion is measured by reference to labour hours incurred to date as a percentage of total estimated labour hours for each contract.
Interest
Revenue is recognised as the interest accrues (using the effective interest method, which is the rate that exactly discounts estimated future cash receipts through the expected life of the financial instrument) to the net carrying amount of the financial asset.
Adoption of AASB 15 Revenue from Contracts with Customers
From 1 January 2018, the Group will adopt AASB 15 Revenue from Contracts with Customers. Refer to note E10 "Accounting Standards and Interpretations issued but not yet effective" for details.
A2. Expenses 2017 2016
$’000 $’000(a) Salaries and employee benefits expenseIncluded in cost of sales:
Salaries and employee benefits expense 30,271 15,867
Included in salaries and employee benefits expenses:Expensing of share-based payments 1,718 622 Superannuation expense 6,335 5,043
(b) Depreciation expense
Fit out 220 236 Plant and equipment 3,035 3,250 Furniture 46 51
Total depreciation of non-current assets 3,301 3,537
(c) Amortisation of identifiable intangible assetsCapitalised software 2,424 1,935 Customer contracts 2,121 1,548 Market-related intangibles 1,782 35
Total amortisation of identifiable intangible assets 6,327 3,518
(d) Finance costsBank charges and credit card merchant fees 1,494 1,464 Interest expense on debt and borrowings 2,164 1,157 Unwinding of discount on other financial liabilities 189 504
Total finance costs 3,847 3,125
For
per
sona
l use
onl
y

Directors’ Report and Financial Statements
Notes to Financial Statements
74 l Melbourne IT Group Annual Report 2017
On 31 October 2017, Melbourne IT approved the retirement of the WebCentral brand in line with a group-wide brand review. The Group anticipates the retirement of the WebCentral brand will be complete within 12 months, and as a result the useful life of the related brand-intangible asset has been revised to 12 months ending 31 October 2018. AASB 108: Accounting Policies, Changes in Accounting Estimates and Errors requires any changes in estimates to be applied prospectively from the date of the change in estimate. As a result, $1,782,000 of accelerated amortisation expense has been recognised in the Statement of Comprehensive Income.
201 7 201 6$’000 $’000
(e) Other expensesIncluded in other expenses :
Premises 4,1 04 3,605 Training and recruitment 1 ,444 1 ,597 Communications 1 ,070 1 ,01 2 Marketing 3,257 2,360 Equipment 2,644 2,462 Consultancy and fees 2,420 1 ,471 Foreign exchange 1 36 1 7 Bad debts and doubtful debts 1 ,1 04 (1 72) Fair value of derivative financial asset - 48Recycling of AFS reserve upon derecognition of available-for-sale financial asset - (546)
For
per
sona
l use
onl
y

Directors’ Report and Financial Statements
Notes to the Financial Statements
Melbourne IT Group Annual Report 2017 l 75
A3. Income tax 2017 2016
$’000 $’000The major components of income tax expense are:
(a) Statement of comprehensive income
Current income taxCurrent income tax charge 4,583 5,887 Adjustments in respect of current income tax of previous years 368 (78)
Deferred income taxRelating to origination and reversal of temporary differences 786 1,240 Income tax expense reported in the statement of comprehensive income 5,737 7,049
(b) Statement of changes in equity
Deferred income tax related to items charged or credited directly to equityNet gain on revaluation of cash flow hedges - (1) Deferred tax asset recognised on equity raise costs 542 85 Income tax expense reported in equity 542 84
(c) A reconciliation between tax expense and the product of accounting profit beforeincome tax, multiplied by the Group's applicable income tax rate is as follows:
Accounting profit before income tax 20,016 19,757
At the Group's statutory income tax rate of 30% (2016: 30%) 6,005 5,927
Adjustments in respect of current income tax of previous years 368 (78) Non-deductible expenses 324 190 Other non-operating income (631) (483) Reassessment of contingent consideration 295 - Unwinding of discount on other financial liabilities - 152 Goodwill allocated to gain on sale of IDNR business - 1,719 Estimated R&D tax incentive claims (701) (377) Other 77 (1) Income tax expense at the effective income tax rate 5,737 7,049
Income tax expense reported in the statement of comprehensive income 5,737 7,049
For
per
sona
l use
onl
y
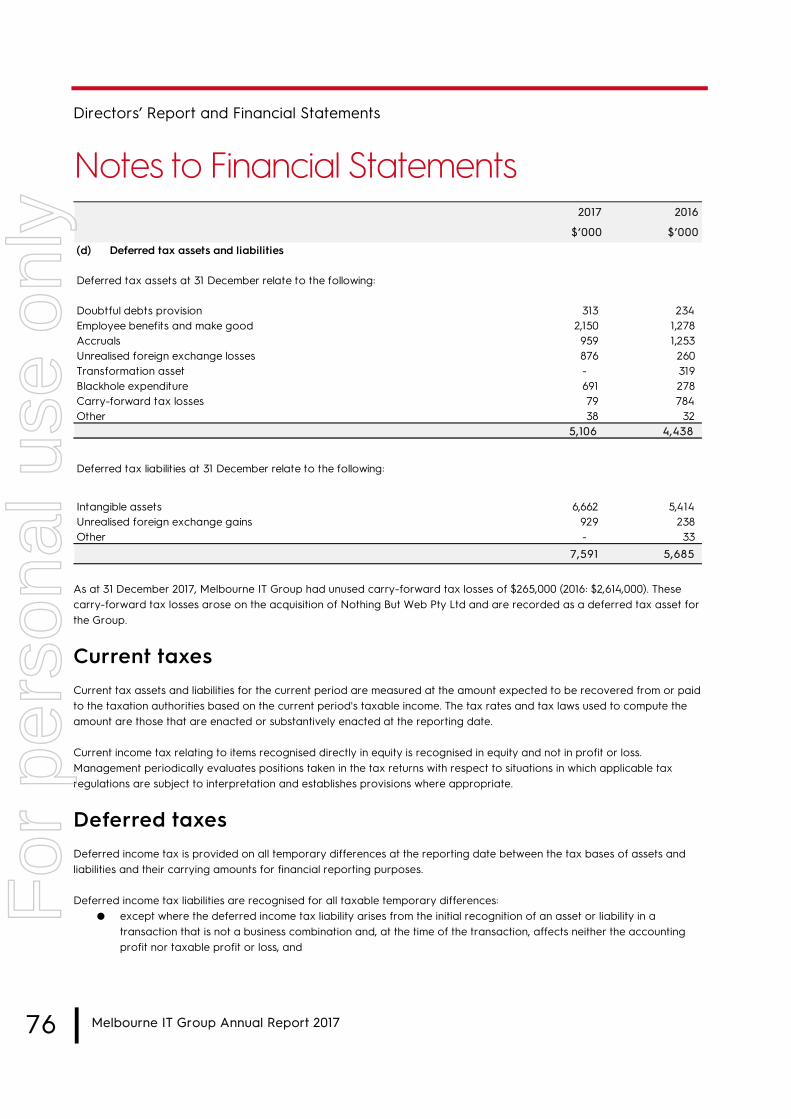
Directors’ Report and Financial Statements
Notes to Financial Statements
76 l Melbourne IT Group Annual Report 2017
As at 31 December 2017, Melbourne IT Group had unused carry-forward tax losses of $265,000 (2016: $2,614,000). These carry-forward tax losses arose on the acquisition of Nothing But Web Pty Ltd and are recorded as a deferred tax asset for the Group.
Current taxes Current tax assets and liabilities for the current period are measured at the amount expected to be recovered from or paid to the taxation authorities based on the current period's taxable income. The tax rates and tax laws used to compute the amount are those that are enacted or substantively enacted at the reporting date.
Current income tax relating to items recognised directly in equity is recognised in equity and not in profit or loss. Management periodically evaluates positions taken in the tax returns with respect to situations in which applicable tax regulations are subject to interpretation and establishes provisions where appropriate.
Deferred taxes Deferred income tax is provided on all temporary differences at the reporting date between the tax bases of assets and liabilities and their carrying amounts for financial reporting purposes.
Deferred income tax liabilities are recognised for all taxable temporary differences: ● except where the deferred income tax liability arises from the initial recognition of an asset or liability in a
transaction that is not a business combination and, at the time of the transaction, affects neither the accountingprofit nor taxable profit or loss, and
2017 2016
$’000 $’000
(d) Deferred tax assets and liabilities
Deferred tax assets at 31 December relate to the following:
Doubtful debts provision 313 234 Employee benefits and make good 2,150 1,278 Accruals 959 1,253 Unrealised foreign exchange losses 876 260 Transformation asset - 319 Blackhole expenditure 691 278 Carry-forward tax losses 79 784 Other 38 32
5,106 4,438
Deferred tax liabilities at 31 December relate to the following:
Intangible assets 6,662 5,414 Unrealised foreign exchange gains 929 238 Other - 33
7,591 5,685
For
per
sona
l use
onl
y
Directors’ Report and Financial Statements
Notes to the Financial Statements
Melbourne IT Group Annual Report 2017 l 77
● in respect of taxable temporary differences associated with investments in subsidiaries, associates and interests injoint ventures, except where the timing of the reversal of the temporary differences can be controlled and it isprobable that the temporary differences will not reverse in the foreseeable future.
Deferred income tax assets are recognised for all deductible temporary differences, carry-forward of unused tax assets and unused tax losses, to the extent that it is probable that taxable profit will be available against which the deductible temporary differences, and the carry-forward of unused tax assets and unused tax losses can be utilised:
● except where the deferred income tax asset relating to the deductible temporary difference arises from the initialrecognition of an asset or liability in a transaction that is not a business combination and, at the time of thetransaction, affects neither the accounting profit nor taxable profit or loss, and
● in respect of deductible temporary differences associated with investments in subsidiaries, associates and interestsin joint ventures, deferred tax assets are only recognised to the extent that it is probable that the temporarydifferences will reverse in the foreseeable future and taxable profit will be available against which the temporarydifferences can be utilised.
The carrying amount of deferred income tax assets is reviewed at each reporting date and reduced to the extent that it is no longer probable that sufficient taxable profit will be available to allow all or part of the deferred income tax asset to be utilised. Unrecognised deferred income tax assets are reassessed at each reporting date and are recognised to the extent that it has become probable that future taxable profit will allow the deferred tax asset to be recovered.
Deferred income tax assets and liabilities are measured at the tax rates that are expected to apply to the year when the asset is realised or the liability is settled, based on tax rates (and tax laws) that have been enacted or substantively enacted at the reporting date. Income taxes relating to items recognised directly in equity are recognised in equity and not in the statement of comprehensive income.
Tax consolidation
The Group and its wholly-owned Australian controlled entities have implemented the tax consolidation legislation as of 1 January 2006. Members of the tax consolidated group have entered into a tax-funding agreement. Each entity is responsible for remitting its share of the current tax payable (receivable) assumed by the head entity.
In accordance with UIG 1052 and Group accounting policy, the Group has applied the “separate taxpayer within group approach” in which the head entity, Melbourne IT Ltd, and the controlled entities in the tax consolidated group continue to account for their own current and deferred tax amounts.
In addition to its own current and deferred tax amounts, the Group also recognises the current tax liabilities (or assets) and the deferred tax assets arising from unused tax losses and unused tax credits assumed from controlled entities in the tax consolidated group. The allocation of taxes to the head entity is recognised as an increase/decrease in the controlled entity's inter-company accounts with the tax consolidated Group head entity.
Members of the Group have entered into a tax-sharing agreement that provides for the allocation of income tax liabilities between the entities should the head entity default on its tax payment obligations. No amounts have been recognised in the financial statements in respect of this agreement, on the grounds that the possibility is remote.
On 15 February 2017, Outware Systems Pty Ltd ('Outware') entered into the tax consolidation Group of Melbourne IT following the accelerated purchase of the remaining 24.9% of share capital of Outware. On 1 June 2017, Web Marketing Experts Pty Ltd ('WME') and Nothing But Web Pty Ltd ('NBW') entered into the tax consolidation Group of Melbourne IT following the acquisition of these entities.
For
per
sona
l use
onl
y
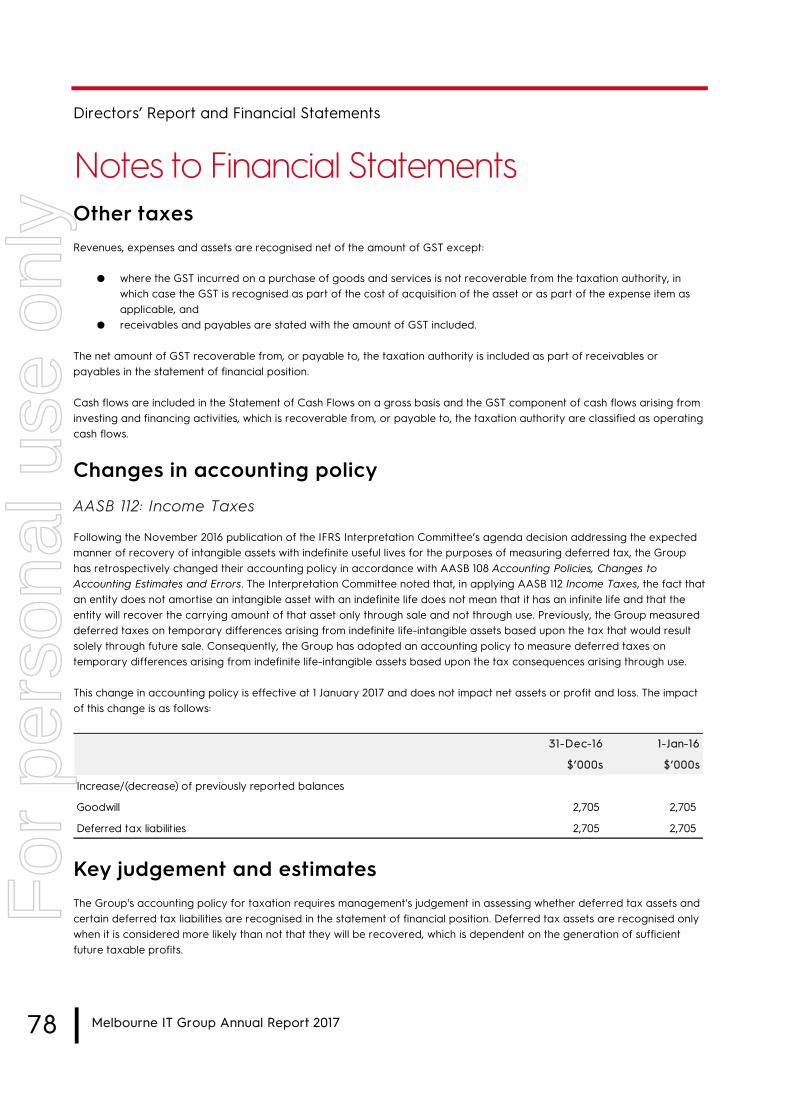
78 l Melbourne IT Group Annual Report 2017
Directors’ Report and Financial Statements
Notes to Financial StatementsOther taxes Revenues, expenses and assets are recognised net of the amount of GST except:
● where the GST incurred on a purchase of goods and services is not recoverable from the taxation authority, inwhich case the GST is recognised as part of the cost of acquisition of the asset or as part of the expense item asapplicable, and
● receivables and payables are stated with the amount of GST included.
The net amount of GST recoverable from, or payable to, the taxation authority is included as part of receivables or payables in the statement of financial position.
Cash flows are included in the Statement of Cash Flows on a gross basis and the GST component of cash flows arising from investing and financing activities, which is recoverable from, or payable to, the taxation authority are classified as operating cash flows.
Changes in accounting policy
AASB 112: Income Taxes
Following the November 2016 publication of the IFRS Interpretation Committee’s agenda decision addressing the expected manner of recovery of intangible assets with indefinite useful lives for the purposes of measuring deferred tax, the Group has retrospectively changed their accounting policy in accordance with AASB 108 Accounting Policies, Changes to Accounting Estimates and Errors. The Interpretation Committee noted that, in applying AASB 112 Income Taxes, the fact that an entity does not amortise an intangible asset with an indefinite life does not mean that it has an infinite life and that the entity will recover the carrying amount of that asset only through sale and not through use. Previously, the Group measured deferred taxes on temporary differences arising from indefinite life-intangible assets based upon the tax that would result solely through future sale. Consequently, the Group has adopted an accounting policy to measure deferred taxes on temporary differences arising from indefinite life-intangible assets based upon the tax consequences arising through use.
This change in accounting policy is effective at 1 January 2017 and does not impact net assets or profit and loss. The impact of this change is as follows:
Key judgement and estimates The Group's accounting policy for taxation requires management's judgement in assessing whether deferred tax assets and certain deferred tax liabilities are recognised in the statement of financial position. Deferred tax assets are recognised only when it is considered more likely than not that they will be recovered, which is dependent on the generation of sufficient future taxable profits.
31-Dec-16 1-Jan-16
$’000s $’000s
Increase/(decrease) of previously reported balances
Goodwill 2,705 2,705
Deferred tax liabilities 2,705 2,705
For
per
sona
l use
onl
y
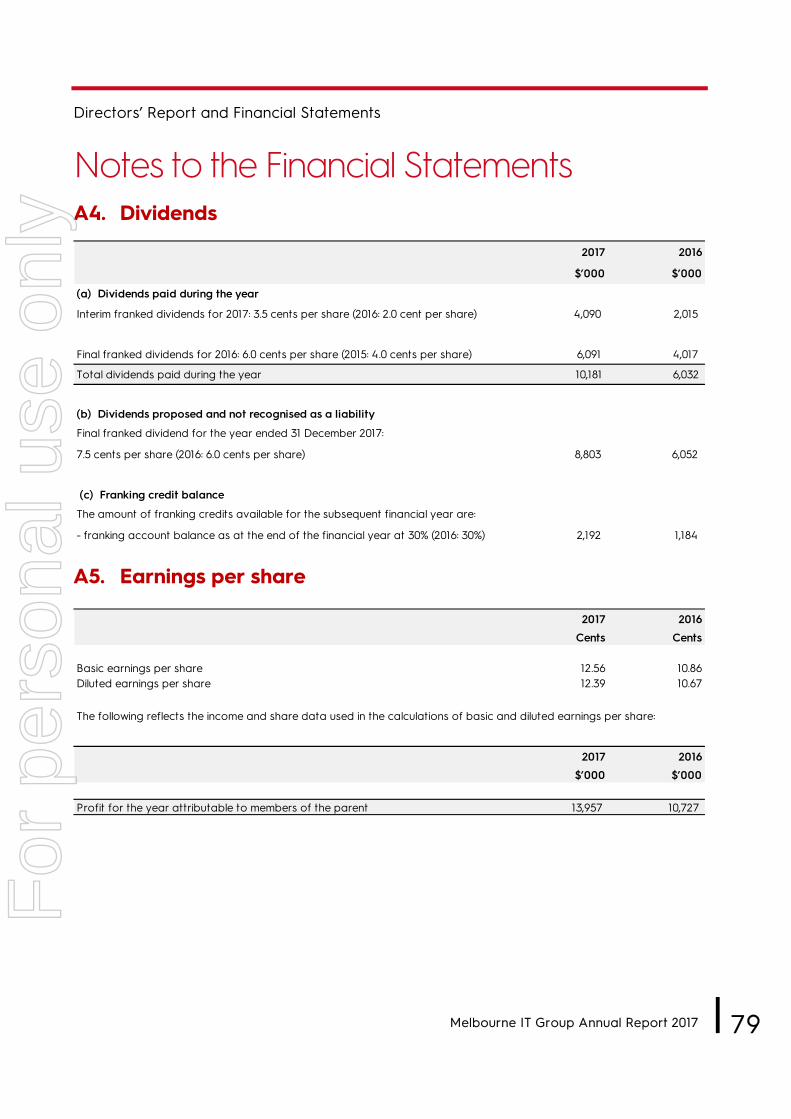
Directors’ Report and Financial Statements
Notes to the Financial Statements
Melbourne IT Group Annual Report 2017 l 79
A4. Dividends
A5. Earnings per share
2017 2016
$’000 $’000
(a) Dividends paid during the year
Interim franked dividends for 2017: 3.5 cents per share (2016: 2.0 cent per share) 4,090 2,015
Final franked dividends for 2016: 6.0 cents per share (2015: 4.0 cents per share) 6,091 4,017
Total dividends paid during the year 10,181 6,032
(b) Dividends proposed and not recognised as a liability
Final franked dividend for the year ended 31 December 2017:
7.5 cents per share (2016: 6.0 cents per share) 8,803 6,052
(c) Franking credit balance
The amount of franking credits available for the subsequent financial year are:
- franking account balance as at the end of the financial year at 30% (2016: 30%) 2,192 1,184
2017 2016
Cents Cents
Basic earnings per share 12.56 10.86Diluted earnings per share 12.39 10.67
The following reflects the income and share data used in the calculations of basic and diluted earnings per share:
2017 2016
$’000 $’000
Profit for the year attributable to members of the parent 13,957 10,727
For
per
sona
l use
onl
y

80 l Melbourne IT Group Annual Report 2017
Basic earnings per share is calculated as profit for the year attributable to members of the parent, divided by the weighted average number of ordinary shares.
Diluted earnings per share are calculated as profit for the year attributable to members of the parent, divided by the weighted average number of ordinary shares and the dilutive potential ordinary shares.
Performance rights granted to employees are considered to be potential ordinary shares and have been included in the determination of diluted earnings per share to the extent that they are dilutive. These performance rights have not been included in the determination of basic earnings per share.
There have been no transactions involving ordinary shares or potential ordinary shares that would significantly change the number of ordinary shares or potential ordinary shares outstanding between the reporting date and the date of completion of these financial statements.
A6. Segment reporting
Identification of operating segments
An operating segment is a component of an entity that engages in business activities from which it may earn revenues and incur expenses, whose operating results are regularly reviewed by the entity's chief operating decision maker to make decisions about resources to be allocated to the segment and assess its performance and for which discrete financial information is available.
Executive management meet on a monthly basis to assess the performance of each segment by analysing the segment's EBITDA.
Transfer prices between operating segments are set on an arm's-length basis in a manner similar to transactions with third parties. Segment revenue, expense and segment result include transfers between business segments. These transfers are eliminated on consolidation.
Operating segments have been identified based on the information provided to the chief operating decision maker, being the CEO. Consistent with the requirements of AASB 8 Operating Segments, as the chief operating decision maker does not receive information regarding segment assets, no disclosure of segment assets has been provided.
The operating segments are identified by management based on the nature of the customer segment, and the identity of the service line manager. Discrete financial information about each of these operating businesses is reported to the executive management team on at least a monthly basis.
111,149,089 98,819,025
Share options/rights 1,473,982 1,705,684
112,623,071 100,524,709
Number of shares
Directors’ Report and Financial Statements
Notes to Financial Statements
Weighted average number of ordinary shares used in the calculation of basic earnings per shareEffect of dilution:
Adjusted weighted average number of ordinary shares used in calculating diluted earnings per share
For
per
sona
l use
onl
y
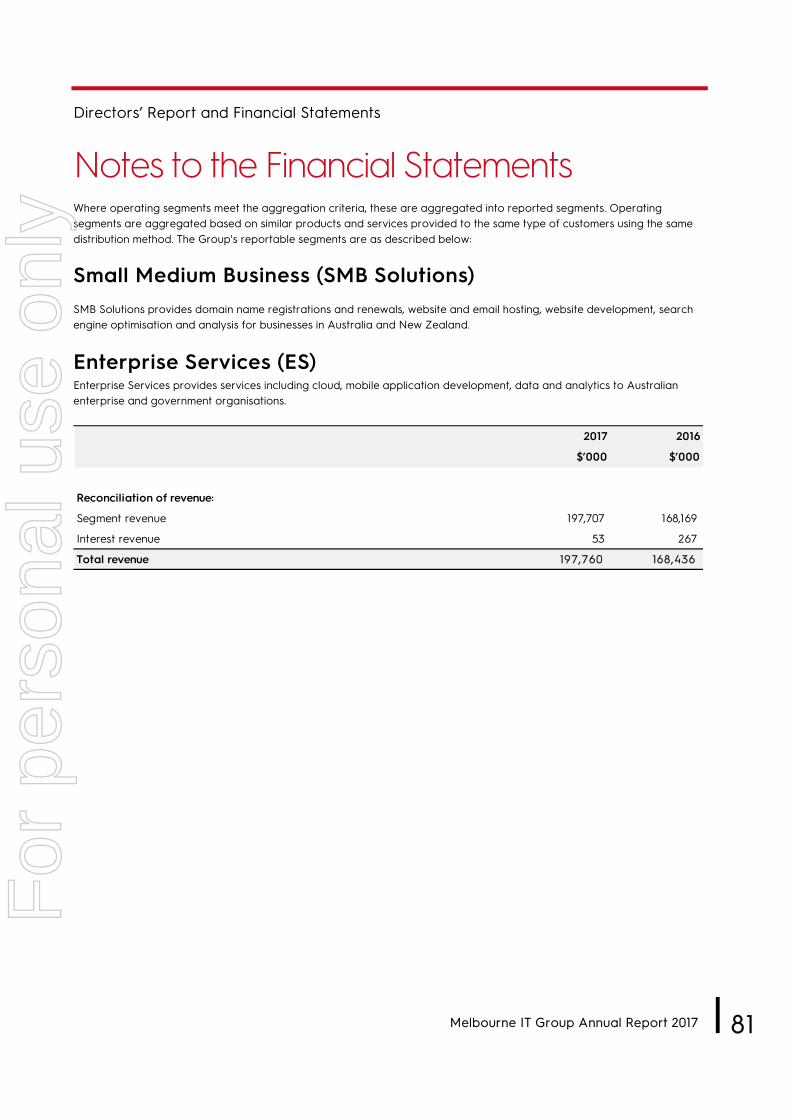
Directors’ Report and Financial Statements
Notes to the Financial Statements
Melbourne IT Group Annual Report 2017 l 81
Where operating segments meet the aggregation criteria, these are aggregated into reported segments. Operating segments are aggregated based on similar products and services provided to the same type of customers using the same distribution method. The Group's reportable segments are as described below:
Small Medium Business (SMB Solutions) SMB Solutions provides domain name registrations and renewals, website and email hosting, website development, search engine optimisation and analysis for businesses in Australia and New Zealand.
Enterprise Services (ES) Enterprise Services provides services including cloud, mobile application development, data and analytics to Australian enterprise and government organisations.
2017 2016
$’000 $’000
Reconciliation of revenue:
Segment revenue 197,707 168,169
Interest revenue 53 267
Total revenue 197,760 168,436
For
per
sona
l use
onl
y
82 l Melbourne IT Group Annual Report 2017
Directors’ Report and Financial Statements
Notes to Financial StatementsThe following tables present the revenue and profit information regarding business unit segments for the years ended 31 December 2017 and 31 December 2016.
Year ended 31 December 2017 SMB Solutions ES Total
$’000 $’000 $’000
Segment revenue
Revenue from operating activities:
Registration revenue 37,912 - 37,912
Solutions, hosting & services 64,470 95,325 159,795
Total segment revenue 102,382 95,325 197,707
Result
Segment results 21,372 17,275 38,647
Unallocated expenses:
- Corporate (including transaction costs relating to acquisition) (4,622)
- Gain on accelerated settlement of Outware option liability (5,814)
- Remuneration expense from accelerated settlement of Outware option liability 3,733
Earnings before interest, tax, depreciation and amortisation 31,944
Net Interest
Interest revenue 53
Interest expense on debt and borrowings (2,164)
Unwinding of discount on other financial liabilities (189)
Total net interest (2,300)
Depreciation & amortisation (9,628)
Profit before tax 20,016
Income tax expense (5,737)
Profit after tax for the year 14,279
For
per
sona
l use
onl
y

Directors’ Report and Financial Statements
Notes to the Financial Statements
Melbourne IT Group Annual Report 2017 l 83
Year ended 31 Decem ber 201 6 SMB Solutions ES Total
$’000 $’000 $’000
Segm ent revenue
Revenue from operating activities :
Registration revenue 44,91 6 - 44,91 6
Solutions , hosting & services 52,892 70,361 1 23,253
Total s egm ent revenue 97,808 70,361 1 68,1 69
Res ult
Segment results 1 5,703 1 4,644 30,347
Unallocated expenses:
- Corporate (including transaction costs relating to acquis ition) (6,263)
- Gain on sale of IDNR business , net of transaction costs 2,350
- Other income 1 ,61 0
- Fair value movement in embedded derivatives (59)
- Loss on convers ion of Tiger Pistol convertible notes (325)
- Gain on AFS asset 546
Earnings before interes t, tax, depreciation and am ortis ation 28,206
Net Interes t
Interest revenue 267
Interest expense on debt and borrow ings (1 ,1 57)
Unw inding of discount on other financial liabilities (504)
Total net interes t (1 ,394)
Depreciation & amortisation (7,055)
Profit before tax 1 9,757
Income tax expense (7,049)
Profit after tax for the year 1 2,708
For
per
sona
l use
onl
y
84 l Melbourne IT Group Annual Report 2017
Directors’ Report and Financial Statements
Notes to Financial StatementsA7. Gain on sale of International Domain Name Registration
(IDNR) business On 31 March 2016, Melbourne IT completed the sale of its International Domain Name Registration (IDNR) business for a sale consideration of USD $6,000,000 (equivalent to AUD $7,800,000). The gain on sale of AUD $2,350,000 includes transaction costs incurred relating to the sale, a portion of goodwill relating to the IDNR business and assets and liabilities relating to the IDNR business.
A8. Other income
2017 2016
$’000 $’000
Gain on accelerated settlement of Outware option liability 5,814 -
Gain on reassessment of non-controlling interests dividend liability - 586
Gain on reassessment of contingent consideration liability - 1,024
Total other income 5,814 1,610
For
per
sona
l use
onl
y

Directors’ Report and Financial Statements
Notes to the Financial Statements
Melbourne IT Group Annual Report 2017 l 85
Section B: Operating assets and liabilities
B1. Trade and other receivables
Trade receivables, which generally have terms between 14 and 60 days, are recognised and carried at amortised cost, which is at original invoice amount less an allowance for any uncollectible amounts. An estimate for doubtful debts is made when collection of the full amount is no longer probable. Bad debts are written off when identified.
At 31 December, the ageing analysis of trade receivables is as follows:
Receivables past due, but not considered impaired are $12,306,000 (2016: $6,375,000), and comprise balances owed from customers who have a good history of repayments, or are otherwise considered recoverable.
Due to the short-term nature of these receivables, their carrying value is assumed to approximate their fair value. The maximum exposure to credit risk is the fair value of receivables. Collateral is not held as security.
2017 2016
$’000 $’000
Trade receivables 26,275 18,929
Allowance for doubtful debts (1,030) (836)
Total trade and other receivables 25,245 18,093
201 7 201 6
$’000 $’000
Opening balance 836 1 ,076
Additional provision / (released) 1 ,000 (231 )
Amount written off (898) (9)
Acquisitions 92 -
Closing balance 1 ,030 836
2017 2016Gross Allowance Gross Allowance
$’000 $’000 $’000 $’000
Consolidated
Current 12,939 - 11,718 -
0 - 30 days past due 6,787 - 4,021 -
31 - 60 days past due 1,985 - 1,070 -
61 days + past due 4,564 (1,030) 2,120 (836)
Closing balance 26,275 (1,030) 18,929 (836)
For
per
sona
l use
onl
y

86 l Melbourne IT Group Annual Report 2017
Directors’ Report and Financial Statements
Notes to Financial StatementsB2. Other Assets
Funds held in escrow relate to monetary assets held in trust with the Group's lawyers for, which disbursement will occur upon satisfaction of contingent consideration liability obligations, as described in note C6.
2017 2016$’000 $’000
Accrued revenue 4,969 1,946
Prepayments 2,374 2,538
Funds held in escrow 3,487 -
Lease incentive receivable 361 -
Total other assets (Current) 11,191 4,484
For
per
sona
l use
onl
y
Directors’ Report and Financial Statements
Notes to the Financial Statements
Melbourne IT Group Annual Report 2017 l 87
B3. Plant and equipment
Plant and equipment is stated at cost less accumulated depreciation and any impairment in value.
Depreciation is provided on a straight-line or diminishing value basis on all plant and equipment. Major depreciation periods are:
An item of plant and equipment is derecognised upon disposal or when no future economic benefits are expected from its use or disposal. Any gain or loss arising from the derecognition of the asset (calculated as the difference between net disposal proceeds and the carrying amount of the asset), is included in the statement of comprehensive income upon derecognition.
Leasehold Plant and Furniture Capital work
improvements equipment and fittings in progress Total
$’000 $’000 $’000 $’000 $’000
At cost
At 1 J anuary 201 6 1 ,1 71 1 4,833 357 1 52 1 6,51 3
Acquisition of InfoReady (note D1 ) - 44 - - 44
Additions 426 2,371 - 9 2,806
Transfers 89 63 - (1 52) -
At 31 December 201 6 1 ,686 1 7,31 1 357 9 1 9,363
Acquisition of WME Group (note D1 ) 283 85 22 - 390
Additions - 1 ,934 - 347 2,281
Transfers - - - (9) (9)
Disposals - (84) - - (84)
At 31 December 201 7 1 ,969 1 9,246 379 347 21 ,941
Depreciation and impairment
At 1 J anuary 201 6 586 8,363 1 38 - 9,087
Depreciation charge for the year 236 3,250 51 - 3,537
At 31 December 201 6 822 1 1 ,61 3 1 89 - 1 2,624
Depreciation charge for the year 336 2,91 9 45 - 3,300
At 31 December 201 7 1 ,1 58 1 4,532 234 - 1 5,924
Net book value
At 31 December 201 6 864 5,698 1 68 9 6,739
At 31 December 201 7 81 1 4,71 4 1 45 347 6,01 7
201 7 201 6
Leasehold improvements The lease term The lease term
Plant and equipment 2 to 4 years 2 to 4 years
Furniture and fittings 2 to 5 years 2 to 5 years
For
per
sona
l use
onl
y

88 l Melbourne IT Group Annual Report 2017
Directors’ Report and Financial Statements
Notes to Financial StatementsThe residual values, useful lives and methods of depreciation of plant and equipment are reviewed at each financial year end and adjusted prospectively, if appropriate.
B4. Intangible assets
Goodwill Goodwill on acquisition is initially measured at cost, being the excess of the cost of the business combination over the acquirer’s interest in the net fair value of the identifiable assets, liabilities and contingent liabilities.
Following initial recognition, goodwill is measured at cost less any accumulated impairment losses. Goodwill is not amortised. Goodwill is reviewed for impairment annually or more frequently if events or changes in circumstances indicate that the carrying value may be impaired.
As at the acquisition date, any goodwill acquired is allocated to each of the cash-generating units (CGUs) expected to benefit from the combination’s synergies. Goodwill has been allocated for impairment purposes to CGUs that are significant individually or in aggregate, taking into consideration the nature of services, resource allocation, how operations are monitored and where independent cash flows are identifiable.
The goodwill balance at 31 December 2016 has been restated to recognise an additional $2,705,000 goodwill asset. This follows from a change in accounting policy following a recent decision by the IFRS Interpretations Committee in relation to AASB 112: Income Taxes, as described in note A3 to the financial statements.
2017 2016
$’000 $’000
Goodwill 237,500 202,540
Market-related intangibles 9,053 9,052
Accumulated amortisation (1,817) (35)
7,236 9,017
Customer contracts 10,520 7,977
Accumulated amortisation (4,764) (3,305)
5,756 4,672
Capitalised software 15,755 13,239
Accumulated amortisation (7,151) (4,727)
8,604 8,512
Total intangible assets 259,096 224,741
For
per
sona
l use
onl
y

Directors’ Report and Financial Statements
Notes to the Financial Statements
Melbourne IT Group Annual Report 2017 l 89
Intangible assets acquired both separately and from a business combination Intangible assets acquired separately are capitalised at cost and from a business combination are capitalised at fair value as at the date of acquisition. Following initial recognition, the cost model is applied to the class of intangible assets. Where amortisation is charged on assets with finite lives, this expense is taken to profit and loss through the ‘amortisation of identifiable intangible assets’ line item.
Gains or losses arising from derecognition of an intangible asset are measured as the difference between the net disposal proceeds and the carrying amount of the asset and are recognised in the profit and loss when the asset is derecognised.
Internally generated intangible assets Costs relating to the research phase of the project are expensed while costs relating to the development phase are capitalised as Capitalised Software. The costs capitalised are being amortised over a useful life of four to six years.
A summary of the policies applied to the Group’s intangible assets is as follows:
Customer Contracts
Useful lives Finite
Amortisation Amortised over the estimated churn of the customer base
Impairment testing When indicators exist
Market-Related Intangibles
Useful lives Indefinite
Amortisation No amortisation
Impairment testing Annually and more frequently when indicators exist
Capitalised Software Projects
Useful lives 4-6 years
Impairment testing Amortisation method reviewed annually and when indicators exist
The carrying value of any intangible assets denominated in foreign currencies is revalued at the year-end spot rate of each reporting period, leading to changes in the carrying value of the intangible assets in reporting currency. Any revaluation amounts are recognised directly in the foreign currency translation reserve.
For
per
sona
l use
onl
y
90 l Melbourne IT Group Annual Report 2017
Directors’ Report and Financial Statements
Notes to Financial StatementsImpairment of assets At each reporting date, Melbourne IT assesses whether there is any indication that an asset may be impaired. Where an indicator of impairment exists, Melbourne IT makes a formal estimate of recoverable amount. Where the carrying amount of an asset exceeds its recoverable amount the asset is considered impaired and is written down to its recoverable amount.
The carrying values of assets are reviewed for impairment when events or changes in circumstances indicate the carrying value may not be recoverable. For an asset that does not generate largely independent cash inflows, the recoverable amount is determined for the cash-generating unit to which the asset belongs. If any such indication exists and where the carrying values exceed the estimated recoverable amount, the assets or cash-generating units are written down to their recoverable amount.
Recoverable amount is the greater of fair value less costs to sell and value in use. It is determined for an individual asset, unless the asset's value in use cannot be estimated to be close to its fair value less costs to sell and it does not generate cash inflows that are largely independent of those from other assets, or groups of assets, in which case, the recoverable amount is determined for the CGU to which the asset belongs.
In assessing value in use, the estimated future cash flows are discounted to their present value using a pre-tax discount rate that reflects current market assessments of the time value of money and the risks specific to the asset.
(a) Reconciliation of carrying amounts at the beginning and end ofthe period
Market
Capitalised Customer Related
Software Contracts Intangibles Goodwill Total
$’000 $’000 $’000 $’000 $’000
Net balance at 1 January 2016 8,266 5,487 9,052 182,000 204,805
Acquisition of InfoReady (note D1) - 847 - 23,565 24,412
AASB 112 Restatement - - - 2,705 2,705
Additions 2,181 - - - 2,181
Disposals - (114) - (5,730) (5,844)
Amortisation (1,935) (1,548) (35) - (3,518)
Net balance at 31 December 2016 8,512 4,672 9,017 202,540 224,741
Acquisition of WME Group (note D1) 595 3,206 - 34,960 38,761
Additions 1,934 - - - 1,934
Disposal (13) - - - (13)
Amortisation (2,424) (2,122) (1,781) - (6,327)
Net balance at 31 December 2017 8,604 5,756 7,236 237,500 259,096 For
per
sona
l use
onl
y

Directors’ Report and Financial Statements
Notes to the Financial Statements
Melbourne IT Group Annual Report 2017 l 91
(b) Market-related intangibles
Marketing-related intangibles represent brand names of past acquisitions. They have been assessed as having indefinite useful lives as they are expected to contribute to future economic benefits indefinitely as Melbourne IT continues to sell its products under these brand names indefinitely and therefore invests in these brands through its marketing activities. Current year amortisation represents the retirement of a brand name.
On 31 October 2017, Melbourne IT approved the retirement of the WebCentral brand in line with a group-wide brand review. The Group anticipates the retirement of the WebCentral brand will be complete within 12 months and as a result the useful life of the related brand intangible asset has been revised to 12 months, ending 31 October 2018. AASB 108: Accounting Policies, Changes in Accounting Estimates and Errors requires any changes in estimates to be applied prospectively from the date of the change in estimate. As a result, $1,782,000 of accelerated amortisation expense has been recognised in the Statement of Comprehensive Income.
(c) Customer contracts
Following the acquisition of WME Group in the current period and InfoReady in the prior period, customer contracts amounting to $3,206,000 and $847,000 were recognised respectively based on an external valuation. The customer contracts are amortised over the period of 3-5 years based on the historical attrition rate.
(d) Capitalised software
Software intangibles represent capitalised costs, primarily consisting of employee costs (carrying value of $4,482,000) and software acquired from Netregistry Pty Ltd (carrying value of $3,165,000), Oracle Financials, the common financial reporting system used by all entities in the Group (carrying value of $375,000), software acquired from WME Group (carrying value of $479,000) and software acquired from Outware (carrying value of $103,000).
(e) Goodwill and other intangible assets impairment testing
Carrying amount of intangible assets allocated to each of the CGUs:
Under the impairment testing the carrying amount of each CGU is compared to its recoverable amount. The recoverable amount of each CGU is determined based on a value in use calculation for each CGU to which goodwill and other intangible assets has been allocated.
2017 2016 2017 2016 2017 2016
$’000 $’000 $’000 $’000 $’000 $’000
Goodwill 135,773 100,153 101,727 102,387 237,500 202,540
Market-related intangibles 6,273 7,734 963 1,283 7,236 9,017
Customer contracts 3,663 1,781 2,093 2,891 5,756 4,672
Capitalised software 5,565 7,018 3,039 1,494 8,604 8,512
TotalESSMB Solutions
For
per
sona
l use
onl
y

92 l Melbourne IT Group Annual Report 2017
Directors’ Report and Financial Statements
Notes to Financial StatementsKey assumptions used in value in use ('VIU') calculations
1. All value in use calculations are based on management's estimates of achievable EBITDAs for the respective CGUs, with growth rates as noted in the table applied to
years 2-5. These estimates are most sensitive to assumptions around revenue growth, in particular the timescale for implementation of new products and initiatives in the
SMB Solutions business. Year 1 results are based on Board-approved budgets.
2. Cash flows beyond the 5-year period are extrapolated using a 2.5% growth rate (2016: 2.5%) to determine terminal value, which is the company’s estimate of the long-
term average growth rate for the industry in which the company operates.
3. ES CGU's year 2 growth rate is expected to be greater than 2.5% as a result of the ES CGU continuing geographic expansion for state-based practices for Mobile, Data
and Analytics and Cloud. However, for the purposes of determining the VIU of the ES CGU, the long-term growth rate of the Group has been adopted.
4. The discount rate used reflects risks specific to the Group and its operating segments and is derived from its weighted average cost of capital. Segment-specific risk is
incorporated by applying individual beta which is assessed annually based on publicly available data.
Results of impairment test and impact of reasonably possible changes in key assumptions There was no requirement to impair goodwill as a result of the impairment testing. For each CGU the recoverable amount exceeds its carrying amount. As impairment testing is based on assumptions and judgements, the Group has considered changes in key assumptions that they believe to be reasonably possible. For all CGUs, the recoverable amount exceeds the carrying amount when testing for reasonably possible changes in key assumptions.
If all assumptions remain the same, the base year EBITDA would need to decline from the current expected EBITDA by 32% for the SMB Solutions CGU and 7% for the ES CGU for the recoverable amounts of the CGUs, to equal their carrying values respectively.
Key judgement and estimates The Group determines whether goodwill and intangibles with indefinite useful lives are impaired at least on an annual basis. This requires an estimation of the recoverable amount of the cash-generating unit, using a value in use discounted cash flow methodology, to which the goodwill and intangibles with indefinite useful lives are allocated. Key assumptions requiring judgement include projected cash flows based on forecast EBITDA, growth rate estimates and discount rates.
SMB Solutions ES
Growth rate year 1(1) 14.50% 23.30%
Growth rate year 2-5(1) 2.50% 2.50%(3)
Growth rate after year 5(2) 2.50% 2.50%
Discount rate(4) 11.50% 11.20%
For
per
sona
l use
onl
y
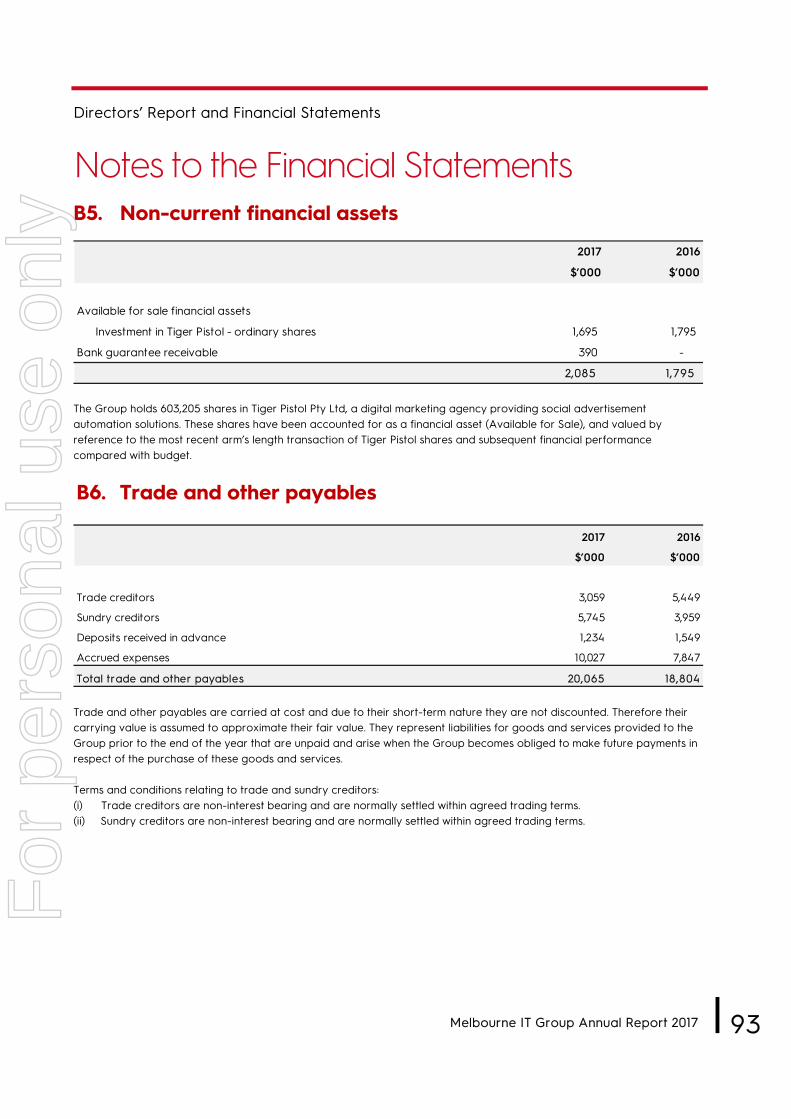
Directors’ Report and Financial Statements
Notes to the Financial Statements
Melbourne IT Group Annual Report 2017 l 93
B5. Non-current financial assets
The Group holds 603,205 shares in Tiger Pistol Pty Ltd, a digital marketing agency providing social advertisement automation solutions. These shares have been accounted for as a financial asset (Available for Sale), and valued by reference to the most recent arm’s length transaction of Tiger Pistol shares and subsequent financial performance compared with budget.
B6. Trade and other payables
Trade and other payables are carried at cost and due to their short-term nature they are not discounted. Therefore their carrying value is assumed to approximate their fair value. They represent liabilities for goods and services provided to the Group prior to the end of the year that are unpaid and arise when the Group becomes obliged to make future payments in respect of the purchase of these goods and services.
Terms and conditions relating to trade and sundry creditors: (i) Trade creditors are non-interest bearing and are normally settled within agreed trading terms.(ii) Sundry creditors are non-interest bearing and are normally settled within agreed trading terms.
2017 2016
$’000 $’000
Available for sale financial assets
Investment in Tiger Pistol - ordinary shares 1,695 1,795
Bank guarantee receivable 390 -
2,085 1,795
2017 2016
$’000 $’000
Trade creditors 3,059 5,449
Sundry creditors 5,745 3,959
Deposits received in advance 1,234 1,549
Accrued expenses 10,027 7,847
Total trade and other payables 20,065 18,804
For
per
sona
l use
onl
y
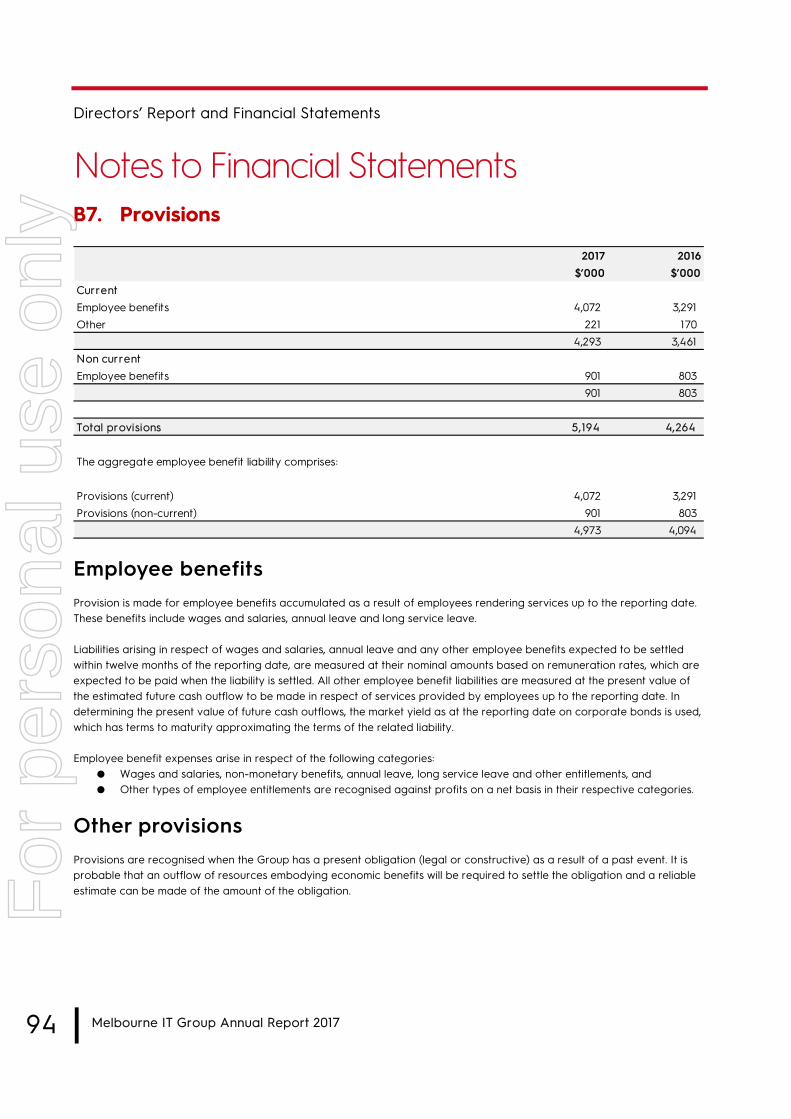
94 l Melbourne IT Group Annual Report 2017
Directors’ Report and Financial Statements
Notes to Financial StatementsB7. Provisions
Employee benefits Provision is made for employee benefits accumulated as a result of employees rendering services up to the reporting date. These benefits include wages and salaries, annual leave and long service leave.
Liabilities arising in respect of wages and salaries, annual leave and any other employee benefits expected to be settled within twelve months of the reporting date, are measured at their nominal amounts based on remuneration rates, which are expected to be paid when the liability is settled. All other employee benefit liabilities are measured at the present value of the estimated future cash outflow to be made in respect of services provided by employees up to the reporting date. In determining the present value of future cash outflows, the market yield as at the reporting date on corporate bonds is used, which has terms to maturity approximating the terms of the related liability.
Employee benefit expenses arise in respect of the following categories: ● Wages and salaries, non-monetary benefits, annual leave, long service leave and other entitlements, and● Other types of employee entitlements are recognised against profits on a net basis in their respective categories.
Other provisions Provisions are recognised when the Group has a present obligation (legal or constructive) as a result of a past event. It is probable that an outflow of resources embodying economic benefits will be required to settle the obligation and a reliable estimate can be made of the amount of the obligation.
2017 2016$’000 $’000
Current Employee benefits 4,072 3,291 Other 221 170
4,293 3,461 Non current Employee benefits 901 803
901 803
Total provisions 5,194 4,264
The aggregate employee benefit liability comprises:
Provisions (current) 4,072 3,291 Provisions (non-current) 901 803
4,973 4,094
For
per
sona
l use
onl
y
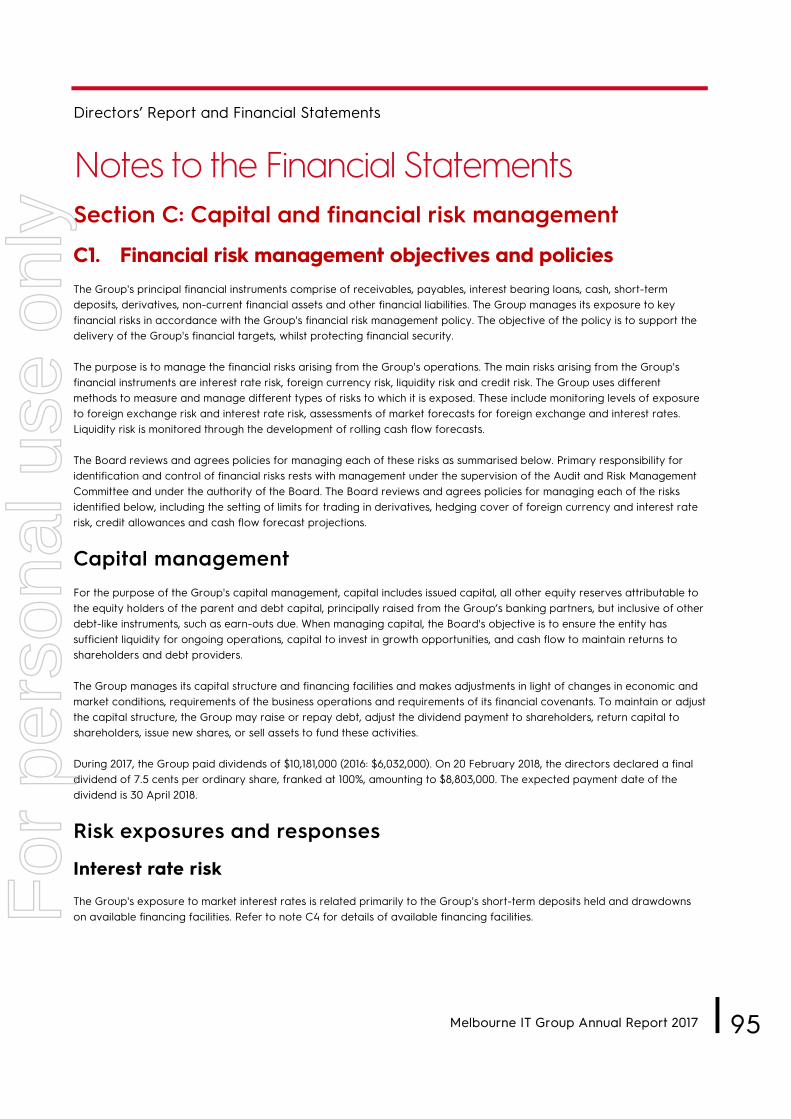
Directors’ Report and Financial Statements
Notes to the Financial Statements
Melbourne IT Group Annual Report 2017 l 95
Section C: Capital and financial risk management
C1. Financial risk management objectives and policies The Group's principal financial instruments comprise of receivables, payables, interest bearing loans, cash, short-term deposits, derivatives, non-current financial assets and other financial liabilities. The Group manages its exposure to key financial risks in accordance with the Group's financial risk management policy. The objective of the policy is to support the delivery of the Group's financial targets, whilst protecting financial security.
The purpose is to manage the financial risks arising from the Group's operations. The main risks arising from the Group's financial instruments are interest rate risk, foreign currency risk, liquidity risk and credit risk. The Group uses different methods to measure and manage different types of risks to which it is exposed. These include monitoring levels of exposure to foreign exchange risk and interest rate risk, assessments of market forecasts for foreign exchange and interest rates. Liquidity risk is monitored through the development of rolling cash flow forecasts.
The Board reviews and agrees policies for managing each of these risks as summarised below. Primary responsibility for identification and control of financial risks rests with management under the supervision of the Audit and Risk Management Committee and under the authority of the Board. The Board reviews and agrees policies for managing each of the risks identified below, including the setting of limits for trading in derivatives, hedging cover of foreign currency and interest rate risk, credit allowances and cash flow forecast projections.
Capital management For the purpose of the Group's capital management, capital includes issued capital, all other equity reserves attributable to the equity holders of the parent and debt capital, principally raised from the Group’s banking partners, but inclusive of other debt-like instruments, such as earn-outs due. When managing capital, the Board's objective is to ensure the entity has sufficient liquidity for ongoing operations, capital to invest in growth opportunities, and cash flow to maintain returns to shareholders and debt providers.
The Group manages its capital structure and financing facilities and makes adjustments in light of changes in economic and market conditions, requirements of the business operations and requirements of its financial covenants. To maintain or adjust the capital structure, the Group may raise or repay debt, adjust the dividend payment to shareholders, return capital to shareholders, issue new shares, or sell assets to fund these activities.
During 2017, the Group paid dividends of $10,181,000 (2016: $6,032,000). On 20 February 2018, the directors declared a final dividend of 7.5 cents per ordinary share, franked at 100%, amounting to $8,803,000. The expected payment date of the dividend is 30 April 2018.
Risk exposures and responses
Interest rate risk
The Group's exposure to market interest rates is related primarily to the Group's short-term deposits held and drawdowns on available financing facilities. Refer to note C4 for details of available financing facilities. F
or p
erso
nal u
se o
nly
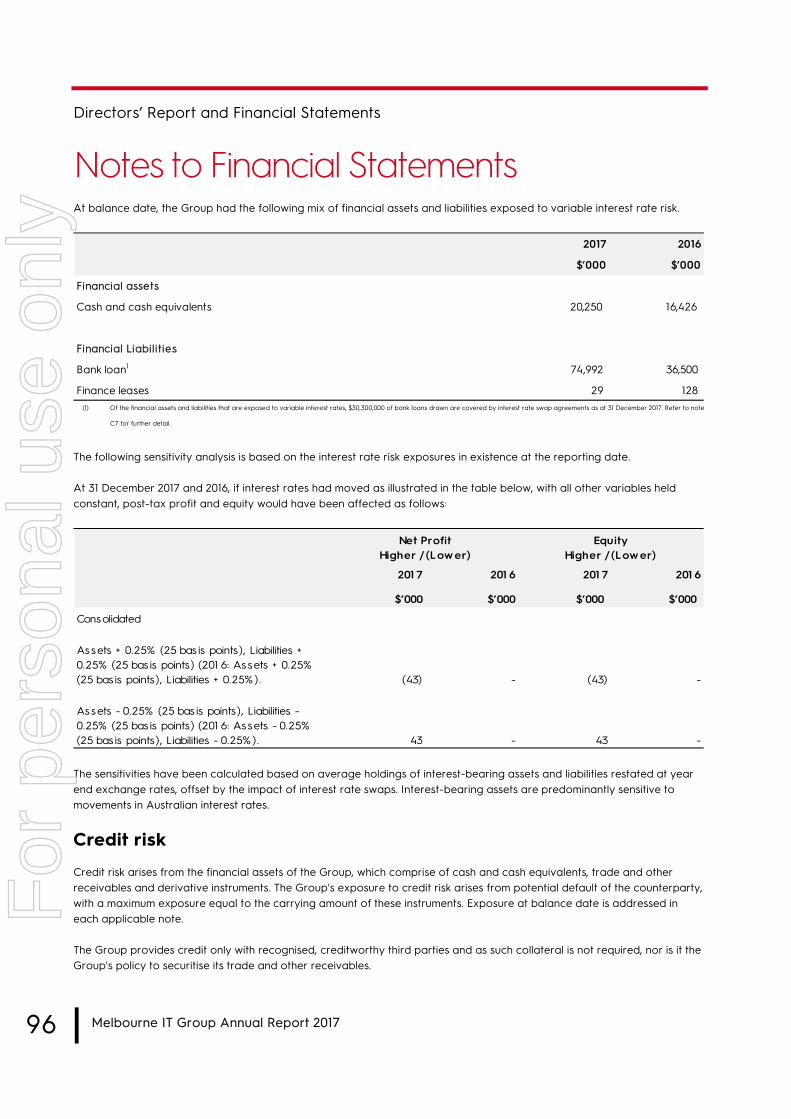
96 l Melbourne IT Group Annual Report 2017
Directors’ Report and Financial Statements
Notes to Financial StatementsAt balance date, the Group had the following mix of financial assets and liabilities exposed to variable interest rate risk.
(1) Of the financial assets and liabilities that are exposed to variable interest rates, $30,300,000 of bank loans drawn are covered by interest rate swap agreements as at 31 December 2017. Refer to note
C7 for further detail.
The following sensitivity analysis is based on the interest rate risk exposures in existence at the reporting date.
At 31 December 2017 and 2016, if interest rates had moved as illustrated in the table below, with all other variables held constant, post-tax profit and equity would have been affected as follows:
The sensitivities have been calculated based on average holdings of interest-bearing assets and liabilities restated at year end exchange rates, offset by the impact of interest rate swaps. Interest-bearing assets are predominantly sensitive to movements in Australian interest rates.
Credit risk
Credit risk arises from the financial assets of the Group, which comprise of cash and cash equivalents, trade and other receivables and derivative instruments. The Group's exposure to credit risk arises from potential default of the counterparty, with a maximum exposure equal to the carrying amount of these instruments. Exposure at balance date is addressed in each applicable note.
The Group provides credit only with recognised, creditworthy third parties and as such collateral is not required, nor is it the Group's policy to securitise its trade and other receivables.
2017 2016
$’000 $’000
Financial assets
Cash and cash equivalents 20,250 16,426
Financial Liabilities
Bank loan1 74,992 36,500
Finance leases 29 128
201 7 201 6 201 7 201 6
$’000 $’000 $’000 $’000
Consolidated
(43) - (43) -
43 - 43 -
Net Profit Equity
Assets - 0.25% (25 bas is points ), Liabilities - 0.25% (25 basis points) (201 6: Assets - 0.25% (25 basis points), Liabilities - 0.25% ).
Higher / (Low er) Higher / (Low er)
Assets + 0.25% (25 bas is points ), Liabilities + 0.25% (25 basis points) (201 6: Assets + 0.25% (25 basis points), Liabilities + 0.25% ).
For
per
sona
l use
onl
y

Directors’ Report and Financial Statements
Notes to the Financial Statements
Melbourne IT Group Annual Report 2017 l 97
It is the Group's policy that all customers who wish to trade on credit terms are subject to credit verification procedures, which may include an assessment of their financial position, past experience and industry reputation, depending on the amount of credit to be granted. In addition, receivable balances are monitored on an ongoing basis.
Foreign currency risk
The Group conducts some of its business in US dollars ('USD') and is therefore exposed to movements in the AUD/USD dollar exchange rate. The Group actively manages the gross margin risk by its foreign currency risk management strategy. Please refer to Note C7 for further details.
Both the functional and presentation currency of Melbourne IT Ltd is in Australian dollars (AUD). The consolidated Group contains functional currencies in USD and NZD. Transactions in foreign currencies are initially recorded in the functional currency at the exchange rates ruling at the date of the transaction. Monetary assets and liabilities denominated in foreign currencies are retranslated at the rate of exchange ruling at the reporting date.
The exchange differences arising on the retranslation are taken directly to other comprehensive income. On disposal of a foreign entity, the deferred cumulative amount recognised in other comprehensive income relating to that particular foreign operation is recognised in the determination of profit and loss for the year.
At 31 December 2017, the Group had the following exposures to USD denominated assets and liabilities, where the functional currency is not USD. The Group's exposure to foreign currency changes for all other currencies is not material. Assets and liabilities that are designated in cash flow hedges are not included:
The following sensitivity is based on foreign currency risk exposures in existence at the reporting date.
At 31 December 2017, had the AUD moved as illustrated in the table below with all other variables held constant, post-tax profit and equity would have been affected as follows:
2017 2016
$’000 $’000
Financial Assets
Cash and cash equivalents 155 1,750
Trade and other receivables 88 207
243 1,957
Financial Liabilities
Trade and other payables (1,670) (773)
Net exposure (1,427) 1,184
For
per
sona
l use
onl
y
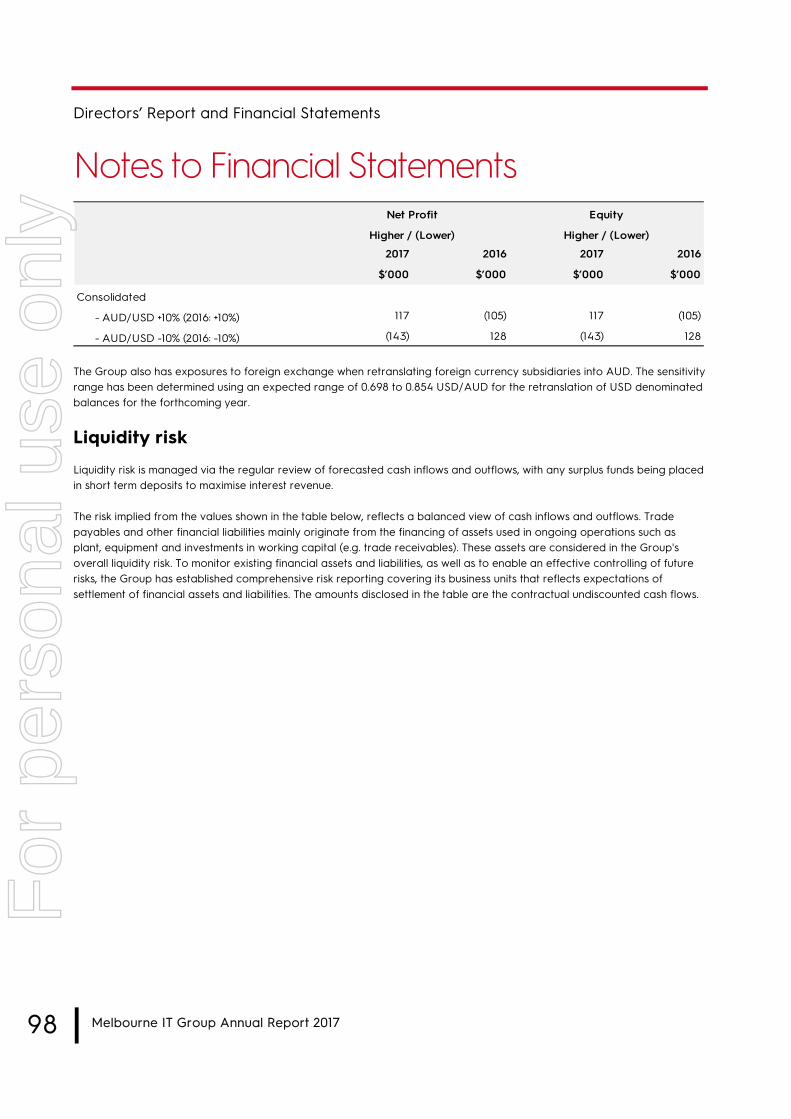
Directors’ Report and Financial Statements
Notes to Financial Statements
98 l Melbourne IT Group Annual Report 2017
The Group also has exposures to foreign exchange when retranslating foreign currency subsidiaries into AUD. The sensitivity range has been determined using an expected range of 0.698 to 0.854 USD/AUD for the retranslation of USD denominated balances for the forthcoming year.
Liquidity risk
Liquidity risk is managed via the regular review of forecasted cash inflows and outflows, with any surplus funds being placed in short term deposits to maximise interest revenue.
The risk implied from the values shown in the table below, reflects a balanced view of cash inflows and outflows. Trade payables and other financial liabilities mainly originate from the financing of assets used in ongoing operations such as plant, equipment and investments in working capital (e.g. trade receivables). These assets are considered in the Group's overall liquidity risk. To monitor existing financial assets and liabilities, as well as to enable an effective controlling of future risks, the Group has established comprehensive risk reporting covering its business units that reflects expectations of settlement of financial assets and liabilities. The amounts disclosed in the table are the contractual undiscounted cash flows.
2017 2016 2017 2016
$’000 $’000 $’000 $’000
Consolidated
- AUD/USD +10% (2016: +10%) 117 (105) 117 (105)
- AUD/USD -10% (2016: -10%) (143) 128 (143) 128
Net Profit Equity
Higher / (Lower) Higher / (Lower)
For
per
sona
l use
onl
y

Directors’ Report and Financial Statements
Notes to the Financial Statements
Melbourne IT Group Annual Report 2017 l 99
< 6 Months 6 to 12 Months 1 to 5 Years > 5 Years Total
$’000 $’000 $’000 $’000 $’000
31 December 2017
Financial assets
Cash and cash equivalents 20,250 - - - 20,250
Trade and other receivables 25,245 - - - 25,245
Other financial assets - - 2,085 - 2,085
45,495 - 2,085 - 47,580
Financial liabilities
Trade and other payables (20,065) - - - (20,065)
(29) (9,000) (65,992) - (75,021)
Other financial liabilities (5,034) - (6,593) - (11,627)
(25,128) (9,000) (72,585) - (106,713)
20,367 (9,000) (70,500) - (59,133)
31 December 2016
Financial assets
Cash and cash equivalents 16,426 - - - 16,426
Trade and other receivables 18,093 - - - 18,093
Other financial assets - - 1,795 - 1,795
34,519 - 1,795 - 36,314
Financial liabilities
(18,804) - - - (18,804)
(54) (44) (36,537) - (36,635)
Other financial liabilities (1,261) (29,828) (8,315) - (39,404)
(20,119) (29,872) (44,852) - (94,843)
14,400 (29,872) (43,057) - (58,529)
Trade and other payables
Borrowings
Net inflow/(outflow)
Borrowings
Net inflow/(outflow)
For
per
sona
l use
onl
y

100 l Melbourne IT Group Annual Report 2017
Directors’ Report and Financial Statements
Notes to Financial StatementsC2. Contributed equity
(a) Issued and paid-up capital
(b) Movements in shares on issue
(c) Treasury shares
As part of the Deed of Variation and Option Exercise with the owners of the non-controlling interest of Outware to purchase the remaining 24.9% of share capital, 521,520 ordinary shares were repurchased in anticipation of satisfaction of Deed obligations. This has been subsequently transferred to the vendors on 3 January 2018 as disclosed in note E7 to the financial statements.
2017 2016
$’000 $’000
Issued and paid-up capital
Ordinary shares each fully paid 83,507 51,026
Number of Number of
shares $’000 shares $’000
Beginning of the financial year 100,861,330 51,026 92,944,392 35,629
Issued during the year:
- Capital raising 14,609,443 30,680 7,500,000 15,000
- Performance rights vested (2014 LTI Plan) 659,913 - - -
- Dividend reinvestment plan 1,238,302 3,082 416,938 821
- Transaction costs for capital raising andshare repurchase, net of tax
- (1,281) - (424)
End of the financial year 117,368,988 83,507 100,861,330 51,026
2017 2016
Number of Number of
shares $’000 shares $’000
Beginning of the financial period - - - - Share repurchase during the year 521,520 1,884 - - End of the financial period 521,520 1,884 - -
2017 2016
For
per
sona
l use
onl
y
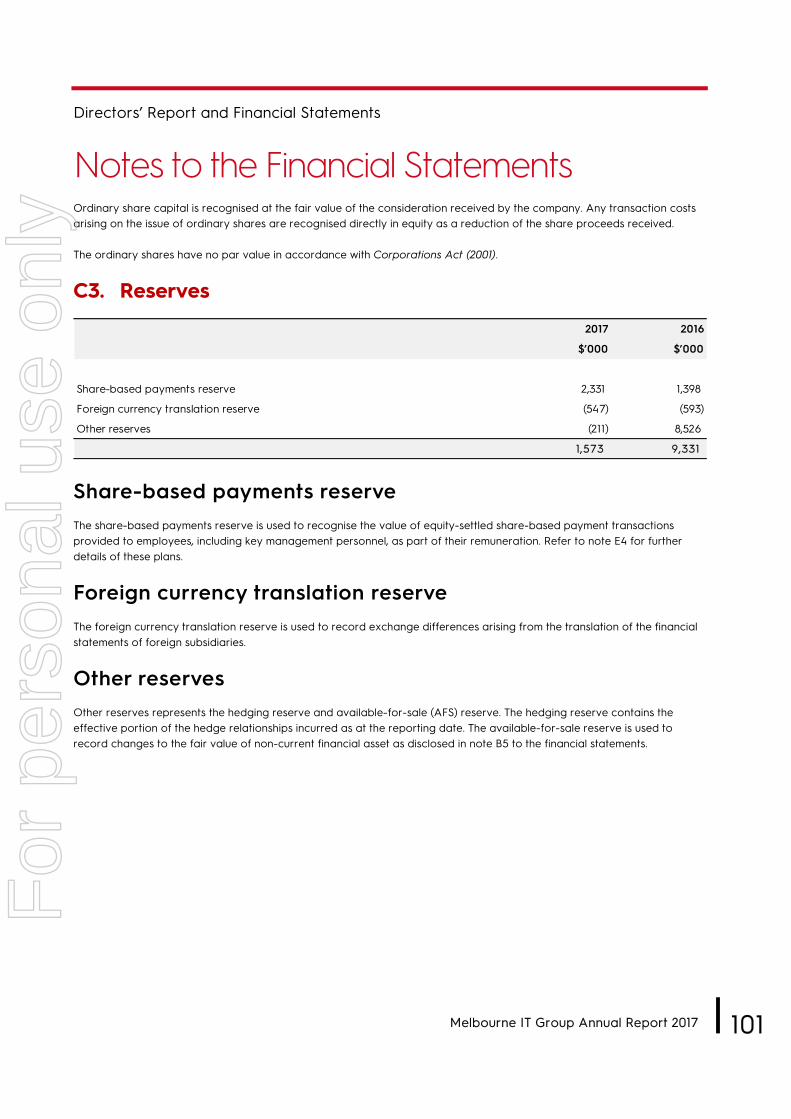
Directors’ Report and Financial Statements
Notes to the Financial Statements
Melbourne IT Group Annual Report 2017 l 101
Ordinary share capital is recognised at the fair value of the consideration received by the company. Any transaction costs arising on the issue of ordinary shares are recognised directly in equity as a reduction of the share proceeds received.
The ordinary shares have no par value in accordance with Corporations Act (2001).
C3. Reserves
Share-based payments reserve The share-based payments reserve is used to recognise the value of equity-settled share-based payment transactions provided to employees, including key management personnel, as part of their remuneration. Refer to note E4 for further details of these plans.
Foreign currency translation reserve The foreign currency translation reserve is used to record exchange differences arising from the translation of the financial statements of foreign subsidiaries.
Other reserves Other reserves represents the hedging reserve and available-for-sale (AFS) reserve. The hedging reserve contains the effective portion of the hedge relationships incurred as at the reporting date. The available-for-sale reserve is used to record changes to the fair value of non-current financial asset as disclosed in note B5 to the financial statements.
2017 2016
$’000 $’000
Share-based payments reserve 2,331 1,398
Foreign currency translation reserve (547) (593)
Other reserves (211) 8,526
1,573 9,331
For
per
sona
l use
onl
y

102 l Melbourne IT Group Annual Report 2017
Directors’ Report and Financial Statements
Notes to Financial StatementsC4. Borrowings
Interest-bearing loans and borrowing costs All loans and borrowings are initially recognised at the fair value of the consideration received, less directly attributable transaction costs. After initial recognition, interest-bearing loans and borrowings are subsequently measured at amortised cost using the effective interest method. Fees paid on the establishment of loan facilities that are yield-related are included as part of the carrying amount of the loans and borrowings. Borrowings are classified as current liabilities, unless the group has an unconditional right to defer settlement of the liability for at least 12 months after the reporting date.
The facility was secured via a negative pledge plus mortgage over shares in Outware Systems Pty Ltd. Following the completion of the acquisition of Outware Systems Pty Ltd on 15 February 2017, the security was released and the loan is unsecured.
Borrowing costs are recognised as an expense when incurred. Borrowing costs consist of interest and other costs that an entity incurs in connection with the borrowing of funds. Interest rate is based on the relevant period BBSY rate. The cash advance facility balance is approximate to fair value given that it is an interest bearing loan at a floating interest rate.
As part of the WME Group acquisition, the ANZ bank facility was renegotiated and repayments for Tranche B begin from 30 June 2018. On 15 February 2017, $27,692,000 was drawn down from the ANZ banking facility to fund the acquisition of the remaining 24.9% interest in Outware. On 12 September 2017, a further $10,800,000 was drawn down from Tranche B to fund the acquisition of WME Group. The Group is currently in the process of renegotiating this banking facility.
The ANZ bank facility has a maturity date of 1 January 2019. Interest rate is based on the relevant period BBSY rate. The cash advance facility balance is approximate to fair value, given that it is an interest bearing loan at floating interest rate. During the year ended 31 December 2017, the Group made no loan repayments.
2017 2016
$’000 $’000
Current
Finance lease liabilities 29 92
Bank loan 9,000 -
9,029 92
Non current
Finance lease liabilities - 36
Interest-bearing loan 65,992 36,500
65,992 36,536
For
per
sona
l use
onl
y

Directors’ Report and Financial Statements
Notes to the Financial Statements
Melbourne IT Group Annual Report 2017 l 103
Leases The determination of whether an arrangement is, or contains, a lease is based on the substance of the arrangement at the inception date. The arrangement is assessed for whether fulfilment of the arrangement is dependent on the use of a specific asset(s) or the arrangement, conveys a right to use the asset(s), even if that right is not explicitly specified in an arrangement.
Leases where the lessor retains substantially all the risks and benefits of ownership of the asset are classified as operating leases. Operating lease payments are recognised as an expense in the profit and loss on a straight-line basis over the lease term. Operating lease incentives are recognised as a liability when received and subsequently reduced by allocating lease payments between rental expense and reduction of the liability.
The Group has entered into finance leases for some items of equipment whereby the present value of the minimum lease payments approximate $36,000 (2016: $128,000). Refer to note C5 for further details.
Financing facilities available At reporting date, the following financing facilities had been negotiated and were available:
201 7 201 6 201 7 201 6
$’000 $’000 $’000 $’000
Bus iness lending - cash advance facility 83,600 83,600 74,992 36,500
Bus iness lending - bank guarantees 4,865 3,800 3,055 1 ,803
Asset finance - leas ing 5,000 5,000 - -
Standby letters of credit 2,1 35 3,200 992 1 ,1 20
95,600 95,600 79,040 39,423
Facilities us ed at reporting dateTotal facilities
For
per
sona
l use
onl
y
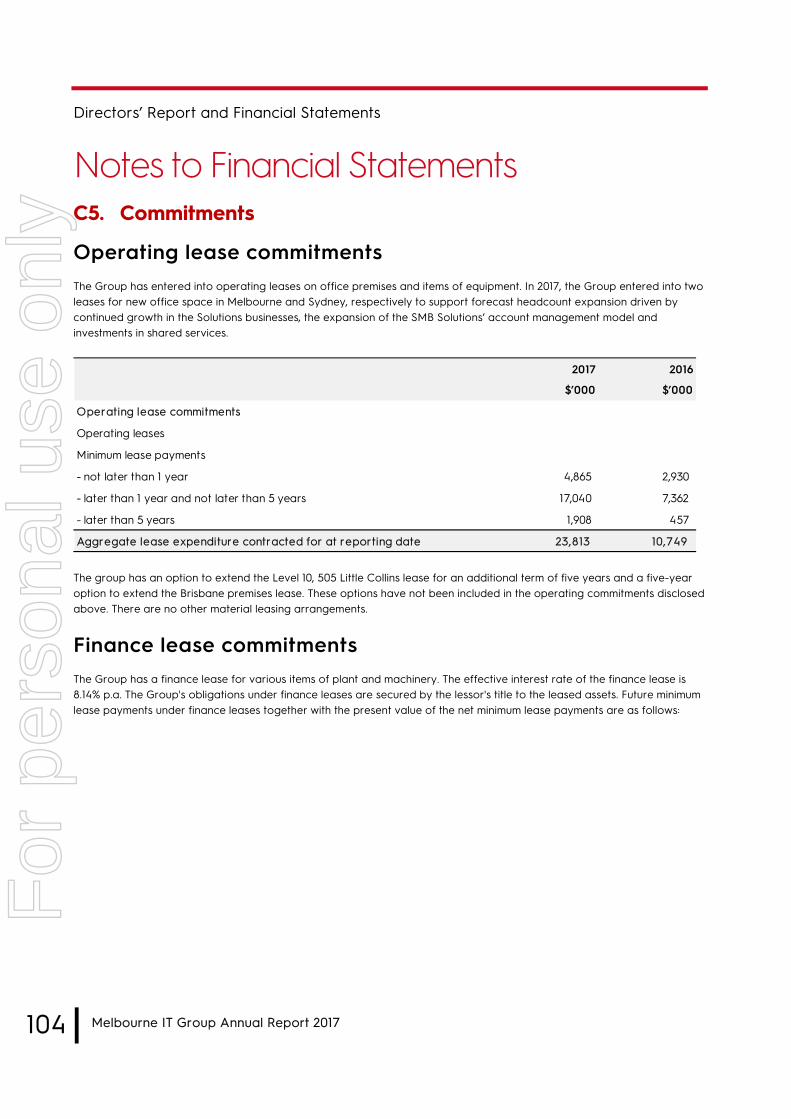
104 l Melbourne IT Group Annual Report 2017
Directors’ Report and Financial Statements
Notes to Financial StatementsC5. Commitments
Operating lease commitments The Group has entered into operating leases on office premises and items of equipment. In 2017, the Group entered into two leases for new office space in Melbourne and Sydney, respectively to support forecast headcount expansion driven by continued growth in the Solutions businesses, the expansion of the SMB Solutions’ account management model and investments in shared services.
The group has an option to extend the Level 10, 505 Little Collins lease for an additional term of five years and a five-year option to extend the Brisbane premises lease. These options have not been included in the operating commitments disclosed above. There are no other material leasing arrangements.
Finance lease commitments The Group has a finance lease for various items of plant and machinery. The effective interest rate of the finance lease is 8.14% p.a. The Group's obligations under finance leases are secured by the lessor's title to the leased assets. Future minimum lease payments under finance leases together with the present value of the net minimum lease payments are as follows:
2017 2016
$’000 $’000
Operating lease commitments
Operating leases
Minimum lease payments
- not later than 1 year 4,865 2,930
- later than 1 year and not later than 5 years 17,040 7,362
- later than 5 years 1,908 457
Aggregate lease expenditure contracted for at reporting date 23,813 10,749
For
per
sona
l use
onl
y
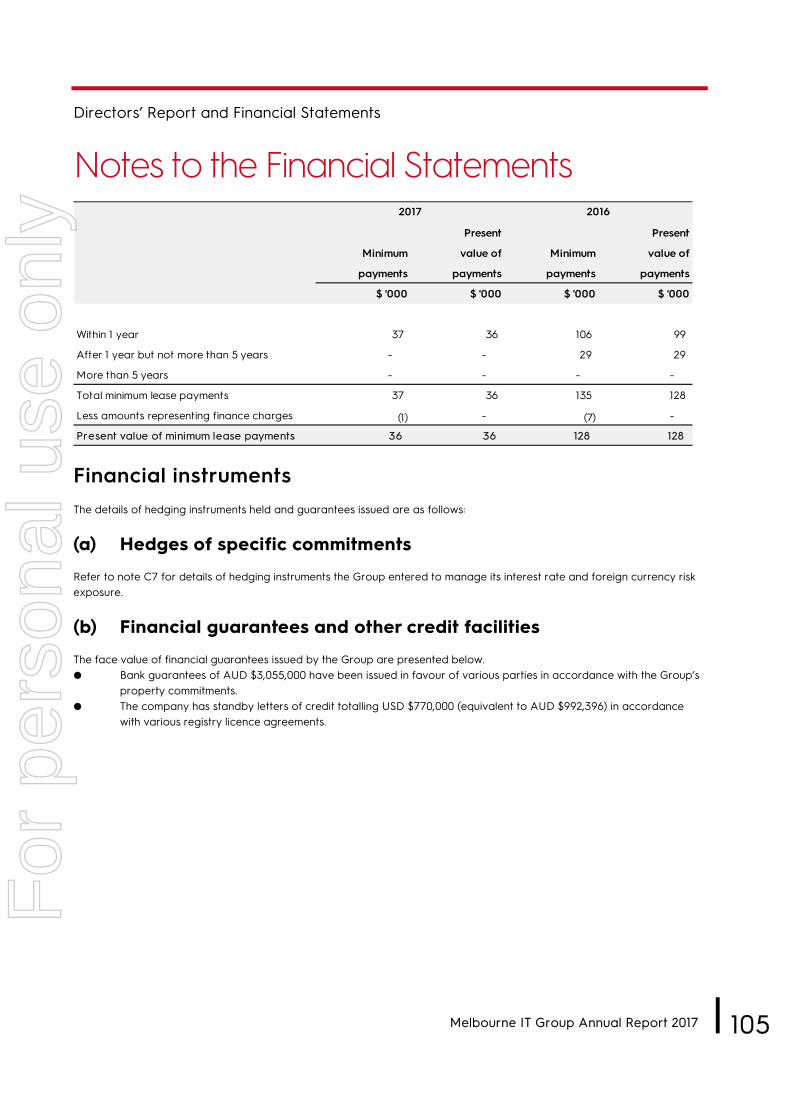
Directors’ Report and Financial Statements
Notes to the Financial Statements
Melbourne IT Group Annual Report 2017 l 105
Financial instruments The details of hedging instruments held and guarantees issued are as follows:
(a) Hedges of specific commitments
Refer to note C7 for details of hedging instruments the Group entered to manage its interest rate and foreign currency risk exposure.
(b) Financial guarantees and other credit facilities
The face value of financial guarantees issued by the Group are presented below. ● Bank guarantees of AUD $3,055,000 have been issued in favour of various parties in accordance with the Group’s
property commitments.● The company has standby letters of credit totalling USD $770,000 (equivalent to AUD $992,396) in accordance
with various registry licence agreements.
Present Present
Minimum value of Minimum value of
payments payments payments payments
$ '000 $ '000 $ '000 $ '000
Within 1 year 37 36 106 99
After 1 year but not more than 5 years - - 29 29
More than 5 years - - - -
Total minimum lease payments 37 36 135 128
Less amounts representing finance charges (1) - (7) -
Present value of minimum lease payments 36 36 128 128
2017 2016
For
per
sona
l use
onl
y
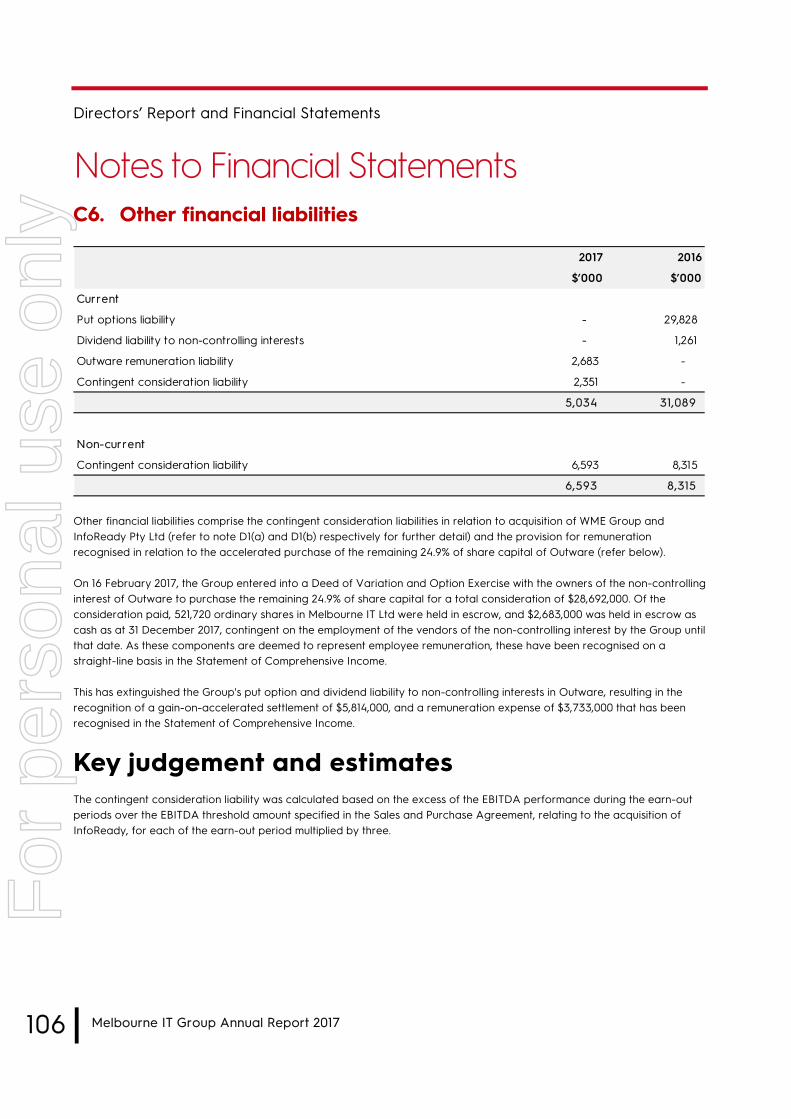
106 l Melbourne IT Group Annual Report 2017
Directors’ Report and Financial Statements
Notes to Financial StatementsC6. Other financial liabilities
Other financial liabilities comprise the contingent consideration liabilities in relation to acquisition of WME Group and InfoReady Pty Ltd (refer to note D1(a) and D1(b) respectively for further detail) and the provision for remuneration recognised in relation to the accelerated purchase of the remaining 24.9% of share capital of Outware (refer below).
On 16 February 2017, the Group entered into a Deed of Variation and Option Exercise with the owners of the non-controlling interest of Outware to purchase the remaining 24.9% of share capital for a total consideration of $28,692,000. Of the consideration paid, 521,720 ordinary shares in Melbourne IT Ltd were held in escrow, and $2,683,000 was held in escrow as cash as at 31 December 2017, contingent on the employment of the vendors of the non-controlling interest by the Group until that date. As these components are deemed to represent employee remuneration, these have been recognised on a straight-line basis in the Statement of Comprehensive Income.
This has extinguished the Group's put option and dividend liability to non-controlling interests in Outware, resulting in the recognition of a gain-on-accelerated settlement of $5,814,000, and a remuneration expense of $3,733,000 that has been recognised in the Statement of Comprehensive Income.
Key judgement and estimates The contingent consideration liability was calculated based on the excess of the EBITDA performance during the earn-out periods over the EBITDA threshold amount specified in the Sales and Purchase Agreement, relating to the acquisition of InfoReady, for each of the earn-out period multiplied by three.
2017 2016
$’000 $’000
Current
Put options liability - 29,828
Dividend liability to non-controlling interests - 1,261
Outware remuneration liability 2,683 -
Contingent consideration liability 2,351 -
5,034 31,089
Non-current
Contingent consideration liability 6,593 8,315
6,593 8,315
For
per
sona
l use
onl
y

Directors’ Report and Financial Statements
Notes to the Financial Statements
Melbourne IT Group Annual Report 2017 l 107
C7. Derivative financial liabilities/ (assets)
The Group conducts some amount of its business in USD and is therefore exposed to movements in the AUD/USD dollar exchange rate. The Group actively manages this risk via its foreign currency risk management strategy.
The Group uses derivative financial instruments, such as forward currency contracts and interest rate swaps, to hedge its risks associated with currency and interest rate fluctuations. Such derivative financial instruments are stated at fair value. The fair value of forward currency contracts is calculated by reference to current forward exchange rates for contracts with similar maturity profiles.
For the purposes of hedge accounting, hedges are classified as cash flow hedges where they hedge exposure to variability in cash flows that is either attributable to a particular risk associated with a recognised asset or liability or a forecasted transaction. In relation to cash flow hedges (forward foreign currency contracts) to hedge firm commitments that meet the conditions for hedge accounting, the portion of the gain or loss on the hedging instrument that is determined to be an effective hedge is recognised directly in other comprehensive income and the ineffective portion is recognised in the determination of profit and loss for the year.
When the hedged firm commitment results in the recognition of an asset or a liability, then, at the time the asset or liability is recognised, the associated gains or losses that had previously been recognised in other comprehensive income are included in the initial measurement of the acquisition cost, or other carrying amount of the asset or liability.
For all other cash flow hedges, the gains or losses that are recognised in other comprehensive income are transferred to profit and loss in the same year in which the hedged firm commitment affects the net profit and loss, for example when the future sale actually occurs.
For derivatives that do not qualify for hedge accounting, any gains or losses arising from changes in fair value are taken directly to profit and loss.
Hedge accounting is discontinued when the hedging instrument expires or is sold, terminated or exercised, or no longer qualifies for hedge accounting. At that point in time, any cumulative gain or loss on the hedging instrument recognised in other comprehensive income is kept in equity until the forecasted transaction occurs. If a hedged transaction is no longer expected to occur, the net cumulative gain or loss recognised in equity is transferred to profit and loss.
(a) Foreign exchange contracts
At 31 December 2017, Melbourne IT Ltd held no foreign exchange contracts (2016: six foreign exchange contracts) designated as cash flow hedges of expected net USD cash payments which the company has firm commitments. During the year ended 31 December 2016, the terms of these foreign exchange contracts was negotiated to match the terms of the commitments. The exchange contracts were used to reduce the exposure of foreign exchange risk.
2017 2016
$’000 $’000
Foreign exchange contracts (a) - (155)
Interest rate swap (b) 128 151
128 (4)
For
per
sona
l use
onl
y
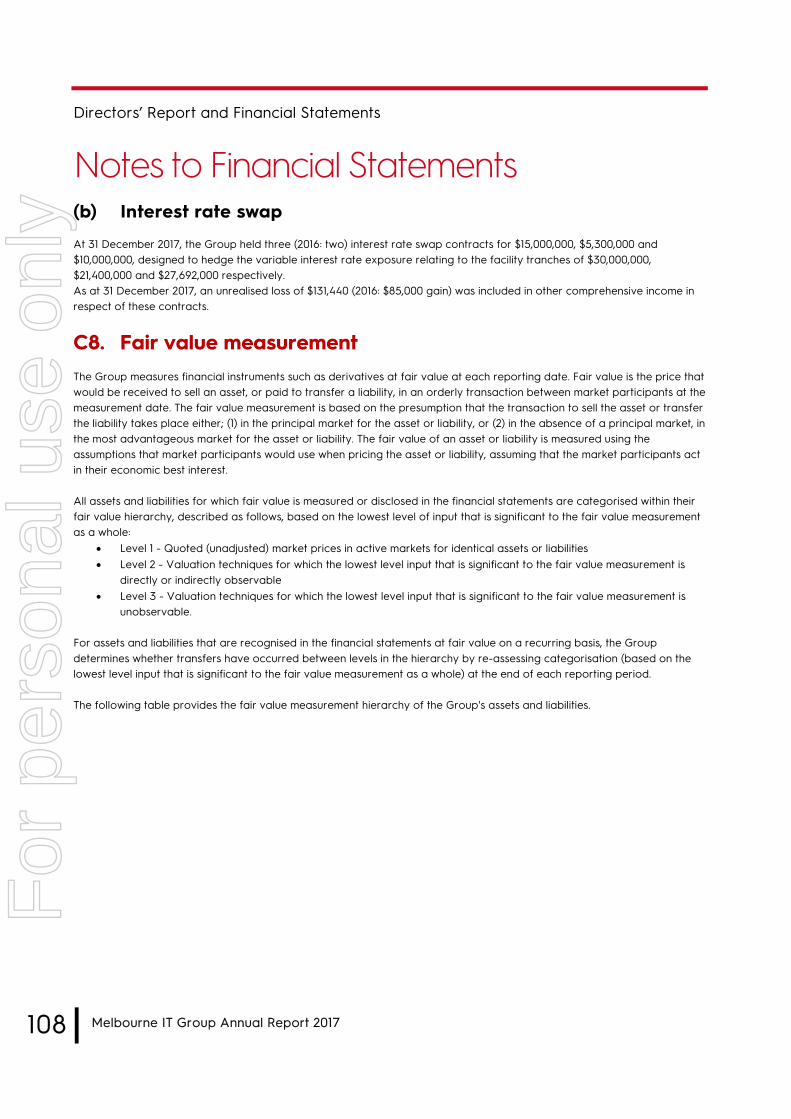
108 l Melbourne IT Group Annual Report 2017
Directors’ Report and Financial Statements
Notes to Financial Statements(b) Interest rate swap
At 31 December 2017, the Group held three (2016: two) interest rate swap contracts for $15,000,000, $5,300,000 and $10,000,000, designed to hedge the variable interest rate exposure relating to the facility tranches of $30,000,000, $21,400,000 and $27,692,000 respectively. As at 31 December 2017, an unrealised loss of $131,440 (2016: $85,000 gain) was included in other comprehensive income in respect of these contracts.
C8. Fair value measurement The Group measures financial instruments such as derivatives at fair value at each reporting date. Fair value is the price that would be received to sell an asset, or paid to transfer a liability, in an orderly transaction between market participants at the measurement date. The fair value measurement is based on the presumption that the transaction to sell the asset or transfer the liability takes place either; (1) in the principal market for the asset or liability, or (2) in the absence of a principal market, in the most advantageous market for the asset or liability. The fair value of an asset or liability is measured using the assumptions that market participants would use when pricing the asset or liability, assuming that the market participants act in their economic best interest.
All assets and liabilities for which fair value is measured or disclosed in the financial statements are categorised within their fair value hierarchy, described as follows, based on the lowest level of input that is significant to the fair value measurement as a whole:
Level 1 - Quoted (unadjusted) market prices in active markets for identical assets or liabilities Level 2 - Valuation techniques for which the lowest level input that is significant to the fair value measurement is
directly or indirectly observable Level 3 - Valuation techniques for which the lowest level input that is significant to the fair value measurement is
unobservable.
For assets and liabilities that are recognised in the financial statements at fair value on a recurring basis, the Group determines whether transfers have occurred between levels in the hierarchy by re-assessing categorisation (based on the lowest level input that is significant to the fair value measurement as a whole) at the end of each reporting period.
The following table provides the fair value measurement hierarchy of the Group's assets and liabilities.
For
per
sona
l use
onl
y
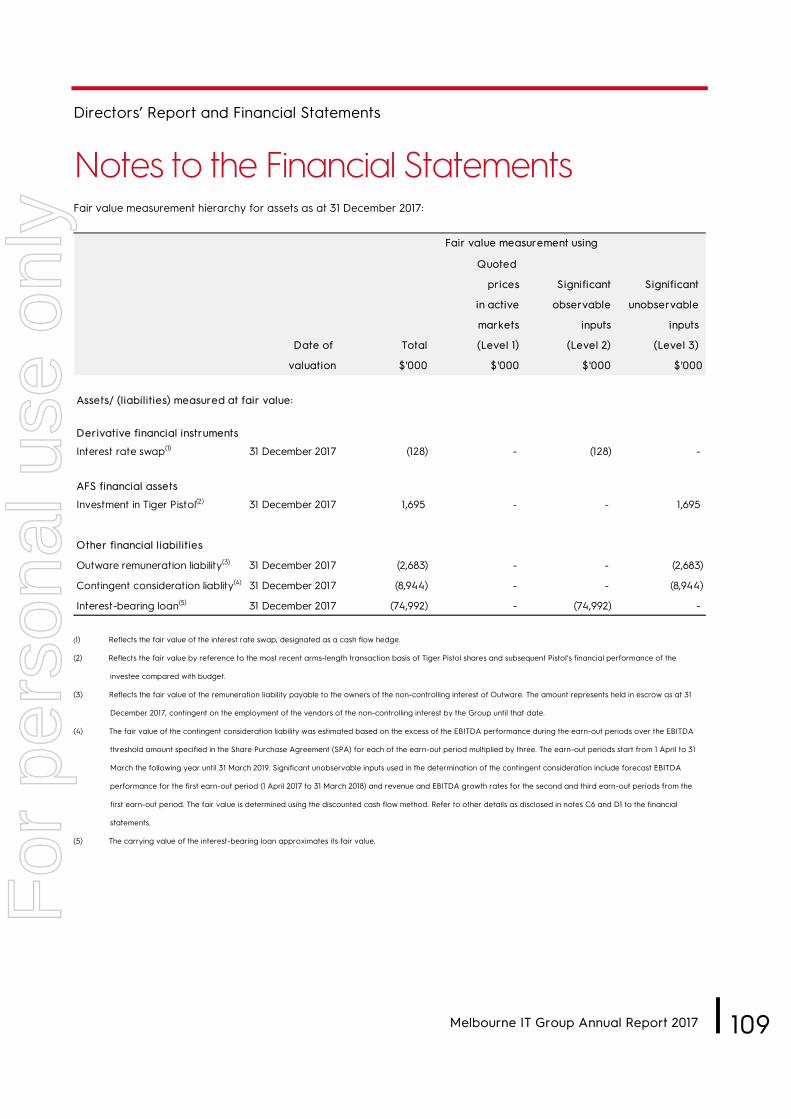
Directors’ Report and Financial Statements
Notes to the Financial Statements
Melbourne IT Group Annual Report 2017 l 109
Fair value measurement hierarchy for assets as at 31 December 2017:
(1) Reflects the fair value of the interest rate swap, designated as a cash flow hedge.
(2) Reflects the fair value by reference to the most recent arms-length transaction basis of Tiger Pistol shares and subsequent Pistol’s financial performance of the
investee compared with budget.
(3) Reflects the fair value of the remuneration liability payable to the owners of the non-controlling interest of Outware. The amount represents held in escrow as at 31
December 2017, contingent on the employment of the vendors of the non-controlling interest by the Group until that date.
(4) The fair value of the contingent consideration liability was estimated based on the excess of the EBITDA performance during the earn-out periods over the EBITDA
threshold amount specified in the Share Purchase Agreement (SPA) for each of the earn-out period multiplied by three. The earn-out periods start from 1 April to 31
March the following year until 31 March 2019. Significant unobservable inputs used in the determination of the contingent consideration include forecast EBITDA
performance for the first earn-out period (1 April 2017 to 31 March 2018) and revenue and EBITDA growth rates for the second and third earn-out periods from the
first earn-out period. The fair value is determined using the discounted cash flow method. Refer to other details as disclosed in notes C6 and D1 to the financial
statements.
(5) The carrying value of the interest-bearing loan approximates its fair value.
Quoted
prices Significant Significant
in active observable unobservable
markets inputs inputs
Date of Total (Level 1) (Level 2) (Level 3)
valuation $'000 $'000 $'000 $'000
Assets/ (liabilities) measured at fair value:
Derivative financial instruments
Interest rate swap(1) 31 December 2017 (128) - (128) -
AFS financial assets
Investment in Tiger Pistol(2) 31 December 2017 1,695 - - 1,695
Other financial liabilities
Outware remuneration liability(3) 31 December 2017 (2,683) - - (2,683)
31 December 2017 (8,944) - - (8,944)
31 December 2017 (74,992) - (74,992) -
Contingent consideration liablity(4)
Fair value measurement using
Interest-bearing loan(5)
For
per
sona
l use
onl
y

110 l Melbourne IT Group Annual Report 2017
Directors’ Report and Financial Statements
Notes to Financial StatementsFair value measurement hierarchy for assets as at 31 December 2016:
There have been no transfers between Level 1 and Level 2 during the period however the investment in Tiger Pistol Pty Ltd was transferred between level 2 and 3 during the period. At 31 December 2016 the fair value was based on a recent market transaction of Tiger Pistol Pty Ltd shares. At 31 December 2017 the fair value was assessed based on the subsequent financial performance of Tiger Pistol Pty Ltd. The significant unobservable inputs used in the fair value measurement included year-on-year growth rate and a comparison of budget to actual.
Quoted
prices Significant Significant
in active observable unobservable
markets inputs inputs
Date of Total (Level 1) (Level 2) (Level 3)
valuation $'000 $'000 $'000 $'000
Assets/ (liabilities) measured at fair value:
Derivative financial instruments
31 December 2016 155 - 155 -
Interest rate swap 31 December 2016 (151) - (151) -
AFS financial assets
Investment in Tiger Pistol 31 December 2016 1,795 - 1,795 -
Other financial liabilities
Put options liability 31 December 2016 (29,828) - - (29,828)
Dividend liability to non-controlling interests 31 December 2016 (1,261) (1,261)
Contingent consideration liability 31 December 2016 (8,315) - - (8,315)
Interest-bearing loan 31 December 2016 (36,500) - (36,500) -
Fair value measurement using
Foreign exchange forward contracts - USD
For
per
sona
l use
onl
y
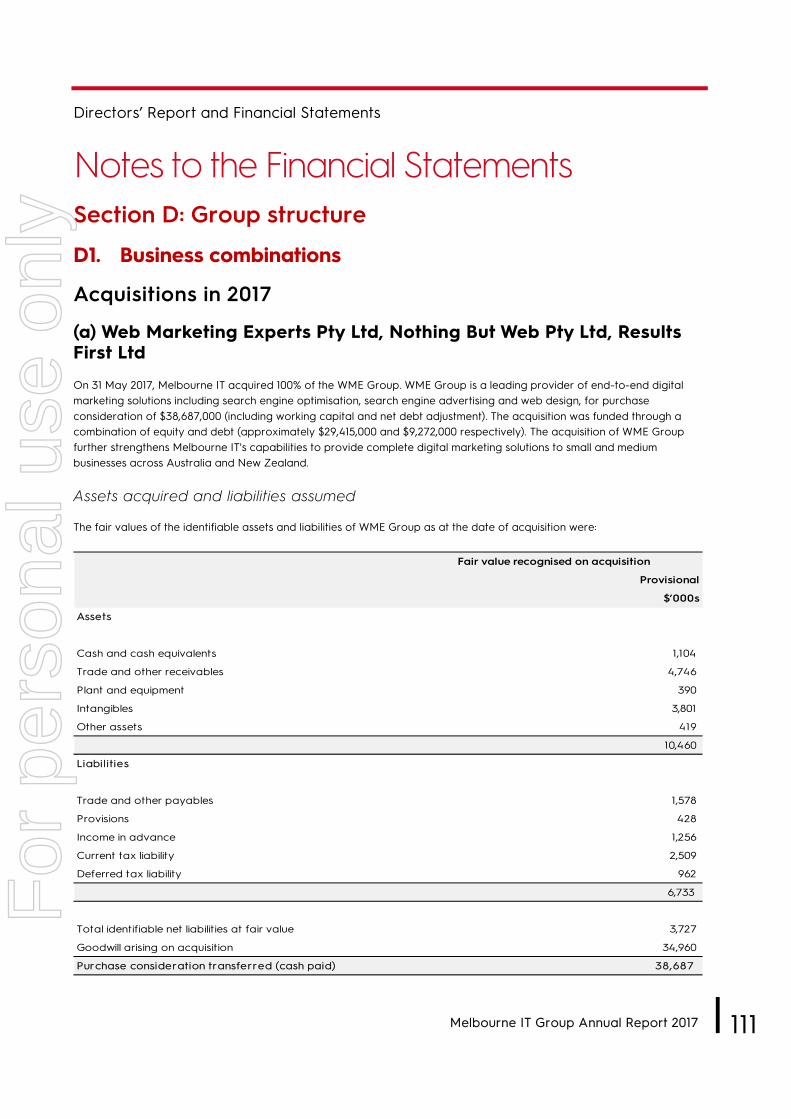
Directors’ Report and Financial Statements
Notes to the Financial Statements
Melbourne IT Group Annual Report 2017 l 111
Section D: Group structure
D1. Business combinations
Acquisitions in 2017
(a) Web Marketing Experts Pty Ltd, Nothing But Web Pty Ltd, ResultsFirst Ltd
On 31 May 2017, Melbourne IT acquired 100% of the WME Group. WME Group is a leading provider of end-to-end digital marketing solutions including search engine optimisation, search engine advertising and web design, for purchase consideration of $38,687,000 (including working capital and net debt adjustment). The acquisition was funded through a combination of equity and debt (approximately $29,415,000 and $9,272,000 respectively). The acquisition of WME Group further strengthens Melbourne IT's capabilities to provide complete digital marketing solutions to small and medium businesses across Australia and New Zealand.
Assets acquired and liabilities assumed
The fair values of the identifiable assets and liabilities of WME Group as at the date of acquisition were:
Provisional
$’000s
Assets
Cash and cash equivalents 1,104
Trade and other receivables 4,746
Plant and equipment 390
Intangibles 3,801
Other assets 419
10,460
Liabilities
Trade and other payables 1,578
Provisions 428
Income in advance 1,256
Current tax liability 2,509
Deferred tax liability 962
6,733
Total identifiable net liabilities at fair value 3,727
Goodwill arising on acquisition 34,960
Purchase consideration transferred (cash paid) 38,687
Fair value recognised on acquisition
For
per
sona
l use
onl
y

112 l Melbourne IT Group Annual Report 2017
Directors’ Report and Financial Statements
Notes to Financial StatementsAs at 31 December 2017, the Group has completed the fair value assessment on the net assets acquired except for current and deferred tax liabilities. There have been no significant changes to the fair value assessment presented in the financial statements since the half year ended 30 June 2017.
From the date of acquisition to 31 December 2017, WME Group contributed $13,473,000 to the revenue and $3,330,000 to the profit after tax attributable to members of the parent. If the combination had taken place at the beginning of the year, Group revenue would have been $207,511,000 and profit after tax attributable to members of the parent would have been $16,008,000.
On 21 August 2017, the net of the working capital adjustment of ($3,734,000) and the net debt adjustment of $5,256,000 has been paid.
On 13 September 2017, contingent consideration of $12,165,000 was paid which has been included in the cash flows from investing activities.
Transaction costs of $794,000 associated with the acquisition WME Group were expensed through the Statement of Comprehensive Income. To fund the acquisition, an equity raise was undertaken of which transaction costs totaling $1,807,000 were incurred and taken directly to equity for the year ended 31 December 2017. This was included in the cash flows from financing activities.
Analysis of cash flows on acquisition
Purchase consideration $’000s
Cash paid 25,000
Working capital adjustment (3,734)
Net debt adjustment 5,256
Contingent consideration liability 12,165
38,687
$’000sPurchase consideration paid 25,000 Net cash acquired (1,104) Working capital adjustment 1,522 Contingent consideration liability 12,165 Funds held in escrow (see note B2) 717 Net cash flow on acquisition (included in cash flows from investing activities) 38,300
For
per
sona
l use
onl
y

Directors’ Report and Financial Statements
Notes to the Financial Statements
Melbourne IT Group Annual Report 2017 l 113
Acquisitions in 2016
(b) InfoReady Pty Ltd
On 31 March 2016, Melbourne IT acquired 100% of InfoReady Pty Ltd (InfoReady), a leading data and analytics provider for the Enterprise Services market, for purchase consideration of $15,332,000 (including working capital adjustment) and three earn-outs based on annual EBITDA performance for the three years from April 2016 to March 2019. The acquisition was funded through cash reserves. The addition of data analytics capability completed the foundation elements of the Enterprise Services strategy and sits alongside cloud, mobile, security and cloud enabled application development. Melbourne IT's expertise now enables it to deliver complete digital solutions for corporate and government organisations.
Assets acquired and liabilities assumed
The fair values of the identifiable assets and liabilities of InfoReady as at the date of acquisition were:
Final
$’000s
Assets
Trade and other receivables 2,088
Plant and equipment 44
Intangibles 847
Deferred tax assets 171
Other assets 85
3,235
Liabilities
Trade and other payables 1,359
Current tax liability -
Deferred tax liabilities 772
2,131
Total identifiable net liabilities at fair value 1,104
Goodwill arising on acquisition 23,565
Purchase consideration transferred (cash paid) 24,669
Fair value recognised on acquisition
For
per
sona
l use
onl
y
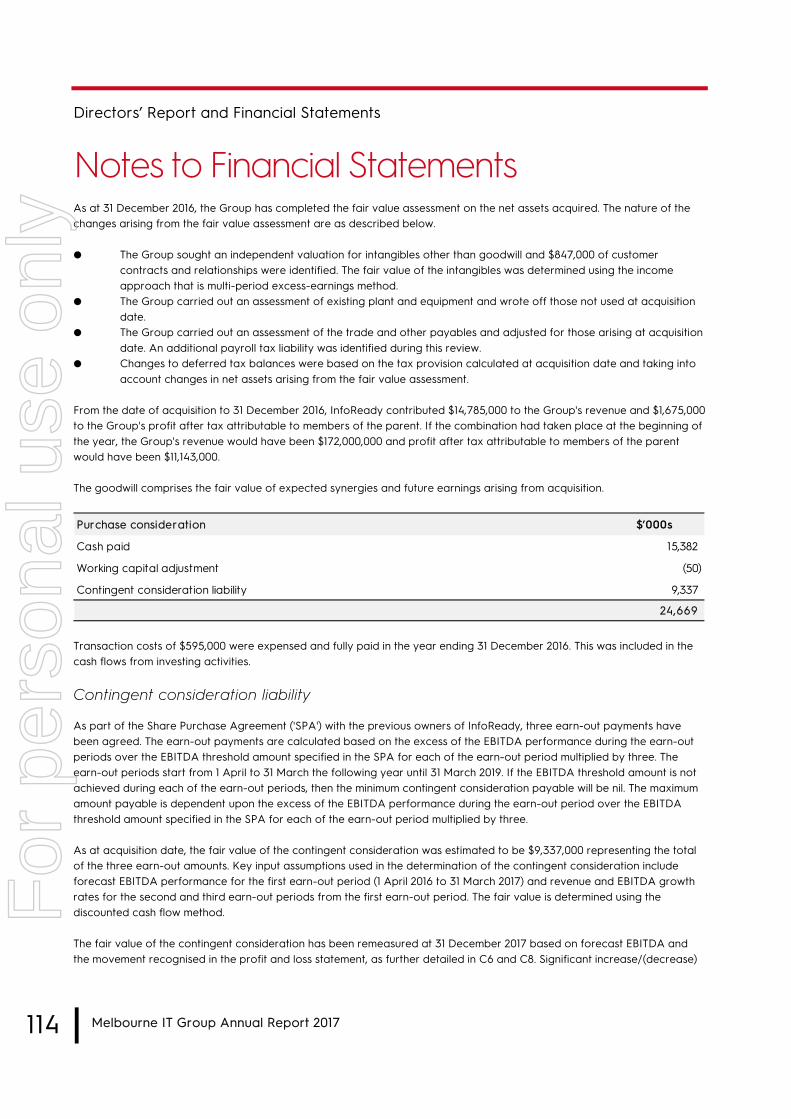
114 l Melbourne IT Group Annual Report 2017
Directors’ Report and Financial Statements
Notes to Financial StatementsAs at 31 December 2016, the Group has completed the fair value assessment on the net assets acquired. The nature of the changes arising from the fair value assessment are as described below.
● The Group sought an independent valuation for intangibles other than goodwill and $847,000 of customercontracts and relationships were identified. The fair value of the intangibles was determined using the incomeapproach that is multi-period excess-earnings method.
● The Group carried out an assessment of existing plant and equipment and wrote off those not used at acquisitiondate.
● The Group carried out an assessment of the trade and other payables and adjusted for those arising at acquisitiondate. An additional payroll tax liability was identified during this review.
● Changes to deferred tax balances were based on the tax provision calculated at acquisition date and taking intoaccount changes in net assets arising from the fair value assessment.
From the date of acquisition to 31 December 2016, InfoReady contributed $14,785,000 to the Group's revenue and $1,675,000 to the Group's profit after tax attributable to members of the parent. If the combination had taken place at the beginning of the year, the Group's revenue would have been $172,000,000 and profit after tax attributable to members of the parent would have been $11,143,000.
The goodwill comprises the fair value of expected synergies and future earnings arising from acquisition.
Transaction costs of $595,000 were expensed and fully paid in the year ending 31 December 2016. This was included in the cash flows from investing activities.
Contingent consideration liability
As part of the Share Purchase Agreement ('SPA') with the previous owners of InfoReady, three earn-out payments have been agreed. The earn-out payments are calculated based on the excess of the EBITDA performance during the earn-out periods over the EBITDA threshold amount specified in the SPA for each of the earn-out period multiplied by three. The earn-out periods start from 1 April to 31 March the following year until 31 March 2019. If the EBITDA threshold amount is not achieved during each of the earn-out periods, then the minimum contingent consideration payable will be nil. The maximum amount payable is dependent upon the excess of the EBITDA performance during the earn-out period over the EBITDA threshold amount specified in the SPA for each of the earn-out period multiplied by three.
As at acquisition date, the fair value of the contingent consideration was estimated to be $9,337,000 representing the total of the three earn-out amounts. Key input assumptions used in the determination of the contingent consideration include forecast EBITDA performance for the first earn-out period (1 April 2016 to 31 March 2017) and revenue and EBITDA growth rates for the second and third earn-out periods from the first earn-out period. The fair value is determined using the discounted cash flow method.
The fair value of the contingent consideration has been remeasured at 31 December 2017 based on forecast EBITDA and the movement recognised in the profit and loss statement, as further detailed in C6 and C8. Significant increase/(decrease)
Purchase consideration $’000s
Cash paid 15,382
Working capital adjustment (50)
Contingent consideration liability 9,337
24,669
For
per
sona
l use
onl
y

Directors’ Report and Financial Statements
Notes to the Financial Statements
Melbourne IT Group Annual Report 2017 l 115
in the EBITDA performance of InfoReady during the earn-out periods would result in higher/(lower) fair value of the contingent consideration liability. This contingent consideration liability is categorised as a Level 3 item of the fair value hierarchy.
During the year ended 31 December 2017, an earn-out payment was made totaling $620,000.
D2. Controlled entities Investments in controlled entities are initially recognised at cost, being the fair value of the consideration given. Following initial recognition, investments are measured at cost less any accumulated impairment losses.
The consolidated financial statements include the financial statements of Melbourne IT Ltd and the subsidiaries in the following table:
(a) Investments in controlled entities are initial capital investments and are eliminated in the consolidated financialstatements.
(b) Investments in foreign entities are revalued to the year-end foreign exchange spot rates.(c) Netregistry Group Limited has a 50% ownership in NetAlliance Pty Ltd.
201 7 201 6 201 7 201 6WebCentral Group Pty Ltd (a) Australia 1 00 1 00 78,1 90 78,1 90 Netregis try Group Limited (a),(c) Australia 1 00 1 00 50,436 50,436 Uber Global Pty Ltd (a) Australia 1 00 1 00 1 4,909 1 4,909 Outware Systems Pty Ltd (a) Australia 1 00 75.1 50,41 4 33,344 InfoReady Pty Ltd (a) Australia 1 00 1 00 1 5,332 1 5,332 Web Marketing Experts Pty Ltd (a) Australia 1 00 - 32,278 - Nothing But Web Pty Ltd (a) Australia 1 00 - 3,834 - Results Firs t Limited (b) New Zealand 1 00 - 2,575 - Domainz Ltd (b) New Zealand 1 00 1 00 1 ,671 1 ,671 Internet Names Worldw ide (US), Inc (b) USA 1 00 1 00 1 1 Melbourne IT GP Holdings Pty Ltd (a) Australia 1 00 1 00 - - Melbourne IT General Partnership (b) USA - 1 00 - 758Advantate Pty Ltd (a) Australia 1 00 1 00 - -
249,640 1 94,641
Nam e Country of Incorporation
Equity Interes t % Cos t of Inves tm ent $'000
For
per
sona
l use
onl
y
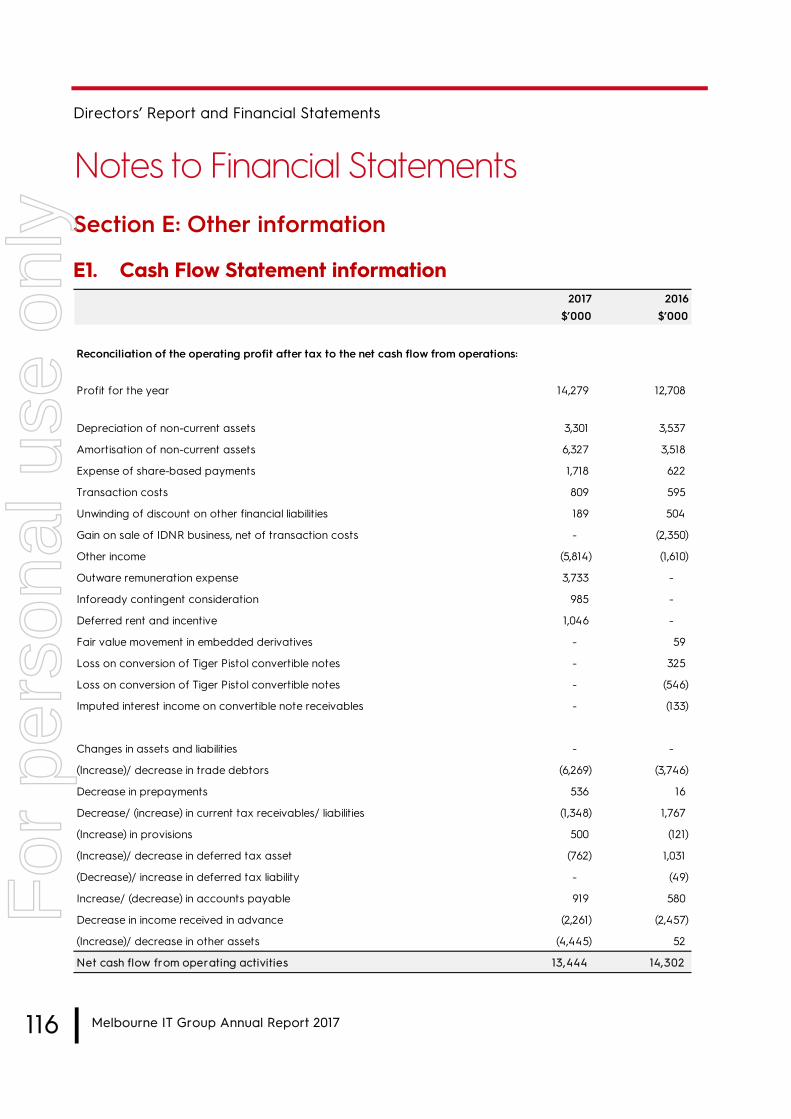
116 l Melbourne IT Group Annual Report 2017
Directors’ Report and Financial Statements
Notes to Financial StatementsSection E: Other information
E1. Cash Flow Statement information 2017 2016
$’000 $’000
Reconciliation of the operating profit after tax to the net cash flow from operations:
Profit for the year 14,279 12,708
Depreciation of non-current assets 3,301 3,537
Amortisation of non-current assets 6,327 3,518
Expense of share-based payments 1,718 622
Transaction costs 809 595
Unwinding of discount on other financial liabilities 189 504
Gain on sale of IDNR business, net of transaction costs - (2,350)
Other income (5,814) (1,610)
Outware remuneration expense 3,733 -
Infoready contingent consideration 985 -
Deferred rent and incentive 1,046 -
Fair value movement in embedded derivatives - 59
Loss on conversion of Tiger Pistol convertible notes - 325
Loss on conversion of Tiger Pistol convertible notes - (546)
Imputed interest income on convertible note receivables - (133)
Changes in assets and liabilities - -
(Increase)/ decrease in trade debtors (6,269) (3,746)
Decrease in prepayments 536 16
Decrease/ (increase) in current tax receivables/ liabilities (1,348) 1,767
(Increase) in provisions 500 (121)
(Increase)/ decrease in deferred tax asset (762) 1,031
(Decrease)/ increase in deferred tax liability - (49)
Increase/ (decrease) in accounts payable 919 580
Decrease in income received in advance (2,261) (2,457)
(Increase)/ decrease in other assets (4,445) 52
Net cash flow from operating activities 13,444 14,302
For
per
sona
l use
onl
y

Directors’ Report and Financial Statements
Notes to the Financial Statements
Melbourne IT Group Annual Report 2017 l 117
Reconciliation of cash and cash equivalents Cash and short-term deposits in the statement of financial position comprise cash at bank and on hand and short-term deposits with an original maturity of three months or less.
For the purposes of the Statement of Cash Flows, cash and cash equivalents comprise the following:
E2. Related party disclosures
Ultimate parent The ultimate Australian Parent entity in the wholly owned Group is Melbourne IT Ltd. During the year various intercompany transactions were undertaken between companies in the wholly owned Group. These transactions were undertaken on a net-margin basis. The effects of these transactions are fully eliminated on consolidation. All intercompany balances, payable and receivable, are on an “arm's length” basis with standard terms and conditions.
Other related party transactions There were no other transactions with related parties during the year ended 31 December 2017, or 2016, other than detailed within the annual report.
E3. Key management personnel (KMP) disclosures For the purposes of this report, the KMP in 2017 are the Martin Mercer - Chief Executive Officer/Managing Director, Peter Findlay – Chief Financial Officer (Resigned 20 January 2017), Stuart Bland - Chief Financial Officer (Appointed 27 March 2017; Resigned 30 September 2017), Fraser Bearsley - Chief Financial Officer (Appointed 1 October 2017), Brett Fenton - Chief Technology Officer, Amy Rixon - Chief Brand, People & Culture Officer, Peter Wright - Managing Director, Enterprise Services and Emma Hunt – Executive General Manager, Small & Medium Business. Directors of the Company are also included in the definition of KMP.
2017 2016$’000 $’000
Cash and cash equivalents on hand 20,250 16,426Closing cash and cash equivalents balances 20,250 16,426
For
per
sona
l use
onl
y
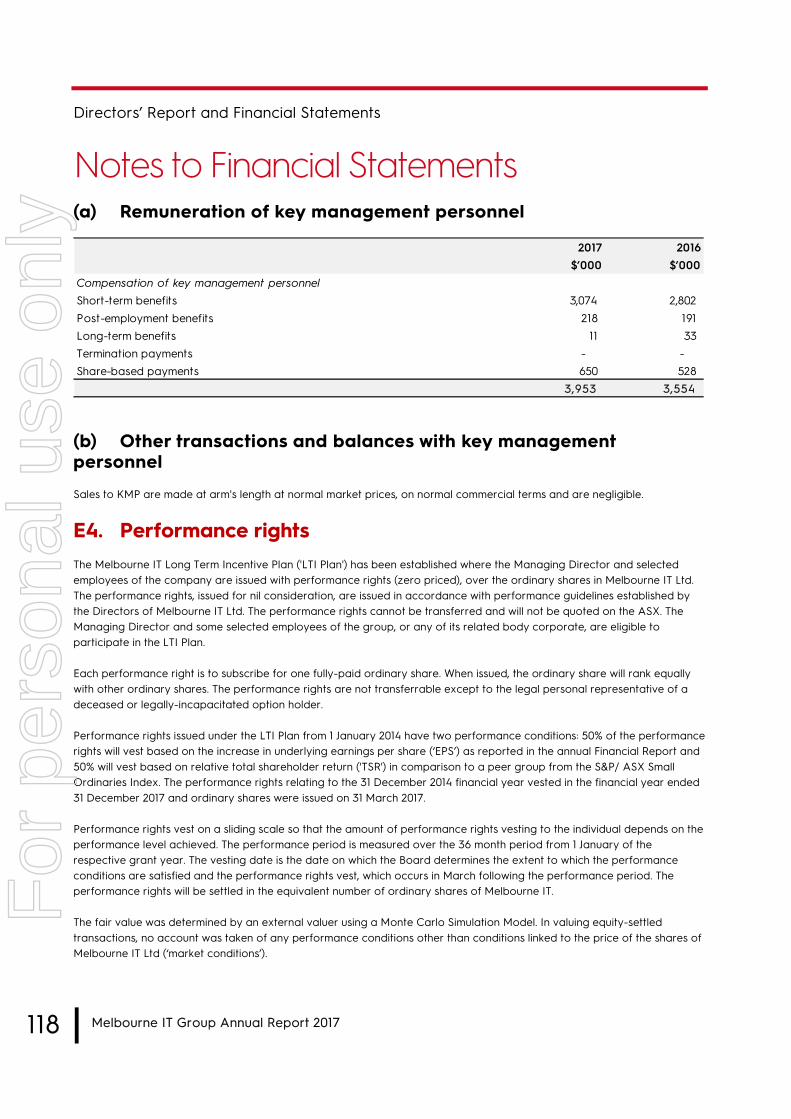
118 l Melbourne IT Group Annual Report 2017
Directors’ Report and Financial Statements
Notes to Financial Statements(a) Remuneration of key management personnel
(b) Other transactions and balances with key managementpersonnel
Sales to KMP are made at arm's length at normal market prices, on normal commercial terms and are negligible.
E4. Performance rights The Melbourne IT Long Term Incentive Plan ('LTI Plan') has been established where the Managing Director and selected employees of the company are issued with performance rights (zero priced), over the ordinary shares in Melbourne IT Ltd. The performance rights, issued for nil consideration, are issued in accordance with performance guidelines established by the Directors of Melbourne IT Ltd. The performance rights cannot be transferred and will not be quoted on the ASX. The Managing Director and some selected employees of the group, or any of its related body corporate, are eligible to participate in the LTI Plan.
Each performance right is to subscribe for one fully-paid ordinary share. When issued, the ordinary share will rank equally with other ordinary shares. The performance rights are not transferrable except to the legal personal representative of a deceased or legally-incapacitated option holder.
Performance rights issued under the LTI Plan from 1 January 2014 have two performance conditions: 50% of the performance rights will vest based on the increase in underlying earnings per share (‘EPS’) as reported in the annual Financial Report and 50% will vest based on relative total shareholder return ('TSR') in comparison to a peer group from the S&P/ ASX Small Ordinaries Index. The performance rights relating to the 31 December 2014 financial year vested in the financial year ended 31 December 2017 and ordinary shares were issued on 31 March 2017.
Performance rights vest on a sliding scale so that the amount of performance rights vesting to the individual depends on the performance level achieved. The performance period is measured over the 36 month period from 1 January of the respective grant year. The vesting date is the date on which the Board determines the extent to which the performance conditions are satisfied and the performance rights vest, which occurs in March following the performance period. The performance rights will be settled in the equivalent number of ordinary shares of Melbourne IT.
The fair value was determined by an external valuer using a Monte Carlo Simulation Model. In valuing equity-settled transactions, no account was taken of any performance conditions other than conditions linked to the price of the shares of Melbourne IT Ltd (‘market conditions’).
2017 2016$’000 $’000
Compensation of key management personnelShort-term benefits 3,074 2,802 Post-employment benefits 218 191 Long-term benefits 11 33 Termination payments - - Share-based payments 650 528
3,953 3,554
For
per
sona
l use
onl
y
Directors’ Report and Financial Statements
Notes to the Financial Statements
Melbourne IT Group Annual Report 2017 l 119
The cost of equity-settled transactions will be recognised together with a corresponding increase in equity over the period in which the performance conditions are fulfilled, ending on the date on which the relevant employees became fully entitled to the award (‘vesting date’).
The cumulative expense recognised for equity-settled transactions at each reporting date until the vesting date reflected: (i) the extent to which the vesting period had expired and (ii) the number of awards that, in the opinion of the directors of Melbourne IT Ltd, would ultimately vest. This opinion was formed based on the best available information at the reporting date.
No expense was recognised for awards that do not ultimately vest, except for awards where vesting was conditional upon a market condition. Where the terms of an equity-settled award were modified, as a minimum an expense, was recognised as if the terms had not been modified. In addition, an expense was recognised for any increase in the value of the transaction as a result of the modification, as measured at the date of modification.
The dilutive effect, if any, of outstanding performance rights was reflected as additional share dilution in the computation of earnings per share.
The Board has adopted certain policies concerning the terms of the performance rights to be granted under the LTI Plan. The Board has the absolute discretion to change these policies at any time, although any change in its policies will have an effect only on performance rights that are issued at or after the time of the change.
Performance rights relating to the year ended 31 December 2017 financial year (hereafter referred to as 2017 Grant) were issued on 29 May 2017 in respect to the performance rights granted to the Chief Executive Officer (CEO) and other eligible employees. The 2017 Grant and the performance rights granted to the CEO were approved by shareholders in the Annual General Meeting on 29 May 2017.
Performance rights relating to the 31 December 2016 financial year (hereafter referred to as 2016 LTI Plan) were issued on 27 May 2016 in respect to the performance rights granted to the Chief Executive Officer (CEO) and other eligible employees. The 2016 LTI Plan and the performance rights granted to the CEO were approved by shareholders in the Annual General Meeting on 27 May 2016.
The expected volatility reflects the assumptions that the historical volatility is indicative of future trends, which may also not necessarily be the actual outcome.
(a) Rights held at the beginning of the reporting periodThere were 1,705,684 rights held as at 1 January 2017 in relation to 2016, 2015 and 2014 LTI Plan.
As at 1 January 2017, no performance rights were exercisable as the vesting date for performance rights under the 2014 LTI Plan vested on 31 March 2017.
For
per
sona
l use
onl
y
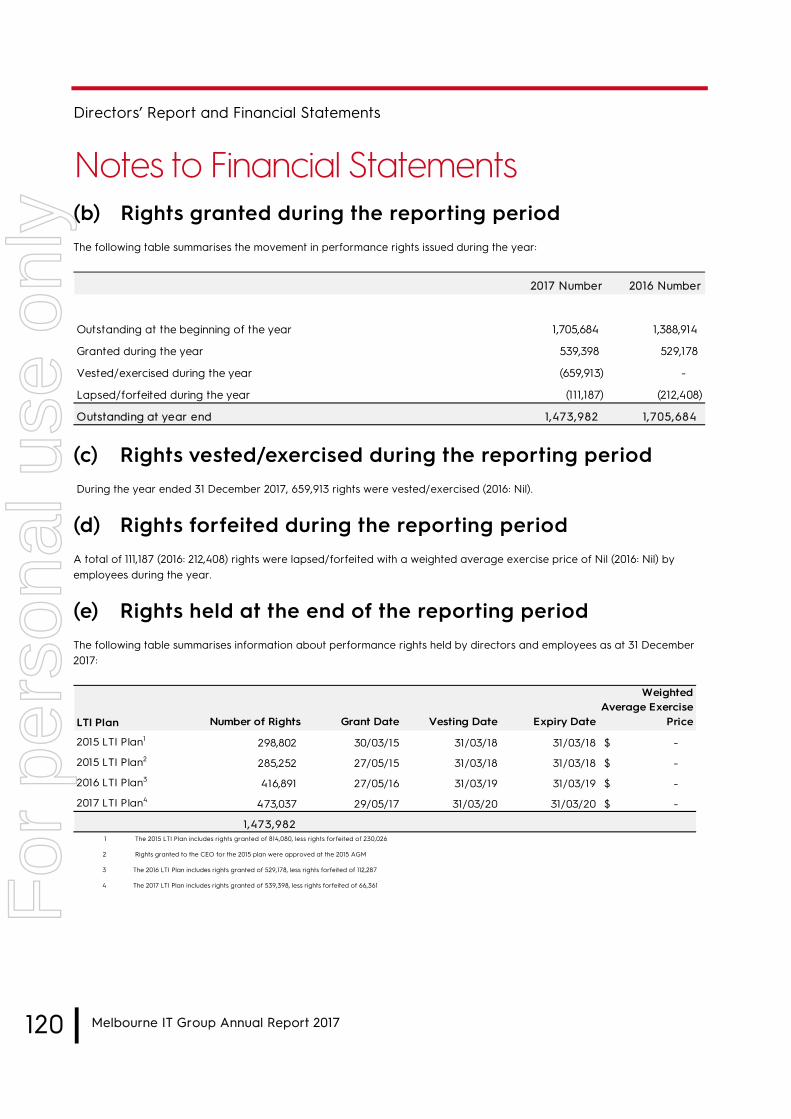
120 l Melbourne IT Group Annual Report 2017
Directors’ Report and Financial Statements
Notes to Financial Statements(b) Rights granted during the reporting periodThe following table summarises the movement in performance rights issued during the year:
(c) Rights vested/exercised during the reporting period During the year ended 31 December 2017, 659,913 rights were vested/exercised (2016: Nil).
(d) Rights forfeited during the reporting periodA total of 111,187 (2016: 212,408) rights were lapsed/forfeited with a weighted average exercise price of Nil (2016: Nil) by employees during the year.
(e) Rights held at the end of the reporting periodThe following table summarises information about performance rights held by directors and employees as at 31 December 2017:
1. The 2015 LTI Plan includes rights granted of 814,080, less rights forfeited of 230,026
2. Rights granted to the CEO for the 2015 plan were approved at the 2015 AGM
3. The 2016 LTI Plan includes rights granted of 529,178, less rights forfeited of 112,287
4. The 2017 LTI Plan includes rights granted of 539,398, less rights forfeited of 66,361
2017 Number 2016 Number
Outstanding at the beginning of the year 1,705,684 1,388,914
Granted during the year 539,398 529,178
Vested/exercised during the year (659,913) -
Lapsed/forfeited during the year (111,187) (212,408)
Outstanding at year end 1,473,982 1,705,684
LTI Plan Number of Rights Grant Date Vesting Date Expiry Date
Weighted Average Exercise
Price
2015 LTI Plan1 298,802 30/03/15 31/03/18 31/03/18 -$
2015 LTI Plan2 285,252 27/05/15 31/03/18 31/03/18 -$
2016 LTI Plan3 416,891 27/05/16 31/03/19 31/03/19 -$
2017 LTI Plan4 473,037 29/05/17 31/03/20 31/03/20 -$
1,473,982
For
per
sona
l use
onl
y
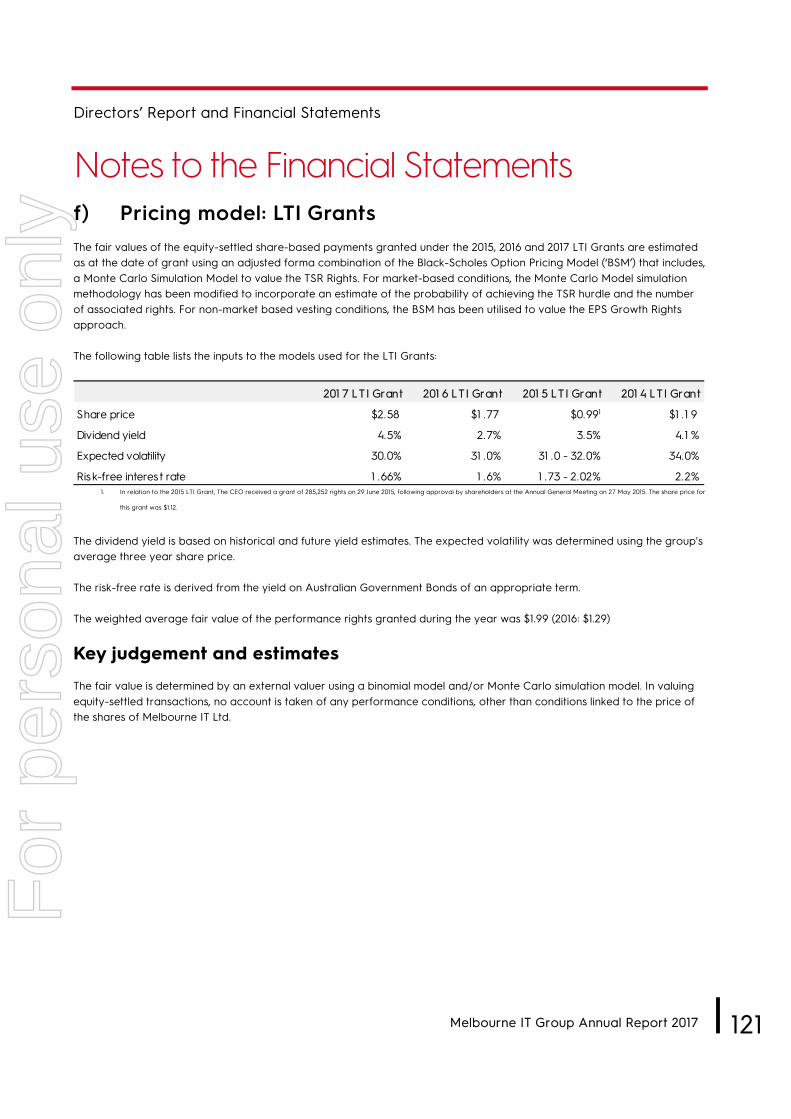
Directors’ Report and Financial Statements
Notes to the Financial Statements
Melbourne IT Group Annual Report 2017 l 121
f) Pricing model: LTI GrantsThe fair values of the equity-settled share-based payments granted under the 2015, 2016 and 2017 LTI Grants are estimated as at the date of grant using an adjusted forma combination of the Black-Scholes Option Pricing Model (‘BSM’) that includes, a Monte Carlo Simulation Model to value the TSR Rights. For market-based conditions, the Monte Carlo Model simulation methodology has been modified to incorporate an estimate of the probability of achieving the TSR hurdle and the number of associated rights. For non-market based vesting conditions, the BSM has been utilised to value the EPS Growth Rights approach.
The following table lists the inputs to the models used for the LTI Grants:
1. In relation to the 2015 LTI Grant, The CEO received a grant of 285,252 rights on 29 June 2015, following approval by shareholders at the Annual General Meeting on 27 May 2015. The share price for
this grant was $1.12.
The dividend yield is based on historical and future yield estimates. The expected volatility was determined using the group's average three year share price.
The risk-free rate is derived from the yield on Australian Government Bonds of an appropriate term.
The weighted average fair value of the performance rights granted during the year was $1.99 (2016: $1.29)
Key judgement and estimates
The fair value is determined by an external valuer using a binomial model and/or Monte Carlo simulation model. In valuing equity-settled transactions, no account is taken of any performance conditions, other than conditions linked to the price of the shares of Melbourne IT Ltd.
201 7 LTI Grant 201 6 LTI Grant 201 5 LTI Grant 201 4 LTI Grant
Share price $2.58 $1 .77 $0.991 $1 .1 9
Dividend yield 4.5% 2.7% 3.5% 4.1 %
Expected volatility 30.0% 31 .0% 31 .0 - 32.0% 34.0%
Risk-free interest rate 1 .66% 1 .6% 1 .73 - 2.02% 2.2%
For
per
sona
l use
onl
y
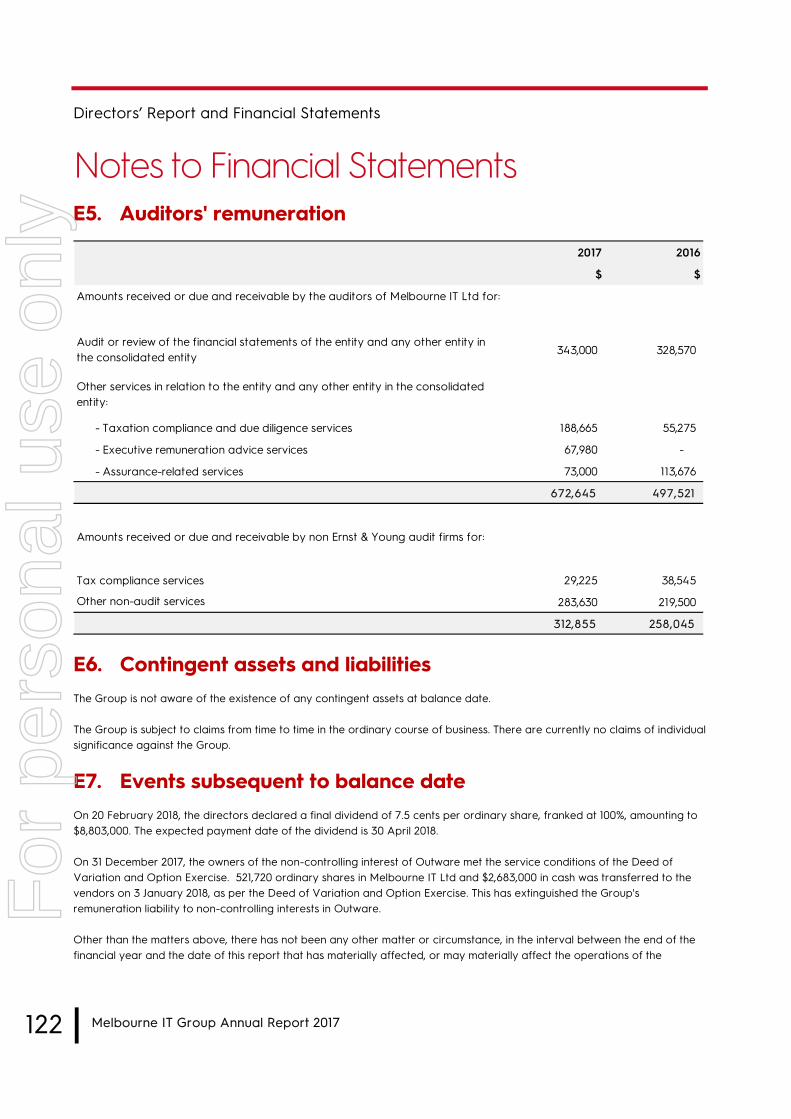
122 l Melbourne IT Group Annual Report 2017
Directors’ Report and Financial Statements
Notes to Financial StatementsE5. Auditors' remuneration
E6. Contingent assets and liabilities The Group is not aware of the existence of any contingent assets at balance date.
The Group is subject to claims from time to time in the ordinary course of business. There are currently no claims of individual significance against the Group.
E7. Events subsequent to balance date On 20 February 2018, the directors declared a final dividend of 7.5 cents per ordinary share, franked at 100%, amounting to $8,803,000. The expected payment date of the dividend is 30 April 2018.
On 31 December 2017, the owners of the non-controlling interest of Outware met the service conditions of the Deed of Variation and Option Exercise. 521,720 ordinary shares in Melbourne IT Ltd and $2,683,000 in cash was transferred to the vendors on 3 January 2018, as per the Deed of Variation and Option Exercise. This has extinguished the Group's remuneration liability to non-controlling interests in Outware.
Other than the matters above, there has not been any other matter or circumstance, in the interval between the end of the financial year and the date of this report that has materially affected, or may materially affect the operations of the
2017 2016
$ $
Amounts received or due and receivable by the auditors of Melbourne IT Ltd for:
343,000 328,570
- Taxation compliance and due diligence services 188,665 55,275
- Executive remuneration advice services 67,980 -
- Assurance-related services 73,000 113,676
672,645 497,521
Amounts received or due and receivable by non Ernst & Young audit firms for:
Tax compliance services 29,225 38,545
283,630 219,500
312,855 258,045
Other non-audit services
Audit or review of the financial statements of the entity and any other entity in the consolidated entity
Other services in relation to the entity and any other entity in the consolidated entity:
For
per
sona
l use
onl
y

Directors’ Report and Financial Statements
Notes to the Financial Statements
Melbourne IT Group Annual Report 2017 l 123
consolidated entity, the results of those operations, or the state of affairs of the consolidated entity in subsequent financial periods.
E8. Information relating to Melbourne IT Ltd (the Parent Entity)
The parent has issued the following guarantee in relation to the debts of its subsidiaries:
Pursuant to Class Order 98/1418, Melbourne IT Ltd, WebCentral Group Pty Ltd, WebCentral Pty Ltd, Netregistry Group Limited and its controlled entities, Uber Global Pty Ltd and its controlled entities, InfoReady Pty Ltd, Outware Systems Pty Ltd, Web Marketing Experts Pty Ltd, Nothing But Web Pty Ltd and Results First Limited have entered into a Deed of Cross Guarantee. The effect of the deed is that Melbourne IT Ltd has guaranteed to pay any deficiency in the event of winding up of any controlled entity, or if they do not meet their obligations under the terms of overdrafts, loans, leases or other liabilities subject to the guarantee. The controlled entities have also given a similar guarantee in the event that Melbourne IT Ltd is wound up ,or if it does not meet its obligations under the terms of overdrafts, loans, leases or other liabilities subject to the guarantee.
201 7 201 6
$’000 $’000
Current assets 1 0,388 9,791
Total assets 259,1 30 21 4,031
Current liabilities 62,040 63,576
Total liabilities 1 42,264 1 1 4,906
Contributed equity 83,507 51 ,026
Treasury shares (1 ,884) -
Options reserve 2,331 1 ,398
Other reserves (21 1 ) 3
Retained earnings 33,1 23 46,698
1 1 6,866 99,1 25
Profit/ (loss) of parent entity (6,708) 2,720
Total comprehensive (loss) of the parent entity (6,790) 2,307
For
per
sona
l use
onl
y
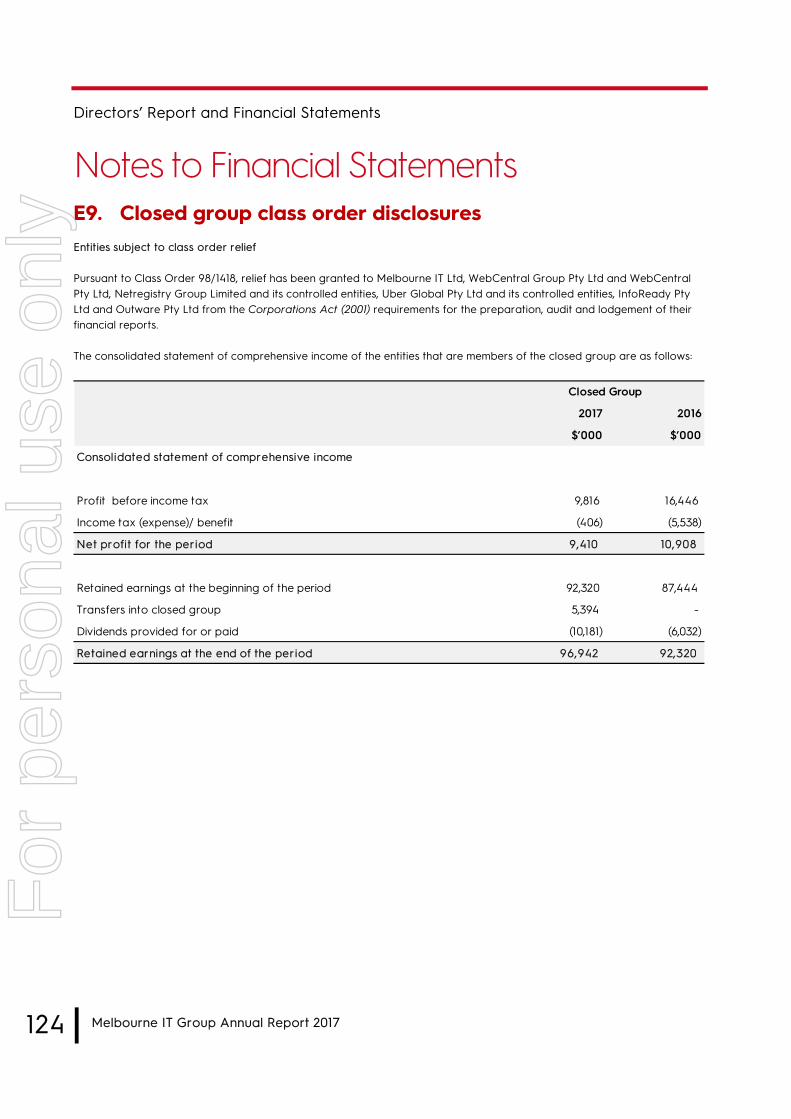
124 l Melbourne IT Group Annual Report 2017
Directors’ Report and Financial Statements
Notes to Financial StatementsE9. Closed group class order disclosures Entities subject to class order relief
Pursuant to Class Order 98/1418, relief has been granted to Melbourne IT Ltd, WebCentral Group Pty Ltd and WebCentral Pty Ltd, Netregistry Group Limited and its controlled entities, Uber Global Pty Ltd and its controlled entities, InfoReady Pty Ltd and Outware Pty Ltd from the Corporations Act (2001) requirements for the preparation, audit and lodgement of their financial reports.
The consolidated statement of comprehensive income of the entities that are members of the closed group are as follows:
2017 2016
$’000 $’000
Consolidated statement of comprehensive income
Profit before income tax 9,816 16,446
Income tax (expense)/ benefit (406) (5,538)
Net profit for the period 9,410 10,908
Retained earnings at the beginning of the period 92,320 87,444
Transfers into closed group 5,394 -
Dividends provided for or paid (10,181) (6,032)
Retained earnings at the end of the period 96,942 92,320
Closed Group
For
per
sona
l use
onl
y

Directors’ Report and Financial Statements
Notes to the Financial Statements
Melbourne IT Group Annual Report 2017 l 125
The consolidated statement of financial position of the entities that are members of the Closed Group are as follows:
2017 2016
$’000 $’000
Consolidated statement of financial position
ASSETS
Current assets
Cash and cash equivalents 9,877 13,762
Trade and other receivables 24,291 22,682
Prepayments of domain name registry charges 6,651 6,509
Current tax receivable 107 -
Derivative financial instruments - 4
Other assets 10,955 3,340
Total current assets 51,881 46,297
Non-current assets
Property, plant and equipment 5,655 6,386
Intangible assets 261,576 152,587
Deferred tax assets 4,882 3,932
Prepayments of domain name registry charges 2,656 2,964
Non-current financial assets 1,695 1,795
Other assets 250 32,433
Total non-current assets 276,714 200,097
TOTAL ASSETS 328,595 246,394
Closed Group
For
per
sona
l use
onl
y
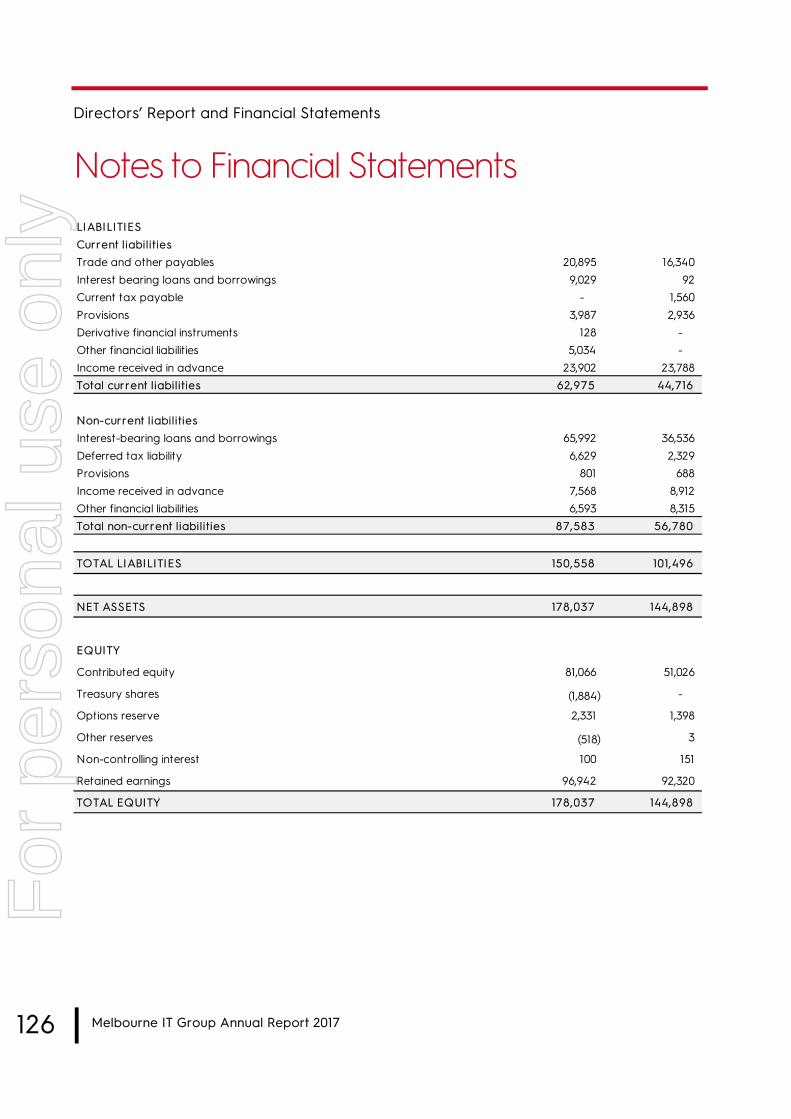
Directors’ Report and Financial Statements
Notes to Financial Statements
126 l Melbourne IT Group Annual Report 2017
LIABILITIESCurrent liabilitiesTrade and other payables 20,895 16,340 Interest bearing loans and borrowings 9,029 92 Current tax payable - 1,560 Provisions 3,987 2,936Derivative financial instruments 128 - Other financial liabilities 5,034 - Income received in advance 23,902 23,788 Total current liabilities 62,975 44,716
Non-current liabilitiesInterest-bearing loans and borrowings 65,992 36,536 Deferred tax liability 6,629 2,329 Provisions 801 688 Income received in advance 7,568 8,912 Other financial liabilities 6,593 8,315 Total non-current liabilities 87,583 56,780
TOTAL LIABILITIES 150,558 101,496
NET ASSETS 178,037 144,898
EQUITY
Contributed equity 81,066 51,026
Treasury shares (1,884) -
Options reserve 2,331 1,398
Other reserves (518) 3
Non-controlling interest 100 151
Retained earnings 96,942 92,320
TOTAL EQUITY 178,037 144,898
For
per
sona
l use
onl
y
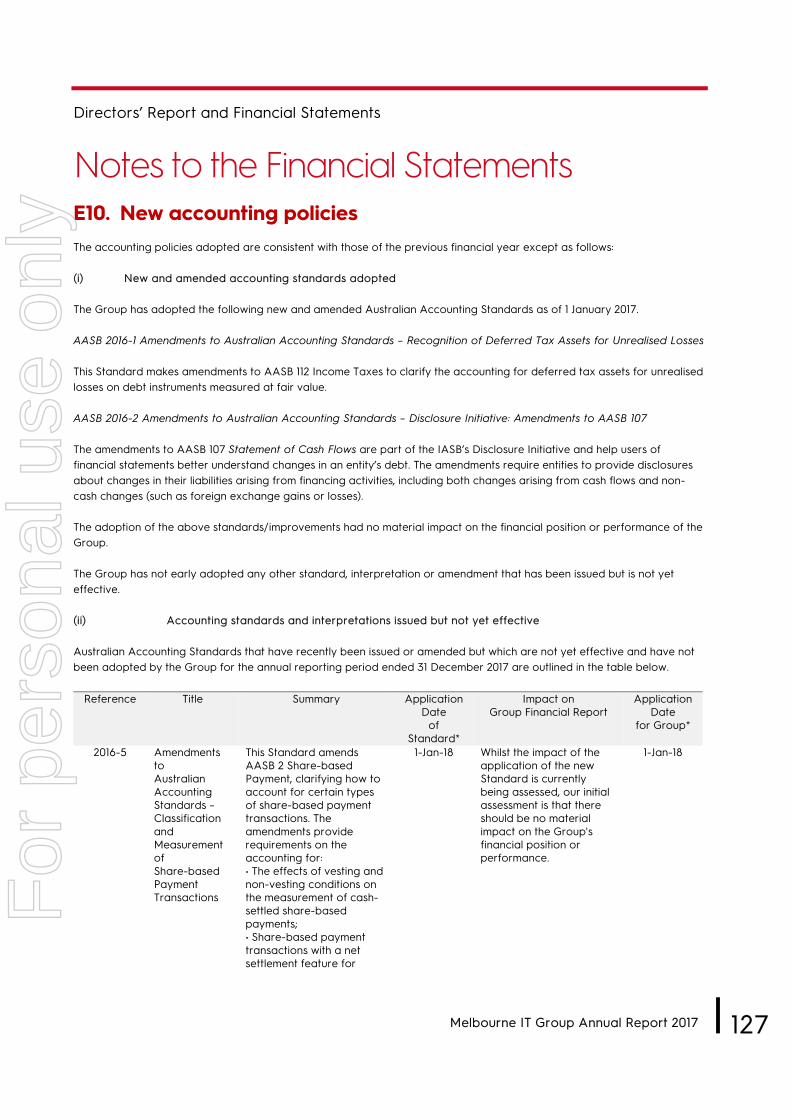
Directors’ Report and Financial Statements
Notes to the Financial Statements
Melbourne IT Group Annual Report 2017 l 127
E10. New accounting policies The accounting policies adopted are consistent with those of the previous financial year except as follows:
(i) New and amended accounting standards adopted
The Group has adopted the following new and amended Australian Accounting Standards as of 1 January 2017.
AASB 2016-1 Amendments to Australian Accounting Standards – Recognition of Deferred Tax Assets for Unrealised Losses
This Standard makes amendments to AASB 112 Income Taxes to clarify the accounting for deferred tax assets for unrealised losses on debt instruments measured at fair value.
AASB 2016-2 Amendments to Australian Accounting Standards – Disclosure Initiative: Amendments to AASB 107
The amendments to AASB 107 Statement of Cash Flows are part of the IASB’s Disclosure Initiative and help users of financial statements better understand changes in an entity’s debt. The amendments require entities to provide disclosures about changes in their liabilities arising from financing activities, including both changes arising from cash flows and non-cash changes (such as foreign exchange gains or losses).
The adoption of the above standards/improvements had no material impact on the financial position or performance of the Group.
The Group has not early adopted any other standard, interpretation or amendment that has been issued but is not yet effective.
(ii) Accounting standards and interpretations issued but not yet effective
Australian Accounting Standards that have recently been issued or amended but which are not yet effective and have not been adopted by the Group for the annual reporting period ended 31 December 2017 are outlined in the table below.
Reference Title Summary Application Date
of Standard*
Impact on Group Financial Report
Application Date
for Group*
2016-5 Amendments to Australian Accounting Standards –Classification and Measurement of Share-based Payment Transactions
This Standard amends AASB 2 Share-based Payment, clarifying how to account for certain types of share-based payment transactions. The amendments provide requirements on the accounting for: • The effects of vesting andnon-vesting conditions onthe measurement of cash-settled share-basedpayments;• Share-based paymenttransactions with a netsettlement feature for
1-Jan-18 Whilst the impact of the application of the new Standard is currently being assessed, our initial assessment is that there should be no material impact on the Group's financial position or performance.
1-Jan-18
For
per
sona
l use
onl
y

Directors’ Report and Financial Statements
Notes to Financial Statements
128 l Melbourne IT Group Annual Report 2017
Reference Title Summary Application Date
of Standard*
Impact on Group Financial Report
Application Date
for Group*
withholding tax obligations; and • A modification to theterms and conditions of ashare-based payment thatchanges the classificationof the transaction fromcash-settled to equity-settled.
AASB 15 Revenue from Contracts with Customers
AASB 15 replaces all existing revenue requirements in Australian Accounting Standards (AASB 111 Construction Contracts, AASB 118 Revenue, AASB Interpretation 13 Customer Loyalty Programmes, AASB Interpretation 15 Agreements for the Construction of Real Estate, AASB Interpretation 18 Transfers of Assets from Customers and AASB Interpretation 131 Revenue – Barter TransactionsInvolving Advertising Services) and applies to all revenue arising from contracts with customers, unless the contracts are in the scope of other standards, such as AASB117 Leases (or AASB 16 Leases, once applied).
The core principle of AASB 15 is that an entity recognises revenue to depict the transfer of promised goods or services to customers in an amount that reflects the consideration to which an entity expects to be entitled in exchange for those goods or services. An entity recognises revenue in accordance with the core principle by applying the following steps:
1-Jan-18 The impact of the application of the new Standard is currently being assessed.
Overview of assessment activities The Group has formed a working group to assess the impact resulting from the application of the new standard from 1 January 2018, including prior year comparative disclosures. The working group has provided periodic updates to management, the audit and risk management committee and the Group's auditors.
The working group has identified the following main categories by segment:
SMB Solutions • Domain names• Hosting (email and web)• Online marketing• Website builds
Enterprise Services • Data & analyticsprofessional services• Data & analyticssoftware• Cloud professional andmanaged services• Mobile applicationdevelopment
The working group has reviewed a statistically
1-Jan-18
For
per
sona
l use
onl
y
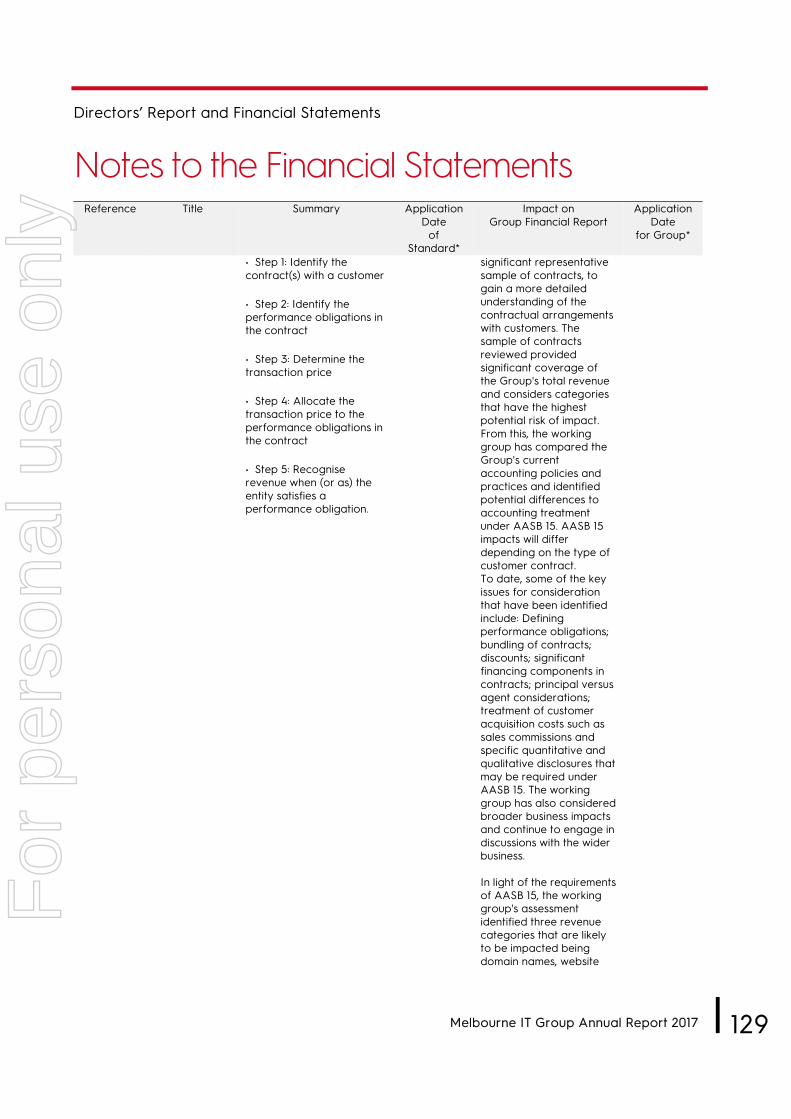
Directors’ Report and Financial Statements
Notes to the Financial Statements
Melbourne IT Group Annual Report 2017 l 129
Reference Title Summary Application Date
of Standard*
Impact on Group Financial Report
Application Date
for Group*
• Step 1: Identify thecontract(s) with a customer
• Step 2: Identify theperformance obligations inthe contract
• Step 3: Determine thetransaction price
• Step 4: Allocate thetransaction price to theperformance obligations inthe contract
• Step 5: Recogniserevenue when (or as) theentity satisfies aperformance obligation.
significant representative sample of contracts, to gain a more detailed understanding of the contractual arrangements with customers. The sample of contracts reviewed provided significant coverage of the Group's total revenue and considers categories that have the highest potential risk of impact. From this, the working group has compared the Group's current accounting policies and practices and identified potential differences to accounting treatment under AASB 15. AASB 15 impacts will differ depending on the type of customer contract. To date, some of the key issues for consideration that have been identified include: Defining performance obligations; bundling of contracts; discounts; significant financing components in contracts; principal versus agent considerations; treatment of customer acquisition costs such as sales commissions and specific quantitative and qualitative disclosures that may be required under AASB 15. The working group has also considered broader business impacts and continue to engage in discussions with the wider business.
In light of the requirements of AASB 15, the working group's assessment identified three revenue categories that are likely to be impacted being domain names, website
For
per
sona
l use
onl
y
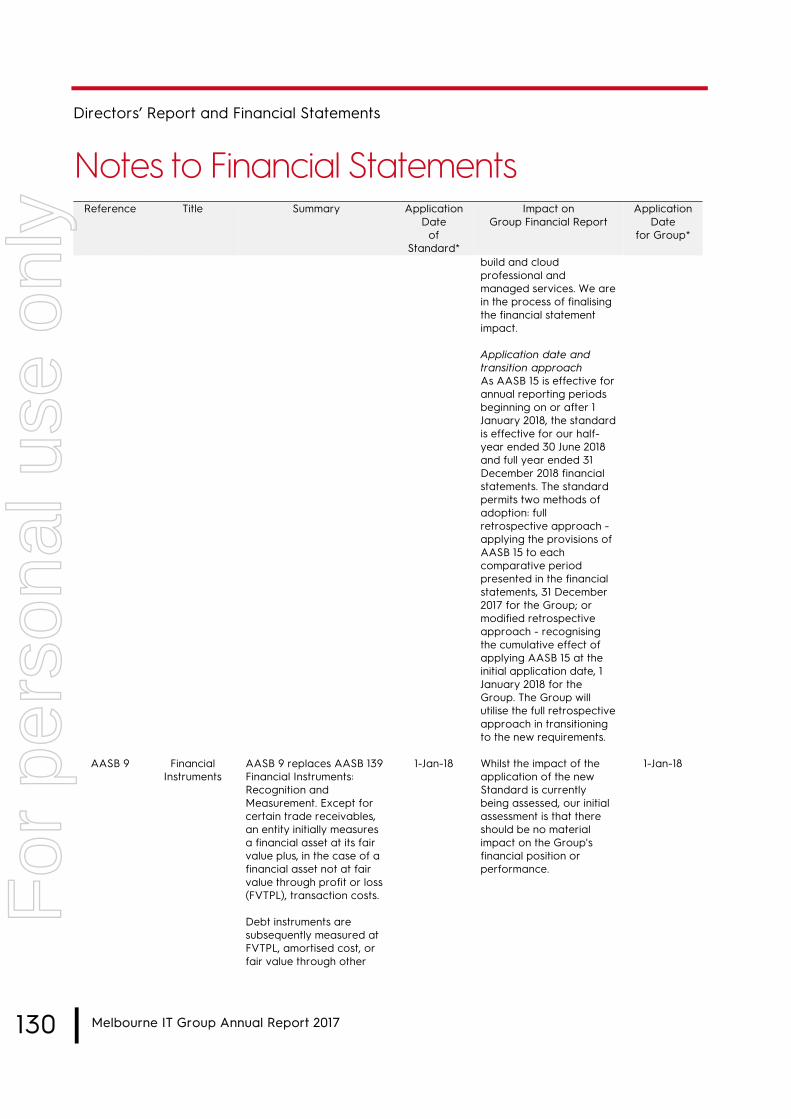
Directors’ Report and Financial Statements
Notes to Financial Statements
130 l Melbourne IT Group Annual Report 2017
Reference Title Summary Application Date
of Standard*
Impact on Group Financial Report
Application Date
for Group*
build and cloud professional and managed services. We are in the process of finalising the financial statement impact.
Application date and transition approach As AASB 15 is effective for annual reporting periods beginning on or after 1 January 2018, the standard is effective for our half-year ended 30 June 2018 and full year ended 31 December 2018 financial statements. The standard permits two methods of adoption: full retrospective approach - applying the provisions of AASB 15 to each comparative period presented in the financial statements, 31 December 2017 for the Group; or modified retrospective approach - recognising the cumulative effect of applying AASB 15 at the initial application date, 1 January 2018 for the Group. The Group will utilise the full retrospective approach in transitioning to the new requirements.
AASB 9 Financial Instruments
AASB 9 replaces AASB 139 Financial Instruments: Recognition and Measurement. Except for certain trade receivables, an entity initially measures a financial asset at its fair value plus, in the case of a financial asset not at fair value through profit or loss (FVTPL), transaction costs.
Debt instruments are subsequently measured at FVTPL, amortised cost, or fair value through other
1-Jan-18 Whilst the impact of the application of the new Standard is currently being assessed, our initial assessment is that there should be no material impact on the Group's financial position or performance.
1-Jan-18
For
per
sona
l use
onl
y
Directors’ Report and Financial Statements
Notes to the Financial Statements
Melbourne IT Group Annual Report 2017 l 131
Reference Title Summary Application Date
of Standard*
Impact on Group Financial Report
Application Date
for Group*
comprehensive income (FVOCI), on the basis of their contractual cash flows and the business model under which the debt instruments are held. There is a fair value option (FVO) that allows financial assets on initial recognition to be designated as FVTPL if that eliminates or significantly reduces an accounting mismatch.
Equity instruments are generally measured at FVTPL. However, entities have an irrevocable option on an instrument-by-instrument basis to present changes in the fair value of non-trading instruments in other comprehensive income (OCI) without subsequent reclassification to profit or loss.
For financial liabilities designated as FVTPL using the FVO, the amount of change in the fair value of such financial liabilities that is attributable to changes in credit risk must be presented in OCI. The remainder of the change in fair value is presented in profit or loss, unless presentation in OCI of the fair value change in respect of the liability’s credit risk would create or enlarge an accounting mismatch in profit or loss.
All other AASB 139 classification and measurement requirements for financial liabilities have been carried forward into AASB9, including the embedded derivative separation rules and the criteria for using the FVO.
For
per
sona
l use
onl
y

Directors’ Report and Financial Statements
Notes to Financial Statements
132 l Melbourne IT Group Annual Report 2017
Reference Title Summary Application Date
of Standard*
Impact on Group Financial Report
Application Date
for Group*
The incurred credit loss model in AASB 139 has been replaced with an expected credit loss model in AASB 9.
The requirements for hedge accounting have been amended to more closely align hedge accounting with risk management, establish a more principle-based approach to hedge accounting and address inconsistencies in the hedge accounting model in AASB 139.
AASB 16 Leases AASB 16 requires lessees to account for all leases under a single on balance sheet model in a similar way to finance leases under AASB 117 Leases. The standard includes two recognition exemptions for lessees – leases of ’low-value’ assets (e.g. personal computers) and short-term leases (i.e. leases with a lease term of 12 months or less).
At the commencement date of a lease, a lessee will recognise a liability to make lease payments (i.e., the lease liability) and an asset representing the right to use the underlying asset during the lease term (i.e. the right-of-use asset). Lessees will be required to separately recognise the interest expense on the lease liability and the depreciation expense on the right-of-use asset. Lessees will be required to remeasure the lease liability upon the occurrence of certain events (e.g. a change in the lease term, a change in future lease
1-Jan-19 The impact of the application of the new standard is currently being assessed.
1-Jan-19
For
per
sona
l use
onl
y
Directors’ Report and Financial Statements
Notes to the Financial Statements
Melbourne IT Group Annual Report 2017 l 133
Reference Title Summary Application Date
of Standard*
Impact on Group Financial Report
Application Date
for Group*
payments resulting from a change in an index or rate used to determine those payments). The lessee will generally recognise the amount of the remeasurement of the lease liability as an adjustment to the right-of-use asset.
Lessor accounting is substantially unchanged from today’s accounting under AASB 117. Lessors will continue to classify all leases using the same classification principles in AASB 117 and distinguish between two types of leases: operating and finance leases.
* Application date is for the reporting periods beginning on or after the date shown in the above table.
For
per
sona
l use
onl
y

A member firm of Ernst & Young Global LimitedLiability limited by a scheme approved under Professional Standards Legislation
Ernst & Young8 Exhibition StreetMelbourne VIC 3000 AustraliaGPO Box 67 Melbourne VIC 3001
Tel: +61 3 9288 8000Fax: +61 3 8650 7777ey.com/au
IT Group Annual Report 2017134 l Melbourne
For
per
sona
l use
onl
y
A member firm of Ernst & Young Global LimitedLiability limited by a scheme approved under Professional Standards Legislation
Melbourne IT Group Annual Report 2017 l 135
For
per
sona
l use
onl
y

A member firm of Ernst & Young Global LimitedLiability limited by a scheme approved under Professional Standards Legislation
IT Group Annual Report 2017136 l Melbourne
For
per
sona
l use
onl
y

A member firm of Ernst & Young Global LimitedLiability limited by a scheme approved under Professional Standards LegislationA member firm of Ernst & Young Global LimitedLiability limited by a scheme approved under Professional Standards Legislation
Melbourne IT Group Annual Report 2017 l 137
For
per
sona
l use
onl
y
A member firm of Ernst & Young Global LimitedLiability limited by a scheme approved under Professional Standards Legislation
l Melbourne IT Group Annual Report 2017138
For
per
sona
l use
onl
y

EY Building a better working world
Ernst & Young 8 Exhibition Street Melbourne VIC 3000 Australia GPO Box 67 Melbourne VIC 3001
Tel: +61 3 9288 8000 Fax: +61 3 8650 7777 ey.com/au
Auditor's Independence Declaration to the Directors of Melbourne IT
Limited
As lead auditor for the audit of Melbourne IT Limited for the financial year ended 31 December 2017, I declare to the best of my knowledge and belief, there have been:
a) no contraventions of the auditor independence requirements of the Corporations Act 2001 in
relation to the audit; and
b) no contraventions of any applicable code of professional conduct in relation to the audit.
This declaration is in respect of Melbourne IT Limited and the entities it controlled during the financial year.
Ernst & Young
David Petersen Partner 28 March 2018
A member firm of Ernst & Young Global Limited
Liability limited by a scheme approved under Professional Standards Legislation
Melbourne IT Group Annual Report 2017 l 139
For
per
sona
l use
onl
y

140 l Melbourne IT Group Annual Report 2017
Additional information required by the Australian Stock Exchange Ltd Listing Rules and not shown elsewhere in this report is as follows. The following information was current as at 21 March 2018.
Distribution schedule of the equity security holders Full details of the directors' experience, expertise and directorships can be found on the Melbourne IT website at www.melbourneit.info and this Annual Report.
The distribution schedule of the number of holders in each class of equity securities are as follows:
Range Ordinary Share Holders
Performance Rights Holders
100,001 and over 62 4
50,001 to 100,000 60 4
10,001 to 50,000 772 -
5,001 to 10,000 938 -
1,001 to 5,000 2,804 -
1 to 1,000 2,158 -
Total number of equity security holders 6,794 8
As at the close of trading on 21 March 2018, the company's share price was $3.30. Based on this closing price, there were 264 shareholders holding less than a marketable parcel of 152 ordinary shares.
The 20 largest security holders The names of the 20 largest holders of quoted equity securities, and the number of equity securities and percentage of capital each holds, are listed below.
Rank Name of Registered Security Holder Number of
Ordinary Shares held
Percentage of Issued
Ordinary Shares 1 HSBC CUSTODY NOMINEES (AUSTRALIA) LIMITED 32,433,877 27.63 2 J P MORGAN NOMINEES AUSTRALIA LIMITED 14,918,377 12.71 3 CORPSAND PTY LTD <THE IMPULSE A/C> 5,708,363 4.86 4 NATIONAL NOMINEES LIMITED 4,581,637 3.90 5 CITICORP NOMINEES PTY LIMITED 4,298,462 3.66
6 BNP PARIBAS NOMINEES PTY LTD <AGENCY LENDING DRP A/C>
3,857,390 3.29
7 CORPSAND PTY LTD <THE IMPULSE A/C> 2,350,000 2.00 8 BNP PARIBAS NOMS PTY LTD <DRP> 1,282,231 1.09 9 KTAP PTY LTD 1,028,807 0.88 10 AUST EXECUTOR TRUSTEES LTD <HENROTH PTY LIMITED> 863,504 0.74
ASX Additional Information
ASX Additional Information
For
per
sona
l use
onl
y

ASX Additional Information
ASX Additional Information
Melbourne IT Group Annual Report 2017 l 141
Rank Name of Registered Security Holder Number of
Ordinary Shares held
Percentage of Issued
Ordinary Shares
11 MOUNT IDA HOLDINGS PTY LTD <STEWART SUPER FUND A/C>
604,045 0.51
12 NEWECONOMY COM AU NOMINEES PTY LIMITED <900 ACCOUNT>
583,297 0.50
13 SANDHURST TRUSTEES LTD <ENDEAVOR ASSET MGMT MDA A/C>
514,955 0.44
14 CORPSAND PTY LTD <THE IMPULSE A/C> 500,000 0.43 15 NATIONAL NOMINEES LIMITED <DB A/C> 439,983 0.37 16 YORK INVESTMENTS LIMITED 407,236 0.35
17 PACIFIC CUSTODIANS PTY LIMITED MELBOURNE IT PLANS CTRL
344,537 0.29
18 QUERION PTY LTD 326,920 0.28
19 CS THIRD NOMINEES PTY LIMITED <HSBC CUST NOM AU LTD 13 A/C>
320,209 0.27
20 PRINCIPAL FUNDS MANAGEMENT CO PTY LTD <PRINCIPAL GROWTH A/C>
301,250 0.26
Sub-Total 75,665,080 64.47Balance of register 41,703,908 35.53
Total 117,368,988 100.00
Unquoted equity securities As at 21 March 2018, there were 1,473,982 unlisted performance rights over unissued ordinary shares in the company, granted to eight holders.
Voting rights The voting rights attaching to each class of equity securities are as follows: (a) Ordinary shares - All ordinary shares carry one vote per share without restriction.(b) Performance rights - Performance rights do not carry any voting rights.
Substantial holders The names of substantial holders in the company and the number of securities to which each substantial holder and their associates have a relevant interest are listed below. The following information is extracted from the substantial holder notices received by the company as at 5 February 2018.
Name Number of Ordinary Shares held
Percentage of Issued
Ordinary Shares
Cadence Asset Management Entities 20,970,533 17.87%
BlackRock Group 9,961,709 8.49%
Mr Larry Bloch 9,208,363 7.85%
For
per
sona
l use
onl
y

142 l Melbourne IT Group Annual Report 2017
On-market buyback As at the date of this report, there is no on-market share buyback.
ASX Additional Information
ASX Additional Information
For
per
sona
l use
onl
y

NOTES
For
per
sona
l use
onl
y

For
per
sona
l use
onl
y
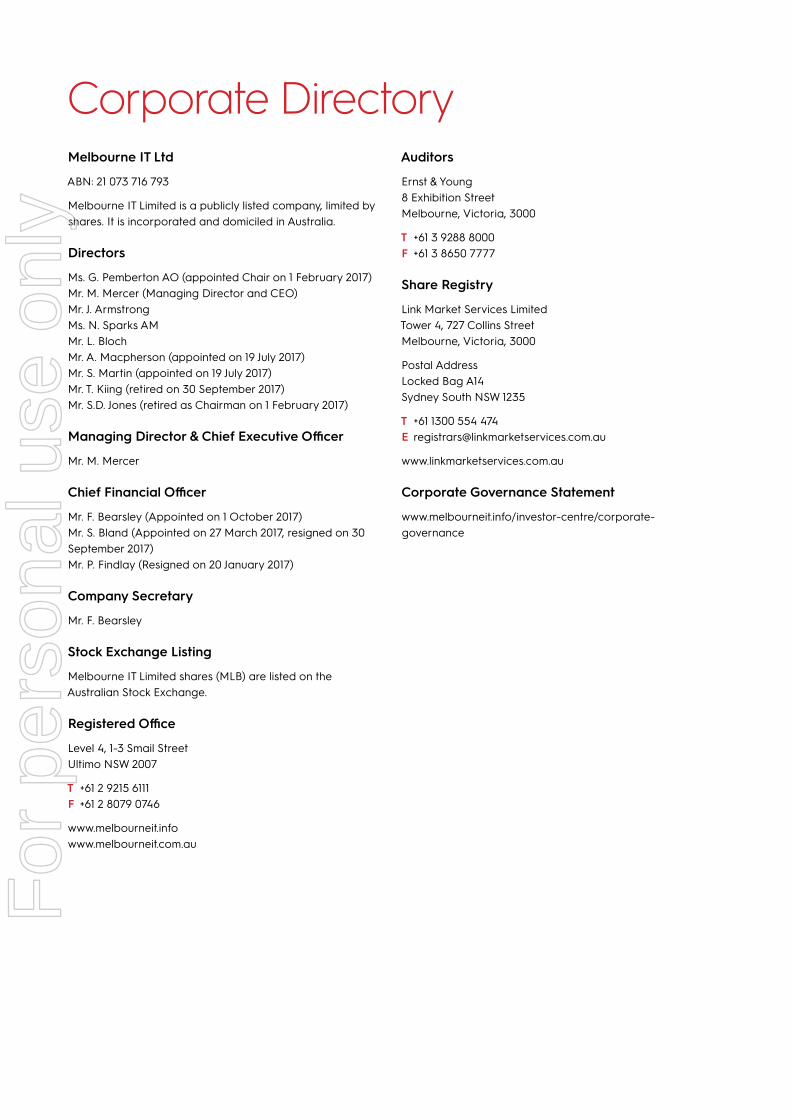
Melbourne IT Ltd
ABN: 21 073 716 793
Melbourne IT Limited is a publicly listed company, limited by shares. It is incorporated and domiciled in Australia.
Directors
Ms. G. Pemberton AO (appointed Chair on 1 February 2017)Mr. M. Mercer (Managing Director and CEO)Mr. J. ArmstrongMs. N. Sparks AMMr. L. BlochMr. A. Macpherson (appointed on 19 July 2017)Mr. S. Martin (appointed on 19 July 2017)Mr. T. Kiing (retired on 30 September 2017)Mr. S.D. Jones (retired as Chairman on 1 February 2017)
Managing Director & Chief Executive Officer
Mr. M. Mercer
Chief Financial Officer
Mr. F. Bearsley (Appointed on 1 October 2017) Mr. S. Bland (Appointed on 27 March 2017, resigned on 30 September 2017) Mr. P. Findlay (Resigned on 20 January 2017)
Company Secretary
Mr. F. Bearsley
Stock Exchange Listing
Melbourne IT Limited shares (MLB) are listed on the Australian Stock Exchange.
Registered Office
Level 4, 1-3 Smail Street Ultimo NSW 2007
T +61 2 9215 6111 F +61 2 8079 0746
www.melbourneit.info www.melbourneit.com.au
Auditors
Ernst & Young 8 Exhibition Street Melbourne, Victoria, 3000
T +61 3 9288 8000 F +61 3 8650 7777
Share Registry
Link Market Services Limited Tower 4, 727 Collins Street Melbourne, Victoria, 3000
Postal Address Locked Bag A14 Sydney South NSW 1235
T +61 1300 554 474 E [email protected]
www.linkmarketservices.com.au
Corporate Governance Statement
www.melbourneit.info/investor-centre/corporate-governance
Corporate DirectoryF
or p
erso
nal u
se o
nly

For
per
sona
l use
onl
y

Page 1 of 9
Corporate Governance Statement
This Statement was approved by the Board of Melbourne IT Limited on 23 April 2018.
The Melbourne IT Board of Directors recognizes the need for the highest standards of corporate behavior and accountability. The Board is committed to optimizing shareholder returns within a framework of ethical business practices. Melbourne IT's corporate governance practices and policies comply with the ASX Corporate Governance Council’s Corporate Governance Principles and Recommendations. This statement reflects a summary of Melbourne IT’s corporate governance framework, policies and procedures that are in place and operating as at 23 April 2018. Further information on Melbourne IT’s corporate governance policies, including Board and Committee charters, are available in the Corporate Governance page of our website: http://www.melbourneit.info/investor-centre/corporate-governance. Principle 1 – Lay Solid Foundations for Management and Oversight by Board Board and Management The Board of Directors of Melbourne IT Limited (the Company) is responsible for the corporate governance of the Melbourne IT Group. The corporate governance regime ensures the strategic guidance of the Company, the effective monitoring of Management by the Board, and the Board’s accountability to the Company and to the shareholders. The role of the Board is to provide oversight and advice to Management. In its oversight role, the Board monitors management and ensures it is acting diligently in the interests of shareholders. In its advisory role, the Board consults with Management regarding the strategic and operational direction of the Company, paying attention to decisions that balance risk and reward. In carrying out its responsibilities and exercising its powers, the Board at all times recognizes its overriding responsibility to act honestly, fairly, diligently and in accordance with the law in serving the interests of the shareholders and other stakeholders of the Company, protecting the interests of the Company and fulfilling the Board’s duties and obligations under the Company’s Constitution and the Corporations Act 2001 (Cth). The Board’s responsibilities are set out in a formal charter. The charter is available from the Corporate Governance page of the Company’s website. The Board may delegate certain authorities to Board Committees and/or to Management. The Board has established the following standing Committees:
● Audit and Risk Management Committee (“ARMC”) (see Principle 4); and ● Human Resources, Remuneration and Nomination Committee (“HRRNC”) (see Principle 2).
The role and responsibilities of each Committee are outlined in their respective charters.
For
per
sona
l use
onl
y
Corporate Governance Statement
Page 2 of 9
The Board has delegated to Management the responsibility for the day to day management and operation of the Company. Amongst other things, Management has the responsibility for the overall management and performance of the Company and charting the strategic direction of the Company, taking advice from, and for approval by, the Board. Specific authorities delegated to the Chief Executive Officer (“CEO”) and the Executive Leadership Team are also set out in the Delegation of Authority Policy, which is approved by the Board. Directors All material information about a director standing for election or re-election is included in the explanatory memorandum to the Notice of Annual General Meeting. The Directors’ biographies provide information about their relevant qualifications, experience and skills that they bring to the Board, as well as details of their current commitments including any other material directorships they hold. Potential candidates are identified by the Human Resources, Remuneration and Nomination Committee, usually with the assistance of an Executive Search firm, which will recommend one or more candidates to the Board for further review and final appointment. In evaluating a candidate for appointment as director, the Board considers criteria which include the particular skill sets identified by the Board as being required at the time as well as the individual’s experience and professional qualifications, ability to exercise sound business judgment, leadership ability and/or prominence in a specified field, integrity and moral reputation, any potential conflicts of interest or legal impediments to serving as a director, and willingness and availability to commit the time required to serve as an effective director. It is the Company’s policy that background checks, including ASIC Banned & Disqualified Persons Register and bankruptcy search, are conducted on new directors as part of the standard requirements of the Company’s recruitment process. Newly appointed directors must stand for election at the next Annual General Meeting, in accordance with the Company’s Constitution. New directors provide the Company with a written consent to act as a director and receive a formal Letter of Appointment that sets out the Terms & Conditions of Appointment and Remuneration Schedule. It also sets out the expectations of the Company, the Director’s duties and powers, insurance and indemnity arrangements, and rights of access to information. Company Secretary The Company Secretary is appointed by the Board. The Company Secretary reports directly to the Board, through the Chairman, on matters relating to the proper functioning of the Board. All Directors have access to the Company Secretary. Diversity Policy Melbourne IT’s Diversity Policy outlines its commitment to diversity. The Company believes that commitment to this Policy contributes to the achievement of corporate objectives and embeds the importance and value of diversity within the culture of Melbourne IT. The Policy addresses all forms of diversity and sets out how the Company will maintain diversity. It also outlines the Board’s and Executive Leadership Team’s roles in promoting the Company’s commitment to gender diversity. A copy of the Policy is available from the Corporate Governance page of our website. Melbourne IT is compliant with equal opportunity legislation administered by the Australian Government’s Equal Opportunity for Women in the Workplace Agency (EOWA) and reports under the Workplace Gender Equality Act 2012. A copy of Melbourne IT’s most recent report can be found in the Corporate Governance page of the Company’s website.
For
per
sona
l use
onl
y

Corporate Governance Statement
Page 3 of 9
As stated in the Diversity Policy, the Board and Executive Leadership Team have committed to achieving a year on year improvement in gender diversity and representation. The HRRNC reviews the Group’s gender diversity status on a regular basis and ensures that the Company has appropriate strategies and that initiatives and programs are in place to deliver on the Group’s commitment. As at 31 December 2017, the female participation rates across the Company are as follows:
● overall, 28% of employees were female; ● 33% of the executive roles were held by females; ● 29% of all people management/leadership positions were held by females; and ● there were two female board members (29%).
Board, Committee and Director Evaluation In accordance with the Board and Committee Charters, the Board is required to annually review its performance, policies and practices and review the performance of its Committees and the Board and Committee Chairs. The performance of the Board and each Committee is measured against its charter and other relevant criteria as determined by the Board. The last formal review of the Board’s performance, was done internally and was conducted in December 2017. An independent review of the Board, the Committees and the individual directors is undertaken from time to time. The last independent review was conducted in 2015. Executive Leadership Team Evaluation Formal performance reviews are conducted for all staff on an annual basis. The Executive Leadership Team’s performance reviews have been conducted for the financial year ended 31 December 2017. The evaluation is based on role descriptions and agreed key performance metrics. A Summary of the Performance Evaluation Process and Induction Process for Senior Executives and the Board can be found in the Corporate Governance page of the Company’s website. Principle 2 – Structure the Board to Add Value Melbourne IT’s Constitution provides for a minimum of three directors and a maximum of ten directors. One-third of the directors (with the exception of the Managing Director) must retire from office at the time of the Annual General Meeting each year. Directors are eligible for re-election. The directors who retire by rotation are those with the longest period in office since their appointment or the last election. The maximum period that a director can be in office before facing re‐election is three years. This period will sometimes be shorter due to the requirement that one-third must retire each year. At the time when any director is coming up for re‐election, the Board considers that question and makes a conscious decision as to whether to recommend that re‐election to shareholders.
● The Board is composed of a majority of independent directors. Five non-executive directors are considered by the Board to be independent directors in accordance with the ASX Corporate Governance Guidelines – Gail Pemberton, Naseema Sparks, John Armstrong, Simon Martin and Andrew Macpherson.
● One non-executive director, Larry Bloch, is a substantial shareholder in the Company and, therefore, is not considered by the Board to be an independent director.
● The Managing Director and Chief Executive Officer, Martin Mercer, was the sole executive director.
● The Chair of the Board, Ms Gail Pemberton is an independent non-executive director. It is the Board’s view that it has an appropriate mix of relevant skills, experience, expertise and diversity which enables it to discharge its responsibilities and meet its objectives. This mix is subject to review on a regular basis as part of the Board performance review process.
For
per
sona
l use
onl
y
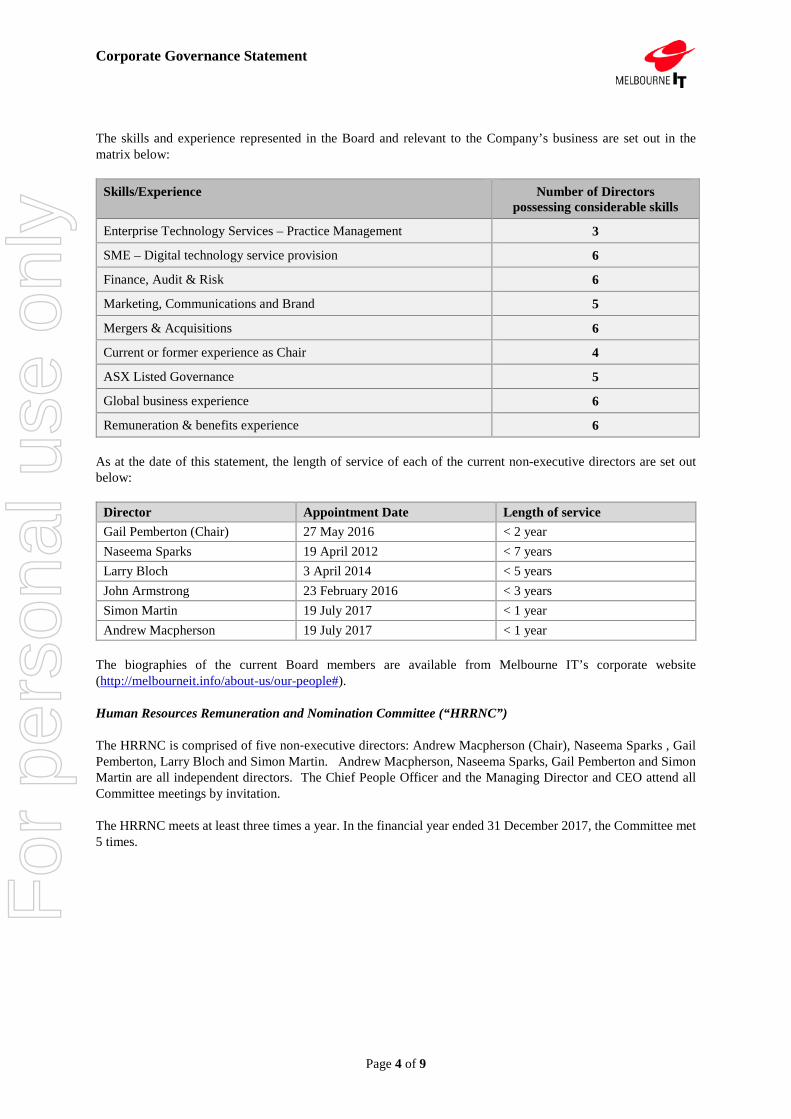
Corporate Governance Statement
Page 4 of 9
The skills and experience represented in the Board and relevant to the Company’s business are set out in the matrix below:
Skills/Experience Number of Directors possessing considerable skills
Enterprise Technology Services – Practice Management 3
SME – Digital technology service provision 6
Finance, Audit & Risk 6
Marketing, Communications and Brand 5
Mergers & Acquisitions 6
Current or former experience as Chair 4
ASX Listed Governance 5
Global business experience 6
Remuneration & benefits experience 6 As at the date of this statement, the length of service of each of the current non-executive directors are set out below:
Director Appointment Date Length of service Gail Pemberton (Chair) 27 May 2016 < 2 year Naseema Sparks 19 April 2012 < 7 years Larry Bloch 3 April 2014 < 5 years John Armstrong 23 February 2016 < 3 years Simon Martin 19 July 2017 < 1 year Andrew Macpherson 19 July 2017 < 1 year
The biographies of the current Board members are available from Melbourne IT’s corporate website (http://melbourneit.info/about-us/our-people#). Human Resources Remuneration and Nomination Committee (“HRRNC”) The HRRNC is comprised of five non‐executive directors: Andrew Macpherson (Chair), Naseema Sparks , Gail Pemberton, Larry Bloch and Simon Martin. Andrew Macpherson, Naseema Sparks, Gail Pemberton and Simon Martin are all independent directors. The Chief People Officer and the Managing Director and CEO attend all Committee meetings by invitation. The HRRNC meets at least three times a year. In the financial year ended 31 December 2017, the Committee met 5 times.
For
per
sona
l use
onl
y
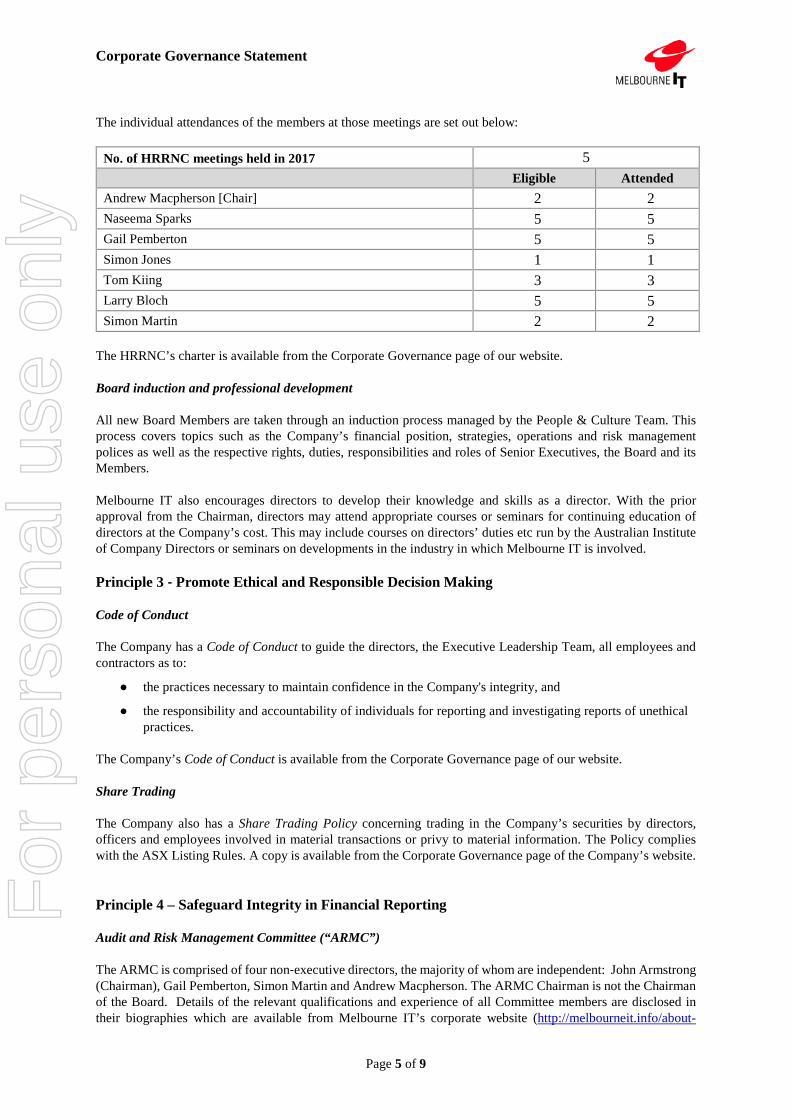
Corporate Governance Statement
Page 5 of 9
The individual attendances of the members at those meetings are set out below:
No. of HRRNC meetings held in 2017 5 Eligible Attended Andrew Macpherson [Chair] 2 2 Naseema Sparks 5 5 Gail Pemberton 5 5 Simon Jones 1 1 Tom Kiing 3 3 Larry Bloch 5 5 Simon Martin 2 2
The HRRNC’s charter is available from the Corporate Governance page of our website. Board induction and professional development All new Board Members are taken through an induction process managed by the People & Culture Team. This process covers topics such as the Company’s financial position, strategies, operations and risk management polices as well as the respective rights, duties, responsibilities and roles of Senior Executives, the Board and its Members. Melbourne IT also encourages directors to develop their knowledge and skills as a director. With the prior approval from the Chairman, directors may attend appropriate courses or seminars for continuing education of directors at the Company’s cost. This may include courses on directors’ duties etc run by the Australian Institute of Company Directors or seminars on developments in the industry in which Melbourne IT is involved. Principle 3 ‐ Promote Ethical and Responsible Decision Making Code of Conduct The Company has a Code of Conduct to guide the directors, the Executive Leadership Team, all employees and contractors as to:
● the practices necessary to maintain confidence in the Company's integrity, and
● the responsibility and accountability of individuals for reporting and investigating reports of unethical practices.
The Company’s Code of Conduct is available from the Corporate Governance page of our website. Share Trading The Company also has a Share Trading Policy concerning trading in the Company’s securities by directors, officers and employees involved in material transactions or privy to material information. The Policy complies with the ASX Listing Rules. A copy is available from the Corporate Governance page of the Company’s website. Principle 4 – Safeguard Integrity in Financial Reporting Audit and Risk Management Committee (“ARMC”) The ARMC is comprised of four non‐executive directors, the majority of whom are independent: John Armstrong (Chairman), Gail Pemberton, Simon Martin and Andrew Macpherson. The ARMC Chairman is not the Chairman of the Board. Details of the relevant qualifications and experience of all Committee members are disclosed in their biographies which are available from Melbourne IT’s corporate website (http://melbourneit.info/about-
For
per
sona
l use
onl
y

Corporate Governance Statement
Page 6 of 9
us/our-people#). The Managing Director and CEO, the Chief Financial Officer (“CFO”) and the Group Manager, Risk & Audit, attend all Committee meetings by invitation. The relevant partner and staff of Melbourne IT’s external auditors also attend Committee meetings by invitation. The ARMC meets at least three times each year and has direct access to Melbourne IT’s auditors and senior management. On at least one occasion each year, the Committee meets with the auditors without the presence of Management. In the financial year ended 31 December 2017, the Committee met 5 times. The individual attendances of the members at those meetings are set out as follows:
No. of ARMC meetings held in 2016 5 Eligible Attended John Armstrong {Chair] 5 4 Simon Jones 2 2 Larry Bloch Retired from the ARMC on December
31st, 2017 5 5
Gail Pemberton 5 5 Simon Martin 2 2 Andrew Macpherson 2 2
The ARMC Charter is available from the Corporate Governance page of our website. CEO and CFO certification of financial statements The CEO and CFO, in accordance with section 295A of the Corporations Act, have stated in writing to the Board that, for the financial year ended 31 December 2017, the financial records of the Company have been properly maintained, the financial statements and the notes comply with the accounting standards and give a true and fair view of the financial position and performance of the Company, and that their statement has been provided on the basis of a sound system of risk management and internal control which is operating effectively. External Auditor Melbourne IT’s external auditors attend the Company’s Annual General Meeting and are available to answer reasonable questions from shareholders in relation to the conduct of the audit, the preparation and content of the independent audit report and the accounting policies adopted by Melbourne IT. Principle 5 – Make timely and balanced disclosure Melbourne IT is committed to complying with its disclosure obligations under the Listing Rules of the Australian Stock Exchange (ASX) and the Corporations Act. To that end, Melbourne IT has adopted a Disclosure Policy, which is available from the Corporate Governance page of our website. The Board has appointed the Chief Executive Officer and the Company Secretary as “Disclosure Officers”, with responsibility for:
● reviewing compliance with Melbourne IT’s continuous disclosure obligations; ● coordinating the timely release of information to the market; and ● maintaining a record of disclosure information (including any information which was considered but
rejected for disclosure and the reasons for non‐disclosure). As a general rule, disclosure issues are discussed with, and proposed releases are approved by, the Chairman, CEO and CFO. If necessary, external legal advice is obtained.
For
per
sona
l use
onl
y
Corporate Governance Statement
Page 7 of 9
Principle 6 – Respect the rights of shareholders Melbourne IT aims to keep its shareholders informed of all important developments concerning the Company. Melbourne IT communicates with its shareholders using the following means:
● periodic market announcements, which are released first to the ASX; ● periodic investor briefings, which are also released first to the ASX; ● the annual report; ● the annual general meeting and the explanatory notes to the notice of annual general meeting; and ● the Company’s corporate website located at http://www.melbourneit.info.
Shareholders also have the opportunity to ask questions of the Company’s external auditors, who attend the Company’s Annual General Meeting. The auditors are available to answer reasonable questions from shareholders in relation to the conduct of the audit, the independent audit report and the accounting policies adopted by Melbourne IT. Shareholders also have the option to electronically receive communications from, and send communications to, the Company and its security registry. Shareholders can find information about the Company’s corporate governance on our website (http://www.melbourneit.info/investor-centre/corporate-governance), including the Board and Committee Charters, and the Company’s corporate governance policies:
● Code of Conduct ● Diversity Policy ● Disclosure Policy ● Shareholder Communication Policy ● Share Trading Policy, ● Risk Management Policy; and ● Performance Evaluation Process and Induction Process for Senior Executives and the Board.
. Principle 7 – Recognize and Manage Risk The Board is ultimately responsible for guiding and monitoring the Company on behalf of its shareholders. The Board has adopted a Risk Management Policy, which is available from the Corporate Governance page of our website. The Policy provides an overview of the Company’s approach to risk management oversight and control and its approach to the development of risk management policies. One of the key responsibilities of the Board is to ensure that proper risk management systems and internal controls are in place, including the review of material risk exposures and the steps management has taken to monitor, control and report such exposures. To fulfil this function, the Board makes use of the ARMC (See Principle 4). The ARMC assists the Board by, amongst other things:
● reviewing the risk management policies, together with processes and systems for managing risk and internal control, to ensure they remain appropriate and effective;
● ensuring that an up to date risk register that appropriately describes the risks facing the organization, is maintained;
● ensuring that an assurance program that monitors the effectiveness of controls and processes managing the key risks facing the organization, is in place; and
● ensuring that the Board receives reports whenever an area of material business risk or exposure is identified.
Melbourne IT’s main risks and mitigation plans are reviewed annually by the ARMC and the Board.
For
per
sona
l use
onl
y

Corporate Governance Statement
Page 8 of 9
Melbourne IT’s internal audit function is led by the Group Manager, Risk & Audit, who provides the ARMC with regular reports on the progress of risk mitigation actions and internal audit activities throughout the year. The Group Manager, Risk & Audit, is responsible for:
● the design and implementation of an effective and appropriate risk management framework; ● the execution of the annual risk oversight program; ● managing the annual internal audit program, and continuous risk and control monitoring; ● reporting, as required, the effectiveness of risk and control activities to Management and the ARMC;
and ● providing risk management support and expertise across Group.
The Group Manager, Risk & Audit, exercises these responsibilities under the direction of the ARMC, and conducts the risk management program over the areas of material business risk for the Company. Melbourne IT continually assesses risks against all relevant areas of material business risk. These may include: strategic, operational, compliance, technological, product or service quality, reputation or brand, market-related risks, financial reporting, human capital, environmental, sustainability and ethical conduct. The Company’s risk profile and risk registers are reviewed at least annually and revised periodically for each business and functional unit through the business planning, budgeting, forecasting, reporting and performance management processes. Each Executive is required to review the effectiveness of the risk oversight and management processes relevant to the material risk issues affecting their business or functional unit on an ongoing basis. The Company has a robust risk management framework that facilitates the management and mitigation of material exposure to economic, environmental or social sustainability risks such that there is no material residual exposure. The material risks which may impact the Company’s ability to achieve its strategic objectives and secure its future financial prospects are managed through strategic planning over the short, medium and long term and through the processes set out above. The Company is exposed to key financial risks arising from interest rate, foreign currency, liquidity and credit risk. These risks are managed in accordance with the Group's financial risk management policy. Different methods are used to measure and manage the different types of risks, including monitoring levels of exposure to foreign exchange risk and interest rate risk, assessing market forecasts for foreign exchange and interest rate. Liquidity risk is monitored through the development of rolling cash flow forecasts. The Board reviews and agrees policies for managing each of these risks, including the setting of limits for trading in derivatives, hedging cover for foreign currency and interest rates, credit allowances, and cash flow forecast projections.
For
per
sona
l use
onl
y
Corporate Governance Statement
Page 9 of 9
Principle 8 – Remunerate Fairly and Responsibly The Board is assisted by the HRRNC to address the various issues in relation to remuneration (see Principle 2). Melbourne IT’s remuneration policy has been set to ensure that the remuneration of directors and all staff properly reflects each person’s accountabilities, duties and their level of performance, and to ensure that remuneration is competitive in attracting, motivating and retaining staff of the highest quality. All remuneration packages are reviewed at least annually, taking into account individual and company performance, market movements and expert advice. The Managing Director and CEO reviews the performance of the Executive Leadership Team and makes recommendations to the HRRNC for approval in relation to their remuneration and Key Performance Indicators (‘KPIs’). The Managing Director and CEO’s performance is reviewed by the Board, facilitated by the HRRNC and the Chairman. Non-Executive Directors’ and Executive Remuneration The structure of non-executive directors and executive remuneration is separate and distinct. The remuneration of non‐executive directors in 2017 comprised of a fixed fee only. Non-executive directors are paid a fixed fee in accordance with the determination of the Board but with an aggregate limit fixed by the shareholders at a General Meeting. The current limit ($1,000,000 per annum) was approved by shareholders at the Annual General Meeting in 2008 and, since then, no increase in the aggregate limit has been sought. The Chairpersons of each committee receive an additional fee to reflect (at least to some extent) the additional time commitment and responsibility required of them to carry out that role. Directors are not entitled as of right to any retirement or termination benefit (other than statutory superannuation benefits). For 2017, the remuneration of the Managing Director and CEO, and Executive Leadership Team, comprises the following three elements:
1. Fixed Remuneration: Salary and Superannuation Guarantee 2. Variable remuneration: Short‐Term Incentive (STI); and 3. Variable remuneration: Long‐Term Incentive (LTI)
The short‐term incentive for each executive is an annual cash payment determined as a percentage of their Fixed Remuneration and subject to the achievement of agreed KPIs. The expected performance of the Managing Director and CEO and members of the Executive Leadership Team are specified each year using KPIs, which include financial and group targets for Melbourne IT overall, as well as personal objectives and targets, appropriate for each individual’s role. The long‐term incentive consists of performance rights granted under the Melbourne IT LTI Plan. The vesting of performance rights is subject to the achievement of two performance hurdles: earnings per share (‘EPS’) growth and relative total shareholder return ('TSR'). Both hurdles are tested over a 3-year performance period. A copy of the LTI Plan is available in the Corporate Governance page of our website: http://www.melbourneit.info/investor-centre/corporate-governance. In accordance with the conditions of the LTI Plan, a participant must not enter into any scheme, arrangement or agreement (including options and derivative products) under which the Participant alters the economic benefit to be derived from any Rights granted that remain subject to the Rules of the LTI Plan, irrespective of future changes in the market price of Shares. For 2018, the remuneration framework for the Managing Director and CEO, and Executive Leadership Team has been restructured. Further details regarding the existing remuneration structure for 2017 and also the new remuneration structure for 2018 are set out in the Remuneration Report contained in the 2017 Annual Financial Report.
For
per
sona
l use
onl
y

Appendix 4G Key to Disclosures Corporate Governance Council Principles and Recommendations
+ See chapter 19 for defined terms 2 November 2015 Page 1
Rules 4.7.3 and 4.10.31
Appendix 4G
Key to Disclosures Corporate Governance Council Principles and Recommendations
Introduced 01/07/14 Amended 02/11/15
Name of entity
Melbourne IT Limited
ABN / ARBN Financial year ended:
21 073 716 793 31 December 2017
Our corporate governance statement2 for the above period above can be found at:3
☐ These pages of our annual report:
This URL on our website: http://melbourneit.info/investor-centre/corporate-governance
The Corporate Governance Statement is accurate and up to date as at 23 April 2018 and has been approved by the board.
The annexure includes a key to where our corporate governance disclosures can be located.
Date: 26 April 2018
Name of Director or Secretary authorising lodgement:
Fraser Bearsely, Company Secretary
1 Under Listing Rule 4.7.3, an entity must lodge with ASX a completed Appendix 4G at the same time as it lodges its annual report with ASX.
Listing Rule 4.10.3 requires an entity that is included in the official list as an ASX Listing to include in its annual report either a corporate governance statement that meets the requirements of that rule or the URL of the page on its website where such a statement is located. The corporate governance statement must disclose the extent to which the entity has followed the recommendations set by the ASX Corporate Governance Council during the reporting period. If the entity has not followed a recommendation for any part of the reporting period, its corporate governance statement must separately identify that recommendation and the period during which it was not followed and state its reasons for not following the recommendation and what (if any) alternative governance practices it adopted in lieu of the recommendation during that period.
Under Listing Rule 4.7.4, if an entity chooses to include its corporate governance statement on its website rather than in its annual report, it must lodge a copy of the corporate governance statement with ASX at the same time as it lodges its annual report with ASX. The corporate governance statement must be current as at the effective date specified in that statement for the purposes of rule 4.10.3.
2 “Corporate governance statement” is defined in Listing Rule 19.12 to mean the statement referred to in Listing Rule 4.10.3 which discloses the extent to which an entity has followed the recommendations set by the ASX Corporate Governance Council during a particular reporting period.
3 Mark whichever option is correct and then complete the page number(s) of the annual report, or the URL of the web page, where the entity’s corporate governance statement can be found. You can, if you wish, delete the option which is not applicable.
Throughout this form, where you are given two or more options to select, you can, if you wish, delete any option which is not applicable and just retain the option that is applicable. If you select an option that includes “OR” at the end of the selection and you delete the other options, you can also, if you wish, delete the “OR” at the end of the selection.
For
per
sona
l use
onl
y
Appendix 4G Key to Disclosures Corporate Governance Council Principles and Recommendations
+ See chapter 19 for defined terms 2 November 2015 Page 2
ANNEXURE – KEY TO CORPORATE GOVERNANCE DISCLOSURES Corporate Governance Council recommendation We have followed the recommendation in full for the whole of the
period above. We have disclosed … We have NOT followed the recommendation in full for the whole of the period above. We have disclosed …4
PRINCIPLE 1 – LAY SOLID FOUNDATIONS FOR MANAGEMENT AND OVERSIGHT
1.1 A listed entity should disclose: (a) the respective roles and responsibilities of its board and
management; and (b) those matters expressly reserved to the board and those
delegated to management.
… the fact that we follow this recommendation: in our Corporate Governance Statement OR
☐ at [insert location] … and information about the respective roles and responsibilities of our board and management (including those matters expressly reserved to the board and those delegated to management): at http://melbourneit.info/investor-centre/corporate-governance
☐ an explanation why that is so in our Corporate Governance Statement OR
☐ we are an externally managed entity and this recommendation is therefore not applicable
1.2 A listed entity should: (a) undertake appropriate checks before appointing a person, or
putting forward to security holders a candidate for election, as a director; and
(b) provide security holders with all material information in its possession relevant to a decision on whether or not to elect or re-elect a director.
… the fact that we follow this recommendation: in our Corporate Governance Statement OR
☐ at [insert location]
☐ an explanation why that is so in our Corporate Governance Statement OR
☐ we are an externally managed entity and this recommendation is therefore not applicable
1.3 A listed entity should have a written agreement with each director and senior executive setting out the terms of their appointment.
… the fact that we follow this recommendation:
in our Corporate Governance Statement OR
☐ at [insert location]
☐ an explanation why that is so in our Corporate Governance Statement OR
☐ we are an externally managed entity and this recommendation is therefore not applicable
1.4 The company secretary of a listed entity should be accountable directly to the board, through the chair, on all matters to do with the proper functioning of the board.
… the fact that we follow this recommendation: in our Corporate Governance Statement OR
☐ at [insert location]
☐ an explanation why that is so in our Corporate Governance Statement OR
☐ we are an externally managed entity and this recommendation is therefore not applicable
4 If you have followed all of the Council’s recommendations in full for the whole of the period above, you can, if you wish, delete this column from the form and re-format it.
For
per
sona
l use
onl
y
Appendix 4G Key to Disclosures Corporate Governance Council Principles and Recommendations
+ See chapter 19 for defined terms 2 November 2015 Page 3
Corporate Governance Council recommendation We have followed the recommendation in full for the whole of the period above. We have disclosed …
We have NOT followed the recommendation in full for the whole of the period above. We have disclosed …4
1.5 A listed entity should: (a) have a diversity policy which includes requirements for the
board or a relevant committee of the board to set measurable objectives for achieving gender diversity and to assess annually both the objectives and the entity’s progress in achieving them;
(b) disclose that policy or a summary of it; and (c) disclose as at the end of each reporting period the
measurable objectives for achieving gender diversity set by the board or a relevant committee of the board in accordance with the entity’s diversity policy and its progress towards achieving them and either: (1) the respective proportions of men and women on the
board, in senior executive positions and across the whole organisation (including how the entity has defined “senior executive” for these purposes); or
(2) if the entity is a “relevant employer” under the Workplace Gender Equality Act, the entity’s most recent “Gender Equality Indicators”, as defined in and published under that Act.
… the fact that we have a diversity policy that complies with paragraph (a): in our Corporate Governance Statement OR
☐ at [insert location] … and a copy of our diversity policy or a summary of it:
at http://melbourneit.info/investor-centre/corporate-governance
… and the measurable objectives for achieving gender diversity set by the board or a relevant committee of the board in accordance with our diversity policy and our progress towards achieving them: in our Corporate Governance Statement OR
☐ at [insert location] … and the information referred to in paragraphs (c)(1) or (2): in our Corporate Governance Statement OR
☐ at [insert location]
☐ an explanation why that is so in our Corporate Governance Statement OR
☐ we are an externally managed entity and this recommendation is therefore not applicable
1.6 A listed entity should: (a) have and disclose a process for periodically evaluating the
performance of the board, its committees and individual directors; and
(b) disclose, in relation to each reporting period, whether a performance evaluation was undertaken in the reporting period in accordance with that process.
… the evaluation process referred to in paragraph (a): in our Corporate Governance Statement OR
☐ at [insert location] … and the information referred to in paragraph (b): in our Corporate Governance Statement OR
☐ at [insert location]
☐ an explanation why that is so in our Corporate Governance Statement OR
☐ we are an externally managed entity and this recommendation is therefore not applicable
1.7 A listed entity should: (a) have and disclose a process for periodically evaluating the
performance of its senior executives; and (b) disclose, in relation to each reporting period, whether a
performance evaluation was undertaken in the reporting period in accordance with that process.
… the evaluation process referred to in paragraph (a): in our Corporate Governance Statement OR
☐ at [insert location] … and the information referred to in paragraph (b): in our Corporate Governance Statement OR
☐ at [insert location]
☐ an explanation why that is so in our Corporate Governance Statement OR
☐ we are an externally managed entity and this recommendation is therefore not applicable F
or p
erso
nal u
se o
nly

Appendix 4G Key to Disclosures Corporate Governance Council Principles and Recommendations
+ See chapter 19 for defined terms 2 November 2015 Page 4
Corporate Governance Council recommendation We have followed the recommendation in full for the whole of the period above. We have disclosed …
We have NOT followed the recommendation in full for the whole of the period above. We have disclosed …4
PRINCIPLE 2 - STRUCTURE THE BOARD TO ADD VALUE
2.1 The board of a listed entity should: (a) have a nomination committee which:
(1) has at least three members, a majority of whom are independent directors; and
(2) is chaired by an independent director, and disclose: (3) the charter of the committee; (4) the members of the committee; and (5) as at the end of each reporting period, the number of
times the committee met throughout the period and the individual attendances of the members at those meetings; or
(b) if it does not have a nomination committee, disclose that fact and the processes it employs to address board succession issues and to ensure that the board has the appropriate balance of skills, knowledge, experience, independence and diversity to enable it to discharge its duties and responsibilities effectively.
[If the entity complies with paragraph (a):] … the fact that we have a nomination committee that complies with paragraphs (1) and (2): in our Corporate Governance Statement OR
☐ at [insert location] … and a copy of the charter of the committee: at http://melbourneit.info/investor-centre/corporate-governance … and the information referred to in paragraphs (4) and (5): in our Corporate Governance Statement OR
☐ at [insert location] [If the entity complies with paragraph (b):] … the fact that we do not have a nomination committee and the processes we employ to address board succession issues and to ensure that the board has the appropriate balance of skills, knowledge, experience, independence and diversity to enable it to discharge its duties and responsibilities effectively:
☐ in our Corporate Governance Statement OR
☐ at [insert location]
☐ an explanation why that is so in our Corporate Governance Statement OR
☐ we are an externally managed entity and this recommendation is therefore not applicable
2.2 A listed entity should have and disclose a board skills matrix setting out the mix of skills and diversity that the board currently has or is looking to achieve in its membership.
… our board skills matrix: in our Corporate Governance Statement OR
☐ at [insert location]
☐ an explanation why that is so in our Corporate Governance Statement OR
☐ we are an externally managed entity and this recommendation is therefore not applicable
For
per
sona
l use
onl
y

Appendix 4G Key to Disclosures Corporate Governance Council Principles and Recommendations
+ See chapter 19 for defined terms 2 November 2015 Page 5
Corporate Governance Council recommendation We have followed the recommendation in full for the whole of the period above. We have disclosed …
We have NOT followed the recommendation in full for the whole of the period above. We have disclosed …4
2.3 A listed entity should disclose: (a) the names of the directors considered by the board to be
independent directors; (b) if a director has an interest, position, association or
relationship of the type described in Box 2.3 but the board is of the opinion that it does not compromise the independence of the director, the nature of the interest, position, association or relationship in question and an explanation of why the board is of that opinion; and
(c) the length of service of each director.
… the names of the directors considered by the board to be independent directors: in our Corporate Governance Statement OR
☐ at [insert location] … and, where applicable, the information referred to in paragraph (b): in our Corporate Governance Statement OR
☐ at [insert location] … and the length of service of each director: in our Corporate Governance Statement OR
☐ at [insert location]
☐ an explanation why that is so in our Corporate Governance Statement
2.4 A majority of the board of a listed entity should be independent directors.
… the fact that we follow this recommendation: in our Corporate Governance Statement OR
☐ at [insert location]
☐ an explanation why that is so in our Corporate Governance Statement OR
☐ we are an externally managed entity and this recommendation is therefore not applicable
2.5 The chair of the board of a listed entity should be an independent director and, in particular, should not be the same person as the CEO of the entity.
… the fact that we follow this recommendation: in our Corporate Governance Statement OR
☐ at [insert location]
☐ an explanation why that is so in our Corporate Governance Statement OR
☐ we are an externally managed entity and this recommendation is therefore not applicable
2.6 A listed entity should have a program for inducting new directors and provide appropriate professional development opportunities for directors to develop and maintain the skills and knowledge needed to perform their role as directors effectively.
… the fact that we follow this recommendation: in our Corporate Governance Statement OR
☐ at [insert location]
☐ an explanation why that is so in our Corporate Governance Statement OR
☐ we are an externally managed entity and this recommendation is therefore not applicable
PRINCIPLE 3 – ACT ETHICALLY AND RESPONSIBLY
3.1 A listed entity should: (a) have a code of conduct for its directors, senior executives
and employees; and (b) disclose that code or a summary of it.
… our code of conduct or a summary of it:
☐ in our Corporate Governance Statement OR
at http://melbourneit.info/investor-centre/corporate-governance
☐ an explanation why that is so in our Corporate Governance Statement F
or p
erso
nal u
se o
nly

Appendix 4G Key to Disclosures Corporate Governance Council Principles and Recommendations
+ See chapter 19 for defined terms 2 November 2015 Page 6
Corporate Governance Council recommendation We have followed the recommendation in full for the whole of the period above. We have disclosed …
We have NOT followed the recommendation in full for the whole of the period above. We have disclosed …4
PRINCIPLE 4 – SAFEGUARD INTEGRITY IN CORPORATE REPORTING
4.1 The board of a listed entity should: (a) have an audit committee which:
(1) has at least three members, all of whom are non-executive directors and a majority of whom are independent directors; and
(2) is chaired by an independent director, who is not the chair of the board,
and disclose: (3) the charter of the committee; (4) the relevant qualifications and experience of the
members of the committee; and (5) in relation to each reporting period, the number of
times the committee met throughout the period and the individual attendances of the members at those meetings; or
(b) if it does not have an audit committee, disclose that fact and the processes it employs that independently verify and safeguard the integrity of its corporate reporting, including the processes for the appointment and removal of the external auditor and the rotation of the audit engagement partner.
[If the entity complies with paragraph (a):] … the fact that we have an audit committee that complies with paragraphs (1) and (2): in our Corporate Governance Statement OR
☐ at [insert location] … and a copy of the charter of the committee: at http://melbourneit.info/investor-centre/corporate-governance … and the information referred to in paragraph (4):
☐ in our Corporate Governance Statement OR
at http://melbourneit.info/about-us/our-people# … and the information referred to in paragraphs (5): in our Corporate Governance Statement OR
☐ at [insert location] [If the entity complies with paragraph (b):] … the fact that we do not have an audit committee and the processes we employ that independently verify and safeguard the integrity of our corporate reporting, including the processes for the appointment and removal of the external auditor and the rotation of the audit engagement partner:
☐ in our Corporate Governance Statement OR
☐ at [insert location]
☐ an explanation why that is so in our Corporate Governance Statement
4.2 The board of a listed entity should, before it approves the entity’s financial statements for a financial period, receive from its CEO and CFO a declaration that, in their opinion, the financial records of the entity have been properly maintained and that the financial statements comply with the appropriate accounting standards and give a true and fair view of the financial position and performance of the entity and that the opinion has been formed on the basis of a sound system of risk management and internal control which is operating effectively.
… the fact that we follow this recommendation: in our Corporate Governance Statement OR
☐ at [insert location]
☐ an explanation why that is so in our Corporate Governance Statement
For
per
sona
l use
onl
y
Appendix 4G Key to Disclosures Corporate Governance Council Principles and Recommendations
+ See chapter 19 for defined terms 2 November 2015 Page 7
Corporate Governance Council recommendation We have followed the recommendation in full for the whole of the period above. We have disclosed …
We have NOT followed the recommendation in full for the whole of the period above. We have disclosed …4
4.3 A listed entity that has an AGM should ensure that its external auditor attends its AGM and is available to answer questions from security holders relevant to the audit.
… the fact that we follow this recommendation: in our Corporate Governance Statement OR
☐ at [insert location]
☐ an explanation why that is so in our Corporate Governance Statement OR
☐ we are an externally managed entity that does not hold an annual general meeting and this recommendation is therefore not applicable
PRINCIPLE 5 – MAKE TIMELY AND BALANCED DISCLOSURE
5.1 A listed entity should: (a) have a written policy for complying with its continuous
disclosure obligations under the Listing Rules; and (b) disclose that policy or a summary of it.
… our continuous disclosure compliance policy or a summary of it:
☐ in our Corporate Governance Statement OR
at http://melbourneit.info/investor-centre/corporate-governance
☐ an explanation why that is so in our Corporate Governance ☐ in our Corporate Governance Statement Statement
PRINCIPLE 6 – RESPECT THE RIGHTS OF SECURITY HOLDERS
6.1 A listed entity should provide information about itself and its governance to investors via its website.
… information about us and our governance on our website: at http://melbourneit.info/investor-centre/corporate-governance
☐ an explanation why that is so in our Corporate Governance Statement
6.2 A listed entity should design and implement an investor relations program to facilitate effective two-way communication with investors.
… the fact that we follow this recommendation: in our Corporate Governance Statement OR
☐ at [insert location]
☐ an explanation why that is so in our Corporate Governance Statement
6.3 A listed entity should disclose the policies and processes it has in place to facilitate and encourage participation at meetings of security holders.
… our policies and processes for facilitating and encouraging participation at meetings of security holders: in our Corporate Governance Statement OR
☐ at [insert location]
☐ an explanation why that is so in our Corporate Governance Statement OR
☐ we are an externally managed entity that does not hold periodic meetings of security holders and this recommendation is therefore not applicable
6.4 A listed entity should give security holders the option to receive communications from, and send communications to, the entity and its security registry electronically.
… the fact that we follow this recommendation: in our Corporate Governance Statement OR
☐ at [insert location]
☐ an explanation why that is so in our Corporate Governance Statement
For
per
sona
l use
onl
y
Appendix 4G Key to Disclosures Corporate Governance Council Principles and Recommendations
+ See chapter 19 for defined terms 2 November 2015 Page 8
Corporate Governance Council recommendation We have followed the recommendation in full for the whole of the period above. We have disclosed …
We have NOT followed the recommendation in full for the whole of the period above. We have disclosed …4
PRINCIPLE 7 – RECOGNISE AND MANAGE RISK
7.1 The board of a listed entity should: (a) have a committee or committees to oversee risk, each of
which: (1) has at least three members, a majority of whom are
independent directors; and (2) is chaired by an independent director, and disclose: (3) the charter of the committee; (4) the members of the committee; and (5) as at the end of each reporting period, the number of
times the committee met throughout the period and the individual attendances of the members at those meetings; or
(b) if it does not have a risk committee or committees that satisfy (a) above, disclose that fact and the processes it employs for overseeing the entity’s risk management framework.
[If the entity complies with paragraph (a):] … the fact that we have a committee or committees to oversee risk that comply with paragraphs (1) and (2): in our Corporate Governance Statement OR
☐ at [insert location] … and a copy of the charter of the committee: at http://melbourneit.info/investor-centre/corporate-governance … and the information referred to in paragraphs (4) and (5): in our Corporate Governance Statement OR
☐ at [insert location] [If the entity complies with paragraph (b):] … the fact that we do not have a risk committee or committees that satisfy (a) and the processes we employ for overseeing our risk management framework:
☐ in our Corporate Governance Statement OR
☐ at [insert location]
☐ an explanation why that is so in our Corporate Governance Statement
7.2 The board or a committee of the board should: (a) review the entity’s risk management framework at least
annually to satisfy itself that it continues to be sound; and (b) disclose, in relation to each reporting period, whether such
a review has taken place.
… the fact that board or a committee of the board reviews the entity’s risk management framework at least annually to satisfy itself that it continues to be sound: in our Corporate Governance Statement OR
☐ at [insert location] … and that such a review has taken place in the reporting period covered by this Appendix 4G: in our Corporate Governance Statement OR
☐ at [insert location]
☐ an explanation why that is so in our Corporate Governance Statement
For
per
sona
l use
onl
y

Appendix 4G Key to Disclosures Corporate Governance Council Principles and Recommendations
+ See chapter 19 for defined terms 2 November 2015 Page 9
Corporate Governance Council recommendation We have followed the recommendation in full for the whole of the period above. We have disclosed …
We have NOT followed the recommendation in full for the whole of the period above. We have disclosed …4
7.3 A listed entity should disclose: (a) if it has an internal audit function, how the function is
structured and what role it performs; or (b) if it does not have an internal audit function, that fact and
the processes it employs for evaluating and continually improving the effectiveness of its risk management and internal control processes.
[If the entity complies with paragraph (a):] … how our internal audit function is structured and what role it performs: in our Corporate Governance Statement OR
☐ at [insert location] [If the entity complies with paragraph (b):] … the fact that we do not have an internal audit function and the processes we employ for evaluating and continually improving the effectiveness of our risk management and internal control processes:
☐ in our Corporate Governance Statement OR
☐ at [insert location]
☐ an explanation why that is so in our Corporate Governance Statement
7.4 A listed entity should disclose whether it has any material exposure to economic, environmental and social sustainability risks and, if it does, how it manages or intends to manage those risks.
… whether we have any material exposure to economic, environmental and social sustainability risks and, if we do, how we manage or intend to manage those risks: in our Corporate Governance Statement OR
☐ at [insert location]
☐ an explanation why that is so in our Corporate Governance Statement
For
per
sona
l use
onl
y

Appendix 4G Key to Disclosures Corporate Governance Council Principles and Recommendations
+ See chapter 19 for defined terms 2 November 2015 Page 10
Corporate Governance Council recommendation We have followed the recommendation in full for the whole of the period above. We have disclosed …
We have NOT followed the recommendation in full for the whole of the period above. We have disclosed …4
PRINCIPLE 8 – REMUNERATE FAIRLY AND RESPONSIBLY
8.1 The board of a listed entity should: (a) have a remuneration committee which:
(1) has at least three members, a majority of whom are independent directors; and
(2) is chaired by an independent director, and disclose: (3) the charter of the committee; (4) the members of the committee; and (5) as at the end of each reporting period, the number of
times the committee met throughout the period and the individual attendances of the members at those meetings; or
(b) if it does not have a remuneration committee, disclose that fact and the processes it employs for setting the level and composition of remuneration for directors and senior executives and ensuring that such remuneration is appropriate and not excessive.
[If the entity complies with paragraph (a):] … the fact that we have a remuneration committee that complies with paragraphs (1) and (2): in our Corporate Governance Statement OR
☐ at [insert location] … and a copy of the charter of the committee: at http://melbourneit.info/investor-centre/corporate-governance … and the information referred to in paragraphs (4) and (5): in our Corporate Governance Statement OR
☐ at [insert location] [If the entity complies with paragraph (b):] … the fact that we do not have a remuneration committee and the processes we employ for setting the level and composition of remuneration for directors and senior executives and ensuring that such remuneration is appropriate and not excessive:
☐ in our Corporate Governance Statement OR
☐ at [insert location]
☐ an explanation why that is so in our Corporate Governance Statement OR
☐ we are an externally managed entity and this recommendation is therefore not applicable
8.2 A listed entity should separately disclose its policies and practices regarding the remuneration of non-executive directors and the remuneration of executive directors and other senior executives.
… separately our remuneration policies and practices regarding the remuneration of non-executive directors and the remuneration of executive directors and other senior executives: in our Corporate Governance Statement OR
☐ at [insert location]
☐ an explanation why that is so in our Corporate Governance Statement OR
☐ we are an externally managed entity and this recommendation is therefore not applicable
8.3 A listed entity which has an equity-based remuneration scheme should: (a) have a policy on whether participants are permitted to
enter into transactions (whether through the use of derivatives or otherwise) which limit the economic risk of participating in the scheme; and
(b) disclose that policy or a summary of it.
… our policy on this issue or a summary of it: in our Corporate Governance Statement OR
☐ at [insert location]
☐ an explanation why that is so in our Corporate Governance Statement OR
☐ w e do not have an equity-based remuneration scheme and this recommendation is therefore not applicable OR
☐ we are an externally managed entity and this recommendation is therefore not applicable
For
per
sona
l use
onl
y

Appendix 4G Key to Disclosures Corporate Governance Council Principles and Recommendations
+ See chapter 19 for defined terms 2 November 2015 Page 11
Corporate Governance Council recommendation We have followed the recommendation in full for the whole of the period above. We have disclosed …
We have NOT followed the recommendation in full for the whole of the period above. We have disclosed …4
ADDITIONAL DISCLOSURES APPLICABLE TO EXTERNALLY MANAGED LISTED ENTITIES
- Alternative to Recommendation 1.1 for externally managed listed entities: The responsible entity of an externally managed listed entity should disclose: (a) the arrangements between the responsible entity and the
listed entity for managing the affairs of the listed entity; (b) the role and responsibility of the board of the responsible
entity for overseeing those arrangements.
… the information referred to in paragraphs (a) and (b):
☐ in our Corporate Governance Statement OR
☐ at [insert location]
☐ an explanation why that is so in our Corporate Governance Statement
- Alternative to Recommendations 8.1, 8.2 and 8.3 for externally managed listed entities: An externally managed listed entity should clearly disclose the terms governing the remuneration of the manager.
… the terms governing our remuneration as manager of the entity:
☐ in our Corporate Governance Statement OR
☐ at [insert location]
☐ an explanation why that is so in our Corporate Governance Statement
For
per
sona
l use
onl
y