melanic soils in south africa: compositional
TRANSCRIPT

MELANIC SOILS IN SOUTH AFRICA: COMPOSITIONAL CHARACTERISTICS
AND PARAMETERS THAT GOVERN THEIR FORMATION
by
Gertruida Magaretha Elizabeth van der Merwe
Submitted in partial fulfilment of the requirements for the degree
MAGISTER SCIENTA
(Soil Science)
in the '
Department Plant Production and Soil Science
Faculty of Biological and Agricultural Sciences
University of Pretoria
April 2000
Supervisor: Prof. M.C. Laker
Co-supervisor: Dr. C. Buhmann
© University of Pretoria
Declaration
I, the undersigned, hereby declare that the work contained in this dissertation is entirely
my own original research and that it has not at any time, either partly or fully, been
submitted to any university for the purpose of obtaining a degree.
Date: .. .J.4. \ Q.e?\ .~OO ...
Through Him (GO~) all things were made; without Him nothing was made that has
been made.
John 1:3
I desire to do your will, a my God; your law is within my heart.
Psalm 40:8

to my loving parents
(- -_. (
ACKNOWLEDGEMENTS
I wish to express my grateful thanks to a number of people and an institution that
supported and helped me made this study possible:
Prof. M.C. Laker, my supervisor from the University of Pretoria, for his assistance
and guidance.
Dr. C. BOhmann, my supervisor from the Agriculture Research Council (ARC
ISCW), for her guidance, patience and encouragement.
The ARC - !SCW, for financing the project and supplying the research facilities.
My parents, family and friends for being there for me.
My Maker for His love and mercy so that I could persist.

CONTENTS
ACKNOWLEDGEMENTS........ ............. ... ........... .......... ............. ........ ... .. ....... ...... ........ .. ... i
LIST OF TABLES .. .. ..... .. .... ...... ....... .. ......... ........... .. ......... ........... ............ .......... .... .......... v
LIST OF FIGURES ..... .. .......... ........ ... ... ......... .... ........ .. ..... .. .... ...... ..... ... ........ ... ........ ... .....vi
ABSTRACT........... ... ...... .............. ....... .. ..... ... ...... ... .... ....... .... .. .... ........... .. ....... ... ........... . viii
UITTREKSEL..... .... ........ ... ....... .. ........... .. ...... ....... ................................ .. ......... .. ..........x
CHAPTER 1 INTRODUCTION........ .. ........ ...... .......... .. .......... .. ..... .... .. .. ......... .. ..... 1
1.1 GENERAL.... .... .............. .. ..... .. .... .. ..................... .. ............. ...................... .... 1
1.2 PEDOGENESiS................ .. ......... .. ......... .. ............ .. .... ..... .............. ........ ... .. 3
1.3 CLAY MINERALOGy ..... ................ .. .......... .. ...... ..... ...... ...... ........... ..... ...... .. 5
CHAPTER 2 MATERIALS AND METHODS .. ........ .. ............ .. ...... .. .... .. ....... .. ........8
2.1 COLLATION OF FIELD DATA. .......... .. .. .. ........... .. ......... .. ..... .... .. .. ..... .. .......8
2.2 PHYSICAL ANALySES .... ......... ....... ..... ..... ........ ... ........... ....... .. .... .......... . 14
2.2.1 Particle size analyses ....... .. .......... .. ................................. .. ......... .. .14
2.2.2 Plasticity index .... .. .... .. .......... .. .......... .. ........ .. ...... ..... .. .......... ... ....... 14
2.3 CHEMICAL ANALySES .................................... ......... .. .... ....... .... ...... ..... ... 15
2.3.1 Cation exchange capacity ...... .. ........................ .. ......... .. ... ........ ...... 15
2.3.2 Citrate-bicarbonate-dithionite extractable cations .... .. .. .... ......... .. .. 15
2.3.3 Organic matter content.. ..... .. ....... .... ............................ ..... ............. 15
2.3.4 pH... ... .. ... .... ........ ... ... .. ...... .. ......... .. .......... ........... ..... ...... ...... .......... 16
II

2.4 MINERALOGICAL ANALySES ...... ......... , ....... .... ............ .. ................. ....... 17
2.4.1 Separation of the clay fraction ... .... ..... ..... ........ ... ...... .. ...... ..... ........ 17
2.4.2 Clay saturation and solvation treatments ............. ..... .... ........ .. .......17
2.4.3 Intercalation with dodecylammoniumchloride ... ...... .. ........... ......... . 18
2.5 CRITERIA FORTHE INTERPRETATION OF DIFFRACTOGRAMS.... ... 18
2.5.1 Mineral identification .. ........ .. ......... ........ .. ..................... ............ ...... 18
2.5.2 Determination of layer charge characteristics of swelling clays .... .20
CHAPTER 3 RESULTS AND DiSCUSSiON ... ............. ........ ..... .. .......... .. ....... .. ...22
3.1 GEOGRAPHIC DISTRIBUTION OF SOILS WITH MELANIC
HORiZONS... ... ........ ................... ..... .... ................. .. ............. .. ........ ... ...... ..22
3.2 SOIL FORMING FACTORS ... ...... ........... .. ....... ....... ... ...... ........... .. ....... .....22
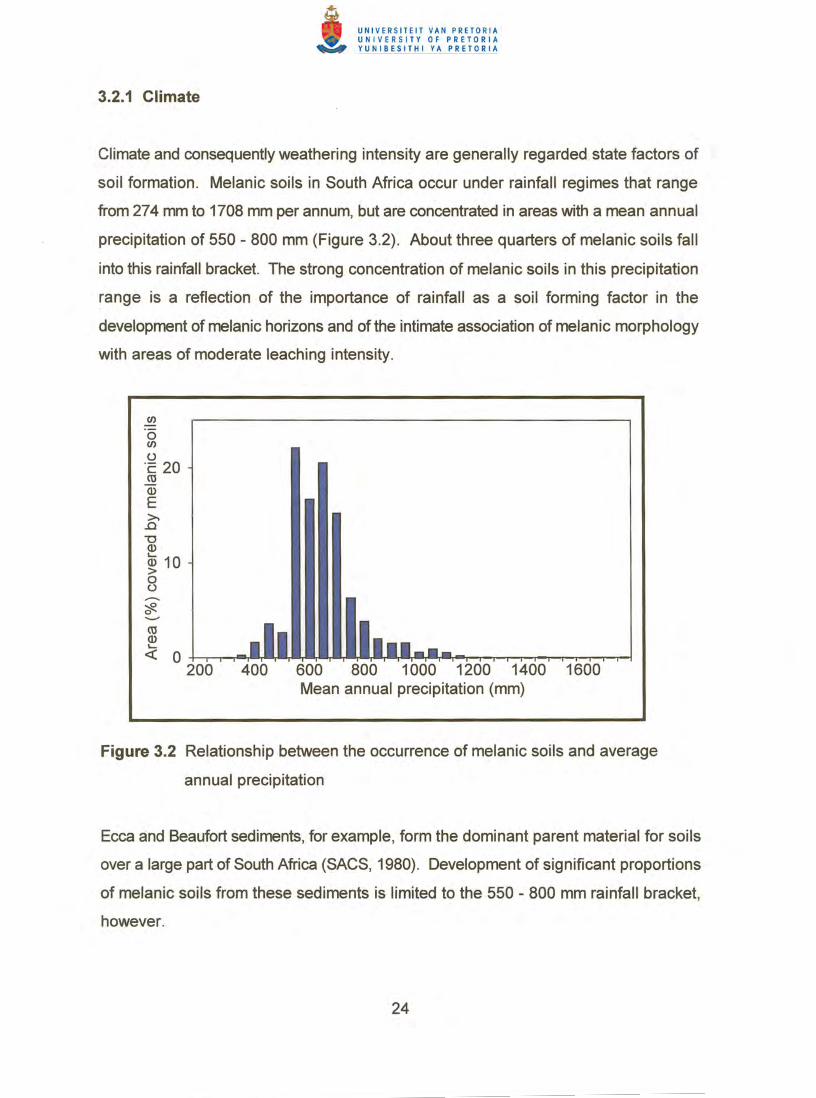
3.2.1 Climate.. ................ ......... .. ........ ... ........... .. .......... .. ......... .. .... ........... 24
3.2.2 Parent materiaL ......................... .......... .. ...................... .. ......... .. ......27
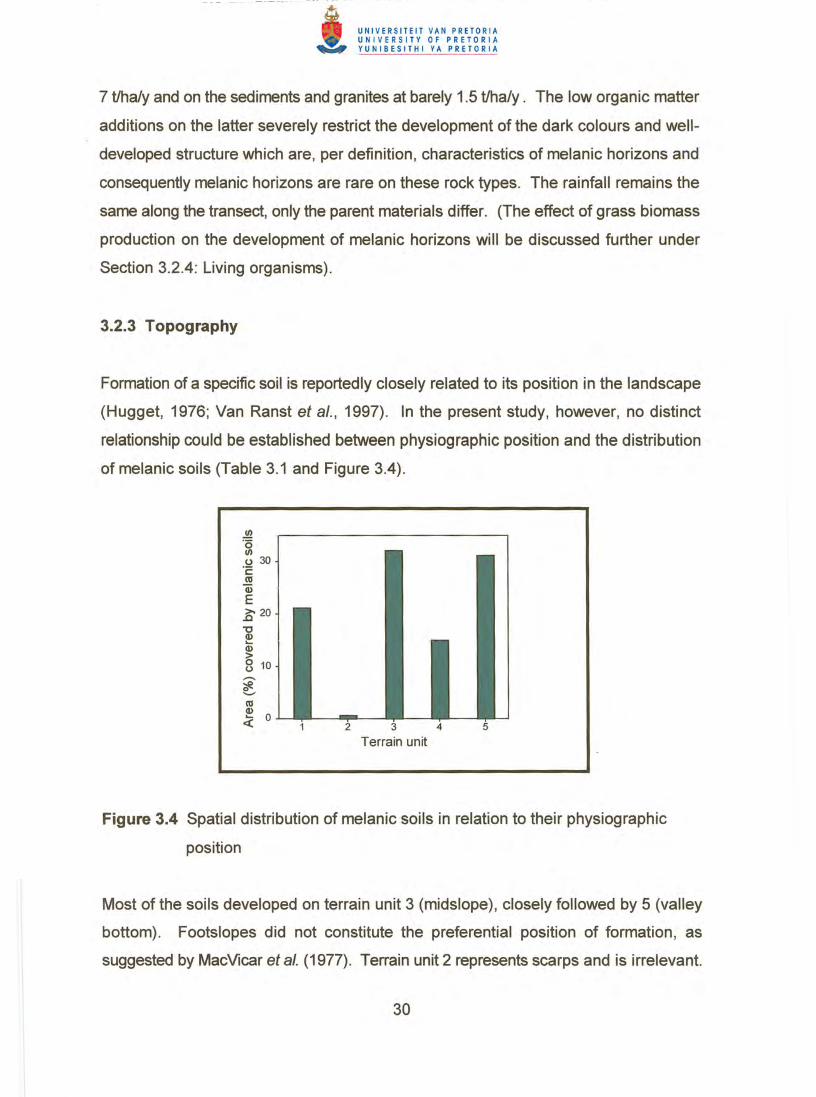
3.2.3 Topography............... .. ........ .... ......... ... ...................... .. ......... .. .... ....30
3.2.4 Living organisms .... ........ ... ........ .. .. .. ........... .. ........ .... ... .......... ........ . 31
3.2.5 Time....... .... ....... ... .......... ... ..... ...... ..... ..... .... ..... .. .............. ... ...... .... .. 31
3.3 MINERALOGICAL ANAL YSES .......... ......... .. .............. ... ........ .. ....... ........ .. 32
3.3.1 Clay mineral associations ... .. ...... ..... ... .......... ... ...... ... .. ... ...... ... ....... 32
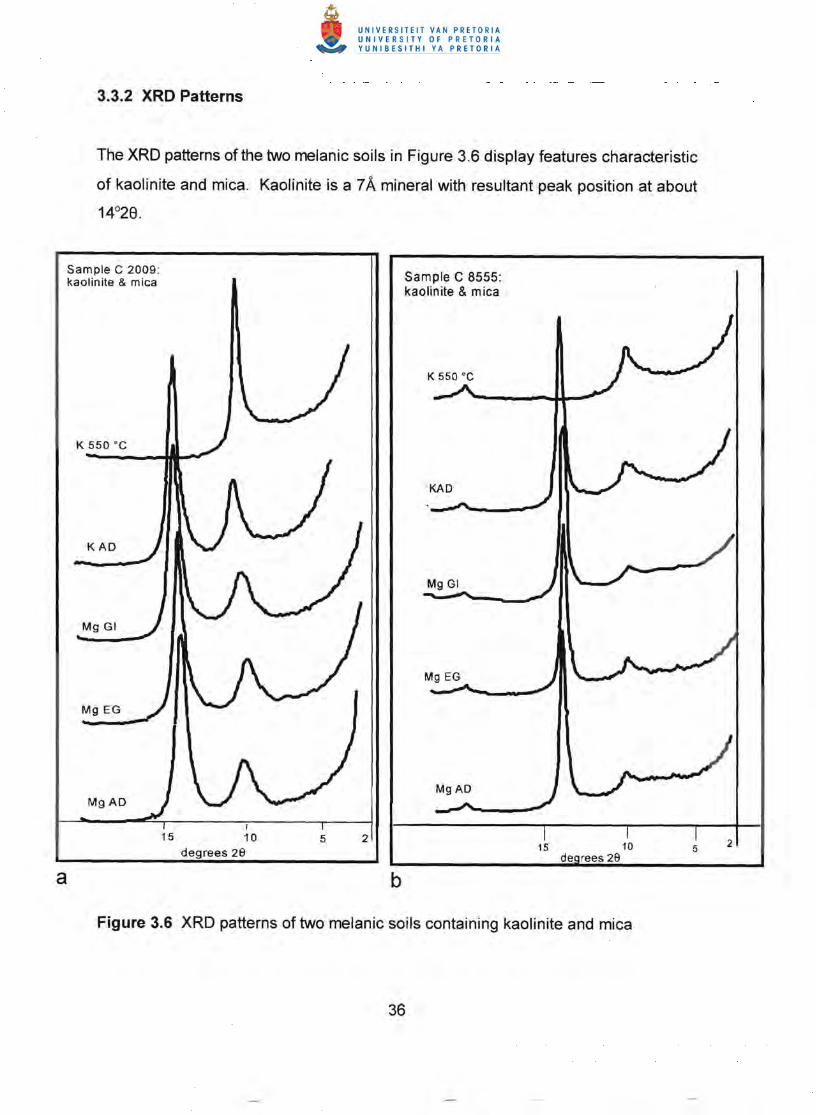
3.3.2 XRD patterns....... ... ........... .. ........... .. ....... ..... ..................... ....... ..... 36
3.3.3 Layer charge characteristics ..... .. .......................... ......... .. ...... ... .... .43
3.3.4 Implications of the clay mineralogical data for soil classification
in South Africa .. ......... ...... .......... ........ .... ...... ..... ........ .... ....... ... ...... . 48
3.4 PHYSICAL ANALYSES ..... .. .......... ...... ....... ... ... ................. .......... ... .... ..... . 50
3.4.1 Particle size distribution .. .. ..... .................. ... ..... ... ... .... .... ...... ...... .. .. 50
3.4.2 Plasticity index .. ........... ... .... ....... .. ......... .. ...... .... .. .......... ................. 51
3.5 CHEMICAL ANAL YSES ......... ........ ... ........... .. ............ .. ......... ... .... .... ... ......53
3.5.1 Cation exchange capacity and exchangeable bases ... ........ .. ....... . 53
3.5.2 Citrate-bicarbonate-dithionite extractable cations .. ........ ... .... ...... .. 55
3.5.3 Organic Matter ... ............ .. ....... .... .......... .. ........... .. ........... ............... 56
3.5.4 pH... ... .............. .. ......... .. ........... .... ........ ... ............................... ... .....56
iii

CHAPTER 4 CONCLUSiONS...... .. ... .... ........ ... ..... ................ ......... ... .. .. ....... ... .... 57
REFERENCES...... .......... ... ..... .. ..... ... ................ .. ..... ... ..... ... ........... .. ....... ...... ........ ......... 58
APPENDiXES.... ... .......... ........ ..... ........... ... .......... ....... ............... .. .. .. ...... ........ ... .... .. ..... .. 64
Appendix 1 Classification and soil forming factors of melanic soils from South
Africa.. ............ ............ ... ...... ..... .. ......... ........ ... .... ........ ... ..... .... .......... ........ 65
Appendix 2 Selected soil physical and sesquioxide characteristics of melanic soils
Appendix 5 Soil profiles identified as melanic based on field evidence, that
in South Africa ... ...... .......... .. .. .... ...... ... ........... .. .. .. ...... ......... ........ .. ........... . 67
Appendix 3 Selected soil chemical properties of melanic soils ............... ....... .. ...... .... . 69
Appendix 4 Clay mineral associations in melanic soils of South Africa ... .... ... ........ .... 71
classify as vertic or humic according to PI or CEC, respectively ..............73
Appendix 5.1 Classification and soil forming factors of the soils ... .... ... .. ..73
Appendix 5.2 Selected soil physical and sesquioxide characteristics
of the soils ... .. ........ ......... ... .. .................... ... ................... .... .. 73
Appendix 5.3 Selected soil chemical properties of the soils .... .... ....... ...... 74
Appendix 5.4 Clay mineral associations in the A horizons .. ... .. ... ....... .. ....74
iv

LIST OF TABLES
Table 2.1 Subdivision of soils with melanic A horizon into forms, based on
diagnostic subsoil horizons and materials, according to Soil Classification:
A Binomial System for South Africa .. ......... .......... .. ........ .. ... ............ ... .. .......8
Table 2.2 Criteria for subdivision of melanic soils into forms and series and number
of modal profiles available .............. .... .. ....... ........... ... .......... ....... ... .. ..... .. .. 11
Table 2.3 X-ray identification criteria of 14A minerals.... ... ........ .. ... .. ..... ............ .. .....20
Table 3.1 Interrelationship between topographic position and the percentage of
melanic soils, developed a) from different parent rocks and b) under
different climatic conditions ........... ... ....... .. ......... .... .......... ...... ... ... .. ......... . 27
Table 3.2 Distribution of melanic soils in relation to parent materiaL .. .. ....... .... ....... 29
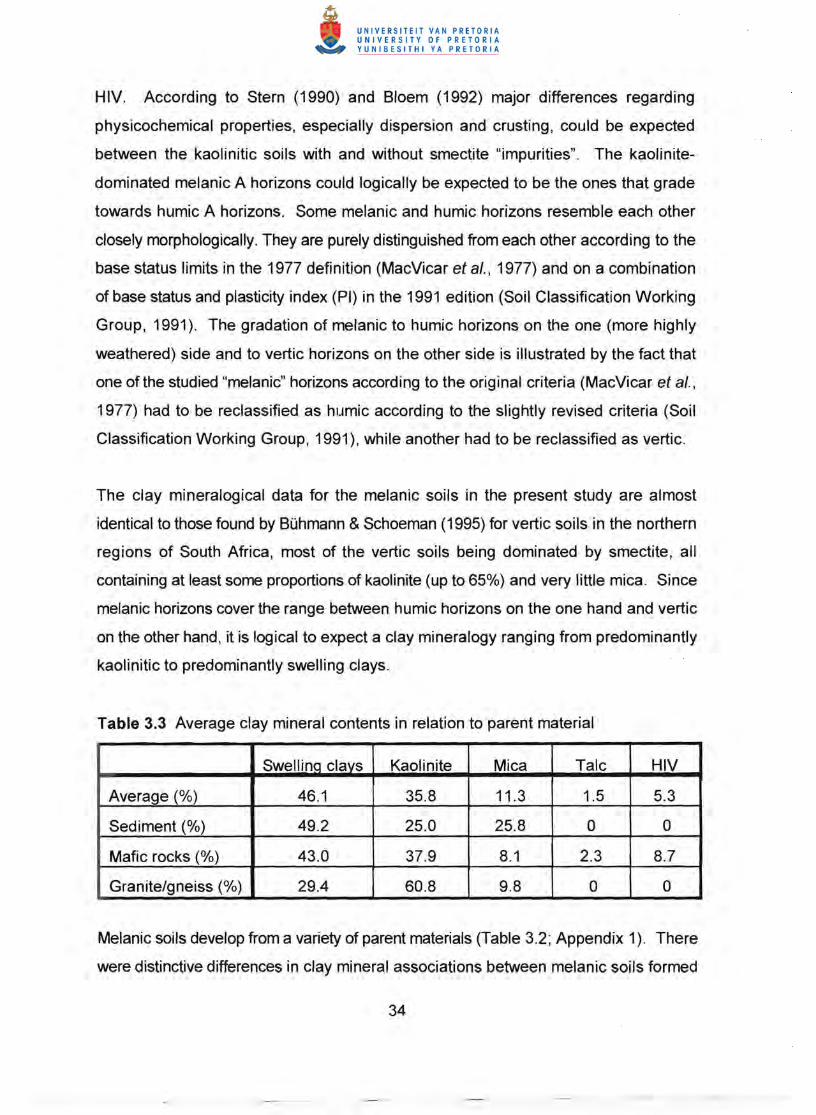
Table 3.3 Average clay mineral contents in relation to parent material. .. ... ... .. ... .. ... .34
Table 3.4 Characterisation of swelling clay minerals in the melanic
horizons studied .. ......... ........ .... .. .......... ... ........... ......... ......... .. ............. ..... 4 7
v
LIST OF FIGURES
Figure 1.1 Relationship between melanic A horizons and the other diagnostic A
horizons in the South African soil classification system .............. .......... ..... 2
Figure 3.2 Relationship between the occurrence of melanic soils and average
Figure 3.3 Distribution of mean annual preCipitation in the 550 mm - 800 mm range
Figure 3.4 Spatial distribution of melanic soils in relation to their physiographic
Figure 3.7 XRD pattern of a melanic soil containing pedogenic chlorite and
Figure 3.8 XRD patterns of two melanic soils containing smectite, associated with
Figure 3.9 XRD patterns of two melanic soils containing smectite and vermiculite,
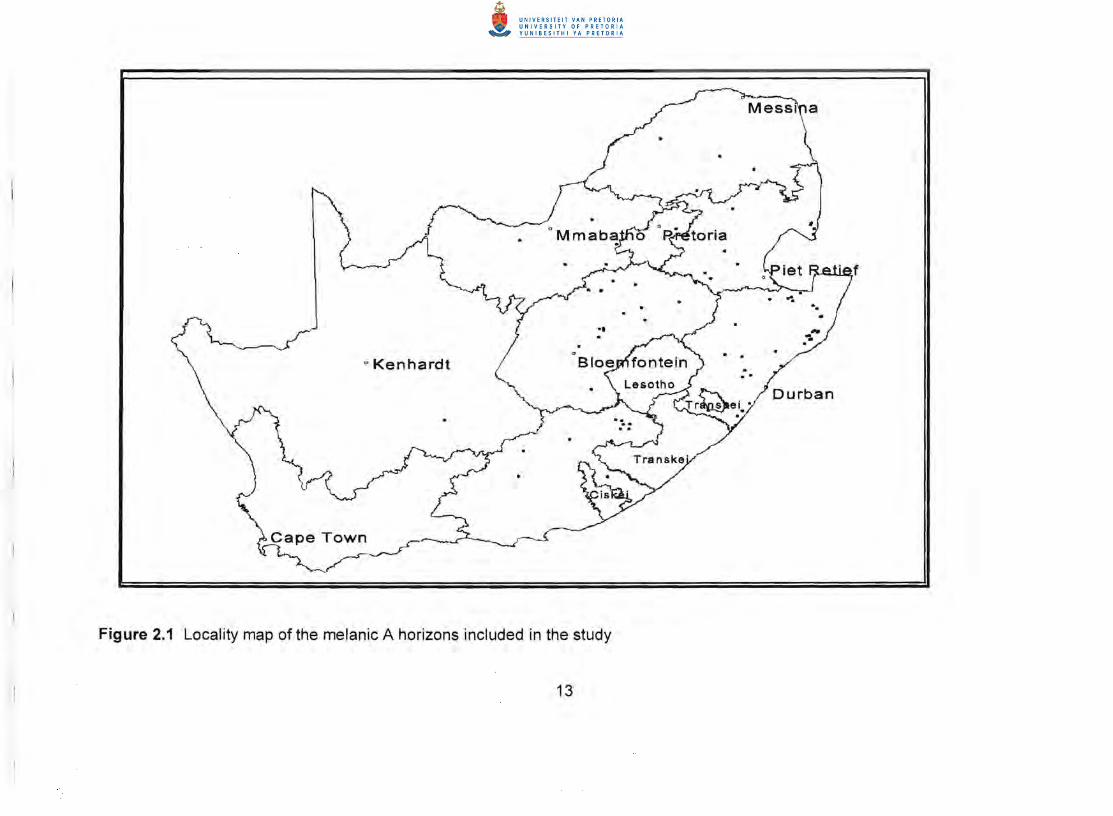
Figure 2.1 Locality map of the melanic A horizons included in the study ..... ............. 13
Figure 3.1 Geographic distribution of melanic soils in South Africa .... .......... ............ 23
annual precipitation .............................. .... ............ ................. ..... .............. 24
in South Africa ...... .... ............... .. ......... ...... ... ....... ..... ................................ 25
position...... .............. ...... .............. .. ...... .... ..................... ... ........... ... ...... .....30
Figure 3.5 Clay mineral associations in melanic A horizons from South Africa .........32
Figure 3.6 XRD patterns of two melanic soils containing kaolinite and mica.............36
kaolinite......................................................... .. ....... .. ..... .. ............. ... .........38
a) kaolinite and traces of mica; b) kaolinite and talc.................................39
associated with a) kaolinite and talc and b) traces of kaolinite ...... .... .40
VI
Figure 3.10 XRD pattern of a melanic soil with kaolinite displaying a high
background...............................................................................................41
Figure 3.11 XRD patterns of a melanic soil containing a 10Alswelling 14A
interstratification, associated with small amounts mica and traces of
kaolinite .................................................................................................. .
Figure 3.12 Textural characteristics of horizons identified as melanic from field
evidence ..................................................................................................50
Figure 3.13 Relationship between PI and clay in the melanic A
horizons.................................................................... . ............................ 52
3.14 Relationship between and percentage swelling clays in the melanic
A horizons................................................................................................52
Figure 3.15 relationship between the per unit and the percentage
swelling in the clay fraction of melanic A horizons ..........................53
Figure 3.16 Exchangeable Na, Ca and Mg + K percentages in the melanic A
horizons studied ..................................................................................... .
VII

ABSTRACT
The melanic horizon is one of five diagnostic topsoil horizons distinguished in the South
African soil classification system. Melanic soils span a wide spectrum, ranging from
those that intergrade with a vertic to those that intergrade with a humic horizon.
Melanic soils are therefore expected to vary considerably with respect to a variety of
physical, chemical and clay mineralogical properties. During the course of an
extensive land type survey, 89 profiles with melanic A horizons have been sampled and
described. The correlation and combination of these data, however, is still missing.
It was therefore the objective to a) translate information on climate, relief and parent
material into a pattern of melanic soil distribution characteristic of South Africa, and
b) to determine the clay mineral compositions of melanic horizons from a large number
of modal profiles and to establish to what extent melanic soil properties are related to
clay mineralogy. Special emphasis was placed on the characterisation of the clay
fraction in terms of group and species identification. X-ray diffractometry was employed
almost exclusively as the investigative technique in mineral identification and
quantification.
Results showed that melanic soils cover a small area of South Africa « 2%) and that
their formation is favoured by an annual precipitation of 550 - 800 mm. The annual
precipitation affects the two properties which are a prerequisite for classification into
the melanic soil group, i.e. dark colour and structure/high base status, in different ways.
Less rainfall retards OM formation/preservation and prevents development of dark
colours. Unless the parent material is of a very low permeability a rainfall of >800 mm
results in a degree of weathering, which is too advanced for the development of soil
structure and the relatively high base status characteristic of melanic soils.
Although climate had an overriding influence on the distribution of melanic soils,
topography and parent material played their part. As the annual precipitation reaches
750 - 800 mm, like in the Highveld, melanic soils form predominantly from
mudstone/shale lithologies i.e. a parent material, which is clay textured, smectite-rich
and therefore of low permeability. This combination of textural and mineralogical
viii
characteristics reduces the degree of leaching and promotes melanic soil formation in
areas of relatively high rainfall and on up-slope positions.
The melanic A horizons showed a large degree of variation in regard to their clay
mineral associations. More than half of them were dominated by smectite, 32% by
kaolinite and the rest by an association of about equal proportions of mica, kaolinite
and smectite. Talc and hydroxy-interlayered vermiculite occurred in a number of soils
while one horizon was dominated by an illite/smectite interstratification. The smectite
component was identified as belonging to the beidellite or vermiculite species,
depending on the method employed. Only about a quarter of the smectitic soils also
contained montmorillonite but not as the dominant swelling phase.
Key wards: melanic soils, clay mineralogy, soil forming factors, layer charge
ix

UITTREKSEL
Die melaniese horison is een van vyf diagnostiese bog rand horisonte wat in die
Suid-Afrikaanse grandklassifikasie stelsel onderskei word. Omdat melaniese gronde
se omvang van die vertiese tot by die humiese horisonte strek, kan verwag word dat
melaniese grande baie sal verskil ten opsigte van fisiese, chemiese en
kleimineralogiese eienskappe. Tydens In uitgebreide landtipe opname is 89 prafiele
met melaniese A horisonte beskryf en grandmonters is daarvan geneem. Die
grandmonsterdata is egter nog nie gekorreleer en gekombineer nie. Die doelwitte van
die prajek was om a) die klimaat, relief en moedergesteente wat karakteriserend van
melaniese grand van Suid-Afrika is, te gebruik om In verspreidingspatroon te verkry en
b) om die kleimineraalsamestelling van die melaniese horisonte (afkomstig van In graot
aantal modale profiele) te bepaal en om vas te stel tot watter mate melaniese
grondeienskappe verwant is aan die kleiminerale. Aandag is gegee aan die
karakterisering van die kleifraksie in terme van groep en spesie identifikasie. X-straal
diffraktogramme is gebruik om die minerale te identifiseer en kwantifiseer.
Resultate het getoon dat melaniese gronde slegs In klein area van Suid-Afrika bedek
«2%) en dat die vorming van die grande begunstig word deur In jaarlikse presipitasie
van 550 - 800 mm. Die jaarlikse presipitasie be·invloed die twee einskappe wat
noodsaaklik is vir klassifikasie in die melaniese grondgroep, nl. donker kleure en
struktuur/hoe basis status, op verskillende maniere. In Jaarlikse reenval van
550 - 800 mm bevorder vorming van melaniese gronde. In Laer reenval vertraag
organiese materiaal vorminglbehoud en voorkom ontwikkeling van donker kleure. Met
In reenval van> 800 mm sal die graad van verwering te gevorderd wees vir die
omtwikkeling van grandstruktuur en In relatief hoe basis status (beide karakteriserend
vir melaniese gronde), tensy die moedergesteente In baie lae permeabiliteit het.
Allhoewel klimaat 'n oorheersende invloed het op die verspreiding van melaniese
gronde, speel topografie en moedergesteentes wei In rol. Wanner die jaarlikse
presipitasie 750 - 800 mm bereik, soos in die Hoeveld, vorm melaniese grande
hoofsaaklik van moddersteen/skalie, dit wit se In moedergesteente met In klei tekstuur,
smektietryk en dus grande met In lae permeabiliteit. Die kombinasie van 'n klei tekstuur
x

en smektitiese eienskappe verlaag die graad van loging en bevorder die vorming van
melaniese grande in gebiede met In relatiewe hoe reenval en op bo-hellings.
Die melaniese A horisonte vertoon In variasie met betrekking tot die kleimineraal
samestelling. Meer as die helfte van die gronde het smektiet as dominante
kleimineraal, kaoliniet is in 32% van die gronde dominant tewyl die res met In
assosiasie van gelyke dele mika, kaoliniet en smektiet domineer. Talk en hidraksie
tussengelaagde vermikuliet het in In paar van die gronde voorgekom, terwyl een
horison gedomineer word deur tussengelaagde illietlsmektiet.
Die smektiet komponent is ge·identifiseer as behorende aan die beidelliet of vermikuliet
spesies, afhangende van die metode wat gebruik is vir die bepaling. Slegs 'n kwart van
die smektitiese grande het ook montmorilloniet bevat, maar nie as 'n dominante
swellings-mineraal nie.
Sleutelwoorde: melaniese gronde, kleimineralogie, grondvormings faktore, laaglading
XI

CHAPTER 1
INTRODUCTION
1.1 GENERAL
Resource surveys are largely driven by the need to improve agricultural production and
much time and emphasis is devoted to studies of soil classification in relation to land
use practices. The South African land type survey follows the above trend and is
described as "a systematically compiled inventory of the natural factors that determine
agricultural potential". This aspect, i.e. the optimum use of land for the production of
biomass in agriculture and forestry, is a major challenge in South Africa, with its
relatively poor land resources.
In more recent times the considerable volume of information, which is available from
extended land type surveys, has been used increasingly for answering practical
questions, put forward not only by farmers but by an array of stakeholders including
engineers, environmentalists, mining industries, regulators and planners. These new
areas of application of soil research require the input of additional soil information
which must go beyond soil taxonomy. They need information on differences and
similarities in specific soil characteristics between different soil taxa and the range of
properties within a specific taxon. Soil surveys must therefore provide the required
information for decision making regarding the suitability of a given area for a specific
land utilization type.
Well defined diagnostic horizons form the basis for present-day taxonomic soil
classification systems (Soil Survey Staff, 1998; WRB Working Group, 1998; Soil
Classification Working Group, 1991). For the sake of practical feasibility, diagnostic
horizons are defined in terms of morphological features and easy to conduct physical
and chemical laboratory analyses. Because of cost and time factors clay mineralogical
criteria are not included in the definitions of diagnostic horizons.
1
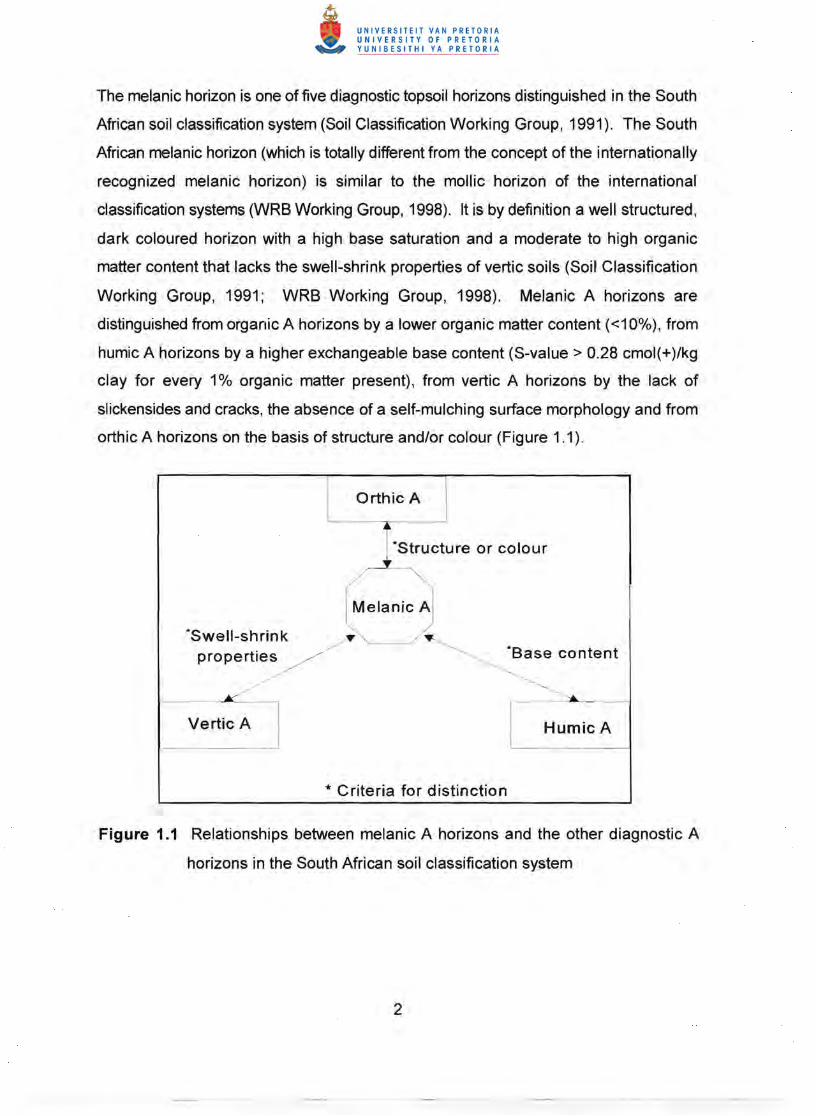
The melanic horizon is one of five diagnostic topsoil horizons distinguished in the South
African soil classification system (Soil Classification Working Group, 1991). The South
African melanic horizon (which is totally different from the concept of the internationally
recognized melanic horizon) is similar to the mollic horizon of the international
classification systems (WRB Working Group, 1998). It is by definition a well structured,
dark coloured horizon with a high base saturation and a moderate to high organic
matter content that lacks the swell-shrink properties of vertic soils (Soil Classification
Working Group, 1991; WRB Working Group, 1998). Melanic A horizons are
distinguished from organic A horizons by a lower organic matter content «10%), from
humic A horizons by a higher exchangeable base content (S-value > 0.28 cmol(+)/kg
clay for every 1 % organic matter present), from vertic A horizons by the lack of
slickensides and cracks, the absence of a self-mulching surface morphology and from
orthic A horizons on the basis of structure and/or colour (Figure 1.1).
Orthic A
·Structure or colour ,
Melanic A
*Swell-shrink / '" pro/ *8ase content
Vertic A Humic A
* Criteria for distinction
Figure 1.1 Relationships between melanic A horizons and the other diagnostic A
horizons in the South African soil classification system
2
In the USDA's Soil Taxonomy (Soil Survey Staff, 1998) and the WRB classification
(WRB Working Group, 1998) the mollic (= melanic) horizon is distinguished from the
umbric (= humic) horizon on the basis of degree of base saturation, the mollic having
a base saturation of more than 50% and the umbric less than 50%.
In South Africa melanic soils do not cover a wide area. They rarely form the dominant
soil group in any area and therefore never feature prominently in broad scale soil maps,
and rarely in large scale maps. Despite their restricted aerial extent melanic soils are
an agriculturally important soil resource. Their favourable physical and chemical
properties, especially the high porosity and available water holding capacity, their
relatively high levels of organic matter (for South African conditions) and nutrients and
near neutral pH values make these soils very fertile.
1.2 PEDOGENESIS
In terms of properties and pedogenic evolution melanic A horizons occupy a central
position between vertic, humic and orthic A horizons. A particular question of interest
concerns the environment for their formation, which can be described in terms of
climate, parent material, topography, vegetation and time (Jenny, 1941). Generally
held hypotheses consider that melanic soils develop under semi-arid to subhumid
conditions from parent materials which are basic or intermediate as regards base
reserve or in landscape positions (usually footslopes) which receive additions of bases
via lateral drainage of water (MacVicar et aI., 1977).
Chemical weathering and leaching processes are essential to soil formation. Climate
is of paramount importance in this regard, particularly the parameters rainfall and
temperature. Annual precipitation determines the amount of water that can percolate
through a soil, leading to leaching and eluviation/illuviation, or that is available as
runoff, which may result in erosion. Under seasonal climates, the water flow may
reverse direction and change to unsaturated upwards flow (capillarity) in the drier
periods of the year. This results in evapotranspiration losses and tends to add
3
materials through chemical precipitation (Richardson et al., 1992). Water is therefore
the most crucial agent in the transformation of a parent material into a specific soil in
most countries of the world . Temperature strongly affects reaction rates and
biochemical processes.
Water movement down the catena is the linkage between soil development and
topography. Soils at the upper part of a toposequence are usually shallow and display
eluvial conditions. They undergo a net soil loss due to erosion. Soils on middle slopes
are subject to lateral eluviation processes, involving both transport of clay in
suspension and dissolved materials. On the lower parts of middle slopes and on
footslopes these lateral losses of suspended and dissolved materials can be very
intense. Constituents and water lost by the upper part of the slope usually accumulate
at the lower part which is rich in clay and usually poorly drained (Hugget, 1976;
Dan et al., 1968). The magnitude of these translocations is dictated by the parent
material, because it is much stronger in sandy materials than where the parent material
leads to the production of a clay-rich matrix.
Parent material constitutes the initial state of a soil system. It determines the bulk of
soluble elements, available for leaching and mineral formation and strongly influences
texture and related porosity/permeability. The latter dictates textural and mineral
element differentiation along the catena. Different parent materials also weather at
very different rates (Chesworth, 1973; Clemency, 1975).
Vegetation is often regarded as the least important of the soil forming factors. This is
probably because there is very much a "hen and egg" relationship between vegetation
and soils, i.e. the type of vegetation is strongly influenced by the nature of the soil while
certain soil properties are strongly influenced by the type of vegetation.
Time is an important soil forming factor, but also the one most difficult to quantify
(Hugget, 1976). Processes of even a mild nature, active over extended periods of time,
have an effect similar to aggressive conditions, prevailing over a short time interval.
4

1.3 CLAY MINERALOGY
Soils, which are morphologically and chemically similar can display drastically different
physical properties due to differences in their clay mineralogical suites (Stern, 1990;
Bloem, 1992). This is not only related to the dominant clay mineralogy, but often to
effects of the presence or absence of small amounts of other clay minerals.
The mineralogical composition of the clay fraction of a soil is one of the critical factors
determining many chemical and physical properties. Not only is there a close
interrelationship between clay mineralogy and the criteria used for differentiating and
classifying soils like base status, or structure, but other soil characteristics like
erodibility, water infiltration capacity, sorption potential for heavy metals and/or
pesticides and herbicides or K-fixation are closely linked to the presence or absence
of certain clay minerals.
The South African soil classification system (Soil Classification Working Group, 1991)
states that "the absence of vertic properties in melanic horizons are usually attributable
to either a lower clay content (than in vertic horizons) or, if the clay content is high, a
predominance of micaceous, vermiculitic or even kaolinitic rather than highly expansive
clay minerals". But preliminary findings by BOhmann (1987) indicate that this statement
may be incorrect as some of the melanic soils had smectite proportions identical to
those of vertisols. As melanic soils range in compOSitional characteristics between the
highly swelling vertic soils at one end and orthic, humic or organic soils at the other
end, it can be assumed that the mineral composition of melanic horizons may display
a considerable degree of variation. Some of them may well be smectite-dominated (in
combination with a high clay content).
Swelling is synonymous with smectite and a large volume of information is available on
the swelling of reference smectites in water. Swelling is generally associated with the
nature of the saturating interlayer cation, electrolyte concentration, amount of fine clay
and layer charge characteristics. Layer charge characteristics include aspects such
5

as the magnitude of the negative charge, its location, i.e. whether it is predominantly
tetrahedral or octahedral (Harward & Brindley, 1965), and charge heterogeneity
(Lagaly et al., 1972), that is whether there are differences in layer charge
characteristics between the two layers that sandwich the interlayer.
All smectites swell, i.e. their c spacing changes with treatment. The extent of swelling,
however, may vary dramatically. In smectites with a high layer charge and divalent
cations in interlayer positions the unit cell distance changes from 15A in the air dry
state to about 18A, when fully dispersed in water. In smectites with a low layer charge
and monovalent counterions, however, dispersion may result in an increase in the c
spacing from 12.4A to> 1ooA. Only the second type of smectite will display a high
degree of physical swelling. In the first type, little expansion may be noticed as
smectite in a soil generally does not reach the fully dispersed and sometimes also not
the air dry state. Some smectites, consequently may show little change in their
interlayer distance and thus in their swelling capacity, while others may be extremely
expansive.
An impressive amount of information concerning the soil forming factors climate, parent
material and relief are contained in the memoirs accompanying land type maps in
South Africa (Land Type Survey Staff, 1984 - 1998), though the collation and
interpretation of these data are sadly lacking. As far as mineralogy is concerned,
however, virtually no basic studies have been conducted on the phyllosilicate
associations of melanic horizons in South Africa .
The objectives of the present study were therefore two fold:
a) to translate information on climate, relief and parent material, obtained from Land
Type Survey Memoirs, into a pattern of melanic soil distribution, characteristic of South
Africa and
b) to determine the clay mineral compositions of melanic horizons from a large number
of modal profiles and to establish to what extent melanic soil properties are related to
clay mineralogy.
6

Results will also contribute to the correctness and reliability of information, provided by
the South African Soil Classification Manual. Knowledge of the reasons for the
non-development of vertic properties in a smectite-dominated melanic horizon will also
aid in establishing causes for highllow swelling, which in turn is fundamental to our
understanding of soil properties that are generally linked with swelling like crusting and
erosion .
7
CHAPTER 2
MATERIALS AND METHODS
2.1 COLLATION OF FIELD DATA
A systematic land type survey, which defined areas into climate, terrain and soil
classes, was initiated at the Institute for Soil, Climate and Water in 1971 and results are
now available in the form of soil maps and accompanying memoirs (Land Type Survey
Staff, 1984 - 1998) for all of South Africa with the exception of the former Transkei and
Ciskei.
Soils were classified in the field according to Soil Classification: A Binomial System for
South Africa (MacVicar et al. , 1977). For soils with melanic A horizons classification
into different soil forms, the higher category in the system, is determined by the nature
of the material underlying the melanic horizon (Table 2.1).
Table 2.1 Subdivision of soils with melanic A horizons into forms, based on diagnostic
subsoil horizons and materials, according to Soil Classification: A Binomial System for
South Africa (MacVicar et aI., 1977)
Topsoil Subsoil Soil Form
Melanic G horizon WILLOWBROOK
Melanic Pedocutanic B unconsolidated
material
BONHEIM
Melanic Soft plinthic B TAMBANKULU
Melanic Neocutanic B INHOEK
Melanic Stratified alluvium INHOEK
Melanic Lithocutanic B MAYO
Melanic Hard rock, etc. MILKWOOD
8

Subdivision of forms into soil series, the lower category in the system, is based on the
clay content (less or more than 35%) and on the absence or presence of lime in the A
and/or its underlying horizon. In the case of the Bonheim form, colour of the B horizon
is also used for series differentiation (Table 2.2).
The number of modal profiles available from the Land Type Survey varies considerably
between different soil forms, probably in relation to the extent of their occurrence.
Some series have not been included into the selection at all while others are
represented by a relatively large number of profiles (Table 2.2).
In the course of the survey 89 profiles with melanic A horizons were sampled of which
all were used for the investigation on the soil textural and chemical properties but only
72 for studies on their clay mineralogy in the present study. The rest could not be
investigated mineralogically as no soil material was available. The profiles are situated
predominantly in the eastern half of the country (Figure 2.1) . Melanic soils are
essentially absent from the semi-arid to arid western part of South Africa.
In the establishment of relationships between soil forming factors and melanic soil
distribution, the total area covered by melanic horizons was taken as the basis for
quantification (land type/climate zone). Results may therefore be different from those
determined on the basis of modal profiles only.
The melanic soil- parent material pattern was established by using only those soils for
which the soil precursor could be positively identified.
Subdivision into families in Soil Classification: A Taxonomic System for South Africa
(Soil Classification Working Group, 1991), the revised version of the South African
binomial system, is based on the presence or absence of lime (a) in the
material/horizon underlying the melanic A horizon in the Willowbrook, Bonheim and
Mayo forms or (b) in the melanic A horizon itself in the Milkwood, Steendal and
Immerpan forms or (c) in or immediately below the melanic A horizon in the Inhoek
9
form. Additional criteria for subdivision into families are B horizon colour and structure
in the Bonheim form, the amount of bedrock in the lithocutanic B horizon of the Mayo
form and signs of wetness in the Inhoek form. The Tambankulu form (a melanic A
horizon overlying a soft plinthic B) of the 1977 classification has been excluded from
the 1991 version due to its scarcity of occurrence while two new forms, Immerpan and
Steendal , have been added. The latter two have soft carbonate or hardpan carbonate
horizons (brittle or solid lime pans) respectively underlying the melanic A horizon.
The sets of diagnostic features used for identification of diagnostic subsoil horizons and
materials underlying melanic A horizons are outlined by MacVicar et al. (1977).
10

Table 2.2 Criteria for subdivision of melanic soils into forms and series and number of modal profiles available
Soil
form
Diagnostic
horizon
underlying A
Soil
series
Clay
(%)
Lime Colour No. of
profiles
investigated
WILLOWBROOK G
EMFULENI 15-35 - 0
SARASDALE 15-35 + 1
WI LLOWBROOK > 35 - 1 I
CHINYIKA > 35 + 0
TAMBANKULU Soft plintic B
FENFIELD 15-35 - 2
LOSHOEK 15-35 + 1
TAMBANKULU > 35 - 0
MASALA > 35 + 0
INHOEK
Stratified
alluvium
or
Neocutanic B
CROMLEY < 35 - 1
INHOEK < 35 + 2
CONISTON > 35 - 0
DRYDALE > 35 + 1
11
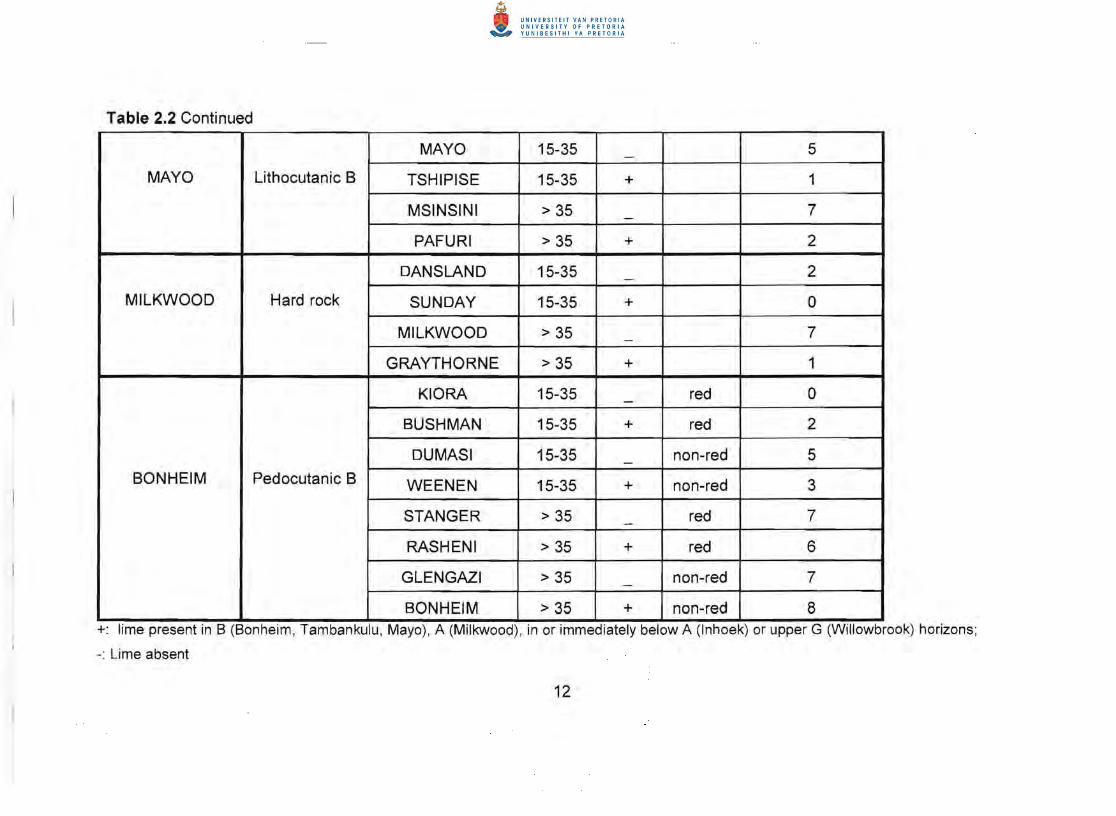
Table 2.2 Continued
MAYO Lithocutanic B
MAYO 15-35 - 5
TSHIPISE 15-35 + 1
MSINSINI > 35 - 7
PAFURI > 35 + 2
MILKWOOD Hard rock
DANSLAND 15-35 - 2
SUNDAY 15-35 + 0
MILKWOOD > 35 - 7
GRAYTHORNE > 35 + 1
BONHEIM Pedocutanic B
KIORA 15-35 red 0
BUSHMAN 15-35 + red 2
DUMASI 15-35 - non-red 5
WEENEN 15-35 + non-red 3
STANGER > 35 - red 7
RASHENI > 35 + red 6
GLENGAZI > 35 - non-red 7
BONHEIM > 35 + non-red 8 +: lime present in B (Bonheim, Tambankulu , Mayo), A (Milkwood) , in or immediately below A (Inhoek) or upper G (Willowbrook) horizons;
-: Lime absent
12
Messina
i.e.f
" Kenhardt
Figure 2.1 Locality map of the melanic A horizons included in the study
13

2.2 PHYSICAL ANALYSES
2.2.1 Particle size analyses
The method of Day (1965) was used to determine particle size distribution. Organic
matter was removed from the air-dried soil sample (10 g) by oxidation with 30% H20 2
(10 cm3). Carbonates were destroyed by adding sufficient 2 moW HCI. The soil
suspension was flocculated with 10% CaCI2 (10 cm3) , suction filtered and soluble salts
leached from the soil. Dispersion was accomplished by means of stirring (7 000 rpm
for 10 min). On soils where dispersion was inadequate, a sodium hexametaphosphate
dispersing agent (Calgon; 10 cm3) was used.
Clay « 2,um) and silt (2 - 20,um) were determined by sedimentation and pipette
sampling. The sand fractions, fine (0 .02 - 0.2 mm), medium (0.2 - 0.5 mm) and coarse
(0.5 - 2 mm) were determined by dry sieving.
Results are expressed as a percentage of the mass of oven-dried soil. All size
fractions were determined individually, i.e. none were estimated by difference.
2.2.2 Plasticity index (PI)
The method using the SA Standard Casagrande cup for determining the PI was applied
(TMH 1, 1986).
14
2.3 CHEMICAL ANALYSES
2.3.1 Cation exchange capacity (CEC)
The soils were saturated with LiCI and then washed with 150 cm3 of BO% ethanol added
in 3 - 4 portions allowing complete drainage between portions. The soil was then
transferred with the filter paper to an BOO cm3 beaker and 500 cm3 of 0.25 M Ca(N03)2
solution was added. The suspension was heated in a water bath at BO - 90°C for
30 min and stirred at intervals to completely disintegrate any aggregates.
The suspension was filtered through a Buchner funnel until suction drainage was
complete. Lithium was determined in the filtrate by flame photometer and expressed
in me/kg soil at pH B.
2.3.2 Citrate-bicarbonate-dithionite (CSO) extractable cations
Extraction was carried out by adding 200 cm3 Na-citrate/bicarbonate buffer (pH B.5)
solution (0.3 moll! Na-citrate and 1.0 moll! NaHC03), shaking the sample into
suspension, adding about 10 g Na-dithionite and allowing it to react, with intermittent
stirring on a water bath at 70°C. After the colour change (about 30 min), the
suspension was centrifuged and the citrate dithionite extract poured off into pre
weighed plastic bottles. After a further washing with 200 cm3 Na-citrate/bicarbonate
solution and centrifugation, the supernatant was added to the plastic bottles.
Iron, manganese and aluminium were determined in the extract by atomic absorption
and results recorded as per cent (mlm) Fe, Mn and AI on a soil « 2 mm) basis.
2.3.3 Organic matter content (OM)
The OM content was determined by a slightly modified Walkley-Black method as
described by Allison (1965). The soil was ground to pass a 44 mesh (approx.
0.355 mm) sieve. Masses of 0.5 g, 1 g or 2 g soil were used, depending on the amount
of carbon present and 15 cm3 concentrated H2S04 were added. An amount of 196 g
15

(NH4)2Fe(S04h6H20 plus 5 cm3 concentrated H2S04was made up to 11 to replace the
ferrous sulphate o-phenanthroline monohydrate solution used to back-titrate the
unreacted K2Cr20 7 (initially 0.5 mol/f').
2.3.4 pH
Two pH measurements were conducted, one on a 1 :2.5 soil to water suspension and
one on a suspension prepared by adding 75 cm3 0.01 moi/lCaCI 2 solution to 15 g soil.
In both instances, suspensions were stirred intermittently for 15 min and allowed to
stand for at least 1 hour. The electrodes were positioned in the supernatant liquid.
16

2.4 MINERALOGICAL ANALYSES
2.4.1 Separation of the clay fraction « 2 lim)
The methods described by Jackson (1956) were modified to facilitate the handling of
a large number of samples. All samples received the same pretreatment. Sufficient
soil to yield between 6 and 12 g clay was weighed into a plastic 500 cm3 centrifuge
bottle and treated with 200 cm3 1 moll! NaOAc (buffered at pH 5) in a water bath at
70°C with intermittent stirring to dissolve carbonates. After centrifugation, the NaOAc
was decanted and discarded. The treatment was repeated to extract as much
carbonate as possible. The OM was removed by adding 50 cm3 30% H20 2 . After the
initial vigorous reaction had subsided, the removal was brought to completion on a
water bath. The procedure was repeated with 20 cm3 H20 2 for most soils, and with
50 cm3 for soils rich in OM. The peroxide treated samples were then shaken by hand
in 300 cm3 1 moll/NaCI, centrifuged, and the supernatant was decanted. About 500 ml
of distilled water was added to the flocculated soil. After being shaken horizontally for
half an hour, the samples were centrifuged for 5 min at 750 rpm. The individual clay
fractions were decanted into glass bottles. A total of 5 cycles of treatment were
conducted.
2.4.2 Clay saturation and solvation treatments
Clay fractions were rendered homo-ionic by shaking in a chloride solution of the
desired cation , then left to equilibrate overnight. Cations were used in the following
concentrations: Mg and K - 1 molldm3; Li - 3 molldm3
. The flocculated clay was freed
of excess salt by repeated centrifuge washings and orientated specimens were
prepared on a ceramic tile by the suction-through method (Gibbs, 1965).
Mg-saturated samples were X-rayed in the air dry state as well as after solvations with
ethylene glycol (vapour at 60°C for 24 h) and glycerol (vapour at 80°C for 24 h; Novich
and Martin, 1983) to establish expansion characteristics of the clay minerals.
Patterns of K-saturated samples were recorded in the air-dried state and after heating
17

to 550°C for at least 4 hours.
The clay fractions, saturated with LiCI, were heated at 280°C for a minimum of 4 hand
solvated with ethylene glycol before being X-rayed (Greene-Kelly test) .
2.4.3 Intercalation with dodecylammoniumchloride
Dodeacylamine (to give a final concentration of a 0.1 M solution) was dissolved in a
small amount of ethanol. A water:ethanol mixture (1 :1) was slowly added, avoiding
intense clouding, and the pH adjusted to 6 - 7 with HCI (Lagaly, 1979). A 7.5 cm3
aliquot of this dodecylammoniumchloride solution was added to about 30 mg of clay.
The suspension was heated at 65°C for two days, the solution being replaced after one
day. Excess dodeoylommoniumchloride was removed by '10 washings with a water
ethanol (1: 1) mixture and one final washing with pure ethanol. The paste was then
sucked through a ceramic tile for orientation, dried at 65°C and stored in a desiccator.
2.5 CRITERIA FOR THE INTERPRETATION OF DIFFRACTOGRAMS
X-ray diffraction (XRD) analyses were carried out on a Phillips X-ray diffractometer with
PW 1010/25 generator, PW 1050/25 goniometer and AMR 3 - 202 graphite
monochromator, using Fe-filtered Cobalt Ka radiation at 1.0° divergence slit with a 0.1 °
receiving slit, and a proportional counter. Standard experimental conditions were
45 kV and 40 rnA and a scanning speed of 1°28/min. Oriented specimens were
scanned from 2 to 35°28.
2.5.1 Mineral identification
The identification of various clay minerals is based on the position and possible shift
of a series of basal reflection, applying auxiliary tests (Bailey, 1980). Generally a
discrete mineral must give a rational series of basal reflection with
doos x 5 = doo4 X 4 = doo3 X 3 = do02 X 2 =doo1 (A) with a low background to both sides of
the peak maximum.
18

The following basal spacings were selected as being characteristic of individual clay
minerals:
Mica: A 10A (9.8°28) spacing which did not change with any of the treatments applied.
Talc: A 9.3A (11 °28) spacing which did not change with any of the treatments applied.
Kaolinite: A 7 A basal spacing (14°28), independent of saturating cations or solvation
with ethylene glycol or glycerol. The peak disappeared, however, on heating to 550°C,
as kaolinite is transformed into X-ray amorphous metakaolinite at temperatures above
500°C.
Hydroxy-inter/ayered vermiculite (HIV) also referred to as pedogenic chloride: A 14A
mineral (7°28) spacing (Table 2.3), independent of solvation with ethylene glycol or
glycerol, and saturation with K. On heating to 550°C a very broad shoulder forms
between 10A and 14k HIV is positioned in the mineral classification scheme
somewhere between swelling clay minerals and chlorite, having the lack of expansion
typical of chlorite, but peak intensity ratios and charge characteristics of smectites.
Illite/smectite interstratification: A peak position, that migrates between that of mica and
that of the discrete swelling clay phase, depending on proportional characteristics
(Table 2.3).
Vermiculite characterization: A 14A diffraction peak in the Mg saturating state, which
does not expand with either ethylene glycol or glycerol solvation (Table 2.3), but
collapses to 10A after K-saturation.
Smectite characterization: A 15A peak that expands to 17A after ethylene glycol
treatment and mayor may not expand to 18A after glycerol treatments, depending on
the layer charge (MacEwan and Wilson, 1980; Table 2.3). K-saturation generally
results in a decrease to 12.4A and heating to 550°C leads to a 10A peak.
19

2.5.2 Determination of layer charge characteristics of swelling clays (Table 2.3)
Glycerol solvation also permits differentiation of swelling clays on the basis of the layer
charge (Harward &Brindley, 1965): in discretesmectites a high, vermiculite-type layer
charge leads to monolayer formation with glycerol and generally also with ethylene
glycol, while a low, smectite-type layer charge results in bi-Iayer formation with both
solvating agents.
Table 2.3 X-ray identification criteria of 14A minerals
Mineral MgAD Mg EG MgGI G-K C12 KAD K 550°C 0
A
Chlorite 14.2 14.2 14.2 14.2 14.2 14.2 14.0
,HIV 15 15 15 15 15 15 10-14broad
Montmorillonite 15 17 18 9.5 13.6 12.4-15 10
Beidellite 15 17 15/18 17 17.6 12.4 10
Vermiculite 15 15 15 15 >20 10 10
Mg AD - Mg-saturated, air dry;
Mg EG - Mg-saturated, ethylene glycol solvation;
Mg GI - Mg-saturated, glycerol solvation;
G-K - Greene-Kelly test;
- Intercalation with dodecylammonium chloride; C12
K AD - K-saturated, air dry;
K 550°C - K-saturated, heated to 550°C
Greene-Kelly test: The Greene-Kelly (1953) test differentiates dioctahedral smectites
on the basis of the seat of layer charge. After Li-saturation and heating to 280°C,
irreversibly collapsed interlayers denote montmorillonite, while re-expanding interlayers
are ascribed to beidellite. The proportion of montmorillonite interlayers in a smectite
crystal (i.e., in a montmorillonite/beidellite interstratification) was estimated by
comparing the position of the reflection between 0.8 and 1.0 nm from the Mg-saturated,
20

ethylene glycol solvated clay with that of the corresponding peak produced by the
Li-saturated, heated, ethylene glycol solvated material (Reynolds, 1980). Any increase
in the value of this peak is attributed to the presence of irreversibly collapsed
interlayers (montmorillonite) in a smectite crystallite.
Dodecy/amine (e12 ): The dodecylammoniumchloride method permits identification of
interlayer charge density (Lagaly, 1982; Lagaly et a/., 1976). Low-charge
montmorillonites are characterised by basal spacings of 13.6A (mono-layer), beidellites
by 17.sA (bi-Iayer) and vermiculites by >20A (paraffine-type structures).
K-saturation: Measurement of the spacing of the K-saturated, air-dried smectite; a
12.4A line was assumed to be characteristic of beidelite or low-charge vermiculite,
whereas a spacing of 1S.2A was taken to indicate montmorillonite (Machajdik & Cicel,
1981) and a 10A peak was ascribed to vermiculite. A peak position between the two
values was regarded as indicative of charge heterogeneity within the smectite
crystallite, i.e., water monolayer/water bilayer interstratification.
21
; 14 (,,1-Dl /70
blu ?ti1-c,?2.

CHAPTER 3
RESULTS AND DISCUSSION
3.1 GEOGRAPHIC DISTRIBUTION OF SOILS WITH MELANIC HORIZONS
Soils with melanic horizons do not constitute a major proportion of the soils in South
Africa and their aerial extent amounts to only 2.34 million ha or about 2% of the
country. Different regions, however, differ considerably in the percentage of their
melanic soil cover (Figure 3.1). Melanic soils are particularly common (75%) in the
Aliwal North district southwest of Lesotho, and in the eastern Lowveld; while they are
almost absent from the western half of the country (Western and Northern Cape
provinces).
3.2 SOIL FORMING FACTORS
The distinctive features of a soil can be ascribed to a particular set of soil forming
factors (Jenny, 1941). This study aimed a) at identifying the factors that are conducive
for the formation of melanic topsoils and b) to establish the aerial extent and
distribution pattern of melanic topsoils in South Africa.
22


definition for melanic horizons. The higher leaching associated with higher rainfall will
favour the formation of humic topsoils which, per definition, have a lower base status
than melanic horizons. Rainfall below 500 mm on the other hand restricts plant growth
and biomass production and therefore the amount of organic matter added to the soil.
Areas receiving < 500 m rainfall annually closely fit those with an average OM content
of < 0.5% in the A horizon (Scotney & Dijkhuis, 1990). As the annual precipitation
reaches the lower range for the development of melanic horizons, low OM
addition/preservation is obviously the limiting factor preventing the formation of the
dark colours and well-developed structure which are, per definition, required in melanic
horizons. The few melanic soils formed in the 400 - 500 mm rainfall bracket, were
situated on the lower slopes, most of them on valley bottom and footslope positions
(Table 3.1 b), where there is lateral addition of water. Even in the 500 - 600 mm rainfall
bracket a strikingly larger proportion of the melanic horizons are on the valley bottoms
and footslopes than is the case at higher rainfall (Table 3.1 b). In these situations
topography is the co-dominant soil forming factor.
26

Table 3.1 Interrelationships between topographic position and the percentage of
melanic soils, developed
a} from different parent rocks
Parent rock Crest Scarp Midslope Footslope Valley
bottom
%
Basalt 19 1 27 26 27
Dolerite 29 0 45 3 23
Granite 24 0 37 12 27
Sandstone 26 1 44 7 22
I Shale 35 0 47 1 17 b} under different climatic conditions
Annual
precipitation
(mm)
Crest Scarp Midslope Footslope Valley
bottom
%
400 - 500 0 0 11 21 68
500 - 600 6 5 11 28 50
600 - 700 26 1 41 9 23
700 - 800 28 0.5 45 5.5 21
800 - 900 29 0 45 1 25
900 - 1000 31 0 45 0 24
1000 - 1100 29 0 42 10 19
3.2.2 Parent material
Rock type has a profound influence on soil formation, governing parameters like texture
and availability of bases (Barshad, 1966; Clemency, 1975). The influence of precursor
material on soil characteristics increases with decreasing degree of weathering (Eberl,
1984). In the present study melanic soils were associated with parent lithologies as
contrasting as ultramafic rocks and wind blown sand. Mafic and sedimentary rocks,
27

however, were identified as the dominant substrata from which more than 37% and
44%, respectively, of the melanic soils developed (Table 3.2).
The data presented in Table 3.2 do not give a true reflection of the preferential
development of melanic horizons from specific parent materials. It is largely masked
by the large differences in the aerial extent of the different geological materials.
Comparisons between dolerite (and other mafic rocks) on the one hand and Karoo
siltstones, mudstones and shales on the other hand, clearly illustrate this. Dolerite
intrusions in total cover very small areas compared with the Karoo siltstones,
mudstones and shales, and even the Karoo sandstones, and yet dolerite is the most
common precursor for the formation of melanic horizons (22.65%).
At a local scale the difference can be very striking. In the sub-humid/semi-arid parts
of the central Eastern Cape (former Ciskei) melanic horizons are, for example, directly
associated with dolerite, while bleached, massive orthic A horizons are found on the
Karoo mUdstones and shales which dominate the area. A striking regional example of
the preferential development of melanic horizons from mafic rocks is found in the
eastern Lowveld of Mpumalanga and the Northern Province (Figure 3.1). The narrow
strip with high melanic horizon incidence, running from the Swaziland border to the
Zimbabwean border, is associated with a strip of basalt, with much lower occurrence
of melanic horizons on the Karoo sediments and granites to the west of it.
An unexpectedly large proportion (21.46%) of the melanic horizons have developed on
Karoo sandstones, with unexpectedly small proportions on the finer grained Karoo
sediments (considering the vast aerial extent of the latter and the fact that melanic
horizons have fairly high clay contents). Karoo sandstones are immature and rich in
feldspar (predominantly plagioclase, but also K-feldspar) and in some cases analcime
throughout the Karoo Basin (Buhmann, 1988; Van Vuuren, 1983). These sandstones
therefore resemble granites in their chemical composition. The clay fractions are
dominated by illite/smectite interstratifications, chlorite and kaolinite (Rowsell &
DeSwardt, 1976; Buhmann, 1992), a mineral association which is regarded particular
28

characteristic of melanic soils (MacVicar et a/., 1977). The observed extended
formation of melanic soils from sandstone lithology may therefore be a reflection of both
the rock's immaturity and its fairly large aerial extent.
Table 3.2 Distribution of melanic soils in relation to parent material
Igneous and metamorphic rocks
Mafic Intermediate Felsic
Amphibolite 0.38% "Lava" 5.70% Gneiss 0.22%
Andesite 0.22% Rhyodacite 2.34% Granite 9.45%
Basalt 13.58% Tonalite 0.16%
Dolerite 22.65% Rhyolite 0.22%
Gabbro 0.49%
TOTAL 37 .32% 8.04% 10.05%
Sediments/sed imentary rocks
"Waterborne" deposits Chemical deposits Aeolian deposits
Tillite
I
7.71% Marble 0.05% Sand 0.54%
Siltstone 2.45%
Shale/
Mudstone
8.31%
Schist 1.79%
Sandstone 21.46%
Alluvium/ 2.28%
Colluvium
TOTAL 44.00% 0.05% 0.54%
In an undisturbed west-east transect, the so-called Rietpan firebreak road, in the
Kruger National Park there is a striking difference between the grass biomass
production on the basalt and Timbavati gabbro areas, where melanic horizons are
abundant, and the grass biomass production on adjoining Karoo mUdstones and shales
and the base-rich footslopes of the granitic areas, where melanic horizons are rare.
On the basalt and gabbro the grass biomass production is estimated at more than
29

Melanic horizons that developed from contrasting parent rocks did not occupy widely
different topographic positions (Table 3.1 a). This finding is particularly evident in the
percentage of melanic soils that formed from dolerite, granite and sandstone.
The strong interrelationships between topography and rainfall in the formation of
melanic horizons on different topographic positions have been discussed in
Section 3.2.1.
3.2.4 Living organisms
Dense sweetveld grassland, giving high biomass production and high organic matter
additions to the soil , seems to be intimately related to the development of melanic
horizons, as was discussed under Sections 3.2.1 and 3.2.2. This fits in well with the
internationally well-known relationship between dense grassland (steppe; prairies) and
mollic (= melanic) horizons (e.g. WRB Working Group, 1998).
3.2.5 Time
The time factor in soil formation is difficult to quantify for most soils. It is well
established that the weathering history of South Africa is complicated. The northern
part of South Africa is a remnant of the so-called African Weathering Cycle 1 surface
which formed between Cretaceous and mid-Tertiary times and which is characterized
by great depth of weathering and massive duricrusts (Partridge & Maud, 1987).
Erosion of this surface may have commenced either in the late Tertiary or as late as
30 000 - 12 000 years ago. African Weathering Cycles 2 and 3, which affected areas
more to the South, were of less intensity and duration (Partridge & Maud, 1987), but
may still have had an influence on the degree of leaching of some soils. The absence
of melanic soils from part of the 550 - 800 mm rainfall areas may, in some areas at
least, reflect wetter paleoclimatic conditions.
31

3.3. MINERALOGICAL ANALYSES
3.3.1 Clay mineral associations
The melanic A horizons investigated in the present study showed large variations with
regard to their clay mineral associations (Figure 3.5). Some striking patterns are
evident, however.
Figure 3.5 Clay mineral associations in melanic A horizons from South Africa
32
The first is the extremely small number of cases (5) in which mica + hydroxy
interlayered vermiculite (HIV) constitute the dominant clay mineral association. In four
of these HIV is making the whole contribution, with no mica present. In all four cases
the soils also contained no swelling clays. No less than 24 (> 40%) of the melanic
horizons contained no mica + HIV, the vast majority of the latter soils having
smectite + vermiculite as dominant clay mineralogy. All the soils contained one or more
of the following clay minerals (Table 3.3): kaolinite, mica, talc, smectite, illite/smectite
interstratifications, vermiculite and hydroxy-interlayered vermiculite (HIV). This
interlayered vermiculite is also often referred to as pedogenic chlorite.
Viewing micaceous clay mineralogy as a predominant factor in creating melanic
features is a misconception in all probability. In fact, in the Eastern Cape the clay
fractions of the dense, structureless, bleached, orthic A horizons developed from
mudstones and shales which are dominated by illite. In this area the melanic soils
found in between the above are associated with dolerite as parent material.
The clay fractions of more than half of the melanic horizons are dominated by swelling
clay minerals (smectite, vermiculite, illite/smectite interstratifications), with the latter
minerals comprising more than 75% of the clay fraction in about half of these. Since
many of these soils have high clay contents they could be expected to show strong
swell-shrink characteristics, i.e. to be vertic. It should be kept in mind, however, that
swell-shrink phenomena are influenced by a variety of factors, e.g. electrolyte
concentrations and ESP. Wilding & Tessier (1988) indicated that high-charge
smectites have lower swell-shrink potential than low-charge smectites. Some melanic
horizons will grade towards vertic horizons. They may even have strong enough swell
shrink characteristics to pose a hazard for buildings, though the expansion is not
enough to qualify them as vertic (Soil Classification Working Group, 1991).
Nearly 30% of the melanic horizons studied had kaolinite as the dominant clay mineral.
Some of these were devoid of swelling clay minerals, others of mica + HIV (Figure 3.5).
Few kaolinite dominated horizons contained both smectite + vermiculite and mica +
33
HIV. According to Stern (1990) and Bloem (1992) major differences regarding
physicochemical properties, especially dispersion and crusting, could be expected
between the kaolinitic soils with and without smectite "impurities". The kaolinite
dominated melanic A horizons could logically be expected to be the ones that grade
towards humic A horizons. Some melanic and humic horizons resemble each other
closely morphologically. They are purely distinguished from each other according to the
base status limits in the 1977 definition (MacVicar et a/., 1977) and on a combination
of base status and plasticity index (PI) in the 1991 edition (Soil Classification Working
Group, 1991). The gradation of melanic to humic horizons on the one (more highly
weathered) side and to vertic horizons on the other side is illustrated by the fact that
one of the studied "melanic" horizons according to the original criteria (MacVicar et a/.,
1977) had to be reclassified as humic according to the slightly revised criteria (Soil
Classification Working Group, 1991), while another had to be reclassified as vertic.
The clay mineralogical data for the melanic soils in the present study are almost
identical to those found by BOhmann & Schoeman (1995) for vertic soils in the northern
regions of South Africa, most of the vertic soils being dominated by smectite, all
containing at least some proportions of kaolinite (up to 65%) and very little mica. Since
melanic horizons cover the range between humic horizons on the one hand and vertic
on the other hand, it is logical to expect a clay mineralogy ranging from predominantly
kaolinitic to predominantly swelling clays.
Table 3.3 Average clay mineral contents in relation to parent material
Swelling clays Kaolinite Mica Talc HIV
Average (%) 46.1 35.8 11.3 1.5 5.3
Sediment (%) 49.2 25.0 25.8 0 0
Mafic rocks (%) 43.0 37.9 8.1 2.3 8.7
Granite/gneiss (%) 29.4 60.8 9.8 0 0
Melanic soils develop from a variety of parent materials (Table 3.2; Appendix 1). There
were distinctive differences in clay mineral associations between melanic soils formed
34
from different precursors (Table 3.3). The mica content was on average much higher
in sediment-derived pedons, while granitic substrates resulted in high kaolinite
contents. Talc and HIV were restricted to soils formed from mafic rocks.
35
3.3.2 XRD Patterns
The XRD patterns of the two melanic soils in Figure 3.6 display features characteristic
of kaolinite and mica. Kaolinite is a 7 Amineral with resultant peak position at about
14°28.
Sample C 2009: kaolinite & mica
K 550 °C
KAD
Mg GI
Mg EG
MgAD
15 5 2 I 10
degrees 29
Sample C 8555: kaolinite & mica
K 550 °C
215 10 5 de rees 28
a b
Figure 3.6 XRD patterns of two melanic soils containing kaolinite and mica
36

This characteristic basal reflection (MgAO) does not shift on treatment with ethylene
glycol (MgEC) or glycerol (MgGI), as the mineral is non-swelling. The peak position
also does not change following saturation with K (KAO). The peak, however,
disappears on heating to 550°C, as kaolinite is transformed into X-ray amorphous
metakaolinite at temperatures above 500°C.
Additional to kaolinite, these samples contain a 10A mineral, which does not change
its spacing in response to any of the treatments applied in the present study. This
feature is typical for the clay mineral mica. These samples, therefore, contain an
association of mica and kaolinite. The mica content is significantly higher in sample
C 2009 (Figure 3.6a), compared to sample C 8555 (Figure 3.6b), as reflected in a
markedly higher intensity of the mica peak relative to the kaolinite reflection. In sample
C 8555 a high background at the low angle side of the mica peak indicates small
amounts of 14A minerals, interstratified with mica.
Sample C 5959 (Figure 3.7) contains kaolinite in association with a 14A (r28) mineral
which does not expand with ethylene glycol or glycerol, nor does it collapse upon
K saturation. These spacing characteristics are common to chlorite. On heating,
however, a very broad shoulder developed between 10 and 14A; a feature
uncharacteristic of chlorite. In reference chlorite, the intensity of the 14A peak
increases significantly on heating. The 14A mineral in this sample shows all the
characteristics of AI-hydroxy interlayered smectite or vermiculite, commonly referred
to as pedogenic chlorite. This pedogenic chlorite is positioned in the mineral
classification scheme somewhere between swelling clay minerals and chlorite, having
the lack of expansion typical of chlorite, but peak intensity ratios and - to a lesser
extent - charge characteristics of smectites. This sample also contains quartz and
feldspar.
37
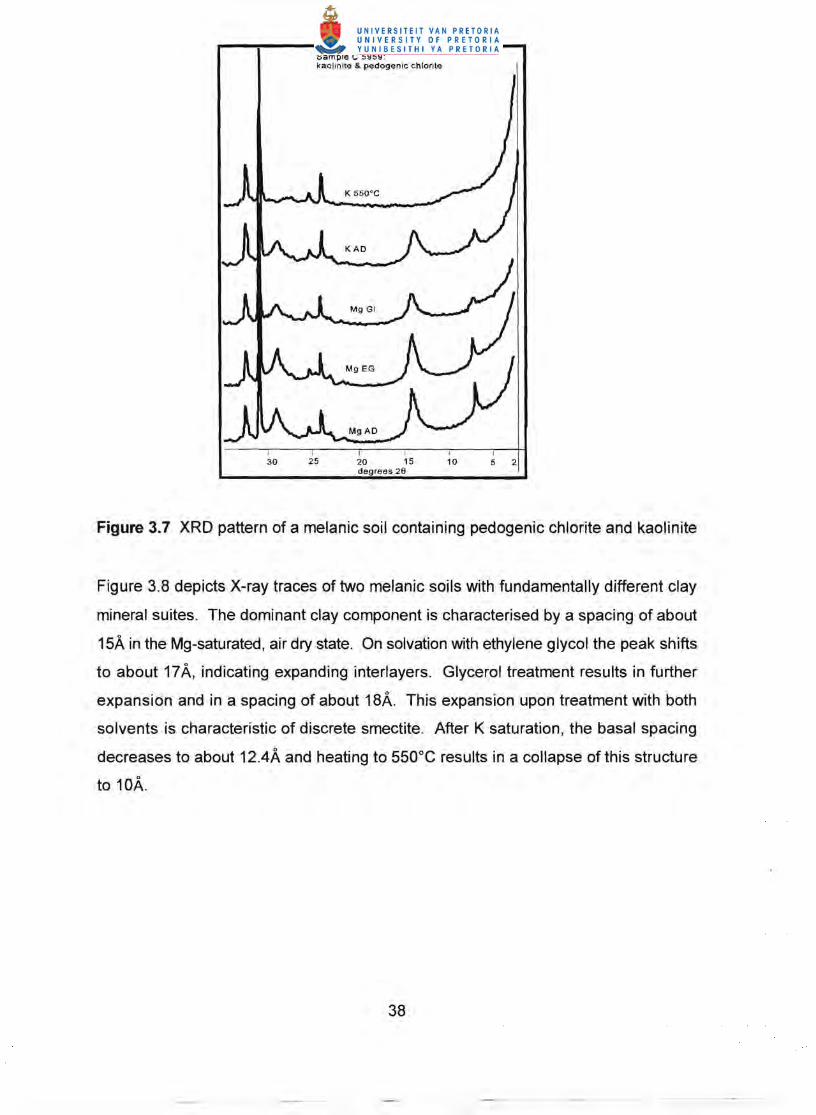
Sample C 5959: kaolinite & pedogenic chlorite
I 25 20 15 10 5 2
degrees 29
Figure 3.7 XRD pattern of a melanic soil containing pedogenic chlorite and kaolinite
Figure 3.8 depicts X-ray traces of two melanic soils with fundamentally different clay
mineral suites. The dominant clay component is characterised by a spacing of about
15A in the Mg-saturated, air dry state. On solvation with ethylene glycol the peak shifts
to about 17A, indicating expanding interlayers. Glycerol treatment results in further
expansion and in a spacing of about 18A. This expansion upon treatment with both
solvents is characteristic of discrete smectite. After K saturation, the basal spacing
decreases to about 12.4A and heating to 550°C results in a collapse of this structure
to 10k
38

Sample C 2964: discrete smectite
Sample 3978: kaolinite, ta lc & smectite
K AD
~__ .MgGI
Mg EG
MgAD
15 5 degrees 29
2
MgEG
MgAD
15 10 5 2 degrees 29
a b
Figure 3.8 XRD patterns of two melanic soils containing smectite, associated with
a) kaolinite and traces of mica; b) kaolinite and talc
Figure 3.8 depicts all the X-ray characteristics of discrete smectite. In sample C 2964
(Figure 3.8a) , smectite is associated with a small amount of kaolinite and traces of mica
and in sample C 3978 (Figure 3.8b) with kaolinite and talc.
Figure 3.9 displays the patterns of two melanic soils, with still another clay association:
smectite and vermiculite.
39
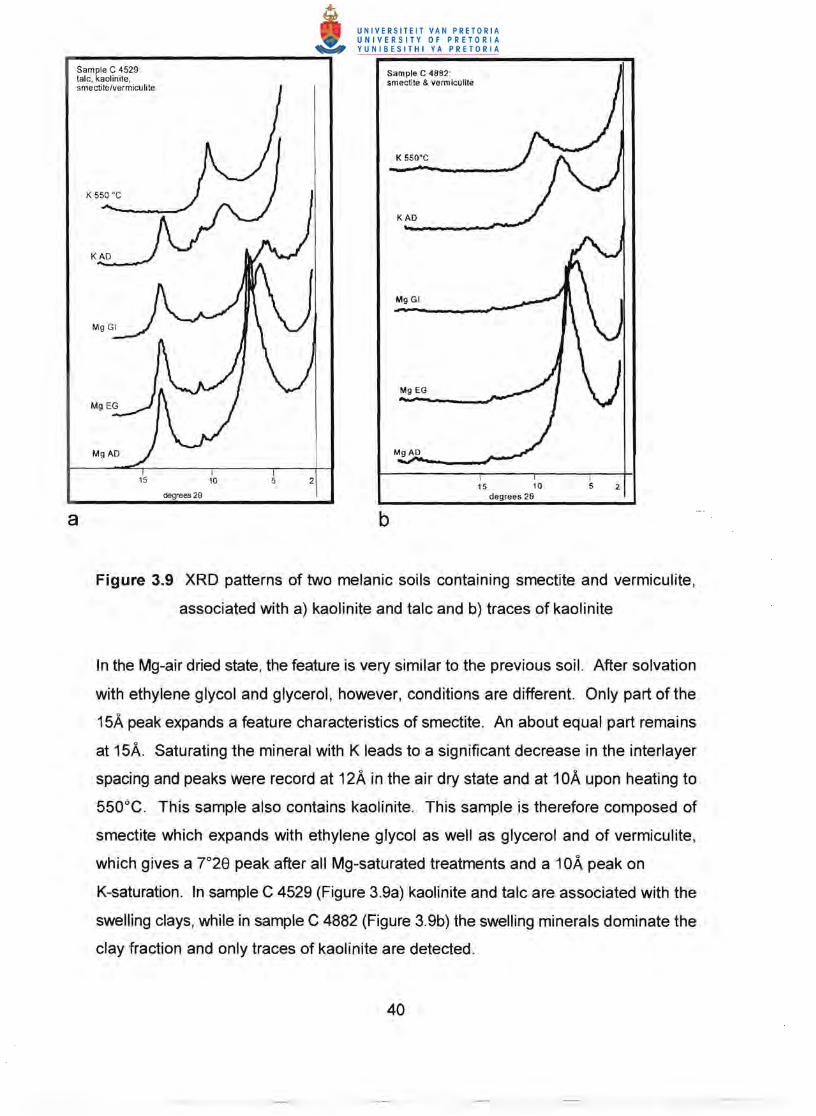
Sample C 4529 : talc, kaolinite, smectite/vermiculite
KAD
15
degrees 29
10 2
Sample C 4662 : smectite & vermiculite
KAD
Mg GI
Mg EG
MgAD
15 10 5 2 degrees 28
a b
Figure 3.9 XRD patterns of two melanic soils containing smectite and vermiculite,
associated with a) kaolinite and talc and b) traces of kaolinite
In the Mg-air dried state, the feature is very similar to the previous soil. After solvation
with ethylene glycol and glycerol, however, conditions are different. Only part of the
15A peak expands a feature characteristics of smectite. An about equal part remains
at 15A. Saturating the mineral with K leads to a significant decrease in the interlayer
spacing and peaks were record at 12A in the air dry state and at 10A upon heating to
550°C , This sample also contains kaolinite. This sample is therefore composed of
smectite which expands with ethylene glycol as well as glycerol and of vermiculite,
which gives a r28 peak after all Mg-saturated treatments and a 10A peak on
K-saturation. In sample C 4529 (Figure 3.9a) kaolinite and talc are associated with the
swelling clays, while in sample C 4882 (Figure 3.9b) the swelling minerals dominate the
clay fraction and only traces of kaolinite are detected.
40

In some soils, the kaolinite component is characterized by a symmetric diffraction line
with a low background at both sides of the peak (Figure 3.8b). These are the features
of discrete, crystalline kaolinite. In some samples, however, poorly developed r28
peaks occur, which have a very high background at the low angel side peak that
stretches almost to 2°28 (Figure 3.10). Kaolinites which are randomly interstratified
with 2:1 layer silicates are characterized by this peak broadening. On heating to
550°C, the broad shoulder covers the < 10°28 range.
ample C 8653: IV
K 550 ' C
KAD
Mg GI
MgEG
MgAD
I 15 10 5 2
degrees 28
Figure 3.10 XRD pattern of a melanic soil with kaolinite displaying a high background
41

The XRD patterns of an illite/smectite interstratification are shown in Figure 3.11. The
mineral is characterized by a peak at 11.8A in the Mg-saturated air dried state and a
. shift to 12.2A upon ethylene glycol and to 12.5A upon glycerol solvation. Following
K saturation, a 11.2A reflection was recorded, which shifted to 10A on heating to
550°C. After saturation with dodeacylamine (Cd the peak shifted to about 14°28.
According to the X-ray patterns of this sample, beidelite is the dominant smectite
component in this soil. Peak positions about halfway between those of mica (10°28)
and smectite (r28) are indications of interstratifications, consisting of about equal
properties of the two components. The absence of a superlattice reflection (4°28)
indicates a random stacking arrangement.
ample C 3613: Illte/smectite Interstratlflcatlon
C'2
MgGI
MgEG
15 I 10 5 2
degrees 29
Figure 3.11 XRD patterns of a melanic soil containing a 10Alswelling 14A
interstratification, associated with small amounts of mica and traces of
kaolinite.
42

Most melanic soils contain kaolinite, some as a discrete mineral, which can be
identified by a low background on either side of the diffraction line. Many samples,
however, contain a kaolinite which is heavily interstratified with a 2: 1 layer mineral. This
mixed-layer component is either smectite or - more commonly - a hydroxy-interlayered
vermiculite. We then do not have a well developed kaolinite peak, but rather a broad
shoulder at the low angle side of the kaolinite peak or sometimes even a high
background, stretching from 7 Aall the way to 2°28.
As a summary we can state that melanic soils seem to need a certain amount of 2: 1
layer silicates in order to develop the structural characteristics required for
classification. The question arises, of course, why a soil may be dominated by smectite
in association with a high clay content and still not develop vertic properties?
Alternatively, why are some melanic soils dominated by kaolinite and still develop
strong structure, while most kaolinitic soils are unstructured?
3.3.3 Layer charge characteristics
Melanic soils, per definition, must exhibit a blocky structure (MacVicar et a/., 1977) and
structure refers to the natural aggregation of primary soil particles into compound units.
Aggregates are composed of minerals, organic matter, water and air. Some of these
constituents are chemically inert phases like quartz, lime, feldspar and air. Others
possess a strong dipole character but are otherwise uncharged, like water, while still
others carry a layer charge which may be permanent (mica, HIV, smectite, vermiculite)
or variable (secondary Fe and AI phases, edge sites in phyllosilicates). OrganiC matter
may feature in any of these groups, depending on its nature. In order to form
aggregates, the primary soil constituents have to be bound together, which requires the
existence of bonding sites. As inert phases do not possess bonding sites, they cannot
be involved in aggregate formation. The interaction of charged and/or polar sites, on
the other hand, may lead to cohesive bonding and resultant formation of
heterogeneous aggregates (Buhmann et aI., 1998). Charged sites are restricted almost
exclusively to the soil's organic matter and phyllosilicate fractions which occur
43

intimately associated with each other. The presence of minerals with charged sites,
particularly permanently net negative sites, is therefore an important factor in soil
structure formation.
Based on the layer charge characteristics of the dominant clay mineral, three groups
could be distinguished in the present study (Figure 3.5):
a) essentially uncharged minerals with a net negative charge of < 0.2 per 010 unit cell
and non-swelling, i.e. kaolinite and talc,
b) clays of a high layer charge of> 0.8 per 010 unit cell, which are essentially non
swelling, i.e. mica and HIV and
c) clays of medium to high layer charge with a net negative charge of 0.2 to 0.8 per 010
unit cell, which exhibit swelling properties i.e. smectite, vermiculite and/or illite/smectite
interstratifications.
a) Soils dominated by clay minerals with a low layer charge
All melanic soils in the present study which are dominated by kaolinite and talc also
contained at least some charged phases, either associated or interstratified. Even the
soil with 100% kaolinite had a high background at the low angle side of the kaolinite
diffraction line, a clear indication of the presence of 2:1 layer interstratification
components. These components, unfortunately, could not be quantified and were very
difficult to qualify. The CEC of the soil clay of 40 cmol(+)/kg clay also indicates the
presence of charged material, discrete kaolinite having a CEC < 20 cmol(+)/kg clay.
A small amount of charged minerals - in combination with a relatively high content of
OM (1.9%) and major proportions of sesquioxides (Fe: 6.8%) - is obviously sufficient
to induce aggregation.
b) Soil dominated by non-swelling clay minerals with a high layer charge
Mica and chlorite are generally assumed as being associated with the formation of
melanic characteristics, being non-swelling and therefore not conducive to the
development of vertic properties, but having a sufficient number of charged sites
available for binding soil constituents into aggregates. The present study, however,
44

contradicts the above hypothesis. Only very few of the soils studied were dominated
by mica and/or HIV, while chlorite was absent from all soils.
c) Soil dominated by swelling clay minerals
Soils dominated by smectite in combination with a high clay content are generally
assumed to develop vertic properties.
I n the present study the clay "fractions of more than half of the melanic horizons are
dominated by swelling clay minerals (smectite, vermiculite, illite/smectite
interstratifications), with the latter minerals comprising more than 75% of the clay
fraction in about half of these. Since many of these soils also have high clay contents
they could be expected to show strong swell-shrink characteristics, i.e. to be vertic.
The clay mineral association of the melanic soils in the present study in fact is almost
identical to those found by BOhmann & Schoeman (1995) for vertic soils in the northern
regions of South Africa; most of the vertic soils being dominated by smectite, all
containing at least some proportions of kaolinite (up to 65%) and little mica. The fact
that some melanic horizons have a clay mineralogical composition identical to that of
vertic horizons was unexpected. It should be kept in mind, however, that swell-shrink
phenomena are influenced by a variety of interrelated chemical, physical and
parameters like OM, carbonates, sesquioxides (Fe and AI) and silica, which bind the
soil fabric, apart from content of expansile clay minerals, particularly that of smectite.
Wilding & Tessier (1988) indicated that high-charge smectites have lower swell-shrink
potential than low-charge smectites. The extent of swelling in smectites can vary
greatly and natural smectites range from strongly swelling to non-swelling, depending
on the magnitude and location of the layer charge (Wilding & Tessier, 1988) and on
charge heterogeneity (Lagaly et aJ., 1972). The tendency of clay interlayers to take up
water decreases with increasing interlayer charge density and charge homogeneity.
Layer charge characteristics of smectites can be determined by solvation with ethylene
glycol and glycerol and by saturation with C12 and the Greene-Kelly test. These two
tests were therefore performed on those melanic soils that were dominated by smectite.
45

Ethylene Glycol Solvation
According to the ethylene glycol treatment, most of the swelling clays were essentially
. smectitic, i.e. they formed a double layer (17 A) . Some samples, however, also
contained some vermiculite, associated or interstrahfied with smectite.
Glycerol Solvation
Glycerol solvation provided a slightly different picture and indicated an association of
smectite with vermiculite in many of the samples. From the above treatments it must
be concluded that the smectite species, that dominates South African melanic soils, is
of the high-charge variety (high-charge smectite and/or low-charge vermiculite), and
should therefore not be prone to osmotic swelling.
C12
Intercalation with dodecylamine also points to a high interlayer charge density and
related low swelling capacity (Table 3.4) . Only one of the soils investigated contained
some montmorillonite, while most were composed of vermiculite or an association of
beidellite and vermiculite.
Greene-Kelly Test
Most soil smectites were characterised as beidellite and only 23% of the melanic soils
which are dominated by smectite, contained montmorillonite, the highest amount being
37%. Montmorillonite occurred associated with beidellite (Table 3.4). This composition
differs markedly from that reported for South African vertisols, which all contained
montmorillonite, average proportions ranging from 20% to 30%.
As a high degree of swelling is generally associated with a low layer charge, arising
predominantly from octahedral substitutions, i.e. montmorillonite sensu stricto and not
with beidellite or vermiculite, vertisols in South Africa must have a considerably higher
swelling capacity compared to melanic soils. This finding may explain the presence of
a high proportion of swelling clay despite an absence of a high degree of
expansiveness.
46

Table 3.4 Characterisation of swelling clay minerals in the melanic horizons studied
Soil no. C1 ? LiCI EG GI %b %m 1785 b+v b s s+v 1971 v b+m s s+v 63 37 1991 v b I s+v 2234 v b+ m s s+m 76 24 2283 b+v b s s+v 2332 v b+v s s+v 2347 b+v b+v s/v s 2878 v b s/v s+v 2964 b+v b +m s s 92 8 3277 b b+m s s 85 15 3279 b b s s 3282 b+v b i s 3714 b+v b +m s s+v 92 8 3978 b i s s 4223 I b s s+v 4304 v b s s+v 4529 v b s s+v 4654 v b+v s s+v 4671 I b s/v s+v 4882 v b s/v v 5405 i b s/v v 6436 I b i v 7666 v b I s 8517 v b s s 8649 I b i s 8669 v b I s 0246 b +m b +m s s 82 18
b - beidellite;
m - montmorillonite;
I - interstratified clay minerals;
s/v - smectite/vermiculite
47
3.3.4 Implications of the clay mineralogical data for soil classification in South
Africa
Taxonomic soil classification is essential for proper communication about soils. As in
taxonomic classification in other fields, like plants and animals, taxonomic
classifications of soils are not practical classifications upon which detailed decision
making or planning can be based . Especially in higher categories each taxon usually
includes a wide range of soils with different properties around limited commonalities in
their features. In the South African taxonomic system the soil form is the highest
category (Soil Classification Working Group, 1991). Each soil form is characterised by
a specific assemblage of diagnostic horizons. Some of these diagnostic horizons cover
a wide range of properties, e.g. an apedal B horizon can be anything from a dystrophic
clay to an eutrophic sand.
It has already been pointed out that melanic A horizons span the spectrum from those
that integrate with humic A horizons to those that intergrade with vertic A horizons. The
challenge is to make meaningful subdivisions of these for classification in lower
categories. Thus far, only the absence or presence of lime, clay content and colour
have been used for series or family classification in soils with melanic horizons
(MacVicar et al., 1977; Soil Classification Working Group, 1991). When looking at
international trends, it would seem that it will be important in South Africa to also
distinguish between the "soft" granular structured melanic soils and the "hard" ones
which show vertic properties, but not strong enough to qualify as vertic horizons.
Khitrov (personal communication; 1996) has attempted to derive criteria that distinguish
between "hard" Chernozems (those that tend towards Vertisols) and "normal"
Chernozems. The mollic (= melanic) horizon is the key horizon in Chernozems. In the
WRB system "vertic" is at the top of the priority listing of lower level units in the
Chernozem, Kastanozem and Phaeozem reference units. These are the reference
units with mollic horizons as key horizons.
48
Clay mineralogical studies may be important in this regard. Very detailed studies of the
clay mineralogy will be required, however, which go beyond mineral group
identifications and focus on different species and the specific nature of
interstratifications (Wilding & Tessier, 1988; Fitzpatrick & Le Roux, 1977).
49
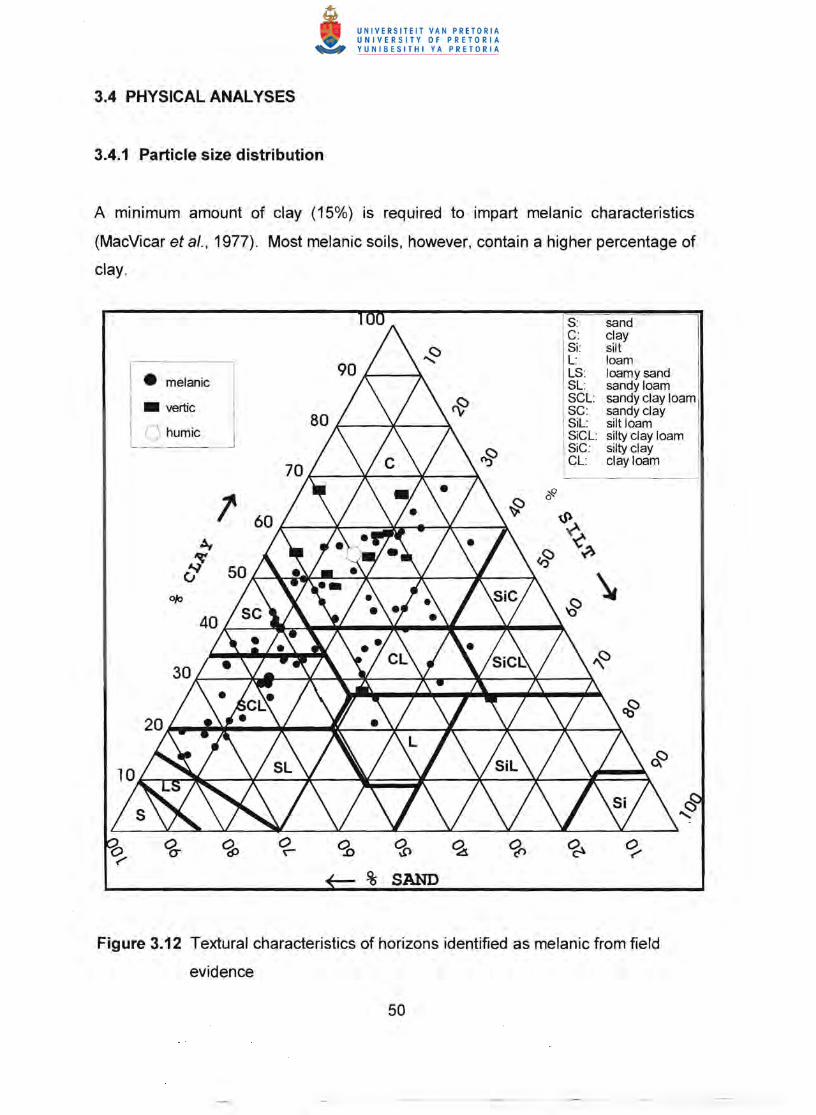
3.4 PHYSICAL ANALYSES
3.4.1 Particle size distribution
A minimum amount of clay (15%) is required to impart melanic characteristics
(MacVicar et aI., 1977). Most melanic soils, however, contain a higher percentage of
clay.
S: sand -~ C: clay I Si: silt I L: loam i
LS: loamy sand • melanic SL: sandy loam
SCL: sandy clay loam • vertic SC: sandy clay
SiL: silt loam o humic SiCL: silty clay loam SiC: silty clay CL: clay loam
% SAND
Figure 3.12 Textural characteristics of horizons identified as melanic from field
evidence
50

Most of the melanic soils investigated fall into the clay © textural class. Of the
remaining horizons, 15 were classified as sandy-clay-loam (SCL), 11 as sandy-clay
(SC), 8 as clay-loam (CL), 6 as sandy loam (SL), 2 as loam (L) and 1 each as silty-clay
loam (SiCL) and silty-loam (SiL) [Figure 3.12]. Clay « 0.002 mm) dominated 38% of
the soils, sand (2.0 - 0.05 mm) 35% and silt (0.05 - 0.002 mm) 4%, while the rest of the
soils (23%) were intermediate in particle distribution characteristics (Appendix 2).
Average values were lowest for silt (19%) and highest for sand (40%). The average
for clay (39%) was almost identical to that for sand. The degree of variability within the
various grain size fractions was significant. Sand contents varied between 8 and
clay contents between 15 and 65% and silt percentages between 3 and 49%.
3.4.2 Plasticity index (PI)
According to the revised South African soil classification system (Soil Classification
Working Group, 1991), a PI of < 36 (using the British Standard cone to determine liquid
limits) is a determining characteristic distinguishing melanic horizons from vertic
horizons. melanic soils of the present study a PI which ranges from 3 to 52,
with an average of 26. About half of the soils (47%) had a PI less than 39% had
a PI between 25 and 36 and 14% had a PI of more than 36. The A horizons with a PI
more than 36 (11 soils) are, according to the 1991 criteria, vertic and not melanic
horizons and should be reclassified (Figure 3.12; Appendix 2).
The plasticity index is a measurement of soil plasticity and accordingly closely related
to clay fraction characteristics, particularly to those of smectite. In present study,
the PI was more closely associated with the amount of clay than with swelling clays
(smectite) .
In Figure 3.13 a relationship is depicted between the PI and the clay percentage in the
soils. The PI slightly increased with increasing amount of clay with r2:::: 0.30. The
percentage of smectite in the soil, however, hardly increased with the PI (Figure 3.14,
r::::: 0.21). indicating that the amount of clay is more influential to PI than the nature of
51
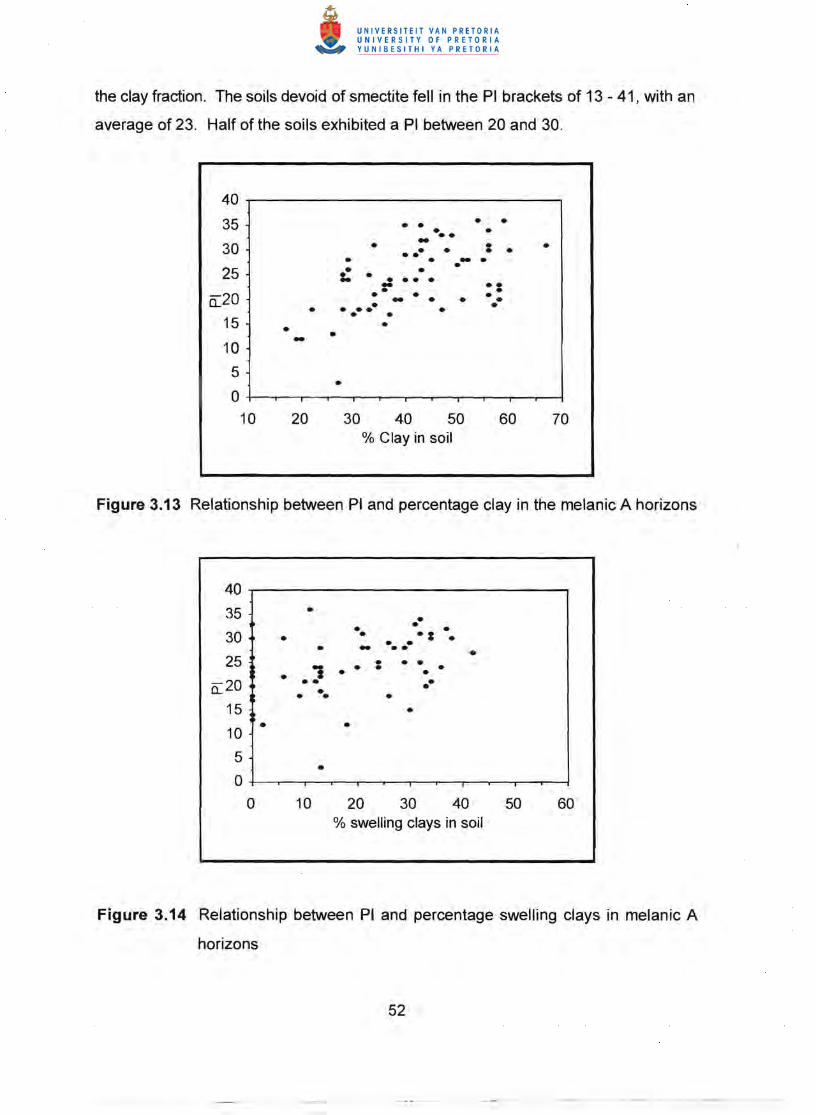
• • • • • • • • • • • •• • •
• •
the clay fraction. The soils devoid of smectite fell in the PI brackets of 13 - 41, with an
average of 23. Half of the soils exhibited a PI between 20 and 30.
40
35
30
25
Cl..20
15
10
5
0
-••
• • • -.-• -• •••• • • - • • • ••• • ••• ..-.- • •
•• - •
•
10 20 30 40 50 60 70 % Clay in soil
Figure 3.13 Relationship between PI and percentage clay in the melanic A horizons
40
35
30
25
Cl..20
15
10 •
•
•
•
• i•••• •
•• • •• .: •• •- •• • •
• • •• • • ••
• •
•
•
5
0 •
0 10 20 30 40 50 60 % swelling clays in soil
Figure 3.14 Relationship between PI and percentage swelling clays in melanic A
horizons
52

3.5 CHEMICAL ANALYSES
3.5.1 Cation exchange capacity (CEC) and exchangeable bases
The GEG of a soil is closely associated with substitutions of divalent cations for trivalent
cations in the octahedral sheets of clay minerals or trivalent for tetravalent cations in
the tetrahedral sheets. Negative charge may also arise from octahedral vacancies.
The resulting charge deficit is balanced by adsorption of cations on to the clay surface
and into the interlayer regions. Study of reference clays indicates that a high GEG is
generally associated with smectite [80 - 120 cmol(+)/kg] and/or vermiculite
[120 - 160 cmol(+)/kg]. Kaolinite, talc and mica have a GEG < 20 cmol(+)/kg .
In the present study, however, even soils devoid of smectite had moderate to high
GEG's per unit clay. This feature may be associated with kaolinite which was
neoformed from high-charge minerals like mica or smectite, where Si remains part of
structural cation substitutions or with kaolinite which is interstratified with high-charge
minerals.
160 ~------------------.------------~
>. 140
~ 120 • 0> ~ 100 • + o 80 ~
~ 60 ~ .
b3 40 1 o 20 1
•
• •
•
• • ••
•
•
•• •
• • 1
• ••
• • • • ••• •
•
• o~--~~~-~~~~~~·~
o 20 40 60 80 100 Swelling clays as % of the total clay
Figure 3.15 The relationship between the GEG per unit clay and the percentage
swelling clays in the clay fractions of melanic A horizons
53

The average CEC for the soils investigated was 22.6 cmol(+)/kg. The highest value
was 53.4 cmol(+)/kg for a soil with a clay content of 65% and the lowest was
9 cmol(+)/kg, with a clay content of 52% (Appendix 2). No less than 93% of the soils
have a CEC lower than 40 cmol(+)/kg.
The interlayer cation is fundamental to the swelling capacity of smectites and
vermiculites; only when saturated with a monovalent cation, particularly with Na, will
smectites exhibit a high degree of expansiveness. Divalent cations, particularly Ca,
"stabilize" swelling clays. Figure 3.16 displays the distribution patterns of the
exchangeable cations Na, Ca and Mg + K in the soils investigated. Exchangeable
cations were grouped according to their effect on the stability of soil structure, with Na
being dispersive, Ca stabilizing and Mg + K somewhere in between.
Most of the soils had a low to very low exchangeable sodium percentage. In 78.5% of
the soils, the exchangeable Na percentage (ESP) ranged below 5, a value regarded
as being below the "dispersion level" for Australian (Emerson, 1983) and South African
(Gerber & Harmse, 1987) soils. Soils with high exchangeable Mg:Ca ratios (>1.5: 1)
have been found to be very unstable (Laker, 1997). Only five of the melanic horizons
in the present study had high Mg:Ca ratios. Most of the melanic soils should therefore
be stable, as far as their structure is concerned. Almost all the melanic soils in the
present study have an ESP of < 15, a value adopted by American soil scientists (Soil
Survey staff, 1998) for sodic/problematic soils.
54
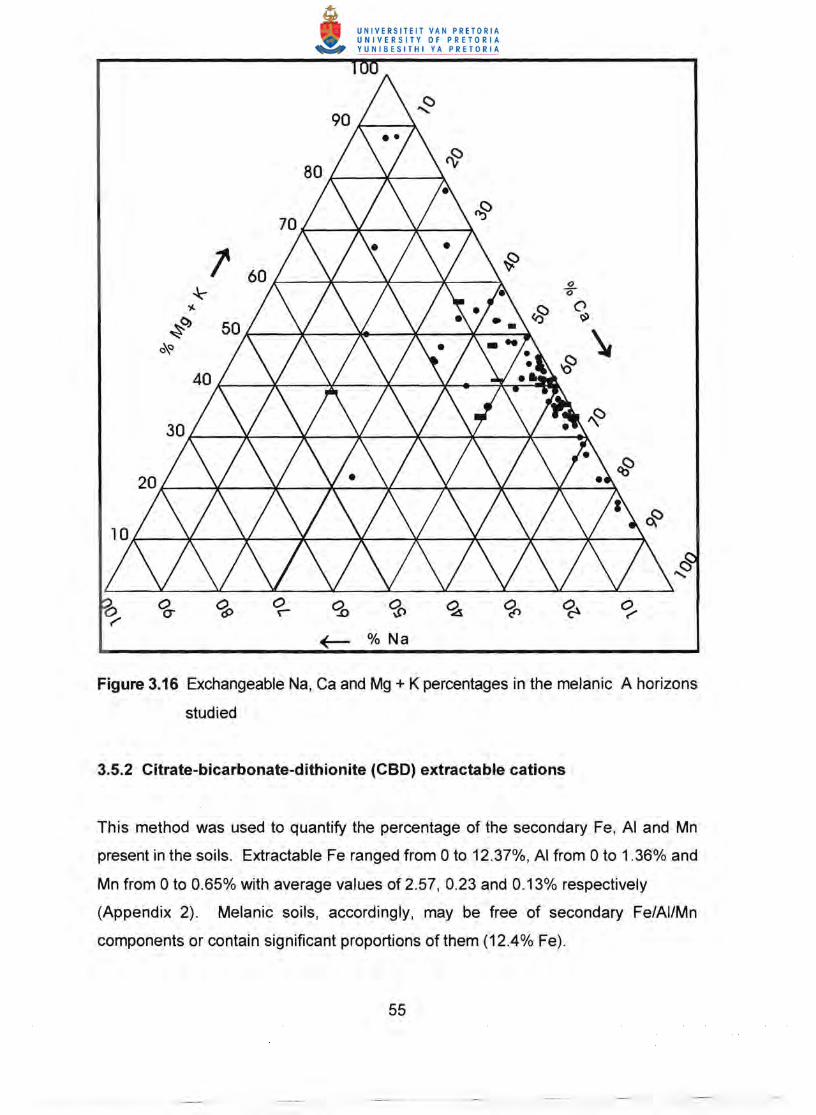
+-- % Na
Figure 3.16 Exchangeable Na, Ca and Mg + K percentages in the melanic A horizons
studied
3.5.2 Citrate-bicarbonate-dithionite (CBO) extractable cations
This method was used to quantify the percentage of the secondary Fe, AI and Mn
present in the soils. Extractable Fe ranged from 0 to 12.37%, AI from 0 to 1.36% and
Mn from 0 to 0.65% with average values of 2.57, 0.23 and 0.13% respectively
(Appendix 2). Melanic soils, accordingly, may be free of secondary Fe/AIIMn
components or contain significant proportions of them (12.4% Fe).
55

3.5.3 Organic Matter (OM)
The organic matter contents range from 0.5 to 4.3%, with an average of 1.8%. Half of
the soils have an organic matter content between 1 and 2%, 21 % between 2 and 3%,
15% less than 1%, 10% between 3 and 4% and 3% above 4% (Appendix 3).
3.5.4 pH
The pH of a soil is an indicator of the degree of weathering, being low in highly leached
soil, neutral to slightly acid in moderately leached soils and neutral to alkaline in soils
with a low degree of weathering. In the present study the average pH measured in H20
and CaCI2 was 6.9 and 6.0 respectively. The highest pH(H20) was 9.3, the lowest 5.4
(Appendix 3). These pH values reflect a low to moderate degree of weathering , which
is in line with the hypothesis of melanic soil formation (Soil Classification Working
Group, 1991).
56
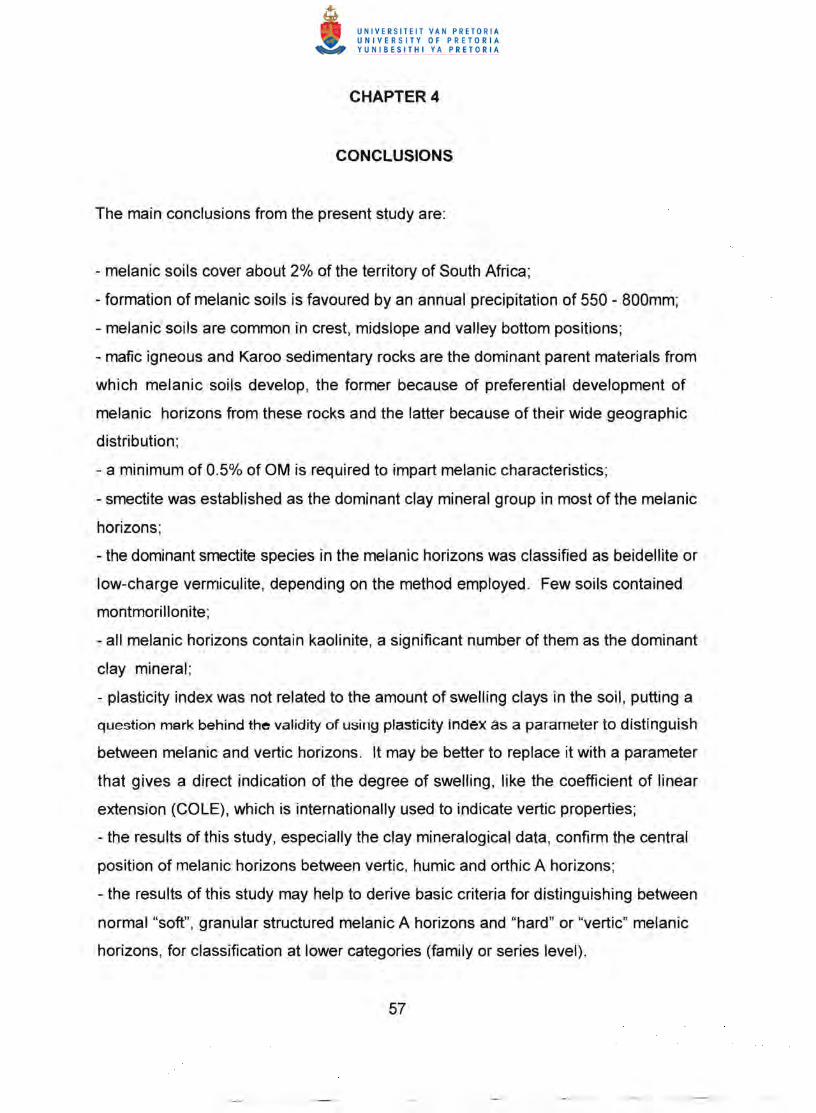
CHAPTER 4
CONCLUSIONS
The main conclusions from the present study are:
- melanic soils cover about 2% of the territory of South Africa;
- formation of melanic soils is favoured by an annual precipitation of 550 - 800mm;
- melanic soils are common in crest, midslope and valley bottom positions;
- mafic igneous and Karoo sedimentary rocks are the dominant parent materials from
which melanic soils develop, the former because of preferential development of
melanic horizons from these rocks and the latter because of their wide geographic
distribution;
- a minimum of 0.5% of OM is required to impart melanic characteristics;
. - smectite was established as the dominant clay mineral group in most of the melanic
horizons;
- the dominant smectite species in the melanic horizons was classified as beidellite or
low-charge vermiculite, depending on the method employed. Few soils contained
montmorillonite;
- all melanic horizons contain kaolinite, a significant number of them as the dominant
clay mineral;
- plasticity index was not related to the amount of swelling clays in the soil, putting a
question mark behind the validity of using plasticity index as a parameter to distinguish
between melanic and vertic horizons. It may be better to replace it with a parameter
that gives a direct indication of the degree of swelling, like the coefficient of linear
extension (COLE), which is internationally used to indicate vertic properties;
- the results of this study, especially the clay mineralogical data, confirm the central
position of melanic horizons between vertic, humic and orthic A horizons;
- the results of this study may help to derive basic criteria for distinguishing between
normal "soft", granular structured melanic A horizons and "hard" or "vertic" melanic
horizons, for classification at lower categories (family or series level) .
57

REFERENCES
ALLISON, L.E., 1965. Estimating the ability of soils to supply nitrogen. Agric. Chern.
11,46-48,139.
BAILEY, S.W., 1980. Summary of recommendations of AIPEA nomenclature
committee. Clays Clay Min. 28, 73 - 78.
BARSHAD, I., 1966. The effect of variation in precipitation on the nature of clay
mineral formation in soils from acid and basic igneous rocks. Proc. Int. Clay Conf
(Jerusalem) 1, 167 - 173.
BLOEM, A.A., 1992. Kriteria vir die aanpassing van die ontwerp en bestuur van
oorhoofse besproeiingstelsels by die infiltreerbaarheid van gronde. M.Sc. dissertation,
Univ. Pretoria
BuHMANN, C., 1987. Investigation of 2:1 layer silicate clays in selected southern
African soils. PhD (Unpub.), Univ. Of Natal, Pietermaritzburg.
BuHMANN, C., 1988. Changes in mineralogical composition of Karoo sedimentary
rocks from Core SR1175. Report (Unpub.), Univ. of Natal, Pietermaritzburg.
BOHMANN, C., 1992. Smectite-to-illite conversion in a geothermally and lithologically
complex Permian sedimentary sequence. Clays Clay Miner. 40, 53 - 64.
BuHMANN, C. & SCHOEMAN, J., 1995. A mineralogical characterization of vertisols
from the northern regions of the Republic of South Africa. Geoderrna 66,239 - 257.
BuHMANN, C., VAN DER MERWE, G.M.E., & LAKER, M.C.,1998. Aggregation: the
soil texture approach. Bulletin of the Egyptian Geographical Society, 71: 113 - 135.
58

CHESWORTH, W., 1973. The parent rock effect in the genesis of soil.
Geoderma 10, 215 - 225.
CLEMENCY, CV., 1975. Simultaneous weathering of a granitic gneiss and an
intrusive amphibolite dike near Sao Paulo, Brazil, and the origin of clay minerals. Proc.
Int. Clay Cant. (Mexico), 157 - 172.
DAN, J., YAALON, D. H. & KOYUMDJISKY, H., 1968. Catenary soil relationships in
Israel. Geoderma 2, 95 - 120.
DAY, P.R., 1965. Physical and mineralogical properties, including statistics of
measurement and sampling. In Methods of soil analysis. Part 1. (eds Black, C.D.,
Evans, D.O., White, J.L., Ensminger, L.E. & Clark, F.E.). Am. Soc. ofAgron. Madison,
Wisconsin.
EBERL, 0.0.,1984. Clay mineral formation and transformation in rocks and soils. Phil.
Trans. R. Soc. Lon. A 311, 241 - 255.
EMERSON, W.W., 1983. Inter-particle bonding. In: Soils: An Australian Viewpoint.
Division of Soils, CSIRO, Melbourne. Academic Press, London, 477 - 498.
FITZPATRICK, R.W. & LE ROUX, J., 1977. Mineralogy and chemistry of a Transvaal
black toposequence. J. Soil Sci. 28, 165 - 179
GERBER, A& HARMSE, H.J. VON M., 1987. Proposed procedure for identification of
dispersive soils by chemical testing. The Civil Engineer in South Africa 29,397 - 399.
GIBBS, R.J., 1965. Error due to segregation in quantitative clay mineral X-ray
diffraction mounting techniques. Am. Miner. 56, 2145 - 2146.
59

GREENE-KELLY, R., 1953. Identification of montmorillonoids in clays. J. Soil Sci.,
111, 34 - 41 .
HARWARD, M.E. & BRINDLEY, G.W., 1965. Swelling properties of synthetic
smectites. Clays Clay Min. 13, 209 - 222.
HUGGET, R.J ., 1976. Soil landscape systems. A model of soil genesis. Geoderma
13, 1 - 22.
JACKSON, M.L., 1956. (5th Print 1969). Soil chemical analysis. Advanced course.
Published by M.L. Jackson, Madison, Wisconsin .
JENNY, H., 1941. Factors of Soil Formation. McGraw Hill, New York.
LAGALY, G., 1979. The "layer charge" of regular interstratified 2:1 clay minerals.
Clays Clay Min. 27, 1 - 10.
LAGALY, G., 1982. Layer charge heterogeneity in vermiculites. Clays Clay Min.
30,215 - 222.
LAGALY, G., GONZALES, M.F. & WEISS, A., 1976. Problems in the layer charge
determination of montmorillonites. Clay Min. 11, 173 - 187.
LAGALY, G., SCHON, G. & WEISS, A., 1972. Ober den Einfluss einer
unsymmetrischen Ladungsverteilung auf die Wechselwirkung zwischen
plattchenformigen Kolloidteilchen. Kolloid z.z. Polym. 250, 667 - 674.
LAKER, M.C., 1997. Soils of South Africa in a WRB framework. Comm. Austrian Soil
Sci. Soc. 55, 183 - 186.
60

LAND TYPE SURVEY STAFF, 1984 -1998. Mem. Agric. Nat. Resourc. S. Afr. No.
1 - 32.
MACEWAN, D.M.C. & WILSON, M.J., 1980. Interlayer and intercalation complexes of
clay minerals. In: Crystal structures of clay minerals and their X-ray identification.
(G.W. Brindley & G. Brown, 6th eds). Ch. 3. London: Mineralogical Society, 197 - 248.
MACHAJDIK, D. & CICEL, B., 1981. Potassium- and ammonium-treated
montmorillonite. II. Calculation of characteristic layer charges. Clays Clay Min. 29 ,
47 - 52.
MACVICAR, C.N., LOXTON, RF., LAMBRECHTS, J.J.N., LE ROUX, J., DE VILLIERS,
J.M., VERSTER, E., MERRYWEATHER, F.R., VAN ROOYEN, TH. & VON M.
HARMSE, H.J., 1977. Soil Classification: A Binomial System for South Africa. Dep. of
Agric., Pretoria, South Africa.
NOVICH, B.E. &MARTIN, RT, 1983. Solvation methods for expandable layers: Clays
Clay Min. 31,235 - 238.
PARTRIDGE, TC. & MAUD, RR, 1987. Geomorphic evolution of southern Africa
since the Mesozoic. S. Afr. J. Geol. 90, 179 - 208.
REYNOLDS, RC., 1980. Crystal structures of clay minerals and their X-ray
identification. In: Interstratified Clay Minerals. (G.W. Brindley & G. Brown ed). Chap
4, Min. Soc., pp 249 - 303. London .
RICHARDSON, J.L., WILDING, L.P. & DANIELS, RB., 1992. Recharge and surcharge
of ground water in aquic conditions illustrated with flownet analysis. Geoderma 53 ,
65 - 78.
61

ROWSELL, D.M. & DESWARDT, A.M.J., 1976. Diagenesis in Cape and Karoo
sediments, South Africa, and its bearing on their hydrocarbon potential. Trans. Geol.
Soc. S. Afr. 79, 81 - 145.
SCOTNEY, D.M. & DIJKHUIS, F.J., 1990. Changes in fertility status of South African
Soils. South African Journal of Science 86, 395 - 402.
SOIL CLASSIFICATION WORKING GROUP, 1991. Soil Classification: A taxonomic
system for South Africa. Mem. Agric. Nat. Res. S. Afr. No. 15, Dep. Agric.
Development, Pretoria, 255pp.
SOIL SURVEY STAFF, 1998. Keys to Soil Taxonomy (8th Ed.). USDA, Washington.
SOUTH AFRICAN COMMITTEE FOR STRATIGRAPHY (SACS), 1980. Stratigraphy
of South Africa 1: Lithostratigraphy of the Republic of South Africa, South West
Africa/Namibia and the Republics of Bophuthatswana, Transkei and Venda. S. Afr.
Geol. Survey, Handbook 8.
STERN, R., 1990. Effects of soil properties and chemical ameliorants on seal
formation, runoff and erosion. D.Sc. Agric. thesis, Univ. Pretoria.
TMH 1, 1986. Standaardmetodes vir die toets van padboumatriale, 2de uitgawe,
WNNR, Pretoria.
VAN RANST, E., STOOPS, G., GALLEZ, A. & VANDENBERGHE, R.E., 1997.
Properties, soil criteria of classification and genesis of upland forest Podzols in
Rwanda. Geoderma 76, 263 - 283.
VAN VUUREN, C.J., 1983. A Basin Analysis of the Northern Facies of the Ecca Group.
PhD. (Unpub.), Univ. Of the Orange Free State.
62
WILDING. L.P. &TESSIER, D., 1988. Genesis of Vertisols: Shrink-swell phenomena.
Chapter 4 in: Vertisols: Their distribution, properties, classification and management.
L.P. Wilding & R. Puentes (Eds.). Washington, SMSS.
WRB WORKING GROUP, 1998. World Reference Base for Soil Resources. World
Soil Res. Report 84. FAD, Rome.
63
APPENDIXES
64

Appendix 1 Classification and soil forming factors of melanic soils from South Africa
Profile C no Soil group Soil family Rainfall jmm/aJ
Parent material
1T0pography
187 3277 Bonheim bonheim 574.5 ns 5 188 D246 Bonheim bonheim 485.4 basic 5 316 2349 Bonheim bonheim nd basic 3 598 2878 Bonheim bonheim 411.6 ns 4 646 4247 Bonheim bonheim 608.1 basalt 3 1161 6436 Bonheim bonheim 789.5 sandstone 3 1533 6142 Bonheim bonheim 490.8 basic 3 2010 7666 Bonheim bonheim 693.0 basic 3 644 4282 Bonheim bushman 608.1 basalt 4 903 2234 Bonheim bushman 612.8 dolerite 5 311 2361 Bonheim dumasi 640.8 ns 5 742 5405 Bonheim dumasi 597.1 andesite 3 955 4654 Bonheim dumasi 690.7 gneiss 4 1127 5105 Bonheim dumasi 720.0 dolerite 3 1937 8462 Bonheim dumasi 413.8 ns 5 56 3978 Bonheim glengazi 659.5 ns 5
214 4381 Bonheim glen~azi 560.6 ns 4 481 1968 Bonheim glengazi 549.8 shale 3 696 3517 Bonheim glengazi 684.3 dolerite 3 762 5428 Bonheim glengazi 619.0 ns 5 1673 8651 Bonheim glengazi 579.6 basic 3 1835 7937 Bonheim J)lengazi 596.5 mudstone 3 470 2712 Bonheim rasheni 506.0 ns 4 507 3697 Bonheim rasheni 619.7 mUdstone 3 901 2238 Bonheim rasheni 612.8 basalt 3 964 4671 Bonheim rasheni 428.4 quartzite 4 1247 5870 Bonheim rasheni 918.1 basalt 3 1705 8517 Bonheim rasheni 476.8 basic 5 657 1790 Bonheim stanger 918.1 basalt 1 707 3580 Bonheim stanger 737.3 ns 3 725 3609 Bonheim stanJJer 1055.6 ns 3 1087 4543 Bonheim stanger 650.0 dolerite 3 1105 2009 Bonheim stanger 804.8 lava 3 1115 2484 Bonheim stanger 720.0 dolerite 4 1502 6256 Bonheim stanger 290.8 basic 4 184 3279 Bonheim weenen 532.6 ns 5 197 4327 Bonheim weenen 638.2 ns 3
65

Appendix 1 Continued
I
Profile C no Soil group
655 4304 Bonheim
199 3714 Inhoek 1383 6731 Inhoek
1607 7527 Inhoek
1968 8669 Inhoek 142 2345 Mayo
419 3637 Mayo
428 4131 Mayo 432 4129 Mayo 1557 7383 Mayo 185 3282 Mayo 421 3639 Mayo 656 1785 Mayo 699 3832 Mayo 1245 5959 Mayo 1669 8646 Mayo 2064 8131 Mayo 900 2283 Mayo
1111 4882 Mayo 658 4223 Mayo 581 1705 Milkwood
2022 8653 Milkwood 605 1991 Milkwood 133 1322 Milkwood
317 2347 Milkwood 477 1963 Milkwood
483 1971 Milkwood 710 3613 Milkwood 1709 8664 Milkwood 2023 8572 Milkwood 1107 5017 Tambankulu 1670 8649 Tambankulu 660 4529 Tambankulu 106 2964 Willowbrook
1961 8555 Willowbrook . . ns - not specified nd - not determined
Soil family
weenen
cromley
drydale inhoek inhoek mayo
mayo mayo mayo mayo
msinsini msinsini msinsini msinsini msinsini msinsini msinsini
pafuri pafuri
tshipise dansland dansland
graJ1horne milkwood milkwood milkwood milkwood milkwood milkwood milkwood fenfield fenfield loshoek
sarasdale willowbrook
Rainfall Parent Topograph~ (mm/a) material
888.2 colluvium 4 574.5 dolerite 5 516.8 shale 4 210.9 ns 5 637.3 ns 4 633.0 dolerite 1 1100.3 granite 3 879.0 marble 3 1029.7 granulite 3 1029.7 granite 3 532.6 dolerite 3 1100.3 amphibolite 3 918.1 basalt 3 755.2 granite 3 816.4 amphibolite 3 765.7 basic 3
nd basic 3 612.8 dolerite 3 634.3 dolerite 3 918.1 basalt 4 644.0 dolerite 1 1000.0 basic 3 550.5 dolerite 4 720.3 ns 1 680.2 basic 1 506.0 dolerite 3 549.8 sandstone 3 1004.0 ns 3 579.6 basic 1 1000.0 basic 1 720.0 dolerite 3 765.7 basic 3 918.1 ns 5 445.9 ns 3 569.3 basic 4
66

Appendix 2 Selected soil physical and sesquioxide characteristics of melanic soils in South Africa
C no % sand
% silt
% clay
PI % CEC/soil
% CEC/clay
% CBO Fe
% COBAI
% CBO Mn
3277 45 13 39 20 21 53 0.59 0.07 0.49 D246 60 9 28 24 24 87 0.35 0.05 0.02 2349 27 19 51 36 28 55 1.40 0.14 0.08 2878 34 10 54 31 28 51 0.89 0.15 nd 4247 28 17 45 20 18 40 6.82 0.63 0.07 6436 53 12 36 23 18 51 2.32 0.18 0.06 6142 40 15 43 28 24 55 2.57 0.17 0.07 7666 20 35 40 32 22 54 1.47 0.12 0.09 4282 49 7 43 26 34 79 1.63 0.14 0.05 2234 66 6 28 25 19 68 0.70 0.10 nd 2361 71 7 19 sandy 12 62 0.37 0.04 0.02 5405 25 37 35 19 20 56 2.40 0.20 nd 4654 67 13 22 sandy 15 67 1.18 0.12 0.01 5105 15 49 37 21 27 74 3.00 0.35 0.16 8462 38 34 26 13 14 54 0.40 0.10 0.10 3978 38 19 40 29 29 72 1.22 0.06 0.03 4381 47 8 42 24 16 39 2.23 0.12 0.33 1968 42 7 52 28 51 98 1.75 0.20 nd 3517 20 22 53 23 25 47 5.32 0.51 0.19 5428 68 11 19 12 10 52 2.00 0.20 nd
8651 23 30 39 18 37 95 1.23 0.08 0.08 7937 28 31 36 29 22 62 3.48 0.02 0.01 2712 56 7 38 20 14 37 0.93 0.09 nd
3697 19 22 59 36 28 47 2.67 0.17 nd
2238 31 23 43 34 27 63 4.08 0.07 0.02 4671 22 23 55 28 . 27 48 5.26 0.20 0.04 5870 15 22 65 nd 53 82 3.92 0.34 0.13 8517 26 30 44 32 35 80 1.00 0.10 0.10 1790 31 13 52 30 19 36 6.08 0.28 0.41 · 3580 8 29 61 23 26 43 4.47 0.39 0.17 3609 26 16 53 20 18 34 5.67 1.36 0.01 4543 54 3 37 23 13 34 2.98 0.55 0.01 2009 25 15 54 22 16 29 7.28 0.48 0.04 2484 31 18 41 20 26 64 5.17 0.36 0.04 6256 47 17 34 19 20 59 0.00 0.00 0.00 3279 75 3 20 12 11 55 0.31 0.04 0.10
67

Appendix 2 Continued
C no % sand
% silt
% clay
PI % CEC/soil
% CEC/clay
% CBDFe
% CDBAI
% CBDMr
4327 58 12 29 26 12 41 0.88 0.11 0.23 4304 78 5 15 sandy 10 69 0.24 0.03 0.01 3714 55 13 29 28 26 88 1.14 0.05 0.28 6731 50 10 40 35 29 73 0.20 0.00 nd 7527 37 30 31 18 18 58 1.11 0.07 0.09 8669 41 30 28 18 34 121 1.00 0.10 0.10 2345 48 13 34 21 16 46 0.70 0.23 0.40 3637 67 10 17 14 14 81 1.16 0.28 0.01 4131 42 36 22 nd 34 156 7.26 0.49 0.27 4129 55 15 27 3 19 71 6.28 0.18 0.09 7383 53 13 30 17 14 48 1.34 0.32 0.01 3282 52 8 36 15 21 57 1.58 0.12 0.20 3639 22 22 54 21 30 55 4.20 0.62 0.12 1785 31 17 50 28 27 54 6.21 0.60 0.65 3832 44 18 36 22 17 47 3.93 0.46 0.08 5959 32 25 39 30 28 72 4.81 0.68 0.09 8646 21 34 44 24 36 83 2.44 0.15 0.12 8131 8 25 63 31 32 50 4.88 0.06 0.10 2283 39 27 34 31 31 91 1.50 0.06 0.02 4882 51 16 33 25 23 68 2.33 0.18 0.20 4223 75 6 15 sandy 11 70 0.61 0.08 0.03 1705 · 40 13 46 33 12 27 4.79 0.64 0.17 8653 27 43 34 18 37 107 2.22 0.58 0.01 1991 39 13 50 30 25 50 0.56 0.11 nd
1322 34 10 53 34 27 50 2.90 0.37 0.58 2347 45 9 40 24 26 66 0.99 0.09 0.10 1963 43 8 47 33 38 80 1.40 0.13 nd 1971 41 9 49 27 9 18 0.91 0.13 nd
3613 14 25 55 30 31 57 3.65 0.32 0.32 8664 28 29 44 35 44 100 1.40 0.20 0.00 8572 18 43 37 24 18 50 3.69 0.52 0.16 5017 38 27 36 22 21 58 12.37 0.40 0.19 8649 27 42 29 24 17 58 1.03 0.10 0.12 4529 70 7 22 18 17 77 0.67 0.08 0.23 2964 61 5 33 25 20 60 0.35 0.07 0.07 8555 34 29 37 17 13 35 1.10 0.10 0.00
nd - not determined
68

A d' 3 Sit d '1 h . 1ppen IX eece SOl c emlca rf fl' '1P!ope les 0 me anlc SOl S C no % pH pH Na Ca MJI K
OM H2O Ca cmol(+J/k1J 3277 0.5 9.0 7.9 4.0 11.0 9.8 0.2 0246 1.5 8.5 nd 0.3 34.9 4.8 0.5 2349 1.3 7.3 6.4 0.3 6.6 23.3 0.3 2878 1.0 8.4 7.2 0.5 22.4 5.8 0.5 4247 1.9 6.8 5.2 1.7 3.6 4.7 0.1 6436 1.1 7.5 6.4 0.1 8.5 5.6 0.2 6142 1.8 7.4 6.4 0.2 11.5 8.9 0.1 7666 1.6 7.3 nd 3.2 10.5 13.4 1.5 4282 1.6 8.7 7.4 1.9 17.7 13.4 0.4 2234 0.7 9.3 7.8 6.0 4.5 10.1 0.4 2361 1.6 6.3 6.0 0.1 8.6 3.3 0.2 5405 1.3 6.3 5.6 0.1 7.8 7.4 0.3 4654 1.1 6.1 5.2 0.1 6.8 3.1 0.1 5105 2.2 6.6 5.6 0.4 8.5 9.7 0.1 8462 1.2 7.6 nd 0.2 9.7 4.2 0.8 3978 1.1 7.0 6.4 0.3 10.3 14.4 0.2 4381 1.4 5.4 5.0 0.3 6.7 5.0 0.3 1968 1.2 6.7 6.0 0.1 2.8 1.3 0.7 3517 2.7 6.1 5.4 0.4 9.1 5.5 0.1 5428 1.2 7.4 6.6 0.1 5.2 2.4 1.0 8651 2.4 6.8 nd 0.3 21.7 14.9 0.4 7937 2.8 6.3 nd 0.3 11.0 8.0 0.4 2712 1.0 7.5 7.1 0.2 11 .9 3.5 0.7 3697 1.7 6.7 5.5 0.8 8.6 9.9 0.7 2238 1.1 8.7 8.3 15.7 11.2 7.7 0.3 4671 0.9 7.0 6.4 0.4 11 .5 8.7 0.2 5870 2.5 8.4 7.5 8.7 18.2 21.7 0.2 8517 1.5 6.7 nd 0.3 21.1 14.0 0.6 1790 2.6 6.3 5.5 0.5 6.0 5.9 0.1 3580 1.8 6.4 5.8 0.6 11.9 8.0 0.1 3609 2.7 5.8 5.0 0.4 2.0 4.7 0.0 4543 1.5 6.2 5.1 0.1 4.8 2.1 0.0 2009 2.2 6.4 5.2 0.2 4.7 3.4 0.1 2484 1.1 6.7 5.8 0.4 9.5 5.1 0.3 6256 1.2 6.7 5.8 0.2 10.8 5.4 0.3 3279 0.6 8.7 7.5 0.5 6.7 6.4 0.2 4327 1.2 6.2 5.2 0.0 5.3 2.5 1.2
69

Appendix 3 Continued
C no % OM
pH H2O
pH Ca
Na Ca Mg K cmol(+)/kg
4304 0.7 6.4 5.2 1.5 2.9 3.5 0.1 3714 1.8 7.3 6.2 0.2 15.1 8.5 0.1 6731 0.7 8.2 7.0 . 0.9 18.2 10.1 0.3 7527 0.8 7.7 nd 0.2 8.5 6.9 0.7 8669 2.0 6.8 nd 0.3 22.6 11.3 0.4 2345 1.4 5.9 5.3 0.1 7.0 5.6 0.4 3637 2.8 5.7 4.4 0.3 2.0 1.5 0.0 4131 2.9 7.7 7.0 0.3 27.1 5.3 0.5 4129 2.0 6.0 5.6 0.2 5.5 4.8 0.1 7383 2.6 5.9 nd 0.4 5.2 3.9 0.1 3282 0.8 7.5 6.8 0.4 12.9 7.2 0.2 3639 3.2 5.9 5.2 0.8 7.9 11.2 0.1 1785 3.6 6.4 5.7 0.8 12.9 10.2 0.5 3832 1.9 6.6 5.6 0.4 8.4 4.1 0.1 5959 4.2 5.7 4.9 0.2 11.7 5.7 0.1 8646 3.6 6.3 nd 0.2 22.1 10.7 0.4 8131 4.3 6.3 nd 0.5 17.5 10.5 0.3 2283 1.7 8.5 5.7 0.4 30.4 8.3 0.1 4882 2.2 7.9 7.4 0.3 21.2 4.4 0.2 4223 1.3 6.3 5.2 0.5 2.9 3.7 0.3 1705 3.3 5.8 5.1 0.1 4.9 3.1 0.3 8653 3.1 5.8 nd 0.3 16.2 8.1 0.8 1991 1.2 7.1 6.3 0.7 19.7 6.9 0.5 1322 1.5 nd 5.8 0.3 12.3 6.9 1.0 2347 1.7 6.7 6.1 0.3 14.5 11.0 0.5 1963 1.5 6.7 6.0 0.3 19.3 11.3 0.3 1971 0.8 6.9 6.1 0.1 0.3 2.3 0.6 3613 2.6 5.6 4.5 2.2 1.7 7.7 0.1 8664 2.9 6.4 nd 0.3 25.0 16.2 0.8 8572 3.5 5.4 nd 0.1 4.8 2.7 0.7 5017 2.4 6.3 5.2 0.3 8.1 4.4 0.5 8649 1.7 6.2 nd 0.5 0.6 7.1 0.6 4529 1.3 6.4 5.7 1.7 6.0 4.2 0.0 2964 0.5 7.4 6.7 0.8 14.9 5.3 0.2 8555 1.4 6.5 nd 0.3 6.3 3.2 0.7
nd - not determined
70

" fd" 4 CI I " "I f S th Af"eaAppen IX a}/ mmera assoela Ions m me ante sal 5 a au n No % Kaolinite % Mica % Talc %HIV % Vermic/Smect
3277 15 85 0246 15 85 2349 nd nd nd nd nd 2878 9* 30 61 4247 100* 6436 39 15 46 6142 23* 17 32* 28 7666 19* 35 46* 4282 23* 18 59* 2234 7* 7 86 2361 31* 10 59 5405 47 31* 22 4654 55 13 32* 5105 39 9 28* 24 8462 32 68 3978 20 9 71 4381 71* 29* 1968 18* 38 44* 3517 77 23* 5428 61 30 9* 8651 nd nd nd nd nd 7937 35* 65* 2712 14* 86 3697 21 61 18 2238 17 14 69 4671 32 30 38* 5870 11 89 8517 5* 11 84* 1790 90 10 3580 41 59 3609 74 26 4543 65 35 2009 79 21 2484 60 28 12 6256 nd nd nd nd nd 3279 11 89 4327 29* 71 4304 36 64*
71

Appendix 4 Continued
No % Kaolinite % Mica % Talc %HIV % Vermic/Smect 3714 7* 93 6731 nd nd nd nd nd 7527 45 25 30* 8669 7 93 2345 47 17 36* 3637 74 26 4131 41 59 4129 51 49* 7383 nd nd nd nd nd 3282 17* 83* 3639 26* 13 61 1785 44 56 3832 63 37
5959 56 44 8646 28 28 44 8131 57 12 31 2283 3 4 93* 4882 4 96* 4223 8* 92 1705 82 9 9 8653 40* 60 1991 9* 21 70* 1322 nd nd nd nd nd 2347 10* 90* 1963 22 14 64 1971 5* 11 84 3613 7* 30 63* 8664 nd nd nd nd nd 8572 71 29 5017 67 17* 16 8649 28* 28 44 4529 27 7 66* 2964 12 88 8555 71 29 ..
* - mterstratlfled nd - not determined
72
Appendix 5 Soil profiles identified as melanic based on field evidence, that classify as vertic or humic according to PI or CEC, respectively
Appendix 5.1 Classification and soil forming factors of the soils
Profile C no Soil Soil Rainfall Parent Topograph} group family (mm/aJ material
Vertic 909 2240 Bonheim bonheim 612.80 rhyolite 4
490 3691 Bonheim bonheim 549.80 mudstone 5 659 4226 Bonheim bonheim 888.20 basalt 5 484 1966 Bonheim bonheim 549.80 ns 3 647 4286 Bonheim glengazi 722.70 basalt 4
947 1726 Bonheim stanger 808.20 basic 3 1613 6631 Mayo msinsini 706.30 dolerite 3 1248 5872 Mayo pafuri 888.20 dolerite 3 643 1776 Milkwood Igraythorne 608.10 basalt 3 1674 8665 Milkwood milkwood 727.90 basic 3 1252 1797 Ifambankulu fenfield 918.10 basalt 4
Humic 661 3962 Bonheim stanQer 1078.70 ns 3 ..
ns - not specified
Appendix 5.2 Selected soil physical and sesquioxide characteristics of the soils
·
C no % sand
% silt
% clay
PI % CEC/soil
% CEC/clay
% CBOFe
% COB AI
% CBOMn
Vertic 2240 21 25 53 39 33.8 64 3.59 0.15 0.02
3691 36 13 48 42 32.0 67 0.59 0.11 nd 4226 15 17 65 52 47.7 73 3.05 0.19 0.34
1966 40 5 56 45 27.5 49 0.64 0.11 nd
4286 21 20 60 45 34.8 58 5.31 0.53 0.12
1726 36 15 46 41 19.7 43 4.41 0.50 0.08
6631 24 18 59 38 27.3 46 2.17 0.23 0.20
5872 27 19 55 46 39.8 72 2.94 0.22 0.11
1776 30 2 69 41 40.1 58 3.56 0.16 0.04
8665 44 29 28 52 49.8 178 1.40 0.20 0.15
1797 20 49 26 42 27.8 107 4.42 0.44 0.79
Humic
3962 30 17 52 19 2.5 5 3.15 0.17 0.15 nd - not determined
73

5 3 Sit d ·1 h . 1Append·IX eece SOl c emlca properfles 0 f the SOl S
C no % OM
pH H2O
pH Ca
Na Ca Mg K cmol +)/kg
Vertic 2240 1.2 8.7 7.6 5.9 17.7 11.9 0.5 3691 0.9 8.6 6.9 3.1 10.3 16.7 0.2 4226 1.5 8.0 7.3 3.5 20.5 22.1 0.2 1966 0.7 7.7 7.1 1.3 16.2 12.2 0.6 4286 1.8 7.7 7.3 14.7 7.3 13.9 0.2 1726 2.3 5.9 5.4 . 0.1 8.5 3.9 1.1 6631 2.4 6.8 6.1 1.0 15.0 10.5 0.2 5872 1.3 8.3 7.7 4.4 18.9 15.8 0.5 1776 2.8 7.1 6.6 0.6 25.1 15.6 1.2 8665 4.5 6.5 nd 0.6 32.2 16.1 0.5 1797 3.4 6.2 5.4 0.5 8.3 9.2 0.5
Humic 3962 3.9 6.0 5.2 0.4 8.6 5.2 0.0
nd - not determined
. f . th A h .Append·IX 54. CIay mlnera assocla Ions In e onzons
No % Kaolinite % Mica % Talc %HIV % Vermic/Smect Vertic
2240 31 19 50 3691 4 24 72 4226 16 16 68 1966 18 25 57 4286 34 11 55 1726 81 19 6631 30 70 5872 20 80 1776 27 73 8665 10 14 14 62 1797 77 14 9
Humic 3962 100
74