meeting the observations & information needs for transport ... · pdf filemeeting the...
TRANSCRIPT
Meeting the Observations & Information needs for Transport
Services -WIGOS contributing to Transporation services
Dr W. Zhang
Director, Observing and Information Systems (OBS) Department, WMO

1. WMO INTEGRATED GLOBAL OBSERVING SYSTEM
(WIGOS) – short introduction
WMO Global Observing Systems
Global Observing Systems (WWW/GOS)
RBSN, RBCN (>10,000 stations,1,000 upper-air)
AMDAR (39754/day)
Ship & Marine obs (30417/day)
Surface-based remote sensing(radars)
Meso-scale networks
WMO Space Programme
Global Atmospheric Watch (GAW)
World Hydrological Cycle Observing System (WHYCOS)
WMO Co-sponsored Observing Systems
GCOS, GOOS, GTOS

Programme
s World
Weather Watch
GOS
GDPFS
GTS
WIGOS
GCW
GAW
Hydro OS
WIS
GOOS
GEOSS
Partners
WIGOS: A future observing framework for
WMO by integrating observing
components
GCOS

Need an Integrated
Global Observing
System to meet all
requirements in a cost –
effective manner
Cg-16 (2011) decided
to Implement WIGOS
WMO INTEGRATED GLOBAL
OBSERVING SYSTEM
(WIGOS)
The whole is more than the sum
of the parts—Aristotle

EC 64 (2012) approved WIGOS Framework Implementation Plan (Global plan)
CONTENTS
1. Introduction and Background
2. Key Activity Areas for WIGOS Implementation
3. Project Management
4. Implementation
5. Resources
6. Risk Management
7. Outlook
Annexes
KEY ACTIVITY AREAS
1) Management of WIGOS implementation (EC, RAs, TCs, ICG)
2) Collaboration with WMO and co-sponsored observing systems
3) Design, planning and optimized evolution
4) Integrated Observing System operation and maintenance
5) Integrated Quality Management 6) Standardization, system
interoperability and data compatibility 7) The WIGOS Operational Information
Resource 8) Data and metadata management,
delivery and archival 9) Capacity development 10) Communication and outreach


Governance & Management
• Demo Benefits
WIGOS Information Resource
Monitoring data/products quality & availability
Phase II Regulatory Material (Manuals, Guides, ..)
• Capacity
• Regional Centers

2. Cryosphere transporation issues


Introduction to GCW

For railways
• Transportation is directly impacted by changes in snow cover, fresh-water and sea ice extent and thickness, and the degradation of permafrost. Persistent reductions in Arctic multi-year sea ice cover would benefit marine transportation and related socio-economic developments, but present a risk for marine ecosystems.
• Thawing of permafrost can lead to the degradation of roads, railroads and northern airstrips. Snowfall frequency and magnitude directly affect road and rail traffic and aircraft operations with significant cost implications to national economies. River and lake-ice provide winter roads for access to remote areas.
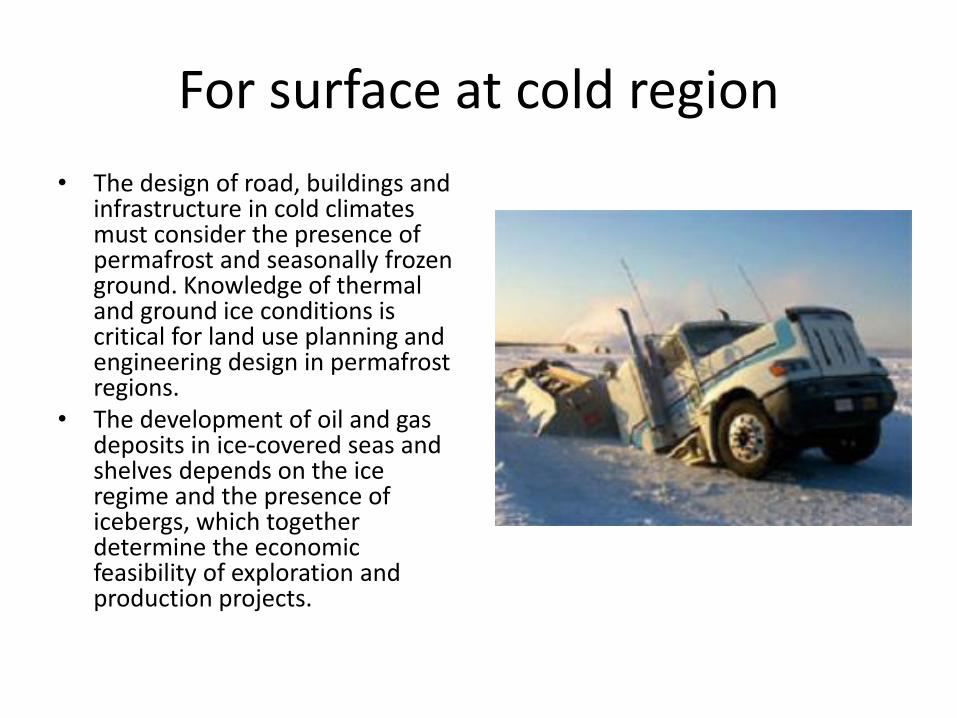
For surface at cold region
• The design of road, buildings and infrastructure in cold climates must consider the presence of permafrost and seasonally frozen ground. Knowledge of thermal and ground ice conditions is critical for land use planning and engineering design in permafrost regions.
• The development of oil and gas deposits in ice-covered seas and shelves depends on the ice regime and the presence of icebergs, which together determine the economic feasibility of exploration and production projects.

Importance of GCW to weather & climate services, including transportation services
• Cryosphere data and products support the development and delivery of climate, weather and water services by Members, including in the key GFCS areas of food security, water, health, and disaster risk reduction. Snow and ice data are required for weather and climate research and in many types of practical applications such as engineering, services to society, and various types of land- and marine-related resource.

For more information, see GCW website
globalcryospherewatch.org/ (home page)
3. Satellite new observing capabilities benefiting to land transportation

Geo-Kompsat
Next-generation geostationary constellation
Region 1 NE-JAPAN
Region 2 SW-JAPAN
Region 3
Target area
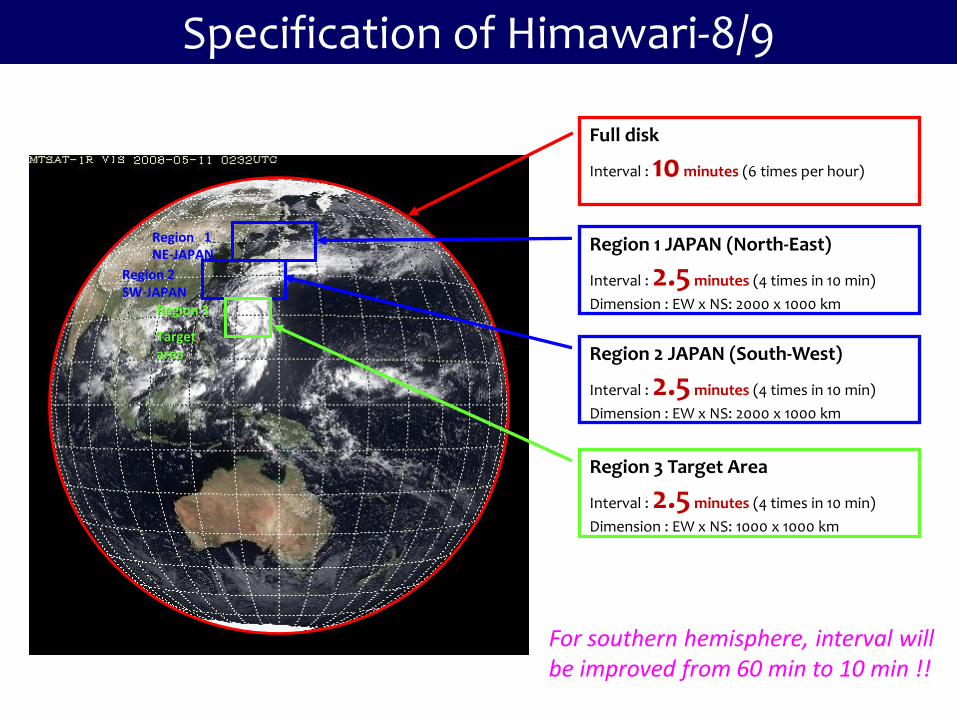
Full disk
Interval : 10 minutes (6 times per hour)
Region 3 Target Area
Interval : 2.5 minutes (4 times in 10 min)
Dimension : EW x NS: 1000 x 1000 km
Region 2 JAPAN (South-West)
Interval : 2.5 minutes (4 times in 10 min)
Dimension : EW x NS: 2000 x 1000 km
Region 1 JAPAN (North-East)
Interval : 2.5 minutes (4 times in 10 min)
Dimension : EW x NS: 2000 x 1000 km
Specification of Himawari-8/9
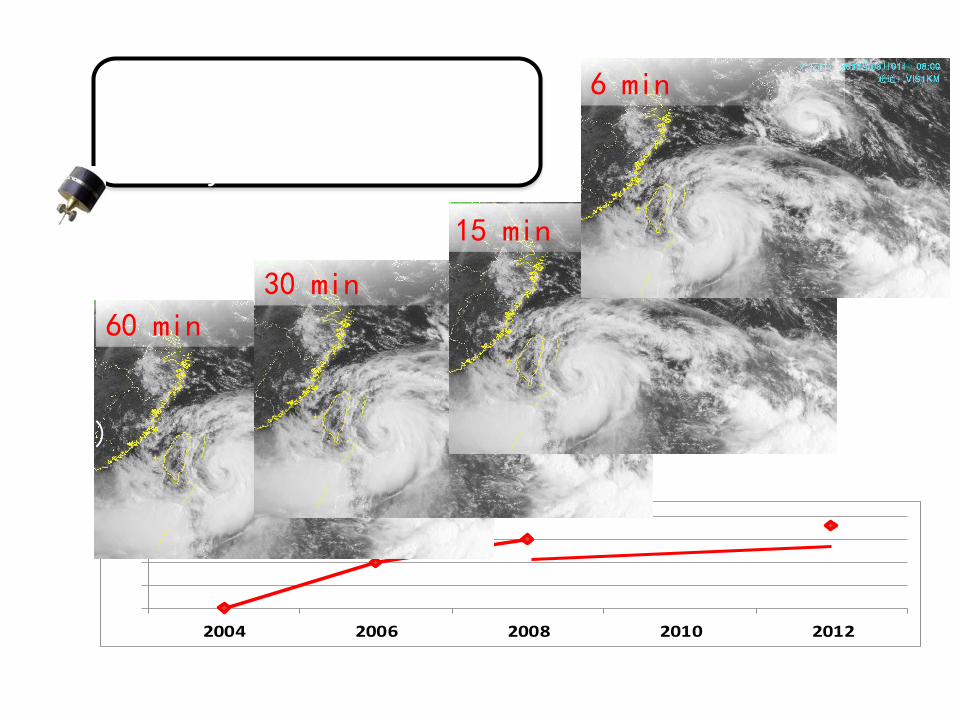
For southern hemisphere, interval will be improved from 60 min to 10 min !!

5 min interval 30 min interval
2 Sep 2011 (STS Talas)
Rapid scan observation (MTSAT-1R)

5 min interval
Rapid scan observation (MTSAT-1R)
Himawari-8/9 will provide… full disc: 10 min, target area: 2.5 min
0
15
30
45
60
2004 2006 2008 2010 2012
60 min
Current FY-2 constellation
Intensified observations up
to every 6 minutes
30 min
15 min
6 min
0
15
30
45
60
(min)
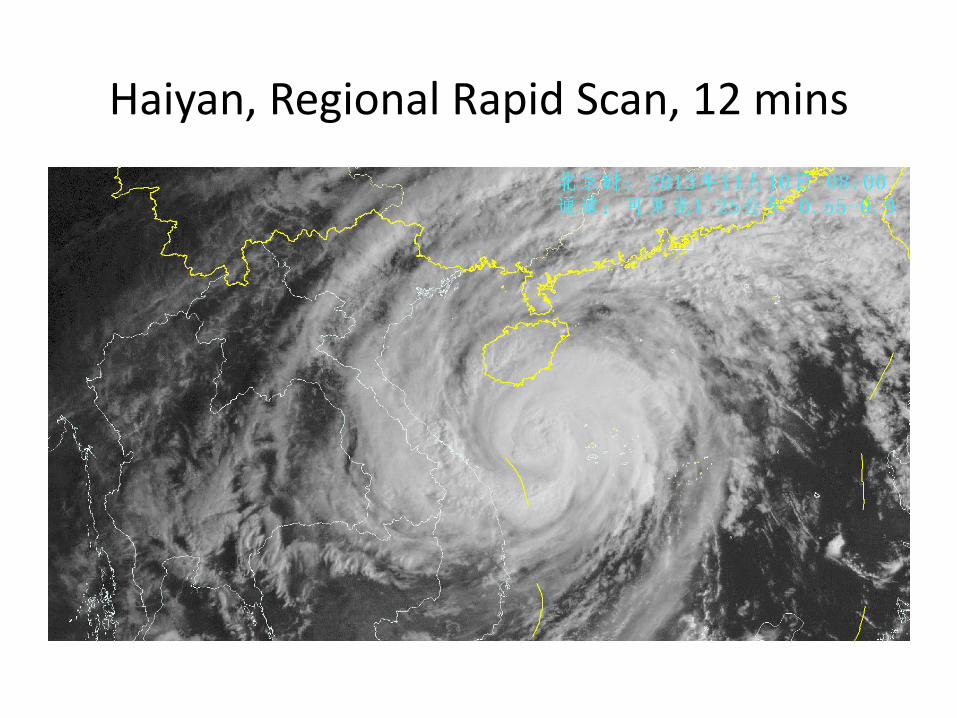
Haiyan, Regional Rapid Scan, 12 mins

Sentinel-4: the GEOSTATIONARY atmospheric mission
Europe coverage in 1 hr

For all channels except HRV For HRV
MSG MPEF products within 65° angle around subsatellite point
MSG Coverage

AEROSOLS AND ASIAN POLLUTION AFFECTING THE ENTIRE NORTHERN HEMISPHERE - IGAC
Reduction in surface solar radiation
absorption due to the Indo-Asian
haze effects (measured January to
April from 1996-1999) (Ramanathan
et al. 2001a) Steffen at al., 2004
Optical depth of particles pollution. Much of this
pollution is industrial but some is caused by
fires. NASA image.

Local weather & climate has strong impact to transport & health (Beijing)
Sat image of Jan 3, 2013 Sat image of Jan 14, 2013
test footer 25

To make best use
of satellite
observations
taking
advantages of
rich space
resources
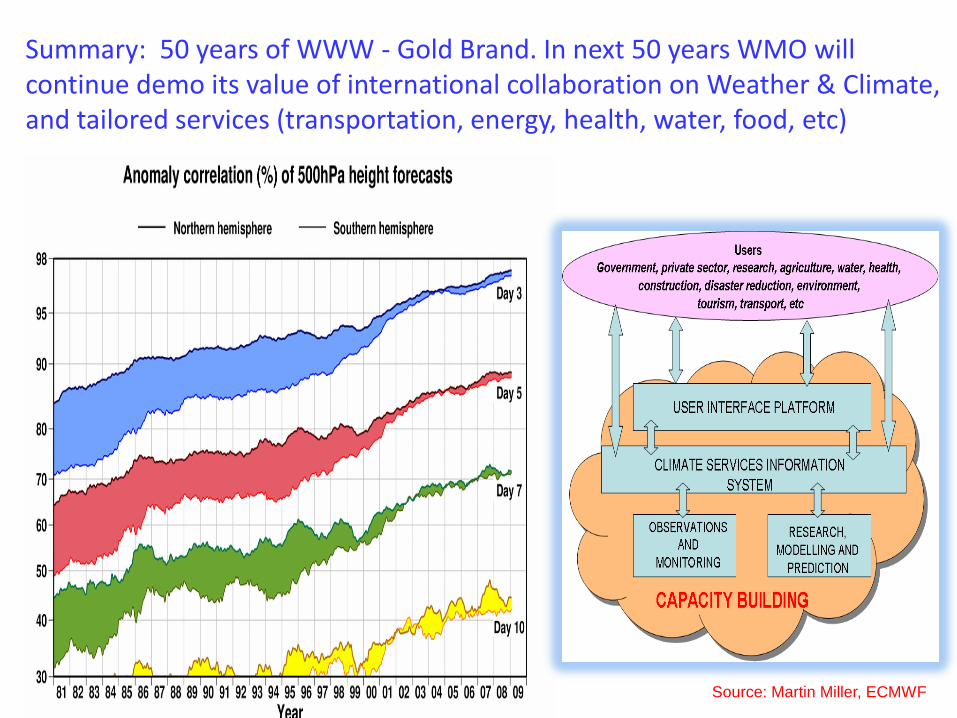
Summary: 50 years of WWW - Gold Brand. In next 50 years WMO will continue demo its value of international collaboration on Weather & Climate, and tailored services (transportation, energy, health, water, food, etc)
Source: Martin Miller, ECMWF

Thanks for your attention
Q/A ?
Backup slides

WIGOS Information Resource
WIGOS PO
OSD SAT ITS DRMM DMA

Walter views
• Meteorological observations – Station sitting
– Observation requirements and methods
– Instruments standards
– QA/QC requirements
– Metadata requirements
• Best practices specifications – Surface energy balance
– Inter-station interpolation