meet the management event - coloplast.com relations...meet the management event london, ... markets...
TRANSCRIPT

Meet the Management EventLondon, 7 May 2015
New production building in Nyírbátor, Hungary
Forward-looking statements
The forward-looking statements contained in this presentation, including forecasts of sales and
earnings performance, are not guarantees of future results and are subject to risks, uncertainties
and assumptions that are difficult to predict. The forward-looking statements are based on
Coloplast’s current expectations, estimates and assumptions and based on the information
available to Coloplast at this time.
Heavy fluctuations in the exchange rates of important currencies, significant changes in the
healthcare sector or major changes in the world economy may impact Coloplast's possibilities of
achieving the long-term objectives set as well as for fulfilling expectations and may affect the
company’s financial outcomes.
Page 2

Today’s programme
11:45 - Q2 results presentation
12:30 - Lunch
13:15 - Q&A break-out sessions
15:05 - Coffee and refreshments
15:45 - Q&A break-out sessions
17:35 - Drinks in the George pub at Andaz
Page 3

The Coloplast organisation as it stands today
Strategic Business Units
Marketing
Sales
R&D
Chronic Care
Wound Care Urology Care
Global Operations
Marketing
Sales
R&D (incl.
Consumer
Products)
Skin CareOstomy Care Continence Care
Global Business Support Functions
Sales Regions
SU
Marketing
Sales
R&D
Chronic Care R&D
Coloplast Group
Global Marketing
Strategic Business UnitsChronic Care
Porgès
Marketing
Sales
R&D
Page 4

We strengthen our commercial leadership in Chronic Care and integrate Global R&D into Global Operations
Chronic Care
Kristian
Villumsen
Products &
Brands
North
America
Payers &
Trade
Consumer
Excellence
Emerging
Markets
Commercial
ExcellenceAsiaEurope
Global
Operations
Allan Rasmussen
Global R&D Global QualityCorporate
ProcurementGlobal SCM
Global
Distribution
International
Manufacturing
Marketing Sales
Organizational changes
Page 5
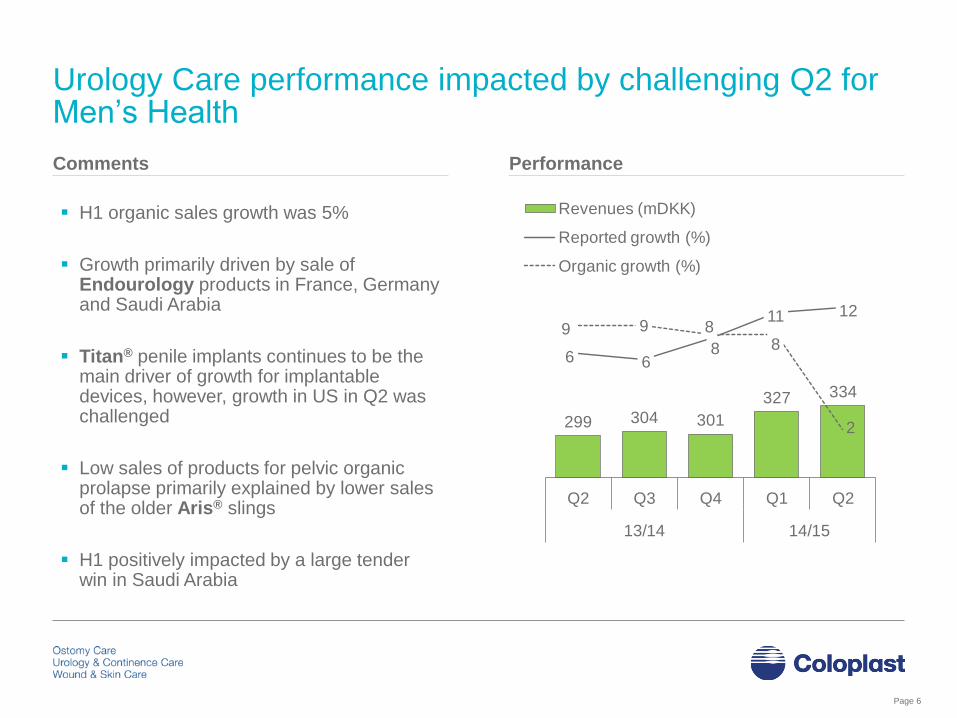
Urology Care performance impacted by challenging Q2 for Men’s Health
H1 organic sales growth was 5%
Growth primarily driven by sale of Endourology products in France, Germany and Saudi Arabia
Titan® penile implants continues to be the main driver of growth for implantable devices, however, growth in US in Q2 was challenged
Low sales of products for pelvic organic prolapse primarily explained by lower sales of the older Aris® slings
H1 positively impacted by a large tender win in Saudi Arabia
Comments Performance
Page 6
299 304 301
327 334
6 68
11 129 9 8
8
2
Q2 Q3 Q4 Q1 Q2
13/14 14/15
Revenues (mDKK)
Reported growth (%)
Organic growth (%)

Wound Care delivered 12% organic growth in H1 mainly driven by Biatain® Silicone in Europe and China
H1 organic sales growth in WSC was 9%.
Organic growth in Wound Care alone was 12%
Growth driven by Biatain® sales in particular
Biatain® Silicone in Europe, in particular in
Germany
Large tender win in Saudi Arabia, growth in
China and positive momentum in Greece
contributed to growth
Satisfactory performance in Skin Care in US
Contract manufacturing of Compeed®
contributed positively to growth
Biatain® Silicone successfully launched in all
key markets
Comments Performance
Page 7
426 428 436 438 520
3
6 8 7
22
69 9
4
14
Q2 Q3 Q4 Q1 Q2
14/15
Revenues (mDKK)
Reported growth (%)
Organic growth (%)
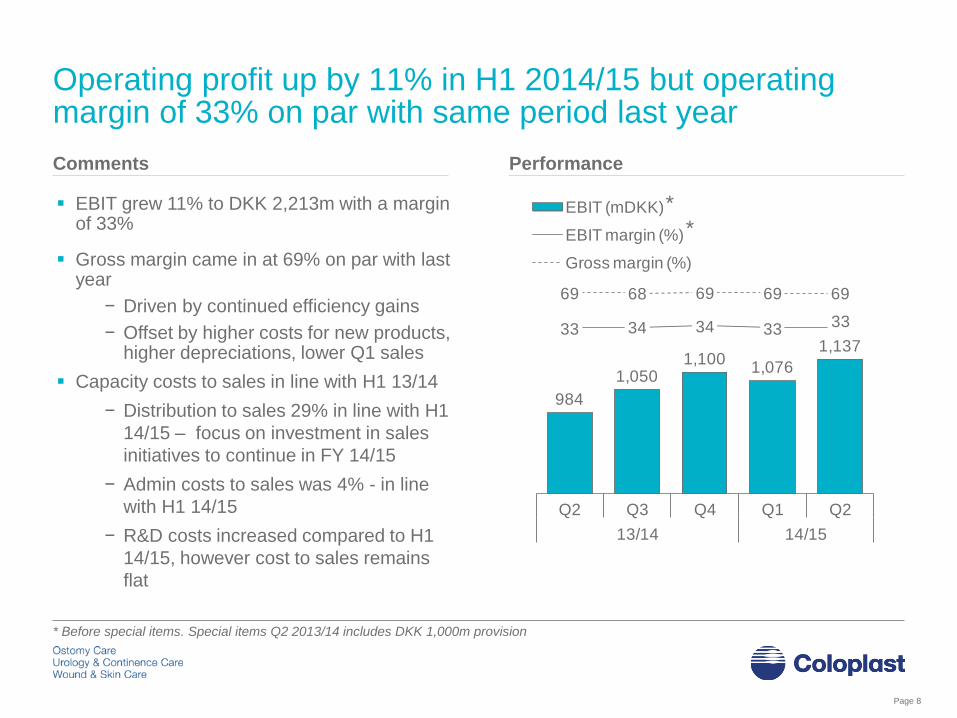
Operating profit up by 11% in H1 2014/15 but operating margin of 33% on par with same period last year
Comments Performance
EBIT grew 11% to DKK 2,213m with a margin of 33%
Gross margin came in at 69% on par with last year
− Driven by continued efficiency gains
− Offset by higher costs for new products, higher depreciations, lower Q1 sales
Capacity costs to sales in line with H1 13/14
− Distribution to sales 29% in line with H1
14/15 – focus on investment in sales
initiatives to continue in FY 14/15
− Admin costs to sales was 4% - in line
with H1 14/15
− R&D costs increased compared to H1
14/15, however cost to sales remains
flat
Page 8
*
* Before special items. Special items Q2 2013/14 includes DKK 1,000m provision
*
984
1,050 1,100
1,076
1,137 33 34 34 33 33
69 68 69 69 69
Q2 Q3 Q4 Q1 Q2
13/14 14/15
EBIT (mDKK)
EBIT margin (%)
Gross margin (%)

Free Cash Flow impacted mainly by sale of bonds to fund dividend payments
Free cash flow was DKK 965m compared to
DKK 531m in H1 2013/14
− EBITDA DKK 246m higher (before special
items*)
− NWC-to-sales of approx 26%, 2%-points
higher, due to higher inventory
− Net sale of DKK 668m in bonds
− Tax payments DKK 52m higher
− CAPEX-to-sales increased from 3.6% to
4.8% due to investments in machinery for
new and existing products and the
Nyirbator factory expansion
Comments Performance
Page 9
1,476 1,251
2,259
2,977
2,372
965
1512
2026
19
14
1.0
10.0
09/10 10/11 11/12 12/13 13/14 YTD 14/15
FCF (mDKK)
FCF-to-Sales (%)
* Special items Q2 2013/14 includes DKK 1,000m provision
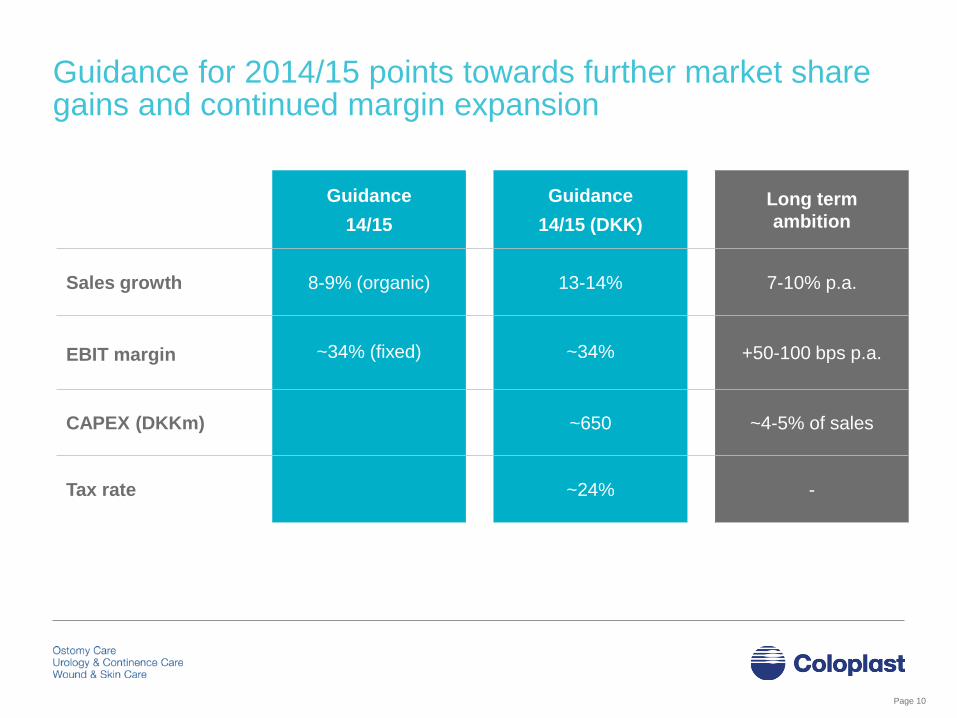
Guidance for 2014/15 points towards further market share gains and continued margin expansion
Guidance
14/15
Guidance
14/15 (DKK)
Long term
ambition
Sales growth 8-9% (organic) 13-14% 7-10% p.a.
EBIT margin ~34% (fixed) ~34% +50-100 bps p.a.
CAPEX (DKKm) ~650 ~4-5% of sales
Tax rate ~24% -
Page 10
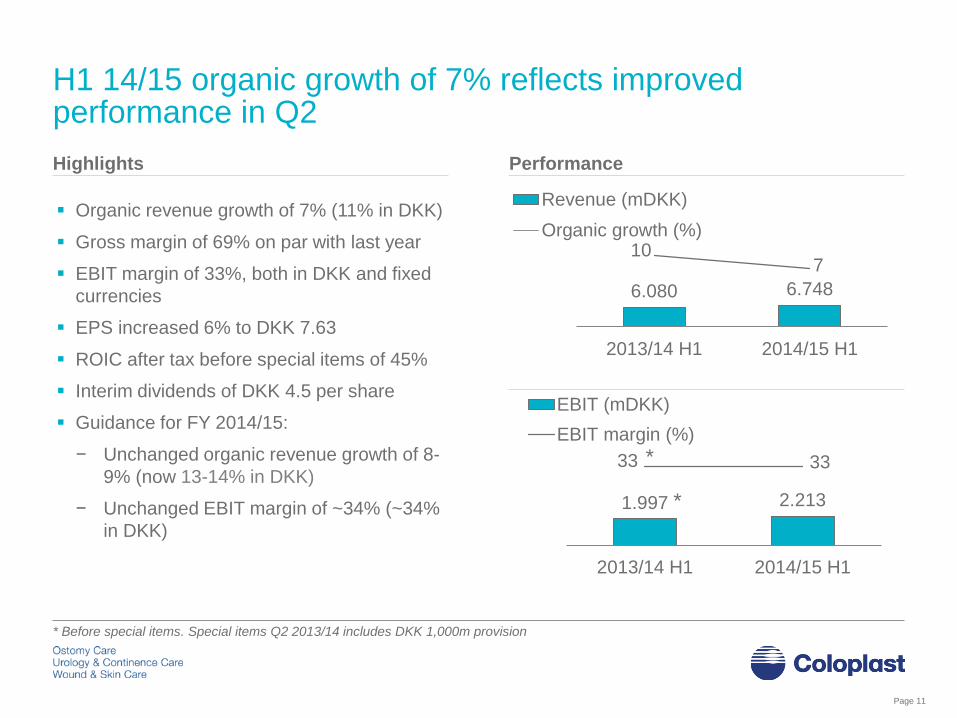
1.997 2.213
33 33
-20
0
20
40
60
01.0002.0003.0004.0005.0006.0007.0008.0009.000
2013/14 H1 2014/15 H1
EBIT (mDKK)
EBIT margin (%)
H1 14/15 organic growth of 7% reflects improved performance in Q2
Organic revenue growth of 7% (11% in DKK)
Gross margin of 69% on par with last year
EBIT margin of 33%, both in DKK and fixed
currencies
EPS increased 6% to DKK 7.63
ROIC after tax before special items of 45%
Interim dividends of DKK 4.5 per share
Guidance for FY 2014/15:
− Unchanged organic revenue growth of 8-
9% (now 13-14% in DKK)
− Unchanged EBIT margin of ~34% (~34%
in DKK)
6.080 6.748
-6
-1
4
9
01.0002.0003.0004.0005.0006.0007.0008.0009.00010.00011.00012.00013.00014.00015.00016.00017.00018.00019.00020.00021.00022.00023.00024.00025.000
2013/14 H1 2014/15 H1
Revenue (mDKK)
Organic growth (%)
Highlights Performance
Page 11
107
*
* Before special items. Special items Q2 2013/14 includes DKK 1,000m provision
*
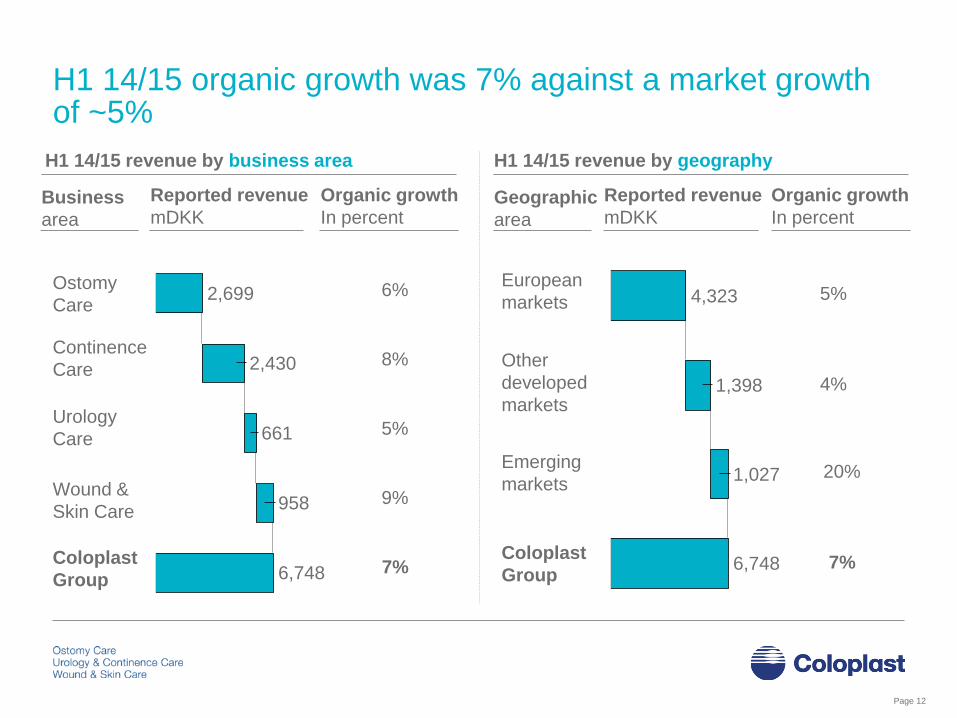
H1 14/15 organic growth was 7% against a market growth of ~5%
Other
developed
markets
Emerging
markets
Coloplast
Group
European
markets
Reported revenue
mDKK
H1 14/15 revenue by geography
Organic growth
In percent Geographic
area
5%
4%
20%
7%
Continence
Care
Urology
Care
Wound &
Skin Care
Ostomy
Care
Coloplast
Group
H1 14/15 revenue by business area
Business
area
6%
8%
5%
9%
7%
Reported revenue
mDKK
Organic growth
In percent
Page 12
1,027
4,323
6,748
1,398
661
958
2,699
6,748
2,430

Our Ostomy Care business grew 6% - growth continues to be driven by SenSura® range and Brava® accessories
H1 organic sales growth was 6%
Satisfactory growth in China, Southern
Europe, US, Nordic markets offset by
negative growth rates in Algeria, Russia
and the Netherlands
UK growth remains unsatisfactory, however,
better momentum in Q2 vs. Q1 and on track
with plan
Assura® portfolio growth driven by China,
Mexico and Turkey
Growth in Brava® accessories range
especially in US, UK and China
New SenSura® Mio continues to drive
growth and is now launched in 18 markets
Comments Performance
Page 13
1,218 1,273 1,327 1,344 1,355 4 4
7 6
117
68
5
7
Q2 Q3 Q4 Q1 Q2
13/14 14/15
Revenues (mDKK)
Reported growth (%)
Organic growth (%)

Continence Care growth continues to be driven by SpeediCath® intermittent catheters and Peristeen®
H1 organic sales growth was 8%
Growth driven by the SpeediCath® portfolio
of ready-to-use intermittent catheters and in
particular the compact versions
Satisfactory growth in US, Saudi Arabia and
France offset by negative growth in Algeria
Growth in collecting device portfolio driven by France and China
Peristeen® growth remains satisfactory especially in France, Germany and Italy
SpeediCath® Compact Eve launched in 10 markets and continues to be very well received
Comments Performance
Page 14
1,074 1,129 1,150
1,192 1,238
109 9
101512
10 9
89
Q2 Q3 Q4 Q1 Q2
13/14 14/15
Revenues (mDKK)
Reported growth (%)
Organic growth (%)

Leading intimate healthcareIntroduction to Coloplast
Page 15
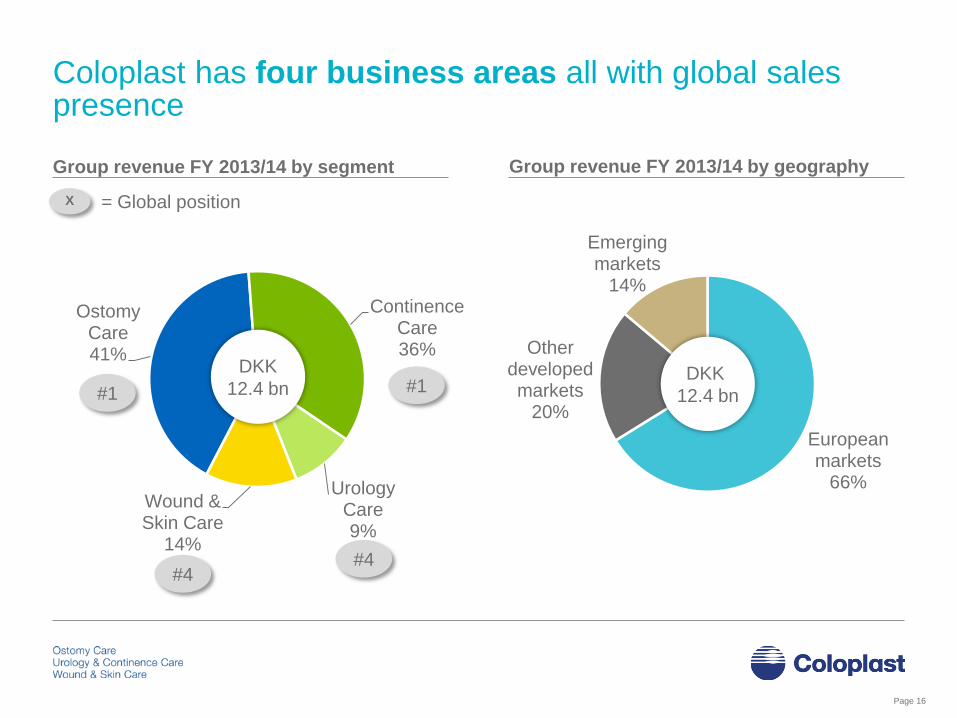
Ostomy Care41%
Continence Care36%
Urology Care9%
Wound & Skin Care
14%
European markets
66%
Other developed markets
20%
Emerging markets
14%
Coloplast has four business areas all with global sales presence
Group revenue FY 2013/14 by segment Group revenue FY 2013/14 by geography
#1
#4
#1
X = Global position
DKK
12.4 bnDKK
12.4 bn
#4
Page 16

Coloplast specializes in intimate healthcare needs
Ostomy
Care
Continence
Care
Urology
Care
Wound
Care
People who have had their intestine
redirected to an opening in the
abdominal wall
People in need of bladder or bowel management
People with dysfunctional urinary and reproductive systems
People with difficult-to-heal wounds
Who are our typical users How do we help them?
SenSura® MioOstomy bag
SpeediCath®
Compact male urinary catheter
Titan® OTRPenile implant
Biatain® SiliconeFoam wound dressing
Page 17

DemographicsGrowing elderly population increases
customer base for Coloplast products
Expanding healthcare coverage for
populations in emerging markets increases
addressable market
Earlier detection and cure, eventually reduces
addressable market for Coloplast treatment
products
Economic restraints drive reimbursement
reforms, introduction of tenders, and lower
treatment cost
Emerging markets
Surgical and medical trends
Healthcare reforms
Intimate health care is characterized by stable trends
Page 18
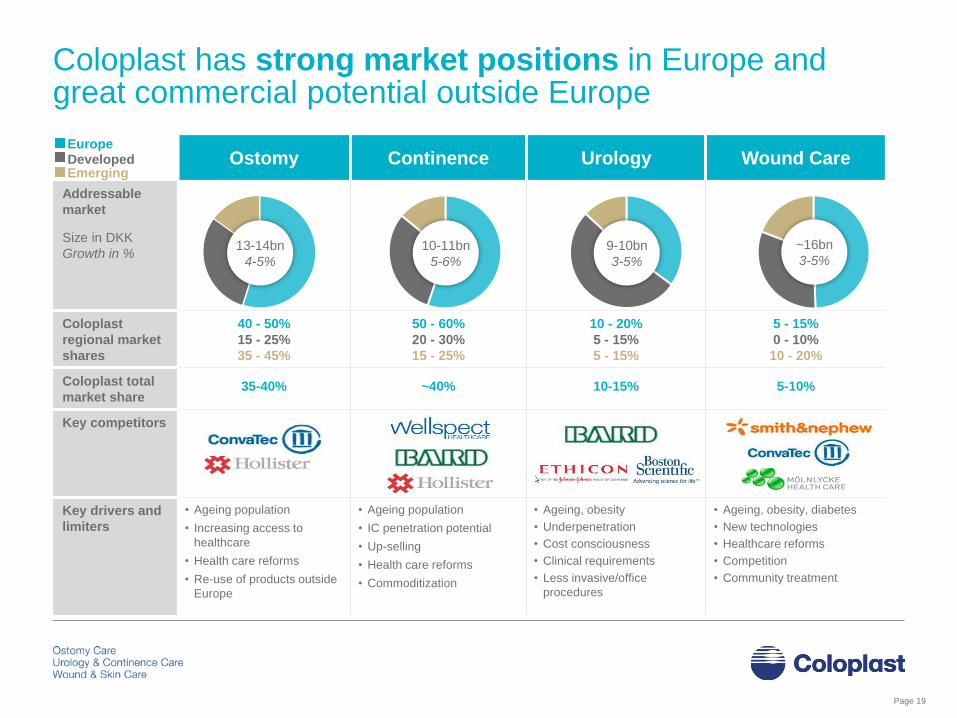
Ostomy Continence Urology Wound Care
Addressable
market
Size in DKK
Growth in %
13 -14 billion DKK
4 - 5% growth
~9 billion DKK
4 - 6% growth
9 -10 billion DKK
3 - 5% growth
~14 billion DKK
2 - 4% growth
Coloplast
regional market
shares
40 - 50%
15 - 25%
35 - 45%
50 - 60%
20 - 30%
15 - 25%
10 - 20%
5 - 15%
5 - 15%
5 - 15%
0 - 10%
10 - 20%
Coloplast total
market share35-40% ~40% 10-15% 5-10%
Key competitors
Key drivers and
limiters
• Ageing population
• Increasing access to
healthcare
• Health care reforms
• Re-use of products outside
Europe
• Ageing population
• IC penetration potential
• Up-selling
• Health care reforms
• Commoditization
• Ageing, obesity
• Underpenetration
• Cost consciousness
• Clinical requirements
• Less invasive/office
procedures
• Ageing, obesity, diabetes
• New technologies
• Healthcare reforms
• Competition
• Community treatment
Coloplast has strong market positions in Europe and great commercial potential outside Europe
EuropeDevelopedEmerging
13-14bn
4-5%
10-11bn
5-6%
9-10bn
3-5%
~16bn
3-5%
Page 19

Page 20
How we compete…
8
9
Untapped potential in Europe
Increased momentum in Other
Developed Markets – incl. breakthrough
in US
Expansion in Emerging Markets – incl.
leadership in selected countries
Wound Care leadership in key Emerging
Markets and pockets of growth in mature
markets
Global potential in Urology Care
5
6
7
…Where we compete
1 Develop and market the world’s best
products
4 Secure an efficient setup
2 Interact and build consumers relations
3 Invest in sales pressure
Our strategy remains centred on value creation through profitable organic growth
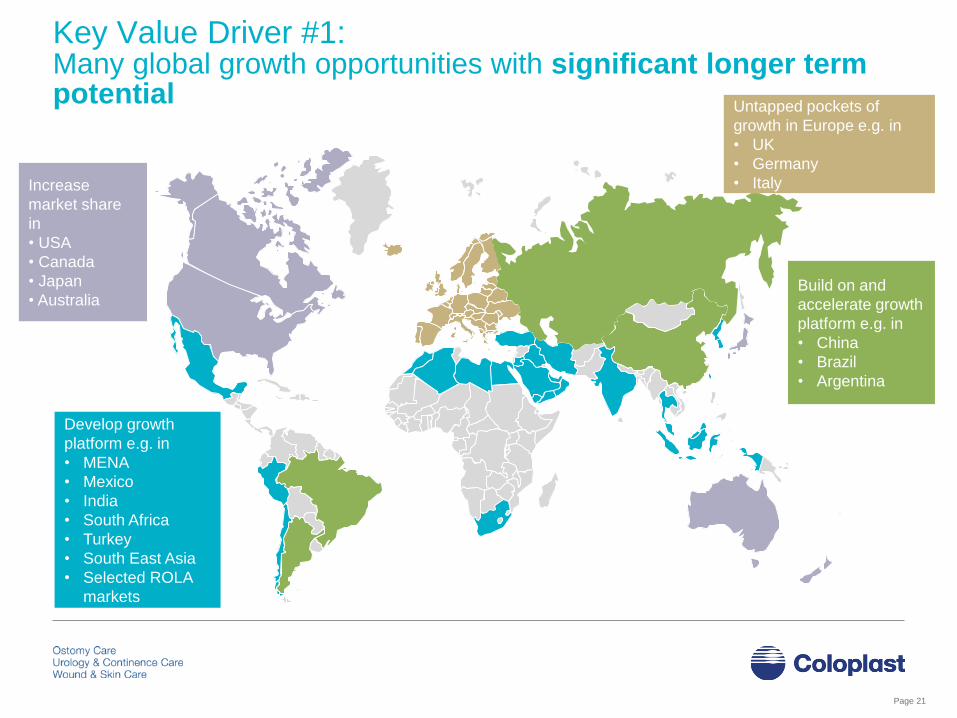
Key Value Driver #1:Many global growth opportunities with significant longer term potential
Build on and
accelerate growth
platform e.g. in
• China
• Brazil
• Argentina
Develop growth
platform e.g. in
• MENA
• Mexico
• India
• South Africa
• Turkey
• South East Asia
• Selected ROLA
markets
Increase
market share
in
• USA
• Canada
• Japan
• Australia
Page 21
Untapped pockets of
growth in Europe e.g. in
• UK
• Germany
• Italy

Key Value Driver #2:We continue to invest in Consumer Care activities to increase our interactions with the users of our products
H
Coloplast DistributorsConsumer
Pharmacies
Bandagists
Home Health Care
General
practitioner
Hospital
DtC
CARE
Page 22
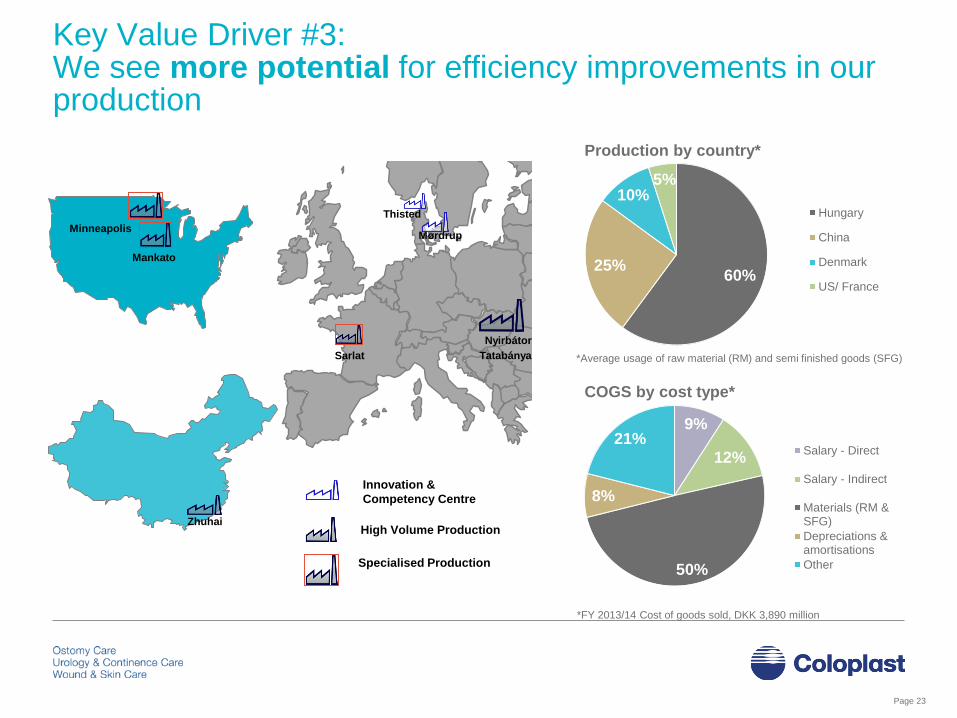
Key Value Driver #3:We see more potential for efficiency improvements in our production
23
Zhuhai
Minneapolis
Tatabánya
Nyirbátor
Mørdrup
Thisted
Sarlat
Innovation &
Competency Centre
High Volume Production
Specialised Production
Mankato
60%25%
10%5%
Hungary
China
Denmark
US/ France
9%
12%
50%
8%
21%Salary - Direct
Salary - Indirect
Materials (RM &SFG)
Depreciations &amortisations
Other
Production by country*
COGS by cost type*
*Average usage of raw material (RM) and semi finished goods (SFG)
*FY 2013/14 Cost of goods sold, DKK 3,890 million
Page 23
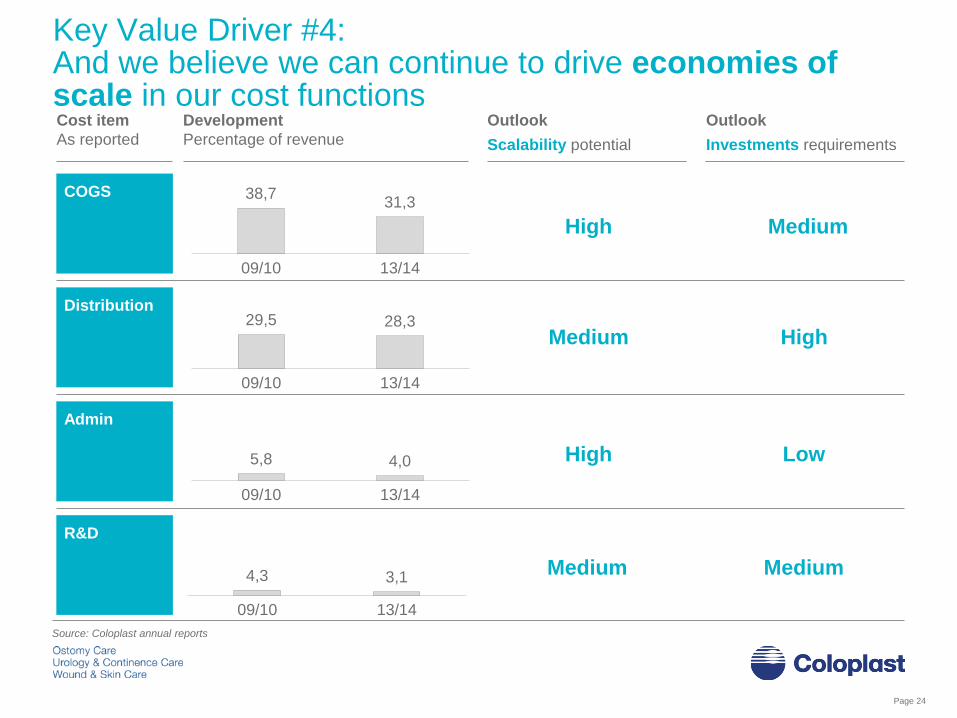
Key Value Driver #4:And we believe we can continue to drive economies of scale in our cost functions
Source: Coloplast annual reports
4,3 3,1
009/10 13/14
Medium Medium
Scalability potential Investments requirements
Outlook
38,731,3
0
50
09/10 13/14
High Medium
29,5 28,3
009/10 13/14
Medium High
5,8 4,0
009/10 13/14
High Low
Development
Percentage of revenue
Outlook Cost item
As reported
COGS
Distribution
Admin
R&D
Page 24

DKK 1bn share buy-back initiated in March
2014
Second half of buy-back program
commenced in Q2 14/15 and will be
completed by the end of the financial year
2,820 mDKK returned to shareholders via
share buy-back and dividends in 2013/14
In Q2 14/15 interim dividends of DKK 953m
were returned to shareholders
Bi-annual dividends paid in May and
December
Comments Performance
Page 25
Focus on organic value creation provides for high cash returns and continued share buy-backs
500 500 500 500 500
422 585 841
2,105 2,320
9221,085
1,341
2,6052,820
6287
5988
119
09/10 10/11 11/12 12/13 13/14
Share buy-back (mDKK)
Dividends (mDKK)
Total payouts/FCF (%)

Therefore we believe Coloplast can continue to deliver stable shareholder returns through..
Stable market trends in our Chronic Care business
Strong retention program and innovative D-t-C activities
Increased focus on growing the business outside Europe
Additional improvements in manufacturing by leveraging on global operations footprint
European leverage will provide funds for further investments in sales
Resulting in strong free cash flow generation and high return on invested capital
Page 26
4% 5%
14%11% 6%
45%
03/04 05/06 07/08 09/10 11/12 14/15H1
FCF to sales
ROIC after tax
10%
10%
7%
16%
9%
33%
03/04 05/06 07/08 09/10 11/12 14/15H1
Organic growth
EBIT Margin
*
* Before special items. Special items Q2 2013/14 includes DKK 1,000m provision
*
Appendices
Page 27

The Coloplast share (COLO’B-KO)
Coloplast share listed on NASDAQ
Copenhagen since 1983
~ 123 billion DKK (~ 18 billion USD) market
cap @ ~560 DKK per share (incl. A
shares)
Two share classes:
18m A shares carry 10 votes (family)
202m B shares carry 1 vote (freely traded)
Free float approx. 55% (B shares)
As per 30 September, 2014
45%
7%
33%
4%
9%2%
Share Capital Ownership
Holders of A-shares & family Danish Institutionals
Foreign Institutionals Coloplast A/S
Other shareholders Non-reg. shareholders
Page 28
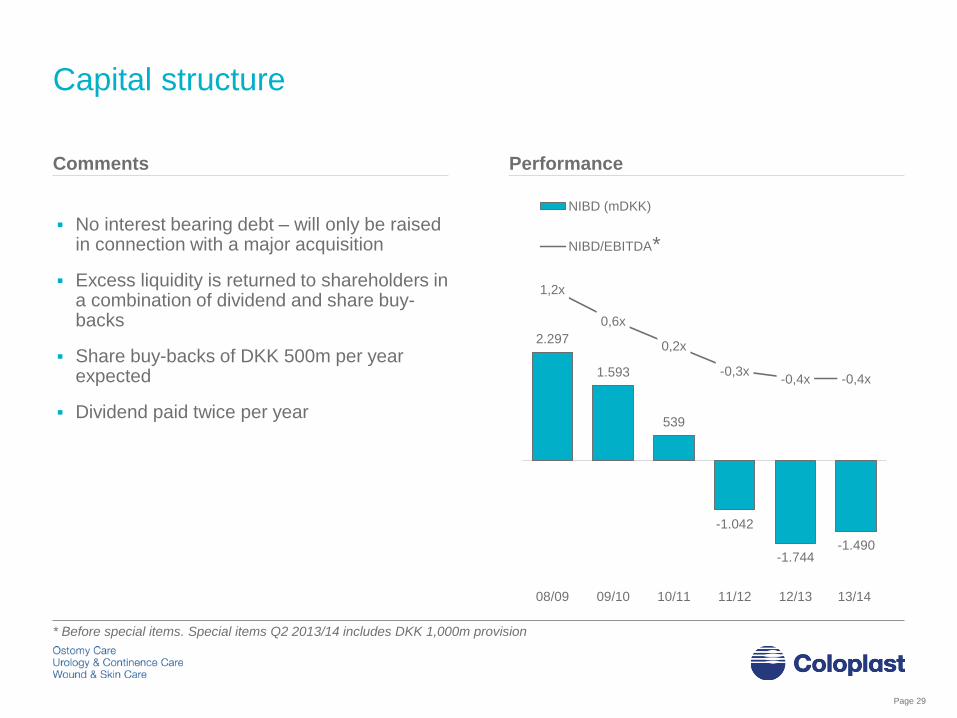
Capital structure
Comments Performance
No interest bearing debt – will only be raised in connection with a major acquisition
Excess liquidity is returned to shareholders in a combination of dividend and share buy-backs
Share buy-backs of DKK 500m per year expected
Dividend paid twice per year
Page 29
*
2.297
1.593
539
-1.042
-1.744 -1.490
1,2x
0,6x
0,2x
-0,3x-0,4x -0,4x
08/09 09/10 10/11 11/12 12/13 13/14
NIBD (mDKK)
NIBD/EBITDA
* Before special items. Special items Q2 2013/14 includes DKK 1,000m provision
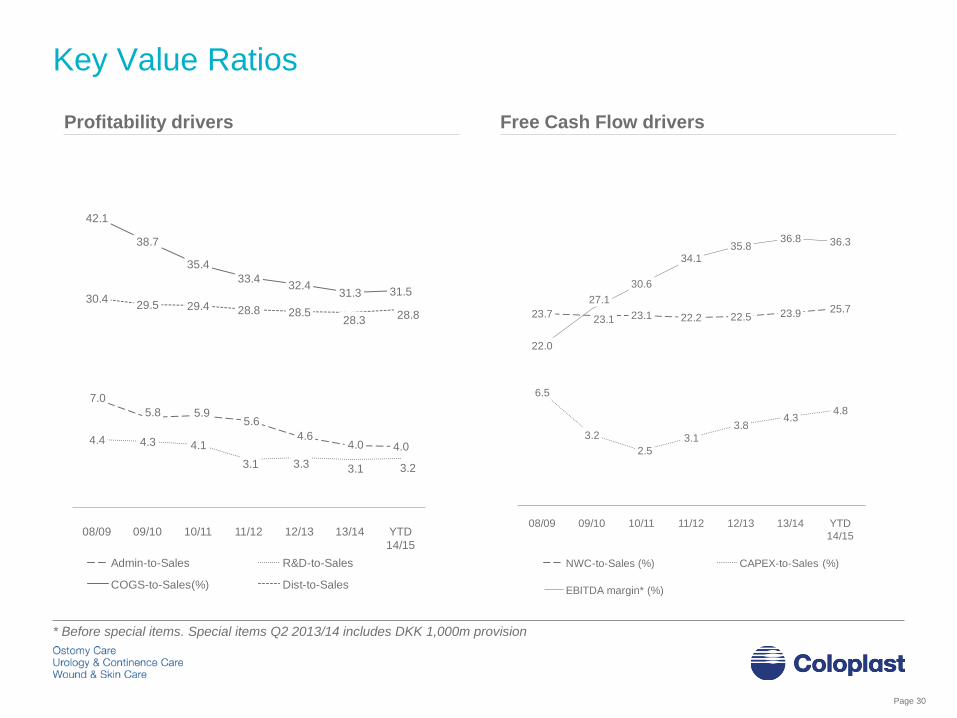
Key Value Ratios
Page 30
Free Cash Flow driversProfitability drivers
7.0
5.8 5.95.6
4.64.0 4.0
4.4 4.3 4.1
3.1 3.3 3.1 3.2
42.1
38.7
35.4
33.432.4
31.3 31.530.4
29.5 29.4 28.8 28.528.3 28.8
0.0
5.0
10.0
15.0
20.0
25.0
30.0
35.0
40.0
45.0
08/09 09/10 10/11 11/12 12/13 13/14 YTD
14/15
Admin-to-Sales R&D-to-Sales
COGS-to-Sales(%) Dist-to-Sales
23.723.1 23.1 22.2 22.5 23.9 25.7
6.5
3.2
2.5
3.1
3.84.3
4.8
22.0
27.1
30.6
34.135.8
36.8 36.3
08/09 09/10 10/11 11/12 12/13 13/14 YTD
14/15
NWC-to-Sales (%) CAPEX-to-Sales (%)
EBITDA margin* (%)
* Before special items. Special items Q2 2013/14 includes DKK 1,000m provision

Coloplast revenue development by business area
Ostomy Care Continence Care
Urology Care Wound & Skin Care
Organic growth
Reported growth
Revenue
Page 31
938 1,037 1,124 1,199661
9 11 87
11
4 6 9
9
5
1
10
100
0
2000
4000
6000
8000
10000
12000
10/11 11/12 12/13 1314 YTD
3,4563,831 4,081
4,438
2,430
8
11
7
9
13
8 8
7
10
8
30
2,000
4,000
6,000
8,000
10,000
12,000
10/11 11/12 12/13 13/14 YTD
1,512 1,522 1,582 1,700958
-1
14
8
15
-1 -1
5
109
-8
-3
2
7
12
0
2000
4000
6000
8000
10000
12000
10/11 11/12 12/13 13/14 YTD
4,266 4,633 4,849 5,091
2,699
8
9
5 5
8
7 67
8
6
-10
-8
-6
-4
-2
0
2
4
6
8
10
0
2000
4000
6000
8000
10000
12000
10/11 11/12 12/13 13/14 YTD
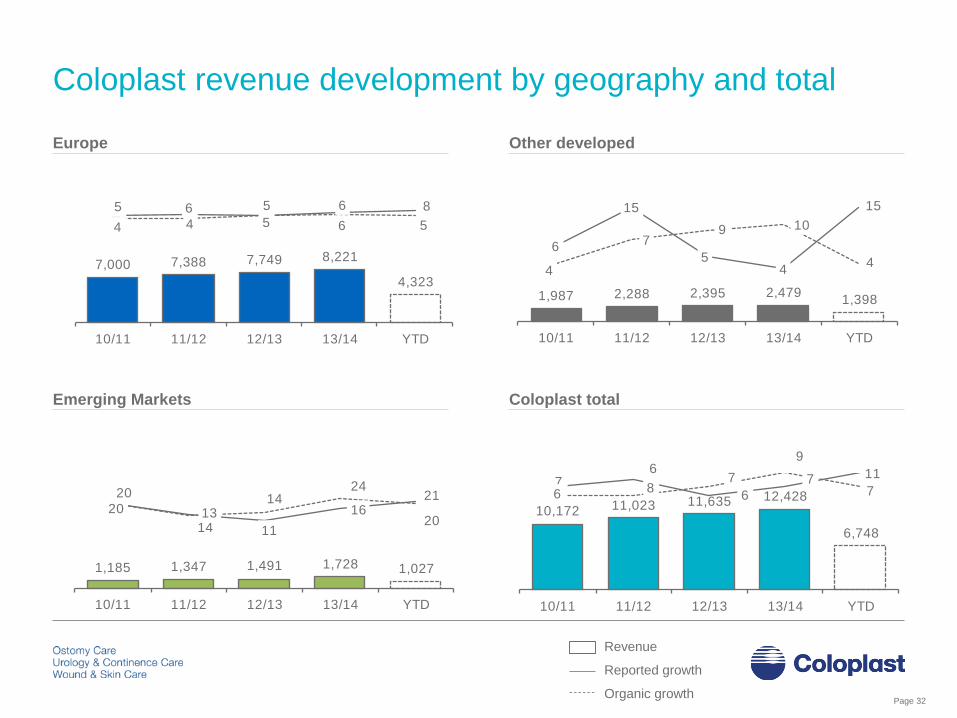
Coloplast revenue development by geography and total
Europe Other developed
Emerging Markets
Page 32
1,185 1,347 1,491 1,728 1,027
20
14 11
1621
20 1314
24
20
10/11 11/12 12/13 13/14 YTD
7,000 7,388 7,749 8,221
4,323
5 65 6
8
4 4
5 6
5
10/11 11/12 12/13 13/14 YTD
1,987 2,288 2,395 2,4791,398
6
15
54
15
4
79 10
4
10/11 11/12 12/13 13/14 YTD
10,172 11,023 11,635 12,428
6,748
7 86
7 11
6
67
9
7
10/11 11/12 12/13 13/14 YTD
Coloplast total
Organic growth
Reported growth
Revenue
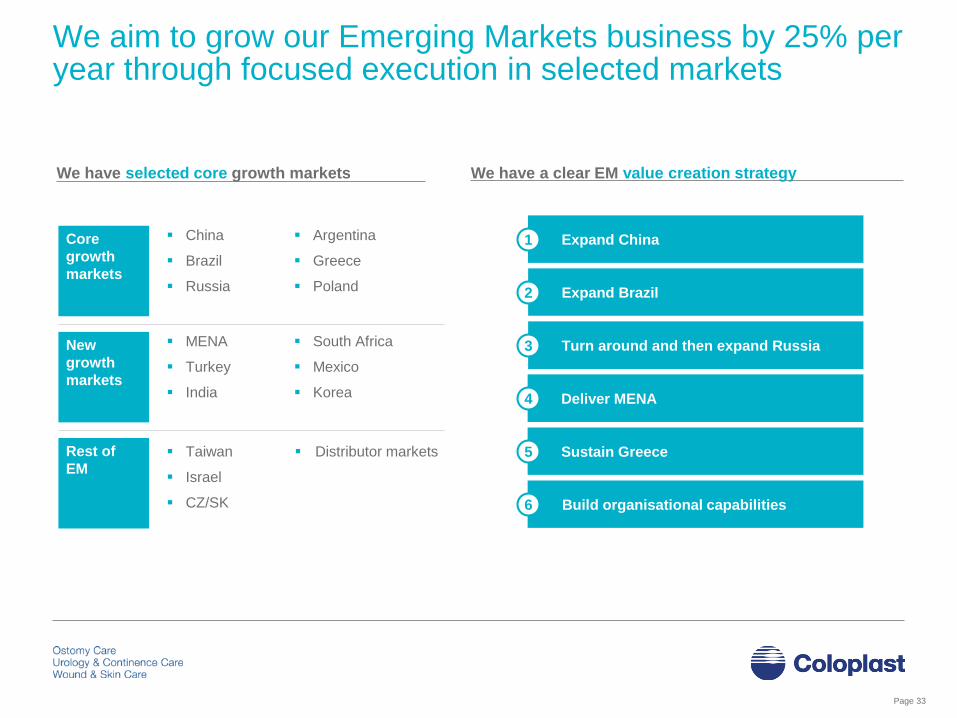
We aim to grow our Emerging Markets business by 25% per year through focused execution in selected markets
Core
growth
markets
New
growth
markets
Rest of
EM
China
Brazil
Russia
Argentina
Greece
Poland
MENA
Turkey
India
South Africa
Mexico
Korea
Taiwan
Israel
CZ/SK
Distributor markets
Expand Brazil
Turn around and then expand Russia
Sustain Greece
Deliver MENA
Expand China
Build organisational capabilities
1
2
3
4
5
6
We have a clear EM value creation strategyWe have selected core growth markets
Page 33
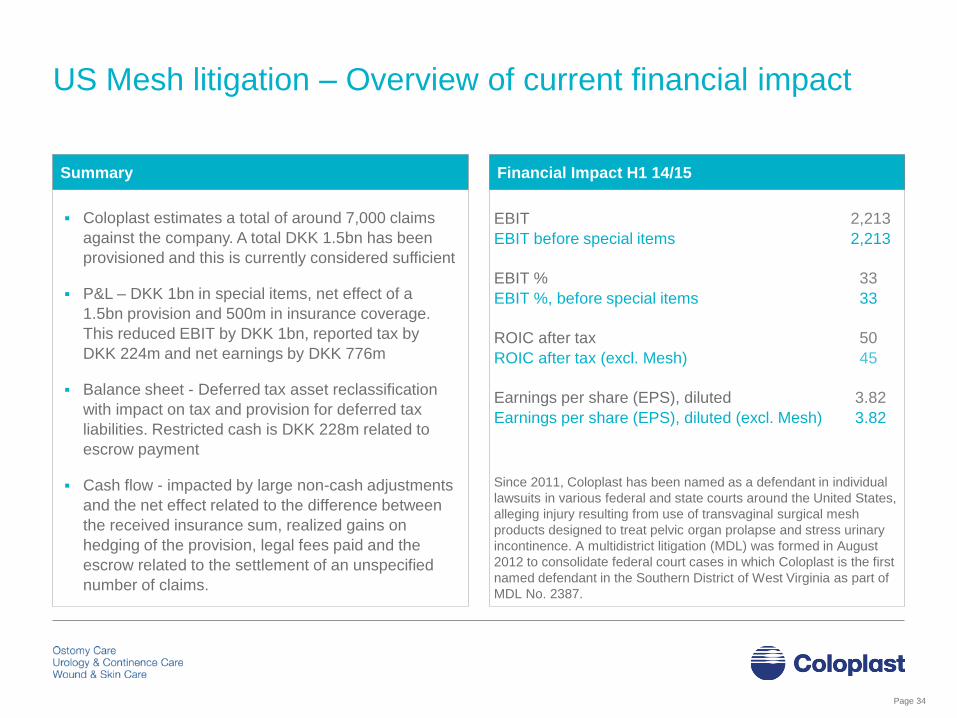
US Mesh litigation – Overview of current financial impact
TBDSummary Financial Impact H1 14/15
Since 2011, Coloplast has been named as a defendant in individual
lawsuits in various federal and state courts around the United States,
alleging injury resulting from use of transvaginal surgical mesh
products designed to treat pelvic organ prolapse and stress urinary
incontinence. A multidistrict litigation (MDL) was formed in August
2012 to consolidate federal court cases in which Coloplast is the first
named defendant in the Southern District of West Virginia as part of
MDL No. 2387.
EBIT 2,213
EBIT before special items 2,213
EBIT % 33
EBIT %, before special items 33
ROIC after tax 50
ROIC after tax (excl. Mesh) 45
Earnings per share (EPS), diluted 3.82
Earnings per share (EPS), diluted (excl. Mesh) 3.82
Coloplast estimates a total of around 7,000 claims
against the company. A total DKK 1.5bn has been
provisioned and this is currently considered sufficient
P&L – DKK 1bn in special items, net effect of a
1.5bn provision and 500m in insurance coverage.
This reduced EBIT by DKK 1bn, reported tax by
DKK 224m and net earnings by DKK 776m
Balance sheet - Deferred tax asset reclassification
with impact on tax and provision for deferred tax
liabilities. Restricted cash is DKK 228m related to
escrow payment
Cash flow - impacted by large non-cash adjustments
and the net effect related to the difference between
the received insurance sum, realized gains on
hedging of the provision, legal fees paid and the
escrow related to the settlement of an unspecified
number of claims.
Page 34

Mesh litigation status & events leading up to 1 bDKK provision
Triggering Events
Structuring & Maturing
Towards resolution
July 2011:FDA Updated Public Health Notification
April 29, 2014:FDA proposes re-classification of
POP products to Class III
Oct. 2008:FDA Public
Health Notification
June 2013:Creation of Cook MDL
Feb. 2014:Creation of
Neomedic MDL
Feb. 2012:Creation of AMS, Boston Scientific, & Ethicon MDLs
July 2011:First mesh claim against Coloplast
Aug. 2012:Creation of
Coloplast MDL
July 23, 2012:
Verdict vs Bard
CA State Court:
$3.6 mUSD (31 mDKK)
Feb. 28, 2013:
Verdict vs Ethicon
NJ State Court: 63 mDKK
June 2013:
Verdict for
Mentor
ObTape MDL
July 8, 2013:
AMS/Endo Settlement
310 mDKK
Aug. 15, 2013:
Verdict vs Bard
Bard MDL:
11.5 mDKK
Feb. 2014:
Verdict for Ethicon
Ethicon MDL
April 3, 2014:
Verdict vs Ethicon
TX State Court:
6.8 mDKK
April 30, 2014:
AMS/Endo
Settlement
4.7 bDKK
~20,000 claims
May 2, 2014:
Coloplast provision
1 bDKK
~7,000 claims
Sept. 9, 2014:
Verdict vs BSC
TX State Court:
$73 mUSD
(428.3 mDKK)
Sept. 5, 2014:
Verdict vs Ethicon
Ethicon MDL:
$3.27 mUSD (19.2 mDKK)
Sept. 30, 2014:
AMS/Endo Settlement
$830 mUSD
(4.84 bDKK)
Aug. 29, 2014:
Verdict for BSC
MA State Court
Nov. 13, 2014:
Verdict vs BSC
BSC MDL (FL):
$26.7 mUSD
(159.7 mDKK)
Nov. 21, 2014:
Verdict vs BSC
BSC MDL (WV):
$18.5 mUSD
(110.6 mDKK)
July 29, 2014:
Verdict for BSC
MA state court
June 30, 2014:
Bard Settlement
Amount Unknown
~ 500 claims
Mar. 5, 2015:
Verdict vs Ethicon
CA State Court:
$5.7 mUSD
(39.06 mDKK)
Page 35

Healthcare reform landscape
Page 36
Stable reform environment
Intensifying reform pressure
France Still awaiting periodic review of OC and CC. Price cut
in WC implemented Oct` 2014.
Germany Reimbursement level for CC under pressure.
Holland Reimbursement level for OC and CC under pressure.
Italy Tracking potential austerity cuts.
Russia Political situation has reduced the number of tenders
and depressed prices.
United
Kingdom
Health and social bill now being implemented;
government seeking efficiency savings through
Clinical Commissioning Groups (CCGs).
United
States
Healthcare reform implementation ongoing.
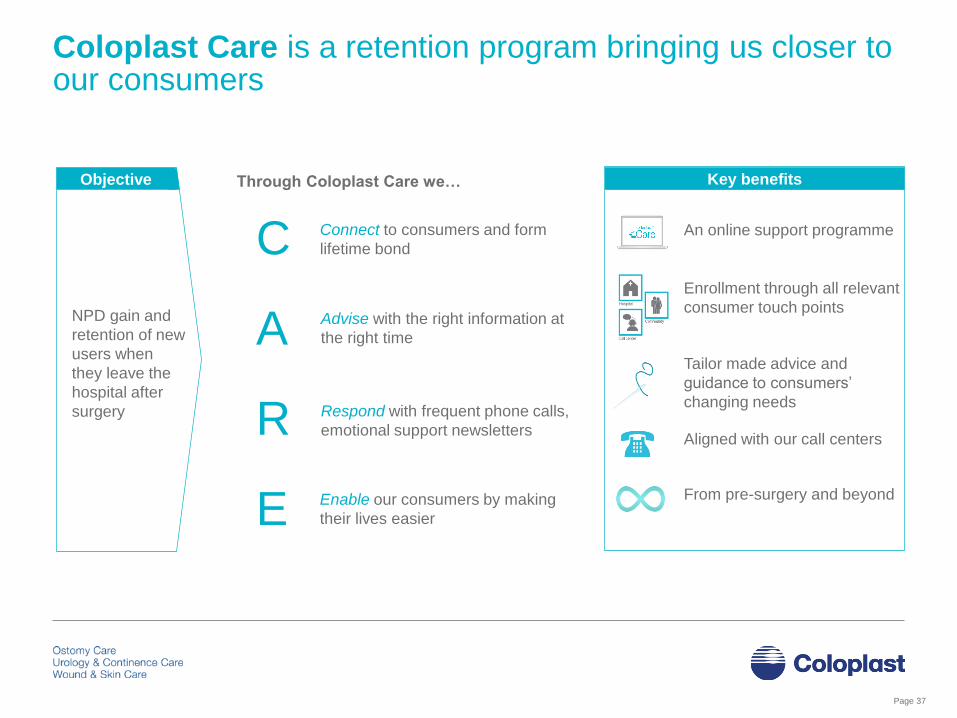
Through Coloplast Care we…
Connect to consumers and form
lifetime bond
Advise with the right information at
the right time
Respond with frequent phone calls,
emotional support newsletters
Enable our consumers by making
their lives easier
NPD gain and
retention of new
users when
they leave the
hospital after
surgery
Key benefitsObjective
C
A
R
E
An online support programme
Aligned with our call centers
Tailor made advice and
guidance to consumers’
changing needs
Enrollment through all relevant
consumer touch points
From pre-surgery and beyond
Coloplast Care is a retention program bringing us closer to our consumers
Page 37
Page 38
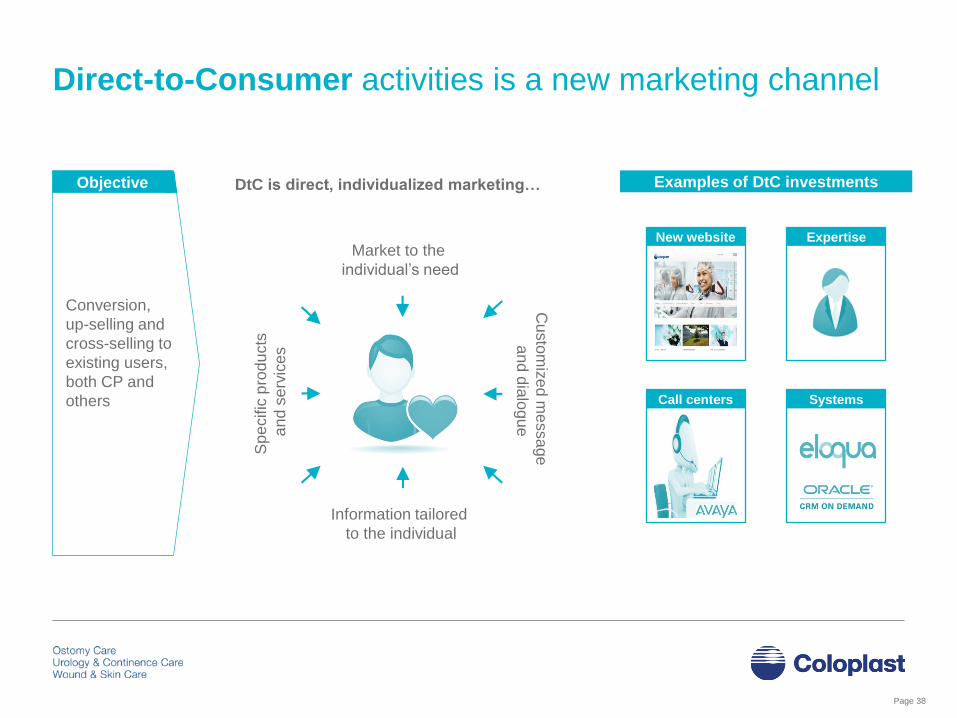
DtC is direct, individualized marketing…Objective
Market to the
individual’s need
Information tailored
to the individual
Custo
miz
ed
me
ssa
ge
an
d d
ialo
gu
e
Sp
ecific
pro
du
cts
an
d s
erv
ices
Objective Examples of DtC investments
Conversion,
up-selling and
cross-selling to
existing users,
both CP and
others
New website Expertise
Call centers Systems
Direct-to-Consumer activities is a new marketing channel
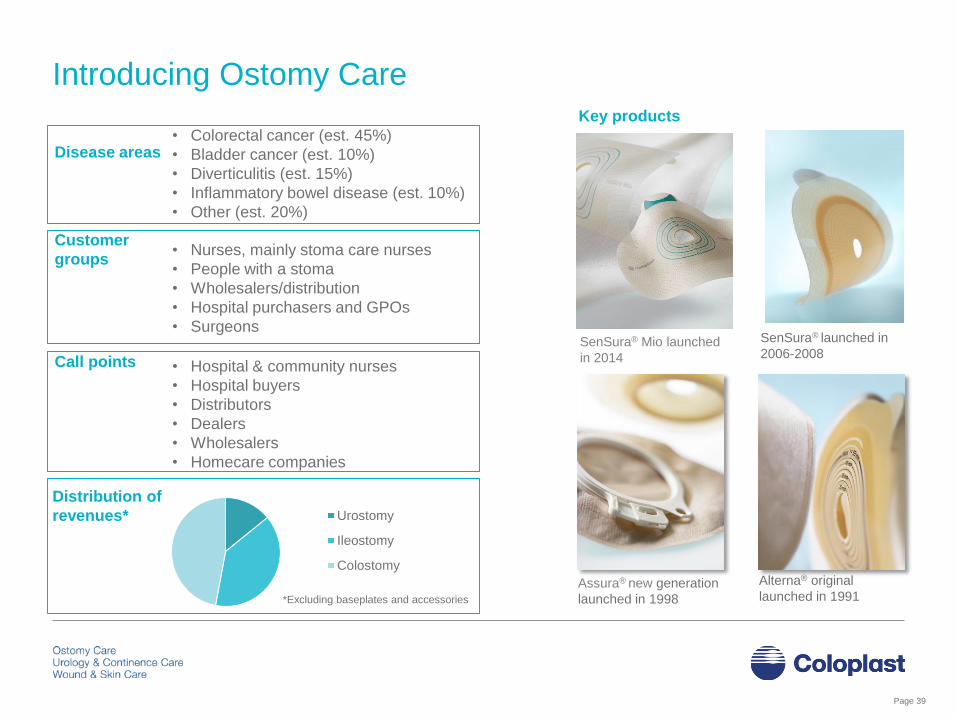
• Colorectal cancer (est. 45%)
• Bladder cancer (est. 10%)
• Diverticulitis (est. 15%)
• Inflammatory bowel disease (est. 10%)
• Other (est. 20%)
• Nurses, mainly stoma care nurses
• People with a stoma
• Wholesalers/distribution
• Hospital purchasers and GPOs
• Surgeons
• Hospital & community nurses
• Hospital buyers
• Distributors
• Dealers
• Wholesalers
• Homecare companies
Introducing Ostomy CareKey products
SenSura® launched in
2006-2008
Disease areas
Customer
groups
Call points
Assura® new generation
launched in 1998
Distribution of
revenues* Urostomy
Ileostomy
Colostomy
*Excluding baseplates and accessories
Alterna® original
launched in 1991
SenSura® Mio launched
in 2014
Page 39

Introducing Ostomy Care Accessories
Brava® is a range of ostomy accessories designed to reduce leakage
or care for skin, to make our end-users feel secure. Brava® was
launched in April 2012 and the range includes 10 different products.
Brava® Mouldable Ring
• Durable to reduce leakage
• Nurses, mainly stoma care nurses
• People with a stoma
• Wholesalers/distributors
• Hospital purchasers and GPOs
• Surgeons
Customer
groups &
call points
Market value
by geography
Key products
Emerging
markets
European
marketsOther
developed
markets
Brava ® Elastic Tape
• Elastic so it follows the
body and movements
Brava® Adhesive Remover
• Sting free and skin friendly
Brava® Skin Barrier
• Reducing skin problems
without affecting
adhesion
Brava® Lubricating
Deodorant
• Neutralizing odour
• Market size of DKK 2bn
• Market growth of 5-7%
• Market share 15-20%
• Main competitors include: Hollister
Adapt, ConvaTec, 3M Cavilon, Eakin
Market
fundamentals
Page 40

• Spinal Cord Injured, SCI
• Spina Bifida, SB
• Multiple Sclerosis, MS
• Benign prostatic hyperplasia, BPH &
prostatectomy patients
• Elderly
• Rehabilitation centers
• Urology wards
• Distributors, dealers & wholesalers
Introducing Continence Care
Conveen® Optima
external catheter
Launched in 05/06
Conveen® Security+
Launched in October 2013
Disease
areas
Main call
points
Key products
Distribution of
revenuesIntermittent catheters
Urine bags
Male ext. catheters
Bowel mgt.
• Continence or home care nurses
• Wholesalers/distributors
• Hospital purchasers and GPOs
Customer
groups
Page 41
SpeediCath® Compact Male
Intermittent catheter
Launched in January 2011
SpeediCath® Compact Eve
Intermittent catheter
Launched in October 2014

Introducing Bowel Management
Peristeen® Anal Irrigation
• Launched in 2003
• Updated in 2011
Faecal incontinence (management
products only)
Customer groups
• Spinal Cord Injured, SCI
• Spina Bifida, SB
• Multiple Sclerosis, MS
Call points
• Rehab centers
• Pediatric clinics
• Urology wards
Disease areas
Customer
groups &
call points
Distribution of revenues
Key products
Anal plug
• Launched in 1995
Market drivers
• Growing awareness
• Huge underpenetrated and
unserved population
• New devices addressing the many
unmet needs
Market limiters
• Still taboo area and non-focus for
professionals (doctors)
• Very little patient awareness
• Training required (nurses, patients)
• Lack of reimbursement
Market
dynamics
Peristeen® Anal Irrigation
Anal plug
Page 42

Men's health
Women's health
DSU
Introducing Urology CareTreatment (surgical) of urological disorders
• Urinary incontinence
• Pelvic organ prolapse
• Erectile dysfunction
• Enlarged prostate
• Kidney and urinary stones
• Surgeons
• Purchasing departments and
organizations
• End customers
• Urologists
• Uro-gynaecologists
• Gynaecologists
• Purchasing departments and
organizations
Titan® OTR penile implant
Launched in 2008
Men’s health - Surgical Urology
JJ stents
Launched in 1998
Disposable Surgical Urology
Virtue® male sling
Launched in 2009
Men’s health - Surgical Urology
Disease areas
Customer
groups
Call points
Key products (implants and surgical disposables)
Distribution of
revenues
Altis® single incision sling
Launched in 2012
Women’s health - Surgical
Urology
Page 43
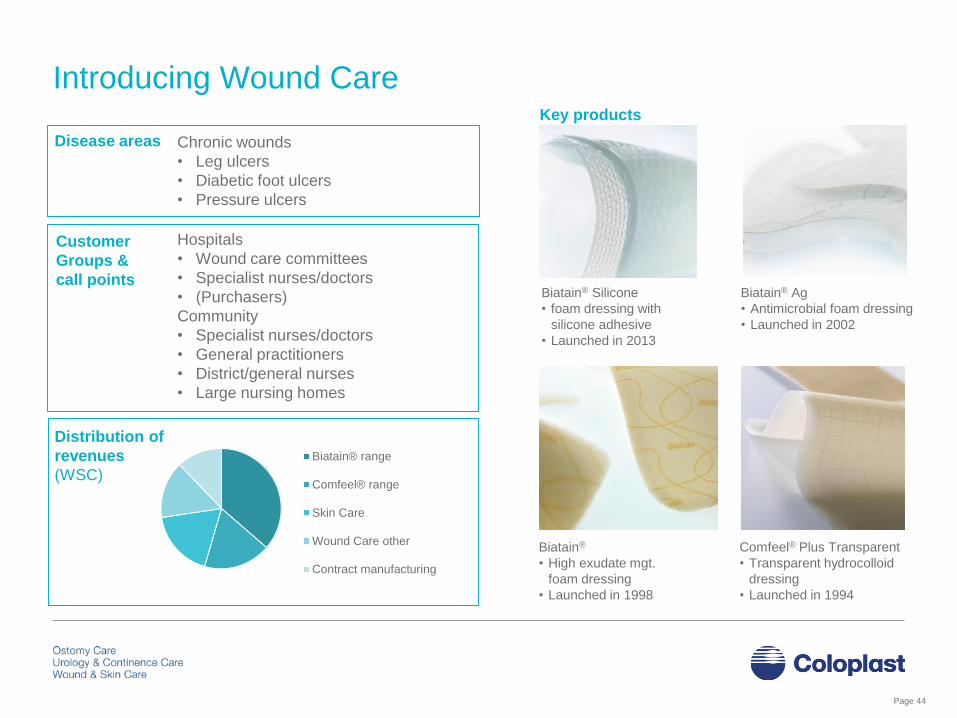
Introducing Wound Care
Comfeel® Plus Transparent
• Transparent hydrocolloid
dressing
• Launched in 1994
Biatain® Silicone
• foam dressing with
silicone adhesive
• Launched in 2013
Chronic wounds
• Leg ulcers
• Diabetic foot ulcers
• Pressure ulcers
Hospitals
• Wound care committees
• Specialist nurses/doctors
• (Purchasers)
Community
• Specialist nurses/doctors
• General practitioners
• District/general nurses
• Large nursing homes
Biatain® Ag
• Antimicrobial foam dressing
• Launched in 2002
Biatain®
• High exudate mgt.
foam dressing
• Launched in 1998
Disease areas
Customer
Groups &
call points
Distribution of
revenues
(WSC)
Key products
Biatain® range
Comfeel® range
Skin Care
Wound Care other
Contract manufacturing
Page 44
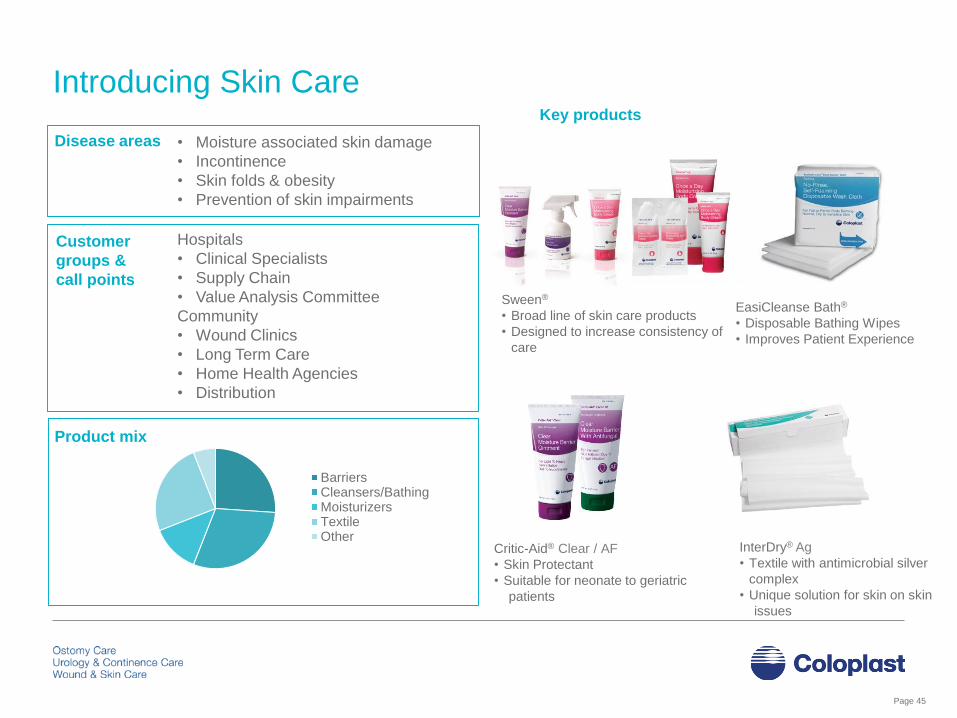
Introducing Skin Care
InterDry® Ag
• Textile with antimicrobial silver
complex
• Unique solution for skin on skin
issues
Sween®
• Broad line of skin care products
• Designed to increase consistency of
care
• Moisture associated skin damage
• Incontinence
• Skin folds & obesity
• Prevention of skin impairments
Hospitals
• Clinical Specialists
• Supply Chain
• Value Analysis Committee
Community
• Wound Clinics
• Long Term Care
• Home Health Agencies
• Distribution
Critic-Aid® Clear / AF
• Skin Protectant
• Suitable for neonate to geriatric
patients
Disease areas
Customer
groups &
call points
Product mix
Key products
BarriersCleansers/BathingMoisturizersTextileOther
EasiCleanse Bath®
• Disposable Bathing Wipes
• Improves Patient Experience
Page 45
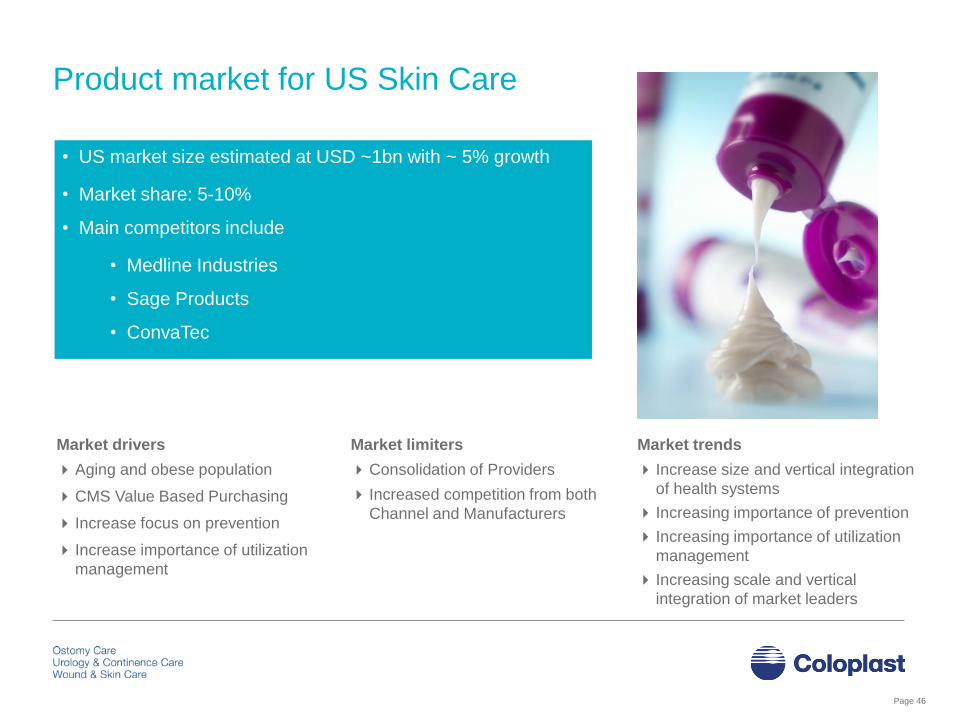
Product market for US Skin Care
Market drivers
Aging and obese population
CMS Value Based Purchasing
Increase focus on prevention
Increase importance of utilization
management
Market limiters
Consolidation of Providers
Increased competition from both
Channel and Manufacturers
Market trends
Increase size and vertical integration
of health systems
Increasing importance of prevention
Increasing importance of utilization
management
Increasing scale and vertical
integration of market leaders
• US market size estimated at USD ~1bn with ~ 5% growth
• Market share: 5-10%
• Main competitors include
• Medline Industries
• Sage Products
• ConvaTec
Page 46
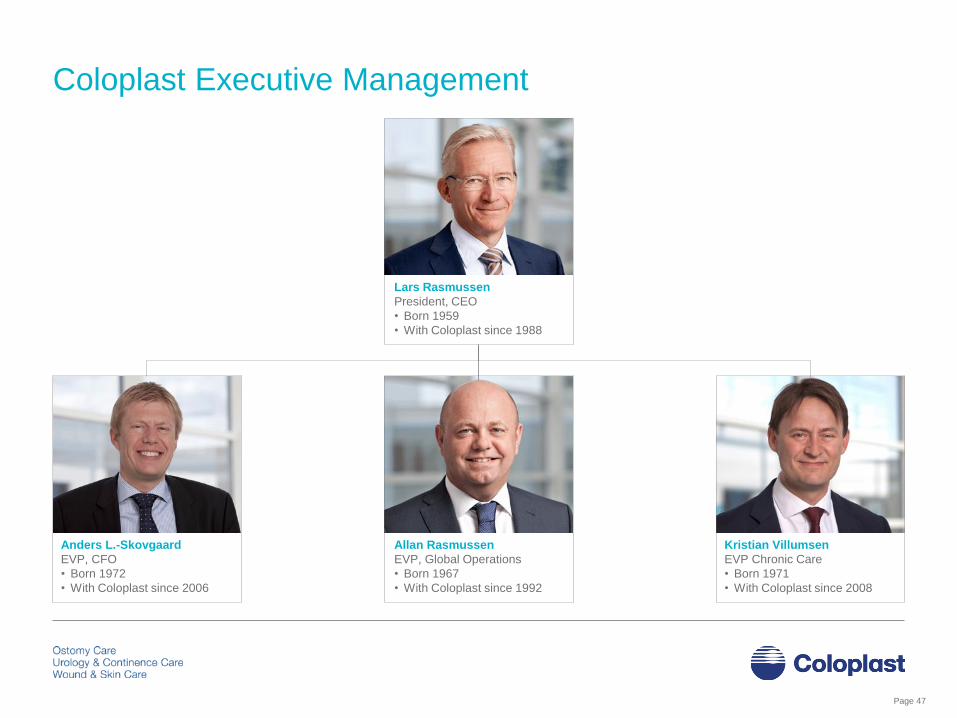
Coloplast Executive Management
Page 47
Lars Rasmussen
President, CEO
• Born 1959
• With Coloplast since 1988
Allan Rasmussen
EVP, Global Operations
• Born 1967
• With Coloplast since 1992
Anders L.-Skovgaard
EVP, CFO
• Born 1972
• With Coloplast since 2006
Kristian Villumsen
EVP Chronic Care
• Born 1971
• With Coloplast since 2008

Corporate responsibility – external recognitions
Page 48
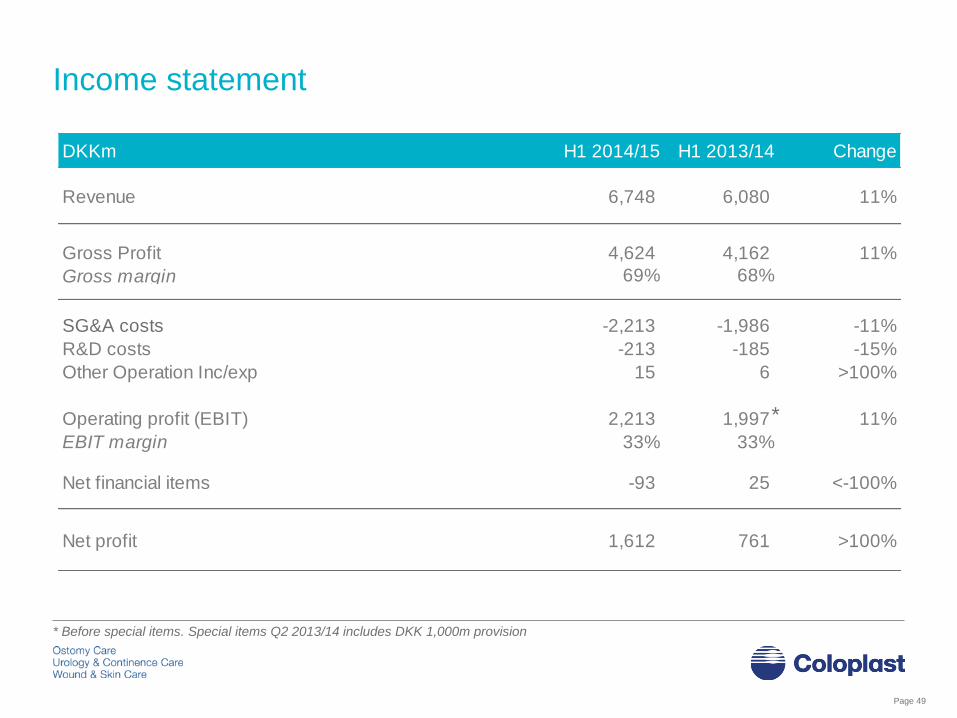
Revenue 6,748 6,080 11%
Gross Profit 4,624 4,162 11%
Gross margin 69% 68%
-2,213 -1,986 -11%
R&D costs -213 -185 -15%
Other Operation Inc/exp 15 6 >100%
Operating profit (EBIT) 2,213 1,997 11%
EBIT margin 33% 33%
Net financial items -93 25 <-100%
Net profit 1,612 761 >100%
SG&A costs
DKKm H1 2014/15 H1 2013/14 Change
Income statement
Page 49
*
* Before special items. Special items Q2 2013/14 includes DKK 1,000m provision
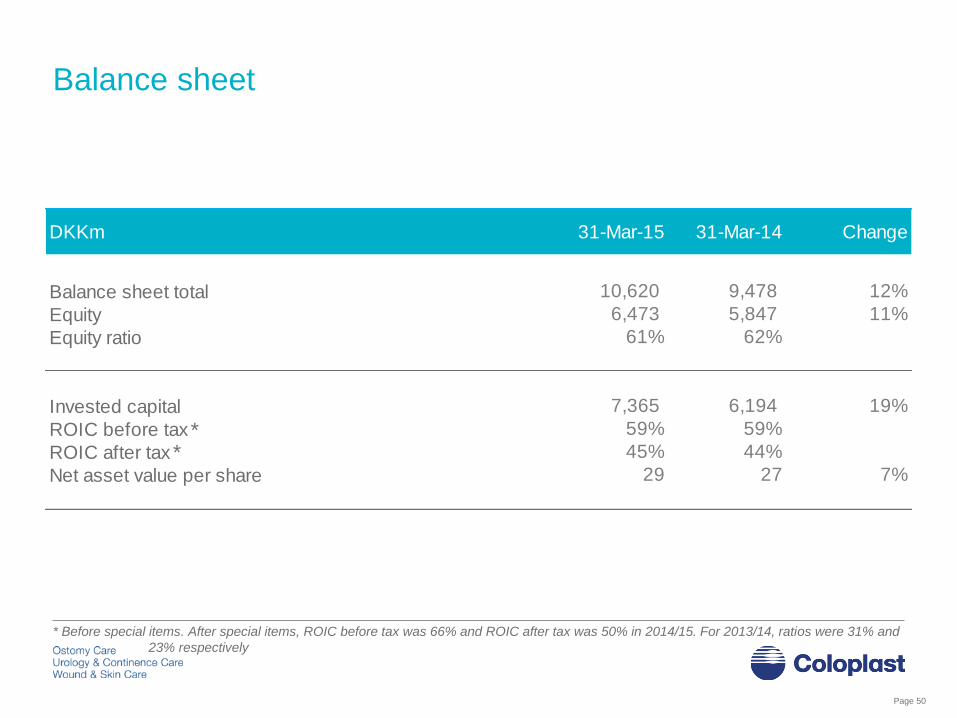
Balance sheet total 10,620 9,478 12%
Equity 6,473 5,847 11%
Equity ratio 61% 62%
Invested capital 7,365 6,194 19%
ROIC before tax 59% 59%
ROIC after tax 45% 44%
Net asset value per share 29 27 7%
DKKm 31-Mar-15 31-Mar-14 Change
Balance sheet
Page 50
* Before special items. After special items, ROIC before tax was 66% and ROIC after tax was 50% in 2014/15. For 2013/14, ratios were 31% and
23% respectively
**
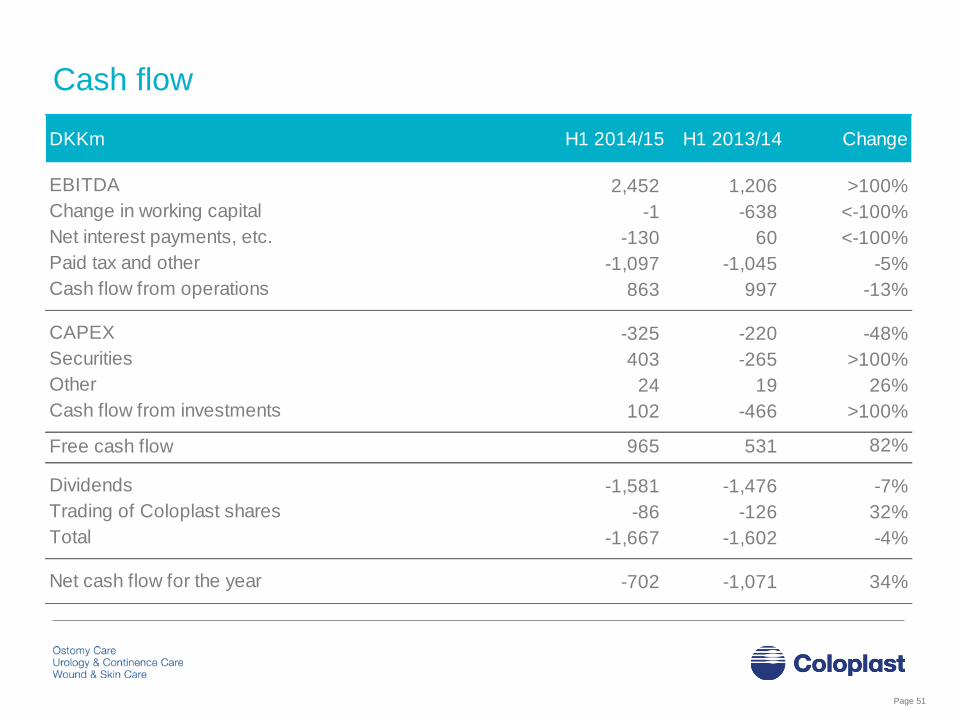
Cash flow
Page 51
EBITDA 2,452 1,206 >100%
Change in working capital -1 -638 <-100%
Net interest payments, etc. -130 60 <-100%
Paid tax and other -1,097 -1,045 -5%
Cash flow from operations 863 997 -13%
CAPEX -325 -220 -48%
Securities 403 -265 >100%
Other 24 19 26%
Cash flow from investments 102 -466 >100%
Free cash flow 965 531 82%
Dividends -1,581 -1,476 -7%
Trading of Coloplast shares -86 -126 32%
Total -1,667 -1,602 -4%
Net cash flow for the year -702 -1,071 34%
DKKm H1 2014/15 H1 2013/14 Change

TCC Mørdrup
DK
• Adhesives
• Wound care products
• Continence care products
• Coloplast Consumer Products
• Number of employees in production: ~375
TCC Thisted
DK
• Machine development
• Ostomy care products
• Number of employees in production: ~150
Production sites
Sarlat
FR
• Disposable surgical urology products
• Number of employees in production: ~175
Minneapolis
US
Mankato
US
• Skin care products
• Ostomy care accessories
• Number of employees in production: ~75
• Urology care products
• Number of employees in production: ~100
Page 52

Nyírbátor
HU
• Catheter care products
• Wound care products
• Number of employees in production: ~1,100
Tatabánya
HU
• Ostomy care products
• Adhesives
• Continence care products
• Number of employees in production: ~1,300
Zhuhai
CN
• Continence care products
• Ostomy care products
• Machine building
• Number of employees in production: ~1,000
Tata
HU
• Postponement & packaging
• Cross docking
• Warehousing
• Distribution & shipping
• Number of employees: ~300
Page 53
Production sites

Contact Investor Relations
Sara Fredskov Munch
IR Coordinator
Tel.: direct: +45 4911 3477
office: +45 4911 1800
Fax: +45 4911 1555
Holtedam 1
DK-3050 Humlebæk
Denmark
Ian Christensen
Vice President
Investor Relations
Tel. direct: +45 4911 1301
office: +45 4911 1800
Fax: +45 4911 1555
Ellen Bjurgert
Manager
Investor Relations
Tel. direct: +45 4911 3376
office: +45 4911 1800
Fax: +45 4911 1555
Page 54
Niclas Kristensen
Jr. Manager
Investor Relations
Our mission
Making life easier for people
with intimate healthcare needs
Our values
Closeness… to better understand
Passion… to make a difference
Respect and responsibility… to guide us
Our vision
Setting the global standard
for listening and responding
Page 55