meeman shelby forest state park equestrian trails - university of
TRANSCRIPT
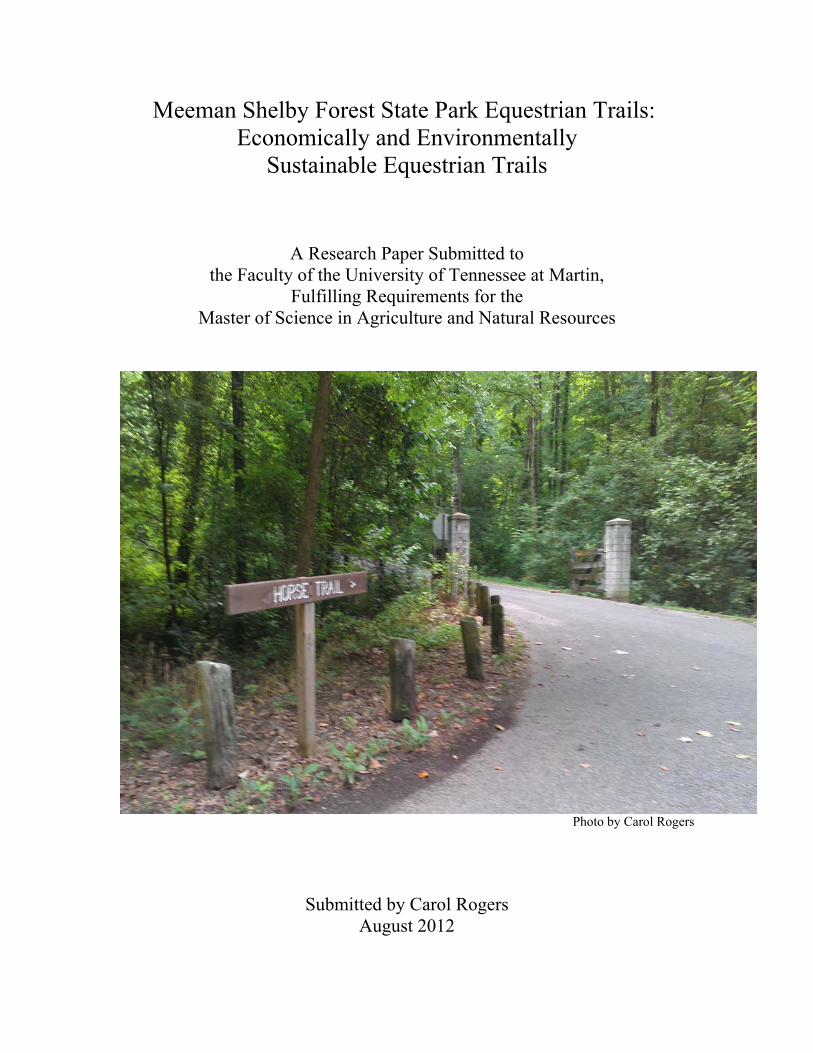
Meeman Shelby Forest State Park Equestrian Trails: Economically and Environmentally
Sustainable Equestrian Trails
A Research Paper Submitted to the Faculty of the University of Tennessee at Martin,
Fulfilling Requirements for the Master of Science in Agriculture and Natural Resources
Photo by Carol Rogers
Submitted by Carol Rogers August 2012
ii
Acknowledgements
I would like to thank Mr. Steve Smith, Park Manager at Meeman Shelby Forest
State Park, for allowing me to perform the survey on the Equestrian/Hiking Trails within
the state park. I would like to thank Dr. Barbara Darroch for all of the help she gave me
throughout my graduate degree and especially during the research project. I would like
to thank Dr. Joseph Mehlhorn for his help on the research project. I would also like to
thank my friends and family for all the support they have given me throughout my
graduate studies. Without the support of the people listed, none of this would have been
possible.
iii
Abstract The state of Tennessee has more than 160,000 equines, the tenth largest
population of equines among states in the United States. In 2003, there were 3,700
equines in Shelby County, Tennessee. The estimated annual economic impact for the
horse industry in Tennessee was $715 million (2010$). Horses are used for many types
of activities including work, riding lessons and competition, but one of the most popular
equine uses is for recreation. One of the largest recreational activities for equine owners
is trail riding. Equine trails are typically built in natural areas where there is concern
about the ecological damage that horses can have on the trails and surrounding area.
Although equine enthusiasts enjoy the natural areas in which they ride, the trails must be
designed and constructed properly to prevent environmental damage such as erosion.
The economic and social impact of Meeman Shelby Forest State Park Equestrian/Hiking
Trails (MSFSPT) was studied through a user survey. Factors associated with designing
and constructing economically sustainable equestrian trails that will minimize ecological
damage and that ensure user safety were also explored through the survey questions. The
survey included questions to determine type of use, frequency of use, economic impact,
safety concerns and other issues. The 30 question survey was administered to trail users
onsite at MSFSPT as a written survey. The survey found that approximately 90% of the
respondents use the trail for riding equines. Eighty one percent of the users agreed the
trail is safe for all users and 90% of the users agreed that the bridges are safe for equines.
About 40% of the respondents do not feel that erosion is a problem on the trail while
about 40% were neutral on erosion issues. About 88% of users agree that MSFSPT is
working well as a multi-use trail. Thirty percent of the users stated they have volunteered
iv
to perform maintenance on the trails and 57% of the respondents stated they would like to
perform maintenance on the trails as a volunteer for at least 1 to 10 hours in the future.
Some respondents (10%) were willing to volunteer more than 30 hours per year. A
majority of the respondents value the MSFSPT such that they are willing to donate their
time for maintenance, while one third of the respondents are already involved with
maintaining the trails. Chi-square tests were conducted to determine if the response to
selected survey questions was related to gender, income level, or age. Previous
volunteering, willingness to volunteer in the future, and willingness to donate money for
trail maintenance were not affected (P > 0.05 for all chi-square tests) by gender, income
category, or age category. The survey respondents were overwhelming positive about all
of the categories included in the survey. The survey results show that the Meeman
Shelby Forest State Park Equestrian/Hiking Trails are a great resource for trail riders and
hikers near Memphis, TN.
Keywords: equine, equestrian trails, recreational trails, Meeman Shelby Forest State Park
v
Table of Contents
Introduction ......................................................................................................................... 1
Objectives ........................................................................................................................... 3
Literature Review................................................................................................................ 4
Meeman Shelby Forest State Park .............................................................................. 4
Tennessee Equine Statistics ........................................................................................ 6
Equine Trail Design, Construction and Maintenance ................................................. 7
Trail Design of Meeman Shelby Forest State Park Equestrian/Hiking Trails .......... 10
Meeman Shelby Forest State Park Equestrian/Hiker Trails: Economic
Sustainability ............................................................................................................. 12
Materials and Methods ...................................................................................................... 16
Instrument Design ..................................................................................................... 16
Results and Discussion ..................................................................................................... 18
Conclusion .................................................................................................................... 3637
References ..................................................................................................................... 3940
Appendix ....................................................................................................................... 4142

vi
List of Tables
Table 1. Estimated Equine Expenditures for Tennessee in 2003 and 2006 US Dollars .... 8 Table 2. Estimated development project cost sheet for MSFSPT. .................................. 15 Table 3. Estimated annual operation and maintenance costs ........................................... 15 Table 4. Descriptive statistics for the miles driven to MSFSPT. ..................................... 22 Table 5. Results of chi-squared analysis to determine if response to selected survey questions was related to gender, income, or age. .............................................................. 28 Table 6. Response of survey participants to questions on trail safety/miscellaneous. .... 32
Table 7. Response of survey participants to questions on trail preferences. . ................ 34
vii
List of Figures
Figure 1. Location of Meeman Shelby Forest State Park in the Southwest corner of Tennessee ............................................................................................................................ 4 Figure 2. A typical stand structure in the northwest corner of Meeman Shelby Forest State Park. This is located north of Poplar Tree Lake. (Photo by Carol Rogers) ............. 5 Figure 3. Fallen tree along the MSFSPT trail (Photo by Carol Rogers) .......................... 10 Figure 4. A bridge in Meeman Shelby Forest State Park Equestrian Trails (Photo by Carol Rogers) .................................................................................................................... 12 Figure 5. A generic switchback. The white arrows show the desired flow of water (Photo by G. W. Wood) .................................................................................................... 13 Figure 6. Distribution for gender of trail users. ............................................................... 18 Figure 7. Distribution of survey respondents' ages. ......................................................... 19 Figure 8. Distribution of MSFSPT users' educational background. ................................ 19 Figure 9. Distribution of household income of users of MSFSPT. ................................. 21
Figure 10. Cities from where users traveled to ride at MSFSPT. .................................... 22 Figure 11. Percentage of respondents who were using MSFSPT the first time. ............. 22 Figure 12. Types of trail use by respondents in the survey. ............................................ 23 Figure 13. Use of MSFSPT during the winter (December-February). ............................ 23 Figure 14. Use of MSFSPT during the spring (March-May). .......................................... 23 Figure 15. Use of MSFSPT during the summer (June-August)....................................... 24 Figure 16. Use of MSFSPT during the fall (September-November). .............................. 24 Figure 17. Weekday versus weekend use of MSFSPT. ................................................... 24 Figure 18. Time of day of use of MSFSPT. ..................................................................... 25 Figure 19. Riding experience of respondents. ................................................................. 25 Figure 20. Respondents describe the trail condition with regard to maintenance. .......... 26
viii
Figure 21. Percentage of respondents surveyed who have performed trail maintenance. 27 Figure 22. Percentage of respondents surveyed who say they will volunteer to perform trail maintenance in the future. ......................................................................................... 27 Figure 23. Distribution of respondents who say they will volunteer in the future for trail maintenance. ..................................................................................................................... 28 Figure 24. Dollars spent by respondents on horse/hiking items last year. ....................... 29 Figure 25. Dollars spent on concession items in preparation for the trail ride at MSFSPT. ........................................................................................................................... 30 Figure 26. Dollars spend on overnight accommodations by the respondents. ................. 30 Figure 27. Distribution of respondents who say they will make a donation in the future for trail maintenance. ........................................................................................................ 35 Figure 28. Distribution of respondents who say they will make a donation for the addition of 2 miles of trails to the current MSFSPT. ........................................................ 35 Figure 29. Riders enjoying the safety and beauty of the Meeman Shelby Forest State Park Equestrian/Hiking Trail (Photos by Carol Rogers) .................................................. 38

1
Introduction
An equine is defined as an animal relating to, or belonging to the family Equidae,
which comprises horses, mules, donkeys, burros and zebras. According to the 2007
Census of Agriculture (USDA, 2009), Tennessee is ranked sixth for the number of horses
and ponies and second for the number of mules, burros, and donkeys in the United States.
Currently, 1.9 million people own horses in the United States according to The American
Horse Council (Deloitte, 2005). One of the most popular recreation uses for horses and
equines is trail riding. Recreational use refers to those equines whose primary function is
as a companion animal. It is estimated that about 3.9 million horses are owned in the
United States for the primary purpose of recreation, thus creating a demand for trail use
of about 32 horses per mile of managed trail on state and federal lands in the United
States (Wood, 2006). Open land that was once plentiful has been disappearing rapidly
and this disappearance has affected trail riders. Recreational horse owners have a
significant need for public land trails and trail riders are willing to spend money to
participate in their favorite hobby. Trail riders can have a substantial impact on the local
economy as horse owners and on the economy in the area where recreational equine trails
are located. The value of Tennessee's horse industry was estimated at $565 million in
January 2004, making it an important asset to the economy (TN Ag Statistics, 2004).
Economically, horses and other equines support a variety of businesses and activities.
Based on the survey in Tennessee Agricultural Statistics (2004), it was estimated that the
Tennessee equine owners made annual expenditures of $715.3 million (2010 dollars).
The total impact to the state's economy was estimated at $1,396.3 million in total industry
output. Over 14,500 jobs were sustained by the equine industry.
2
In November 2008, Meeman Shelby Forest State Park Trails (MSFSPT) opened,
allowing riders and hikers the use of public trails. While it attracts visitors from across
the country, visitors to MSFSPT are primarily from the cities of Memphis and
Millington, TN, and Tipton and Fayette Counties in Tennessee as well as Desoto and
Marshall Counties in Mississippi. MSFSPT were carefully designed and constructed to
meet the needs of area equine enthusiasts while minimizing impacts on the state park.
Noted concerns include the impact of horses on trails through introduction of invasive
species on trails, contamination of water supplies and erosion problems. However,
equestrian trails in a forest environment can be developed and maintained to be user safe,
ecologically sound and economically sustainable. Trail use can include a mix of users
including pedestrian and equine without harmful impacts to the natural eco-system or
degradation to the forest environment (Wood, 2006). In this study, a user survey was
developed to quantify the impacts of MSFSPT on the local economy and the park
environment.

3
Objectives This study examined the economic and social impact of the Meeman Shelby
Forest State Park equestrian trails through a user survey. The survey was designed
specifically for MSFSPT and gathered information on several topics including how often
the trails are visited, how much money is spent on personal items used for the day, and
how much money is spent on required equine attire. The survey also included open
response questions to gather users' opinions on the safety of rider and equine.
The survey was also used to help identify possible detrimental impacts to the
ecosystem by trail users. Proper trail design, construction, and maintenance can
minimize these detrimental impacts. Awareness of the ecosystem is a key to protecting
the ecological matrix.
The final objective of this study was to determine if the MSFSPT are
economically sustainable based on the cost of design, construction, and maintenance.
4
Literature Review
Meeman Shelby Forest State Park
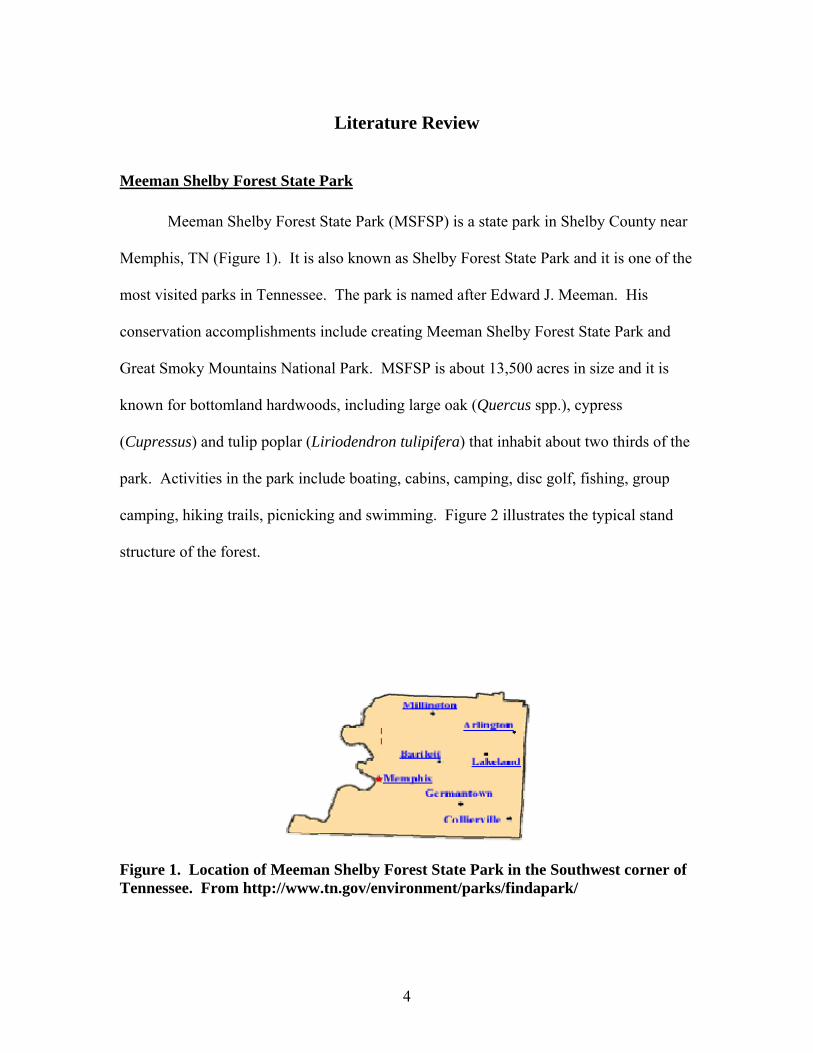
Meeman Shelby Forest State Park (MSFSP) is a state park in Shelby County near
Memphis, TN (Figure 1). It is also known as Shelby Forest State Park and it is one of the
most visited parks in Tennessee. The park is named after Edward J. Meeman. His
conservation accomplishments include creating Meeman Shelby Forest State Park and
Great Smoky Mountains National Park. MSFSP is about 13,500 acres in size and it is
known for bottomland hardwoods, including large oak (Quercus spp.), cypress
(Cupressus) and tulip poplar (Liriodendron tulipifera) that inhabit about two thirds of the
park. Activities in the park include boating, cabins, camping, disc golf, fishing, group
camping, hiking trails, picnicking and swimming. Figure 2 illustrates the typical stand
structure of the forest.
Figure 1. Location of Meeman Shelby Forest State Park in the Southwest corner of Tennessee. From http://www.tn.gov/environment/parks/findapark/

5
Figure 2. A typical stand structure in the northwest corner of Meeman Shelby Forest State Park. This is located north of Poplar Tree Lake. (Photo by Carol Rogers)
Until recently, the list of activities in the park did not include horseback riding
since the closing of the horse rental vendor in October 1996. In June 2000, a volunteer
group called Meeman Shelby Forest Trail Savers was formed with a focus on building
trails in MSFSP for equestrian riding and hiking. The equestrian trails were designed for
horseback enthusiasts who bring their own equines (Bailey, 2008), but they are multiuse
trails for hikers also. Since 1996, the former three mile equine trail fell into disrepair
through water erosion and neglect, making park officials hesitant to allow horses back
into the park. Therefore, an expert in recreational trails, Dr. Gene Wood, was contacted
to develop a plan for the design, construction and maintenance of MSFSP trails.
6
Tennessee Equine Statistics
According to a study by National Animal Health Monitoring in 1998, the largest
population of horses and horse operations is located in the Southern region of the United
States. Tennessee's equine industry is a large contributor to the overall economic outputs
of the agricultural sector (Tennessee Department of Agricultural Economics, 2010). The
predominant use of horses in the United States is recreational with trail riding as the
number one recreational activity (Blackwell et al., 2009). In 2005, there were about 9.2
million horses in the United States; of these about 3.9 million horses (42%) are used for
recreational purposes (Hancock et al., 2007). The equine population in Shelby County is
about 3,700 equines (Tennessee Agricultural Statistics, 2004). Ownership of a horse
typically requires the support of three or more professionals, including the owner, the
veterinarian, and the farrier, each of which contributes to the economy.
Trail riders travel a considerable distance from home to visit favorite trails. Such
trips typically involve camping; therefore not only is money spent on fuel and horse
items, but camping items have to be purchased along with food and beverages.
Equestrian trail riding requires more services and goods than ATVs or bicycles because
the horse is a living being, and requires additional care including transportation, watering,
and feeding. Although horse related activities are important to Tennessee, the popularity
of trail riding continues to be a challenge to trail managers who must maintain trails and
create new trails. Trails for riding horses are not readily available in most areas.
The actual expense of an activity may not be visible in the cost to the users. The
value of a recreation activity can be determined by the readiness to pay for the recreation
activity by all people who want to participate in the recreation at that site (Auchter,
7
2008). The willingness to pay for trail use and travel expenses is a method for
determining the economic impact in the absence of market prices. The demand for the
recreational site is based upon estimates of the varying costs of traveling and preparation
to participate in the activity at the recreation site. Survey responses about travel costs can
be considered as the implied cost of participation and also the basis for estimating the
economic value of the equestrian trails. The cost of travel to the trails times the number
of visits to the trails can determine the value of the trail visited by riders. The cost of
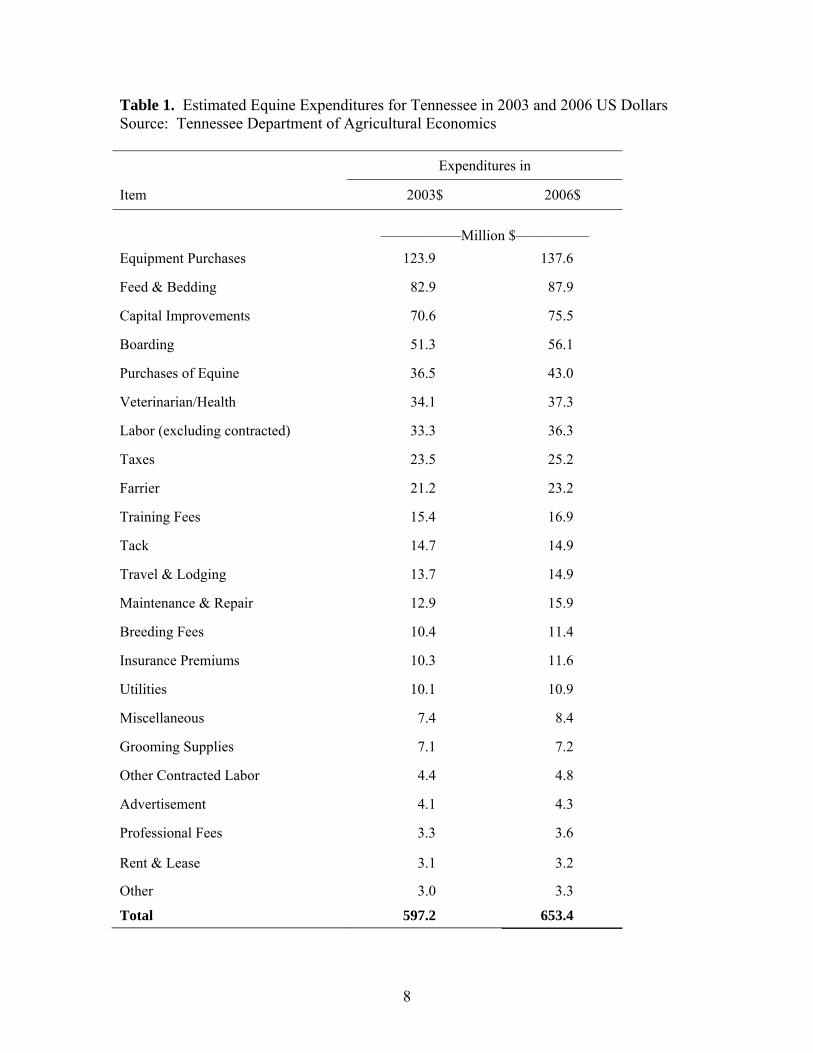
travel includes gas, time, vehicle use, etc. Table 1 contains an estimate of the cost of
owning a horse. The expenditures in Table 1 refer to 2003 figures, but the data were also
inflated to 2006 dollars to show more accurate expenditures for current equine expenses.
Equine Trail Design, Construction and Maintenance
Horseback riding in natural areas, such as state and federal parks and other
forested areas, is a valued and very popular outdoor recreation activity (Wood, 2006).
However, there are concerns about horses causing adverse impacts in parks and other
natural areas. To find the best balance between recreation use and the preservation of
natural areas, there is a need for better information about the impacts of recreational
activities. The science of recreation ecology has been developed to help provide such
information in this area (Cole, 1995).
Students of recreation ecology study the effects of trail use in natural areas. One
way to minimize detrimental impacts on trails is to build sustainable trails that are
properly designed, constructed and maintained. Proper use of a trail by the users is also
important, especially for equestrian trails. There are three main reasons why sustainable
trails should be used (Hancock et al., 2007): 1) sustainable trails help reduce
8
Table 1. Estimated Equine Expenditures for Tennessee in 2003 and 2006 US Dollars Source: Tennessee Department of Agricultural Economics
Expenditures in
Item 2003$ 2006$
———–––—Million $—————
Equipment Purchases 123.9 137.6
Feed & Bedding 82.9 87.9
Capital Improvements 70.6 75.5
Boarding 51.3 56.1
Purchases of Equine 36.5 43.0
Veterinarian/Health 34.1 37.3
Labor (excluding contracted) 33.3 36.3
Taxes 23.5 25.2
Farrier 21.2 23.2
Training Fees 15.4 16.9
Tack 14.7 14.9
Travel & Lodging 13.7 14.9
Maintenance & Repair 12.9 15.9
Breeding Fees 10.4 11.4
Insurance Premiums 10.3 11.6
Utilities 10.1 10.9
Miscellaneous 7.4 8.4
Grooming Supplies 7.1 7.2
Other Contracted Labor 4.4 4.8
Advertisement 4.1 4.3
Professional Fees 3.3 3.6
Rent & Lease 3.1 3.2
Other 3.0 3.3
Total 597.2 653.4
9
environmental impacts, 2) sustainable trails help reduce the cost of trail maintenance, and
3) sustainable trails can help increase the use of recreational trails worldwide. Each trail
must be planned to fit the environment's capability to accommodate the possible types,
volume and time of use (Wood, 2007). Building a sustainable trail gives users a way to
access natural areas on a designated path that is not susceptible to erosion and causes
little damage to the environment (Stormer, 2009).
A major cause of damage to the environment along trails is erosion. Water is the
chief cause of erosion on any type of trail (Stormer, 2009). Water not only causes
erosion, but it also causes weak soil surfaces that are more susceptible to damage
(Missouri Department of Conservation, 2007). The best way to keep a trail sustainable is
to direct water away from it. The trail should not follow the fall line or the steepest route
of descent down a hill. Erosion is minimized by following the contour of the land
(Stormer, 2009). In addition, the number one rule for sustainable trails is not to use the
trails when they are muddy and wet (Stormer, 2009). The effect of erosion is intensified
on wet and muddy trails by horses trampling and sliding along the trail leaving puddles of
water and increased wear on the trail (Wood, 2007).
Even the best designed trails need to be monitored for maintenance requirements
(Wood, 2007). Monitoring can be performed by users while traversing the trail.
Maintenance of trails involves trimming back branches and vegetation that grow along
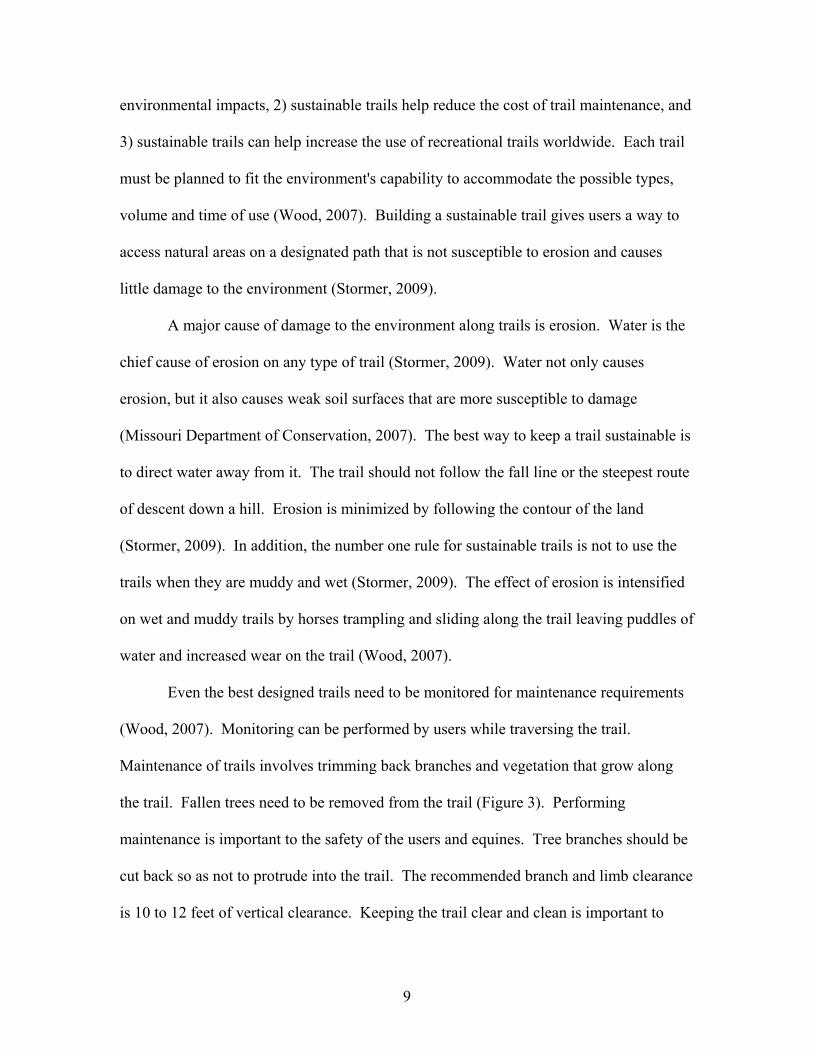
the trail. Fallen trees need to be removed from the trail (Figure 3). Performing
maintenance is important to the safety of the users and equines. Tree branches should be
cut back so as not to protrude into the trail. The recommended branch and limb clearance
is 10 to 12 feet of vertical clearance. Keeping the trail clear and clean is important to
10
keep users on the designated path. Each user should follow sustainable trail practices to
create the best possible outcome for all equestrian trail users and trails.
Trail Design of Meeman Shelby Forest State Park Equestrian/Hiking Trails
The existing horse trail that was vacated by a rental vendor was considered for the site of
the current horse/hiker trail. The old trail had not been properly constructed or
maintained for horse traffic; therefore the new trail was positioned slightly off to the side
of the existing trail. Construction of equine trails requires safety considerations for both
the horse and rider. The trail path should be 8 feet wide and 10 to 12 feet high
(Tennessee Department of Environment and Conservation, 2007). The height
requirement is for the path area above the horse so that the rider's head is clear of limbs
and branches.
Figure 3. Fallen tree along the MSFSPT trail (Photo by Carol Rogers)

11
The first concern related to the construction of the Meeman Shelby Forest State
Park equestrian trail was to address soil erosion issues. Using a loop configuration in the
design of the trail was an important part in preventing erosion on the trail. A loop
provides riders with multiple exits to return to the trailhead without retracing their steps.
In addition, the trail was designated as one way traffic. This type of design minimizes
trail traffic by 50 percent versus an in and out trail, in which the rider covers the same
ground twice. The trail passage was cleared to a minimum width of 6 feet and the trail
itself is about 36 inches wide (although this doesn't meet the criteria stated above, it was
determined to be adequate for MSFSPT). The trail base is predominantly composed of
native park soil with added surfaces, such as bridges and hardened crossings for the
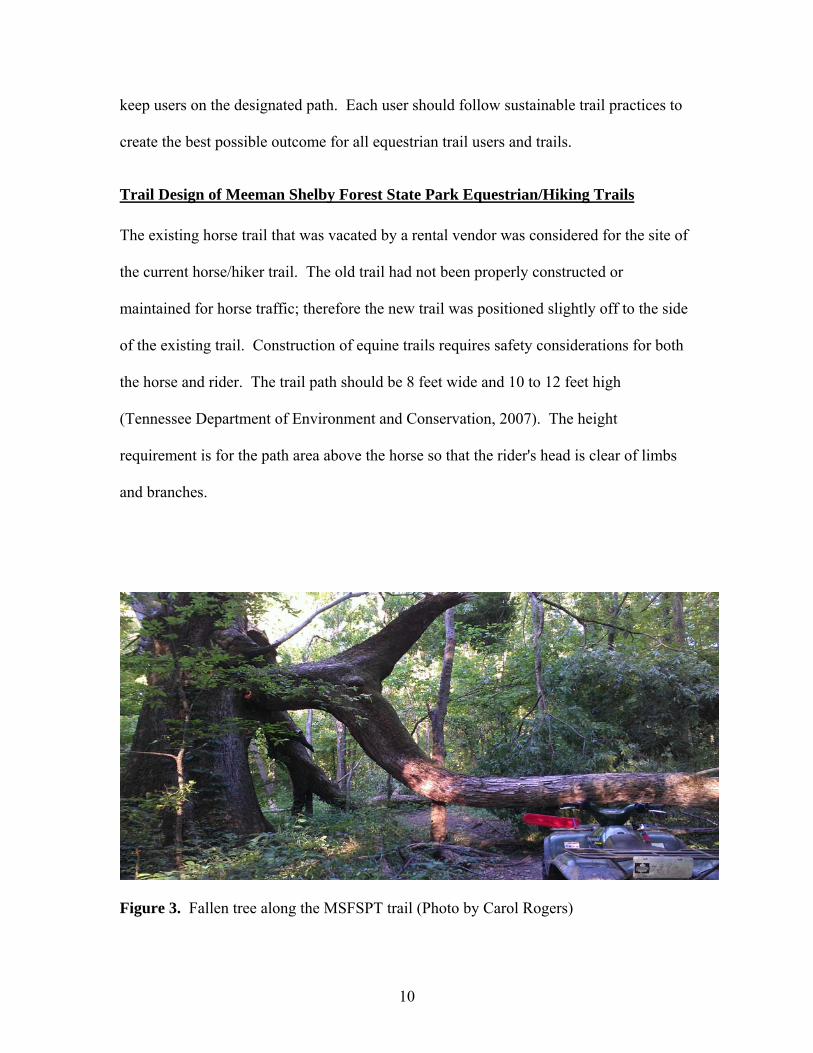
shallow gullies crossing the trail path. Bridges are as long as needed to cross a ditch and
about 48 inches wide (Figure 4).
In small gullies where bridges were not necessary, hardened crossings were built
from a sheet of 5 oz., non-woven geotextile that is 6 feet wide and the length of the
crossing. A layer of geoweb that is 4 inches deep and 6 feet wide was set on top of the
geotextile and nailed into 4" x 4" pressure treated boards. The boards act as a curbing
along the outside edges. Crush and run gravel was used to fill the cells of the geoweb.
The hardened crossings resist the velocity of water flowing through the intermittent
streams during heavy rains. Switchbacks and climbing turns were installed to help going
up or down hills. Generic switchbacks were used for the trail as in Figure 5.
12
Figure 4. A bridge in Meeman Shelby Forest State Park Equestrian Trails (Photo by Carol Rogers)
Trail signs were used to mark the trail throughout the loop designs. The signs are made
of Carsonite and they are four inches wide and six feet tall. They were set in the ground
about 2 feet deep. The signs designate trail heads, one way direction and location on the
trails.
Meeman Shelby Forest State Park Equestrian/Hiker Trails: Economic Sustainability
An economically sustainable equine trail begins with good planning. The initial
construction costs can be optimized to decrease future maintenance costs (Wood, 2007).
High maintenance costs are the product of inadequately designed and constructed trails.

13
Figure 5. A generic switchback. The white arrows show the desired flow of water (Photo by G. W. Wood)
Trail design should provide a passage through the trail for maintenance personnel with
tools and equipment. Plans for maintenance should also include the use of motorized
equipment. MSFSPT were built to be economically sustainable. A volunteer group
called the Meeman Shelby Forest Trail Savers (MSFTS) was formed to help finance,
design and construct the trails and also offered assistance in maintaining the trails with
State Park officials having oversight authority (Wood, 2005). MSFSPT is a product of
government and private citizens that formed a partnership in the development and
maintenance of recreational use of public lands existing in an urban–rural connected
region. This is an important example that emphasizes cooperation and partnership for the
future of public trails.

14
The initial estimate of the cost of the design and construction of the MSFSPT was
$79,316. A grant was applied for and received from the state of Tennessee for a total of
$77,586. A minimum 20% match of the funds was required. Funds were matched with a
3rd party donation of $5,000 and volunteer labor cost at $19, 960. The total funds
available at the onset of the project were $97,546. Although the initial estimate of the
annual maintenance cost was $4500, the cost of the maintenance since the opening of
MSFSPT in 2008 has been less than $1000. Ongoing maintenance has been performed
by MSFTS since November 2008. Tables 2 and 3 estimate the development cost and
maintenance costs, respectively.
15
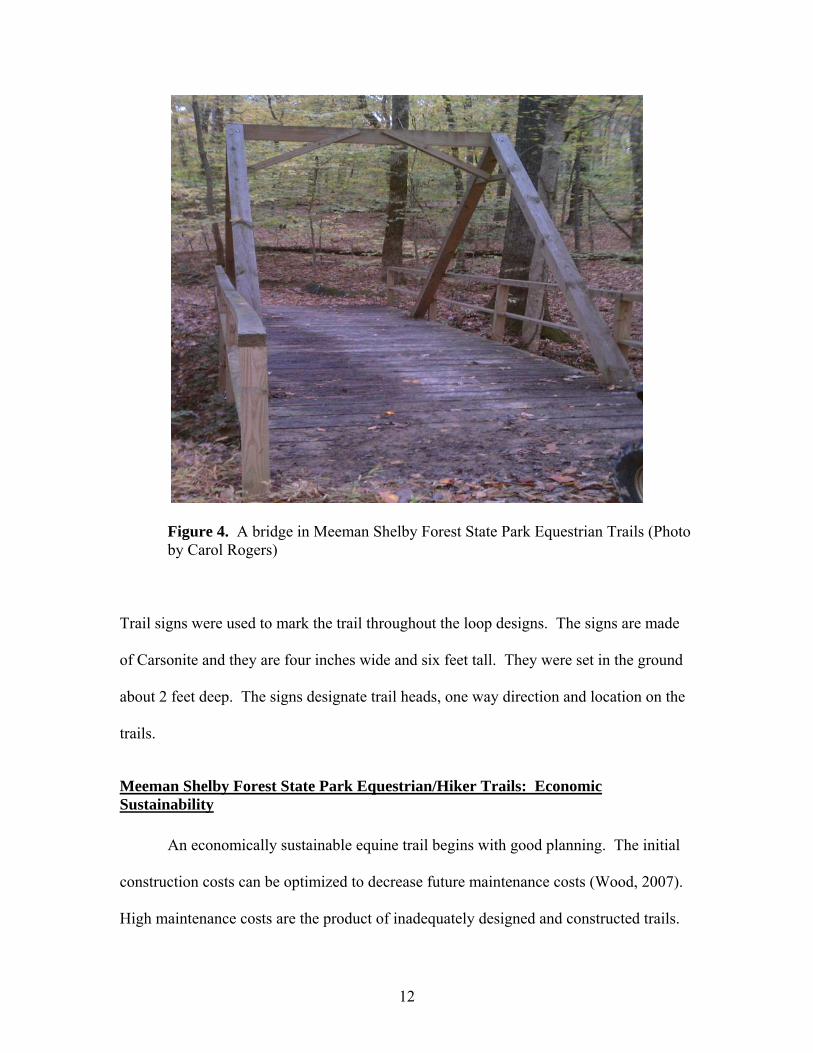
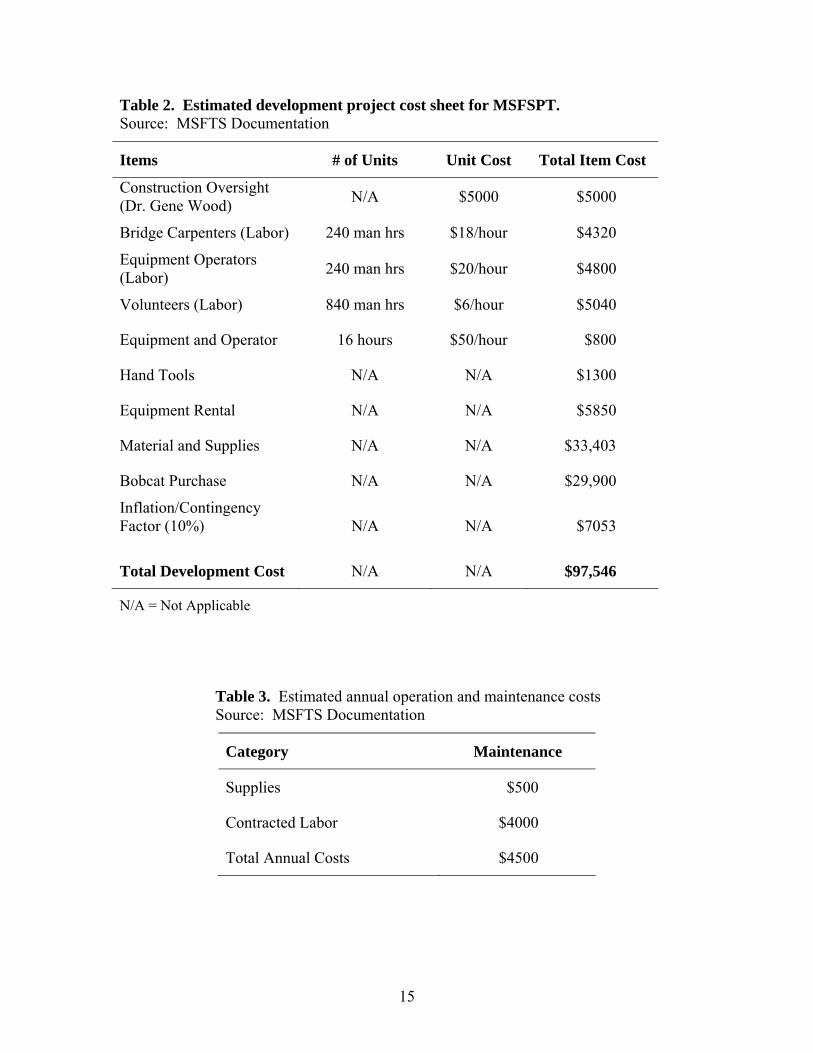
Table 2. Estimated development project cost sheet for MSFSPT. Source: MSFTS Documentation
Items # of Units Unit Cost Total Item Cost
Construction Oversight (Dr. Gene Wood)
N/A $5000 $5000
Bridge Carpenters (Labor) 240 man hrs $18/hour $4320
Equipment Operators (Labor)
240 man hrs $20/hour $4800
Volunteers (Labor) 840 man hrs $6/hour $5040
Equipment and Operator 16 hours $50/hour $800
Hand Tools N/A N/A $1300
Equipment Rental N/A N/A $5850
Material and Supplies N/A N/A $33,403
Bobcat Purchase N/A N/A $29,900
Inflation/Contingency Factor (10%)
N/A N/A $7053
Total Development Cost N/A N/A $97,546
N/A = Not Applicable
Table 3. Estimated annual operation and maintenance costs Source: MSFTS Documentation
Category Maintenance
Supplies $500
Contracted Labor $4000
Total Annual Costs $4500
16
Materials and Methods
This project was conducted within Meeman Shelby Forest State Park located
north of Memphis, Tennessee (Figure 1).
Instrument Design
A 30 question survey was developed to address the objectives of the study
(Appendix A). The survey was approved by the UT Martin Institutional Review Board
(IRB number 12-165-E05-4005/Roge,Car). Permission to conduct the survey was
granted by the park manager at MSFSP. Questions on the survey asked trail riders about
their use of MSFSPT. The survey included both qualitative and quantitative questions.
The first page of the survey explained the purpose and design of the study. It
clearly stated that no personal information would be used and that all participation was
completely voluntary. The information gathered from this survey included
demographics, and social and economic information. The independent variables are the
users' demographics and educational background. Dependent variables are the
respondents' attitudes towards the trails. The survey was administered as a written survey
onsite at MSFSPT.
After the completed surveys were collected, the answers for each question were
given a numeric code. The coded data were entered into an Excel 2003 worksheet, and
the results were analyzed using the count-if statistical formula. Upon completing the
count-if statistical formula, the percentage breakdown for each question was determined.
After evaluating the data, a chi-square test was used to examine relationships among
important factors. Chi-square tests were conducted to determine if the response to
17
selected survey questions was related to gender, income level, or age. In some cases,
categories were grouped so the number of observations per category was large enough for
analysis.
The survey was administered from April 15, 2012 to June 30, 2012 mostly on
weekends, although there were trips during the week to the MSFSPT to find trail users.
There were 53 surveys collected during the time period.
18
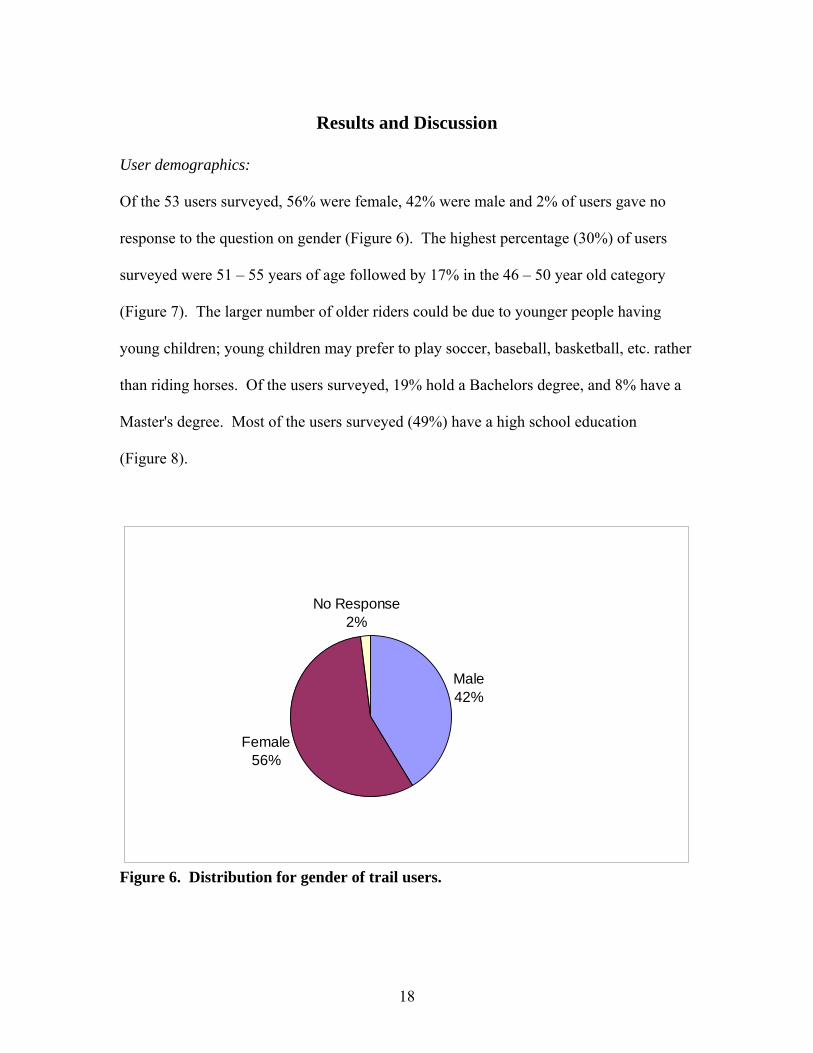
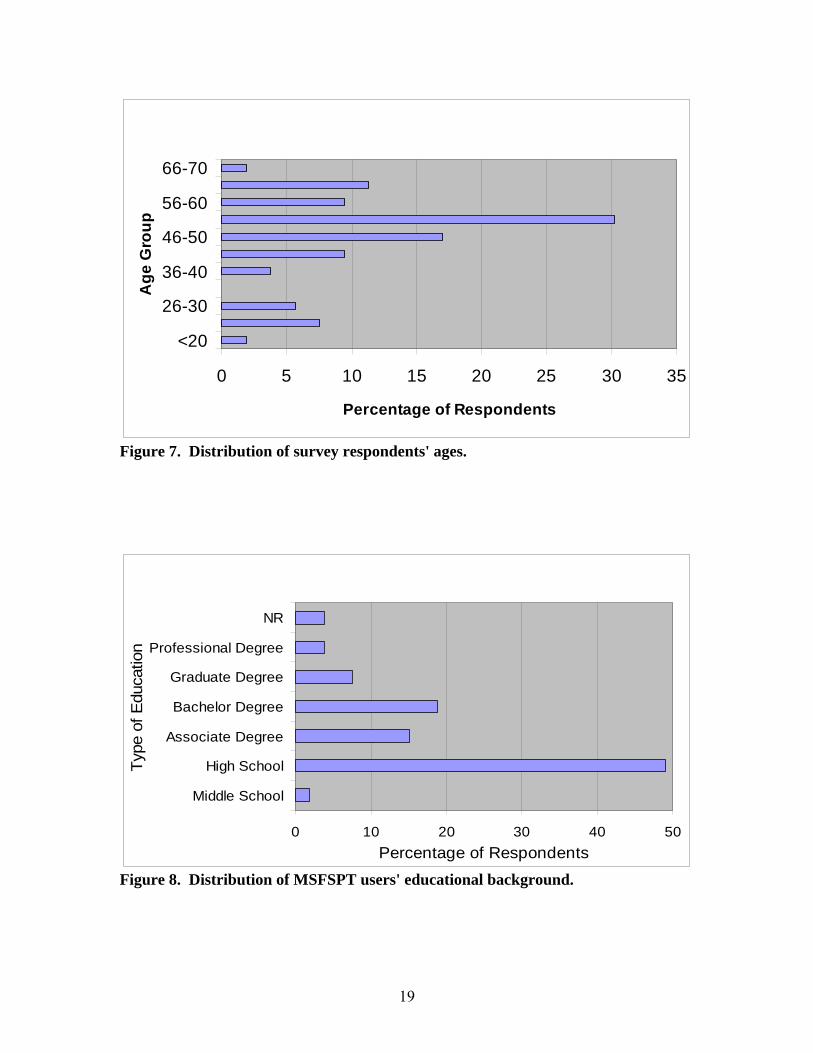
Results and Discussion User demographics: Of the 53 users surveyed, 56% were female, 42% were male and 2% of users gave no
response to the question on gender (Figure 6). The highest percentage (30%) of users
surveyed were 51 – 55 years of age followed by 17% in the 46 – 50 year old category
(Figure 7). The larger number of older riders could be due to younger people having
young children; young children may prefer to play soccer, baseball, basketball, etc. rather
than riding horses. Of the users surveyed, 19% hold a Bachelors degree, and 8% have a
Master's degree. Most of the users surveyed (49%) have a high school education
(Figure 8).
Male42%
Female56%
No Response2%
Figure 6. Distribution for gender of trail users.
19
0 5 10 15 20 25 30 35
<20
26-30
36-40
46-50
56-60
66-70A
ge
Gro
up
Percentage of Respondents
Figure 7. Distribution of survey respondents' ages.
0 10 20 30 40 50
Middle School
High School
Associate Degree
Bachelor Degree
Graduate Degree
Professional Degree
NR
Typ
e of
Edu
catio
n
Percentage of Respondents
Figure 8. Distribution of MSFSPT users' educational background.
20
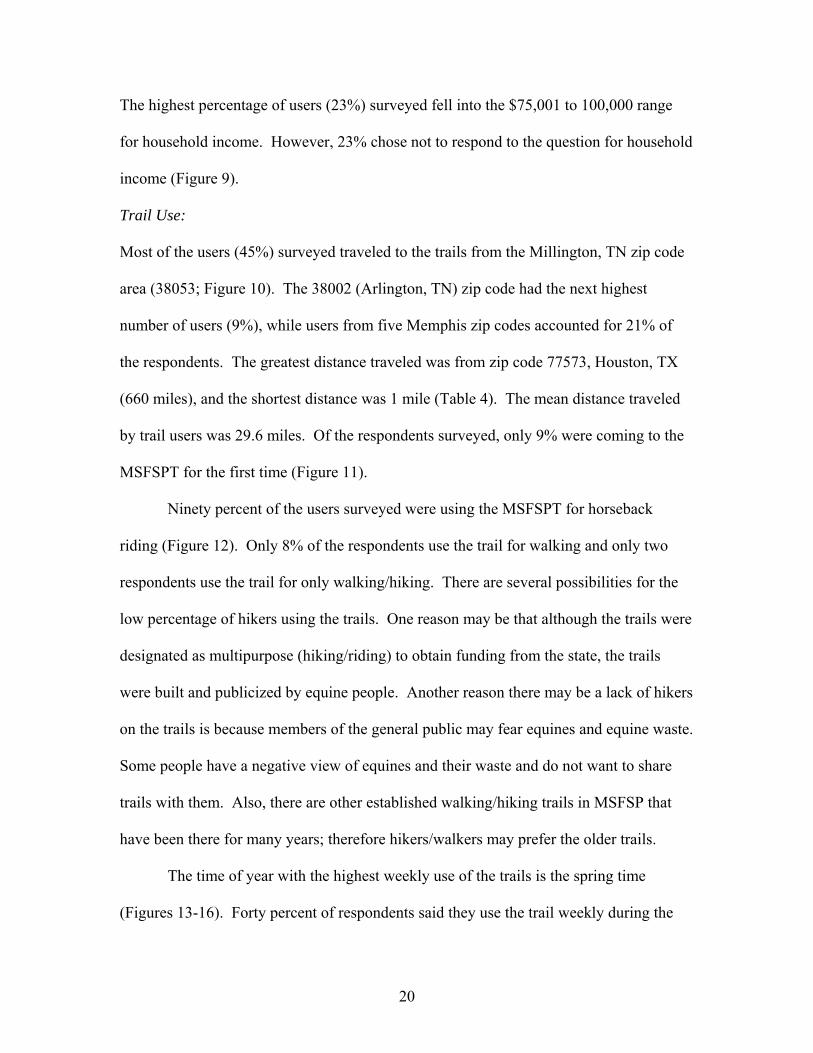
The highest percentage of users (23%) surveyed fell into the $75,001 to 100,000 range
for household income. However, 23% chose not to respond to the question for household
income (Figure 9).
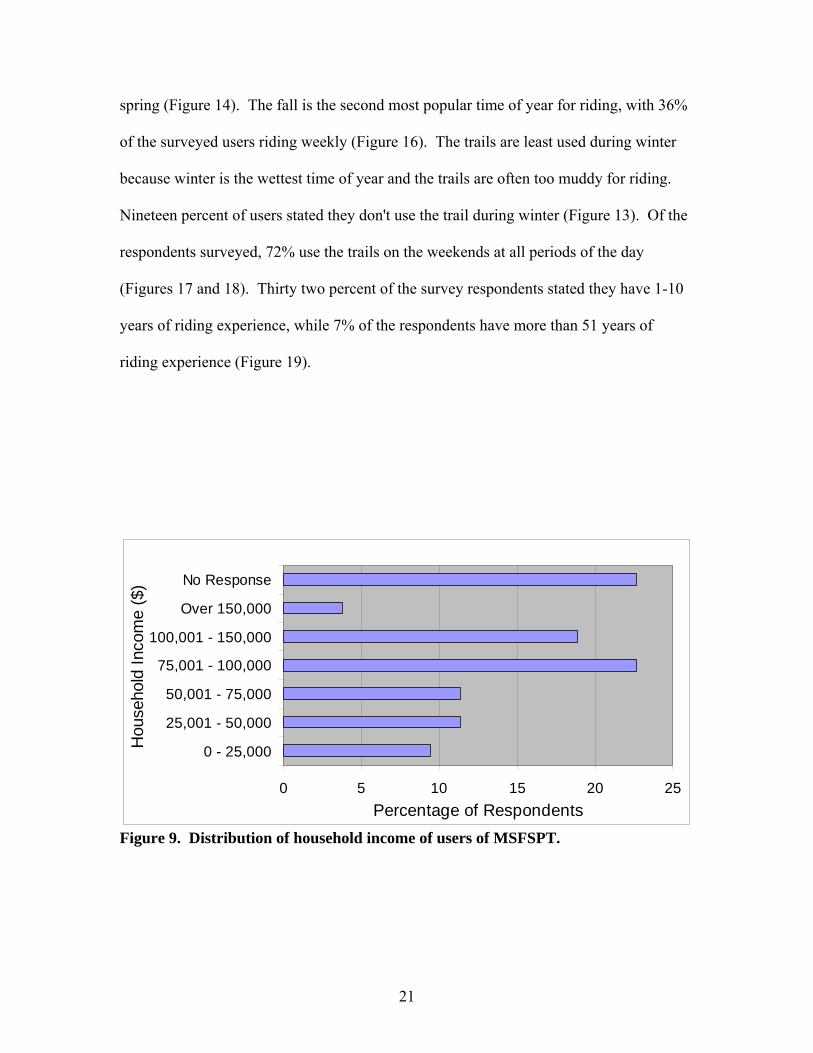
Trail Use: Most of the users (45%) surveyed traveled to the trails from the Millington, TN zip code
area (38053; Figure 10). The 38002 (Arlington, TN) zip code had the next highest
number of users (9%), while users from five Memphis zip codes accounted for 21% of
the respondents. The greatest distance traveled was from zip code 77573, Houston, TX
(660 miles), and the shortest distance was 1 mile (Table 4). The mean distance traveled
by trail users was 29.6 miles. Of the respondents surveyed, only 9% were coming to the
MSFSPT for the first time (Figure 11).
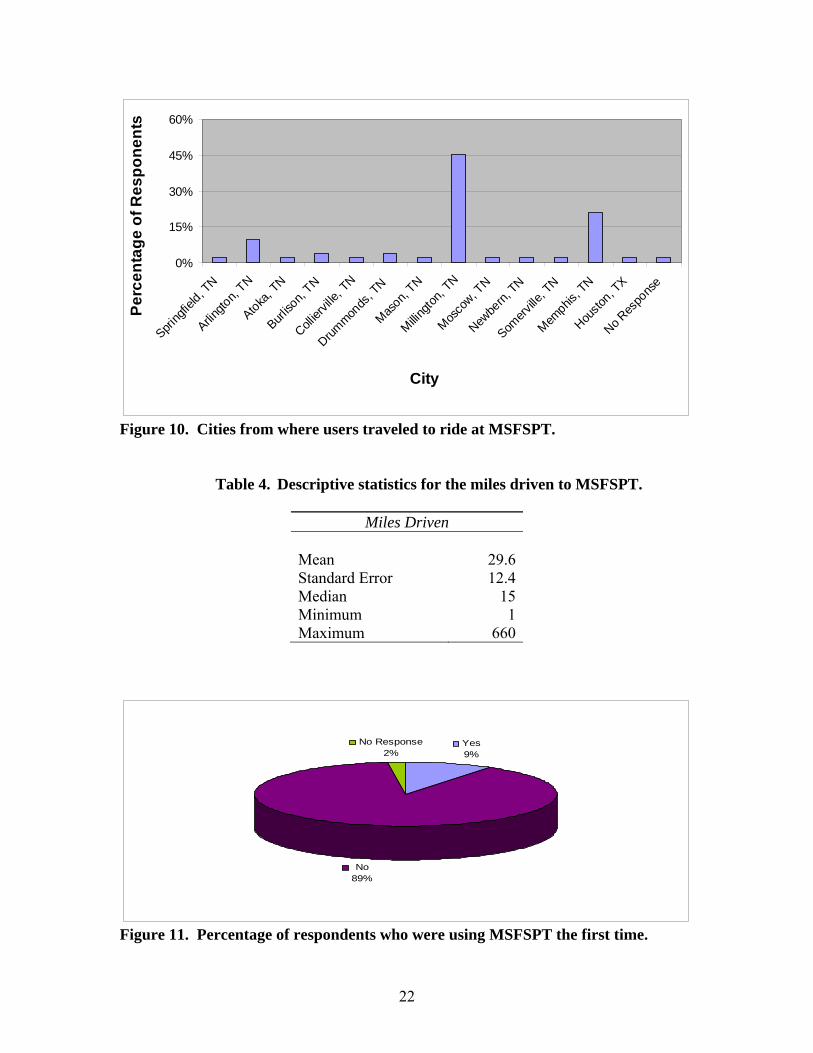
Ninety percent of the users surveyed were using the MSFSPT for horseback
riding (Figure 12). Only 8% of the respondents use the trail for walking and only two
respondents use the trail for only walking/hiking. There are several possibilities for the
low percentage of hikers using the trails. One reason may be that although the trails were
designated as multipurpose (hiking/riding) to obtain funding from the state, the trails
were built and publicized by equine people. Another reason there may be a lack of hikers
on the trails is because members of the general public may fear equines and equine waste.
Some people have a negative view of equines and their waste and do not want to share
trails with them. Also, there are other established walking/hiking trails in MSFSP that
have been there for many years; therefore hikers/walkers may prefer the older trails.
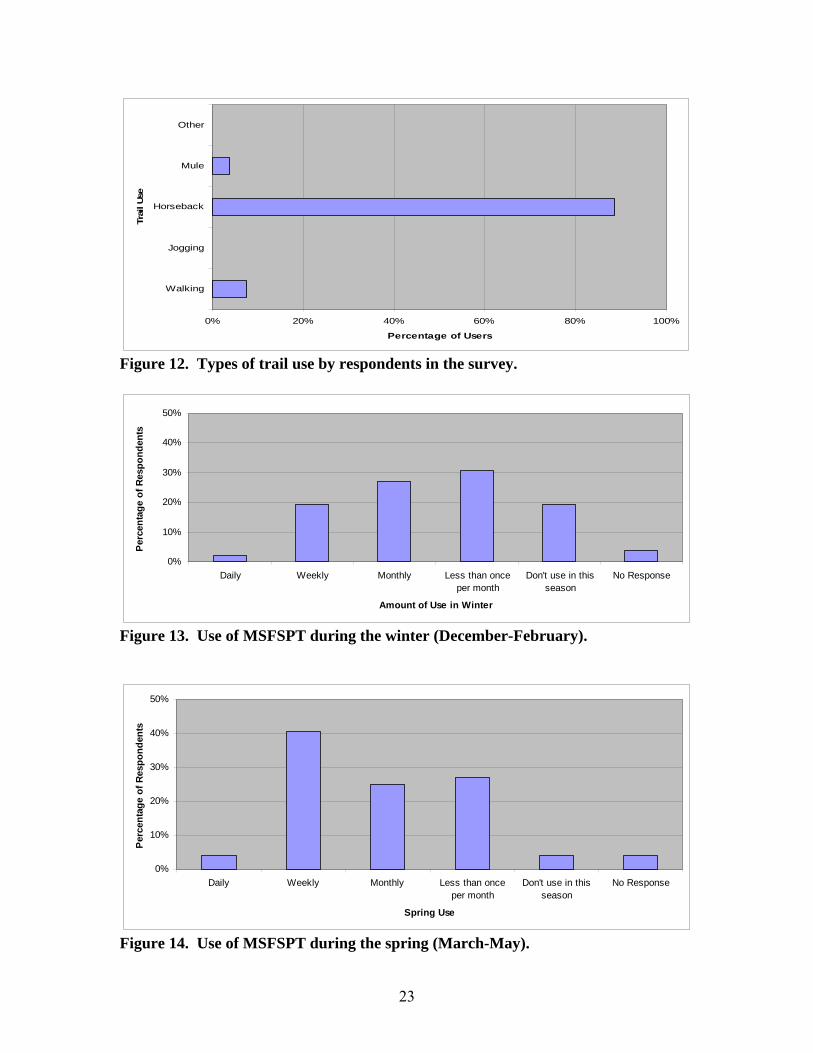
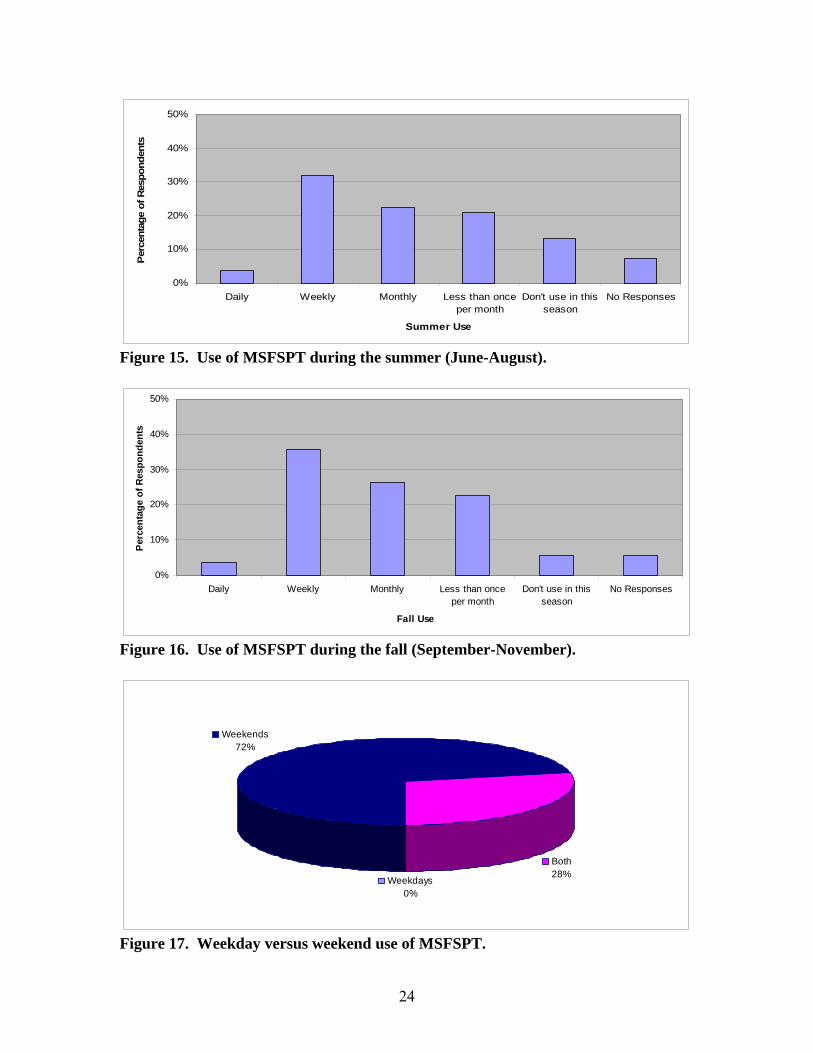
The time of year with the highest weekly use of the trails is the spring time
(Figures 13-16). Forty percent of respondents said they use the trail weekly during the
21
spring (Figure 14). The fall is the second most popular time of year for riding, with 36%
of the surveyed users riding weekly (Figure 16). The trails are least used during winter
because winter is the wettest time of year and the trails are often too muddy for riding.
Nineteen percent of users stated they don't use the trail during winter (Figure 13). Of the
respondents surveyed, 72% use the trails on the weekends at all periods of the day
(Figures 17 and 18). Thirty two percent of the survey respondents stated they have 1-10
years of riding experience, while 7% of the respondents have more than 51 years of
riding experience (Figure 19).
0 5 10 15 20 25
0 - 25,000
25,001 - 50,000
50,001 - 75,000
75,001 - 100,000
100,001 - 150,000
Over 150,000
No Response
Hou
seho
ld I
ncom
e ($
)
Percentage of Respondents
Figure 9. Distribution of household income of users of MSFSPT.
22
0%
15%
30%
45%
60%
Sprin
gfie
ld, T
N
Arling
ton,
TN
Atoka
, TN
Burlis
on, T
N
Collier
ville,
TN
Drum
mon
ds, T
N
Mas
on, T
N
Milli
ngto
n, T
N
Mos
cow, T
N
Newbe
rn, T
N
Somer
ville
, TN
Mem
phis, T
N
Houst
on, T
X
No Res
pons
e
City
Pe
rce
nta
ge
of
Re
sp
on
en
ts
Figure 10. Cities from where users traveled to ride at MSFSPT. Table 4. Descriptive statistics for the miles driven to MSFSPT.
Miles Driven Mean 29.6Standard Error 12.4Median 15Minimum 1Maximum 660
Yes9%
No89%
No Response2%
Figure 11. Percentage of respondents who were using MSFSPT the first time.
23
0% 20% 40% 60% 80% 100%
Walking
Jogging
Horseback
Mule
Other
Tra
il U
se
Percentage of Users
Figure 12. Types of trail use by respondents in the survey.
0%
10%
20%
30%
40%
50%
Daily Weekly Monthly Less than onceper month
Don't use in thisseason
No Response
Amount of Use in Winter
Per
cen
tag
e o
f R
esp
on
den
ts
Figure 13. Use of MSFSPT during the winter (December-February).
0%
10%
20%
30%
40%
50%
Daily Weekly Monthly Less than onceper month
Don't use in thisseason
No Response
Spring Use
Per
cen
tag
e o
f R
esp
on
den
ts
Figure 14. Use of MSFSPT during the spring (March-May).
24
0%
10%
20%
30%
40%
50%
Daily Weekly Monthly Less than onceper month
Don't use in thisseason
No Responses
Summer Use
Per
centa
ge
of R
espo
nden
ts
Figure 15. Use of MSFSPT during the summer (June-August).
0%
10%
20%
30%
40%
50%
Daily Weekly Monthly Less than onceper month
Don't use in thisseason
No Responses
Fall Use
Per
cen
tag
e o
f R
esp
on
den
ts
Figure 16. Use of MSFSPT during the fall (September-November).
Weekdays0%
Weekends72%
Both28%
Figure 17. Weekday versus weekend use of MSFSPT.

25
0% 5% 10% 15% 20% 25% 30% 35%
Mornings
Afternoons
Evenings
All day
Mornings/Afternoons
Mornings/Evenings
Afternoons/EveningsT
ime
of
Da
y
Percentage of Respondents
Figure 18. Time of day of use of MSFSPT.
0% 5% 10% 15% 20% 25% 30% 35%
1 - 10 yrs
11 - 20 yrs
21 - 30 yrs
31 - 40 yrs
41 - 50 yrs
Greater than 51 yrs
Not Applicable
Ex
pe
rie
nc
e in
Ye
ars
Percentage of Respondents
Figure 19. Riding experience of respondents.
26
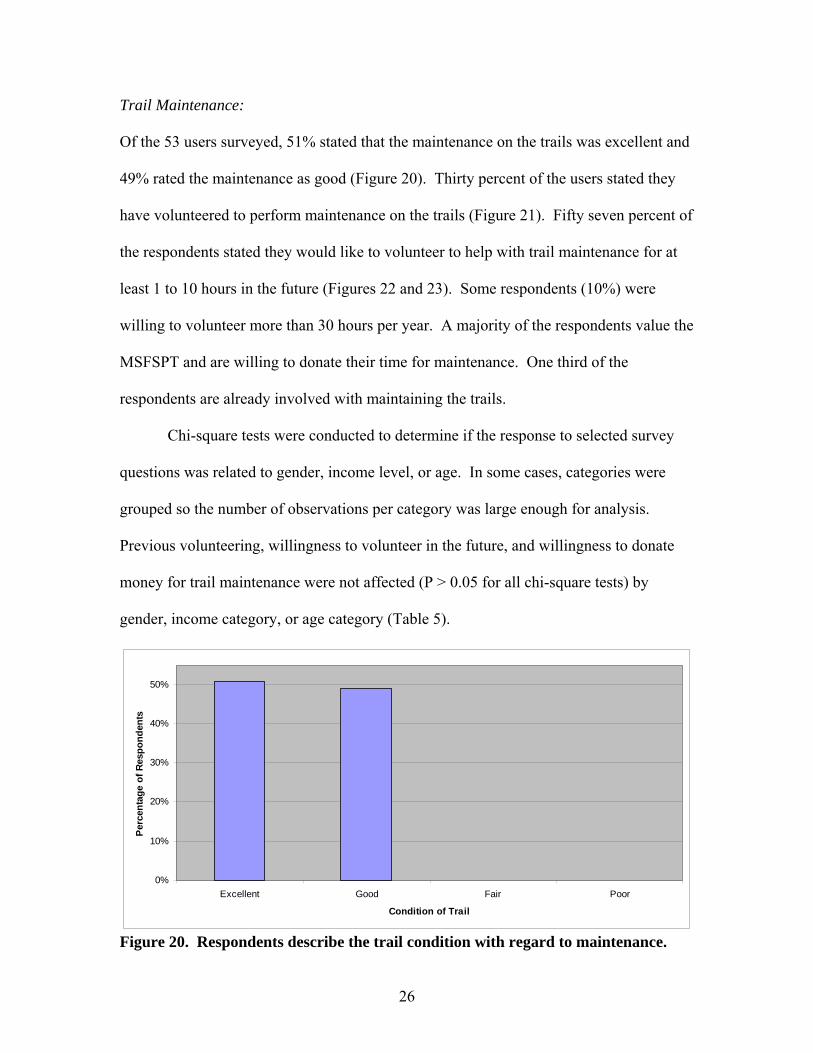
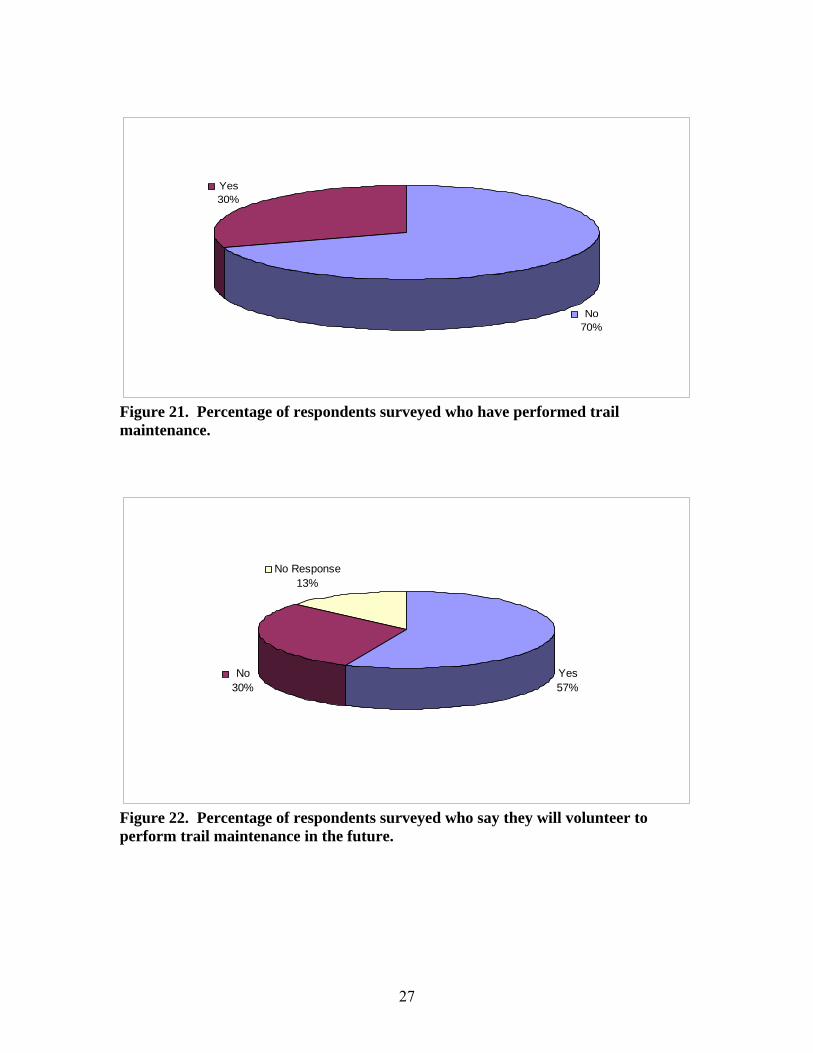
Trail Maintenance: Of the 53 users surveyed, 51% stated that the maintenance on the trails was excellent and
49% rated the maintenance as good (Figure 20). Thirty percent of the users stated they
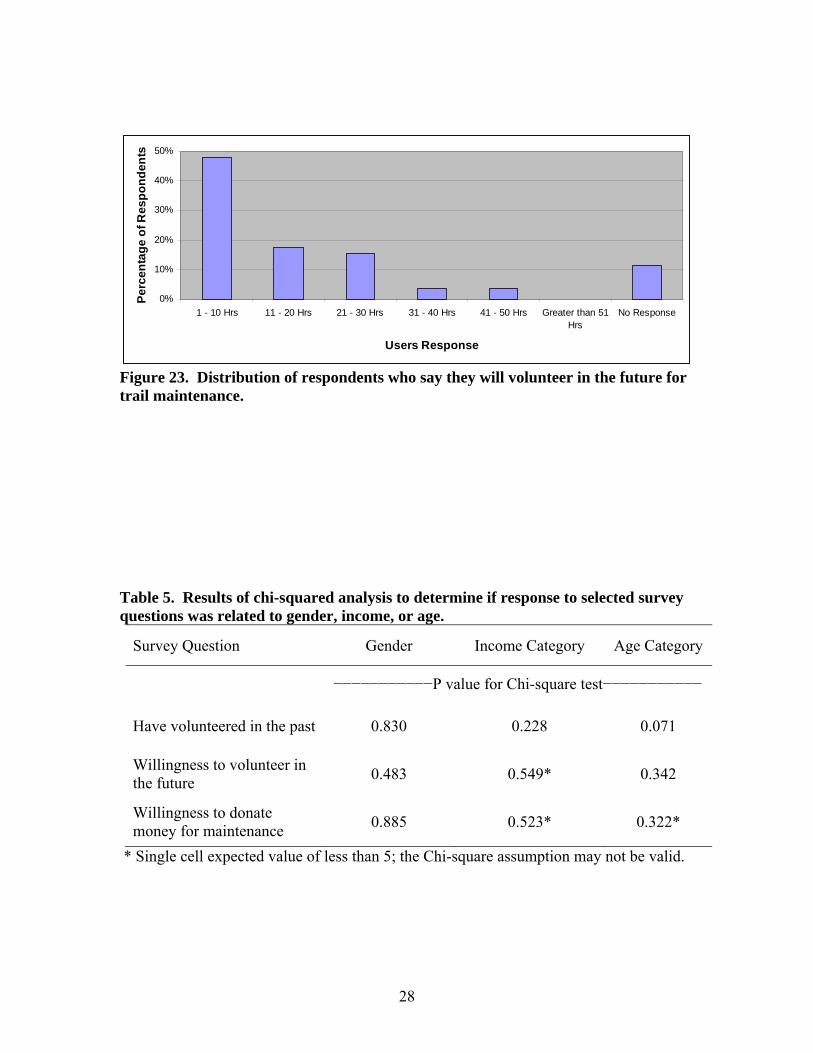
have volunteered to perform maintenance on the trails (Figure 21). Fifty seven percent of
the respondents stated they would like to volunteer to help with trail maintenance for at
least 1 to 10 hours in the future (Figures 22 and 23). Some respondents (10%) were
willing to volunteer more than 30 hours per year. A majority of the respondents value the
MSFSPT and are willing to donate their time for maintenance. One third of the
respondents are already involved with maintaining the trails.
Chi-square tests were conducted to determine if the response to selected survey
questions was related to gender, income level, or age. In some cases, categories were
grouped so the number of observations per category was large enough for analysis.
Previous volunteering, willingness to volunteer in the future, and willingness to donate
money for trail maintenance were not affected (P > 0.05 for all chi-square tests) by
gender, income category, or age category (Table 5).
0%
10%
20%
30%
40%
50%
Excellent Good Fair Poor
Condition of Trail
Per
cen
tag
e o
f R
esp
on
den
ts
Figure 20. Respondents describe the trail condition with regard to maintenance.
27
No70%
Yes30%
Figure 21. Percentage of respondents surveyed who have performed trail maintenance.
No30%
No Response13%
Yes57%
Figure 22. Percentage of respondents surveyed who say they will volunteer to perform trail maintenance in the future.
28
0%
10%
20%
30%
40%
50%
1 - 10 Hrs 11 - 20 Hrs 21 - 30 Hrs 31 - 40 Hrs 41 - 50 Hrs Greater than 51Hrs
No Response
Users Response
Pe
rce
nta
ge
of
Re
sp
on
de
nts
Figure 23. Distribution of respondents who say they will volunteer in the future for trail maintenance. Table 5. Results of chi-squared analysis to determine if response to selected survey questions was related to gender, income, or age.
Survey Question Gender Income Category Age Category
−−−−−−−−−−−P value for Chi-square test−−−−−−−−−−−
Have volunteered in the past 0.830 0.228 0.071
Willingness to volunteer in the future
0.483 0.549* 0.342
Willingness to donate money for maintenance
0.885 0.523* 0.322*
* Single cell expected value of less than 5; the Chi-square assumption may not be valid.
29
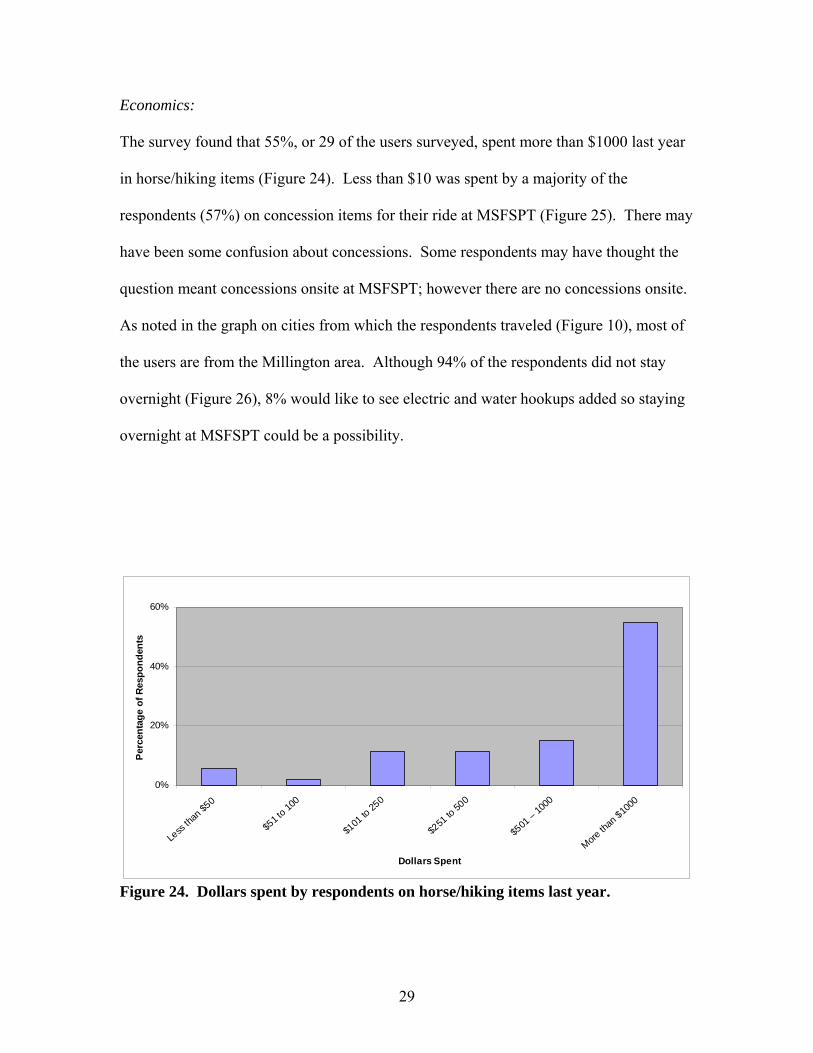
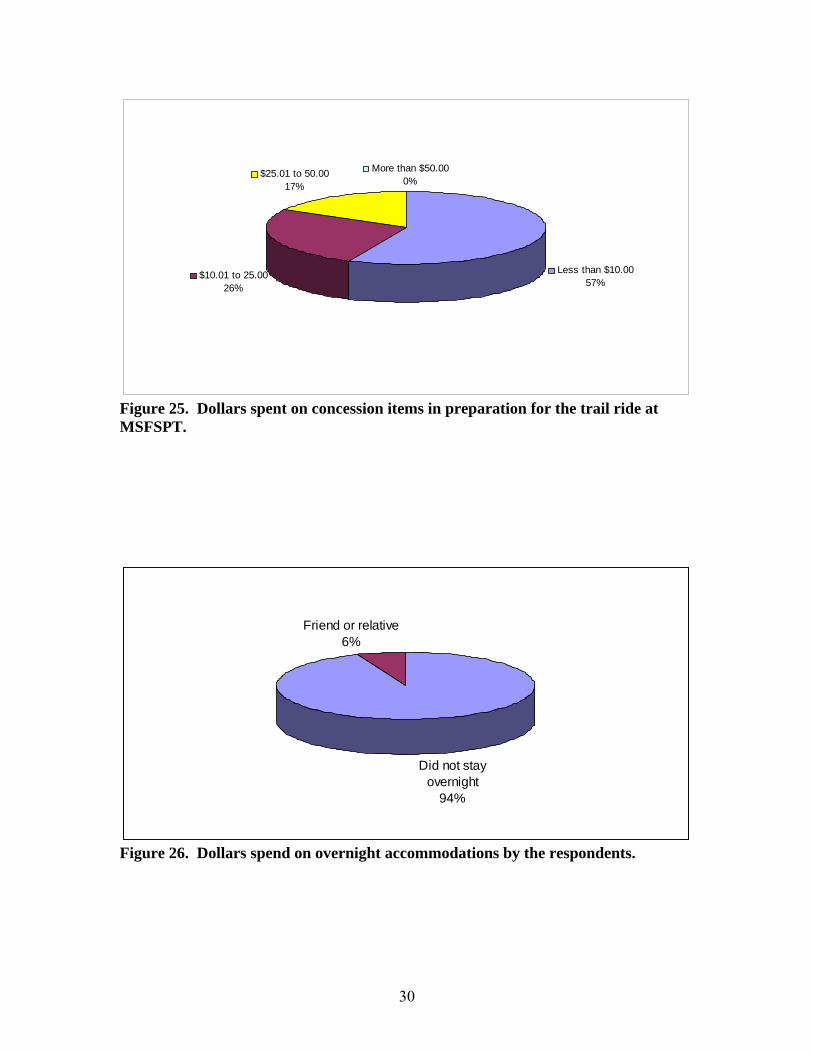
Economics: The survey found that 55%, or 29 of the users surveyed, spent more than $1000 last year
in horse/hiking items (Figure 24). Less than $10 was spent by a majority of the
respondents (57%) on concession items for their ride at MSFSPT (Figure 25). There may
have been some confusion about concessions. Some respondents may have thought the
question meant concessions onsite at MSFSPT; however there are no concessions onsite.
As noted in the graph on cities from which the respondents traveled (Figure 10), most of
the users are from the Millington area. Although 94% of the respondents did not stay
overnight (Figure 26), 8% would like to see electric and water hookups added so staying
overnight at MSFSPT could be a possibility.
0%
20%
40%
60%
Less
than
$50
$51 t
o 10
0
$101
to 25
0
$251
to 50
0
$501
– 1
000
Mor
e than
$10
00
Dollars Spent
Per
cen
tag
e o
f R
esp
on
den
ts
Figure 24. Dollars spent by respondents on horse/hiking items last year.
30
Less than $10.0057%
$10.01 to 25.0026%
$25.01 to 50.0017%
More than $50.000%
Figure 25. Dollars spent on concession items in preparation for the trail ride at MSFSPT.
Did not stay overnight
94%
Friend or relative6%
Figure 26. Dollars spend on overnight accommodations by the respondents.

31
Trail Safety and Condition: Of the 53 survey respondents, 34, or 64% strongly agreed that the trail is safe for all users
(Table 6). Seventeen percent of the users agreed the trail is safe for all users. Fifty eight
percent of the users strongly agreed and 32% of the users agreed that the bridges are safe
for equines. About 40% of the respondents did not feel that erosion is a problem on the
trail while about 40% were neutral on erosion issues. About 43% of the respondents
report that they don't think there are enough amenities at the trail head while 40% agreed
that there are enough amenities. Basic amenities such as restrooms and water for the
horses are available, but the trail head could have a few more amenities, such as
concessions, or water and electric hook ups in the parking area to make a day of riding at
MSFSPT more comfortable for people and equines. An overwhelming 88% of users
agreed or strongly agreed that MSFSPT is working well as a multi use trail. Sixty eight
percent of the users agreed or strongly agreed that the trails should be closed during
muddy/wet conditions. For each question in Table 6, chi-square analysis indicated that
the proportions for the response categories were not equal (P < 0.01 for all).

32
Table 6. Response of survey participants to questions on trail safety/miscellaneous. The P value is the probability value from the chi-square test for equal proportions in all categories.
Question Strongly
Agree Agree Neutral Disagree
Strongly Disagree
No Response
P Value
——–––––––—————% of respondents—————–––––––——
The trail is safe for all users (equines and hikers).
64% 32% 0% 0% 0% 4% < 0.0001
The bridges on the Meeman trail are safe for equines.
58% 32% 6% 0% 0% 4% < 0.0001
The width of the trail and bridges are adequate for equines.
58% 32% 2% 4% 0% 4% < 0.0001
Erosion of the trail is problematic.
6% 8% 42% 30% 9% 6% < 0.0001
There are enough amenities for users and equines at the trail head (parking area).
4% 36% 13% 36% 8% 4% < 0.0001
The trail is working well as a multi-use trail (equestrian and hiking).
30% 58% 8% 0% 0% 4% < 0.0001
The trail should be closed when the park authorities deem it to be too wet/muddy for use.
28% 40% 19% 6% 4% 4% < 0.0001
Rising fuel prices will have an effect on my number of visits to the Meeman Shelby Forest Equestrian/Hiking trail.
6% 19% 19% 36% 17% 4% 0.003
Meeman Shelby Forest Equestrian/ Hiking trail is similar to other trails I visit.
9% 49% 25% 13% 0% 4% < 0.0001
33
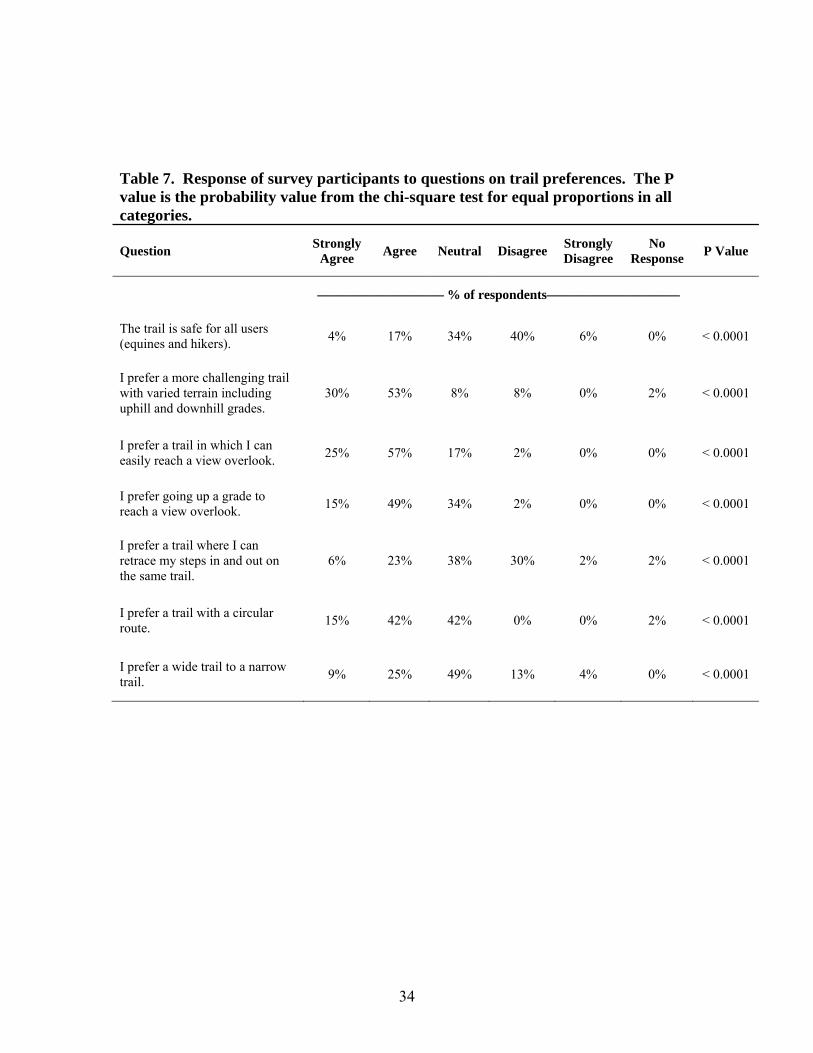
Trail Preferences: When asked about their trail preferences, the respondents overwhelming preferred a
challenging trail (83%, Table 7). Eighty two percent preferred an easily reachable
overlook and 64% preferred going up a grade to reach an overlook view. The majority of
the respondents (57%) preferred a circular route, while 42% were neutral. MSFSPT were
constructed as circular routes to minimize erosion due to horse traffic. Users of MSFSPT
understand the importance of a circular route and agree with the design because it helps
to keep the trails sustainable. Forty nine percent of the respondents are neutral on the
width of the trail. A majority of the respondents are experienced trail riders and ride
trails of all levels of difficulty. MSFSPT are built to be safe and sustainable; therefore
they tend to be easy trails to navigate even for the novice trail rider. For all questions,
chi-square analysis showed the proportions for the response categories were not equal (P
< 0.001 for all; Table 7).
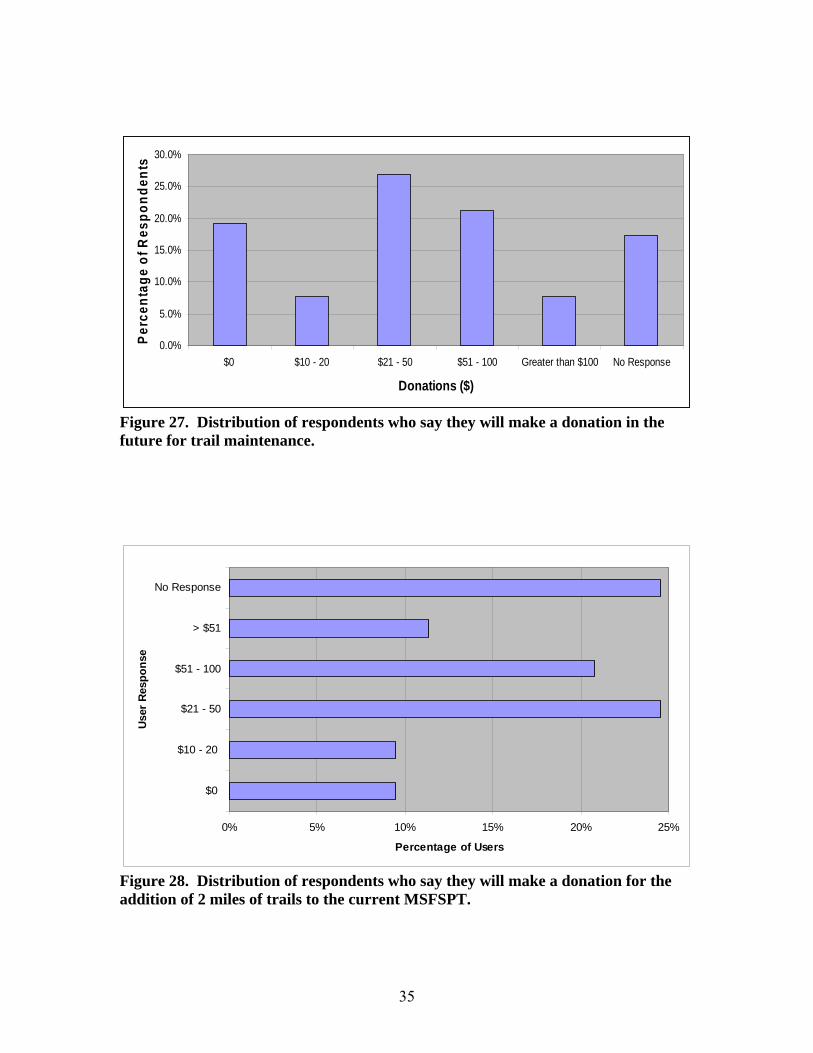
Donating: Of the users surveyed, 62% responded they would be willing to donate money in the
future for trail maintenance (Figure 27). Sixty-six percent of the respondents said they
would donate money for the addition of an extra two miles of trails to the current loop.
MSFSPT are important to the people in the area. Until the trails were built, limited areas
were available for riding horses and trail riders had to travel elsewhere for riding. Users
are ready to donate time and money for the maintenance and upkeep of the trails.
Volunteer time is an important factor for the success of MSFSPT, because without
volunteers, the trails would cease to exist.
34
Table 7. Response of survey participants to questions on trail preferences. The P value is the probability value from the chi-square test for equal proportions in all categories.
Question Strongly
Agree Agree Neutral Disagree
Strongly Disagree
No Response
P Value
——–––––––———— % of respondents————––––––––——
The trail is safe for all users (equines and hikers).
4% 17% 34% 40% 6% 0% < 0.0001
I prefer a more challenging trail with varied terrain including uphill and downhill grades.
30% 53% 8% 8% 0% 2% < 0.0001
I prefer a trail in which I can easily reach a view overlook.
25% 57% 17% 2% 0% 0% < 0.0001
I prefer going up a grade to reach a view overlook.
15% 49% 34% 2% 0% 0% < 0.0001
I prefer a trail where I can retrace my steps in and out on the same trail.
6% 23% 38% 30% 2% 2% < 0.0001
I prefer a trail with a circular route.
15% 42% 42% 0% 0% 2% < 0.0001
I prefer a wide trail to a narrow trail.
9% 25% 49% 13% 4% 0% < 0.0001
35
0.0%
5.0%
10.0%
15.0%
20.0%
25.0%
30.0%
$0 $10 - 20 $21 - 50 $51 - 100 Greater than $100 No Response
Donations ($)
Pe
rce
nta
ge
of
Re
sp
on
den
ts
Figure 27. Distribution of respondents who say they will make a donation in the future for trail maintenance.
0% 5% 10% 15% 20% 25%
$0
$10 - 20
$21 - 50
$51 - 100
> $51
No Response
Use
r R
esp
on
se
Percentage of Users
Figure 28. Distribution of respondents who say they will make a donation for the addition of 2 miles of trails to the current MSFSPT.
36
Conclusion
The purpose of this research study was to determine the economic and social
impact of the equestrian/hiker trails in Meeman Shelby Forest State Park. The survey
was administered during the spring and summer of 2012. The users of the MSFSPT
considered the trail to be safe and environmentally stable. Although the annual
maintenance cost for the trails was originally estimated to be $4500, the total cost of
maintenance since the opening of the MSFSPT in 2008 has been less than $1000. The
MSFSPT are economically sustainable due to the volunteers who provide the labor for
trail maintenance. The majority of the maintenance consists of lopping tree limbs,
cleaning bridges, and cutting trees. These activities are performed by volunteers. Of the
53 users surveyed, 51% stated that the maintenance on the trails was excellent and 49%
stated the maintenance was good. Thirty percent of the users stated they have
volunteered to perform maintenance on the trails and 55% of the respondents stated they
would like to perform maintenance on the trails as a volunteer for at least 1 to 10 hours in
the future. These numbers emphasize the importance of these trails to trail riders in the
area. Previous volunteering, willingness to volunteer in the future, and willingness to
donate money for trail maintenance were not affected (P > 0.05 for all chi-square tests)
by gender, income category, or age category
According to the users in this survey, cost is not a limiting factor for using
MSFSPT. Fifty three percent of users said the rising fuel prices would not have an effect
on them riding on the trails. However, many users are from the surrounding area and
they would not need to spend much money on fuel to get to the park. The survey found
that 55%, or 29 users surveyed, spent more than $1000 last year in horse/hiking items.

37
Less than $10 was spent by a majority of the respondents (57%) on concession items for
their ride at MSFSPT. The respondents may have misinterpreted the question as actually
buying concessions onsite at MSFSPT, but there are no concessions available onsite.
Respondents did not stay overnight for their trip to the trails. Most of the users were
from the Millington area and did not need overnight accommodations. Although most
users did not stay overnight, 8% of the respondents would like to stay overnight at
MSFSPT, if allowed, and stable their equines in the barn at the trail head.
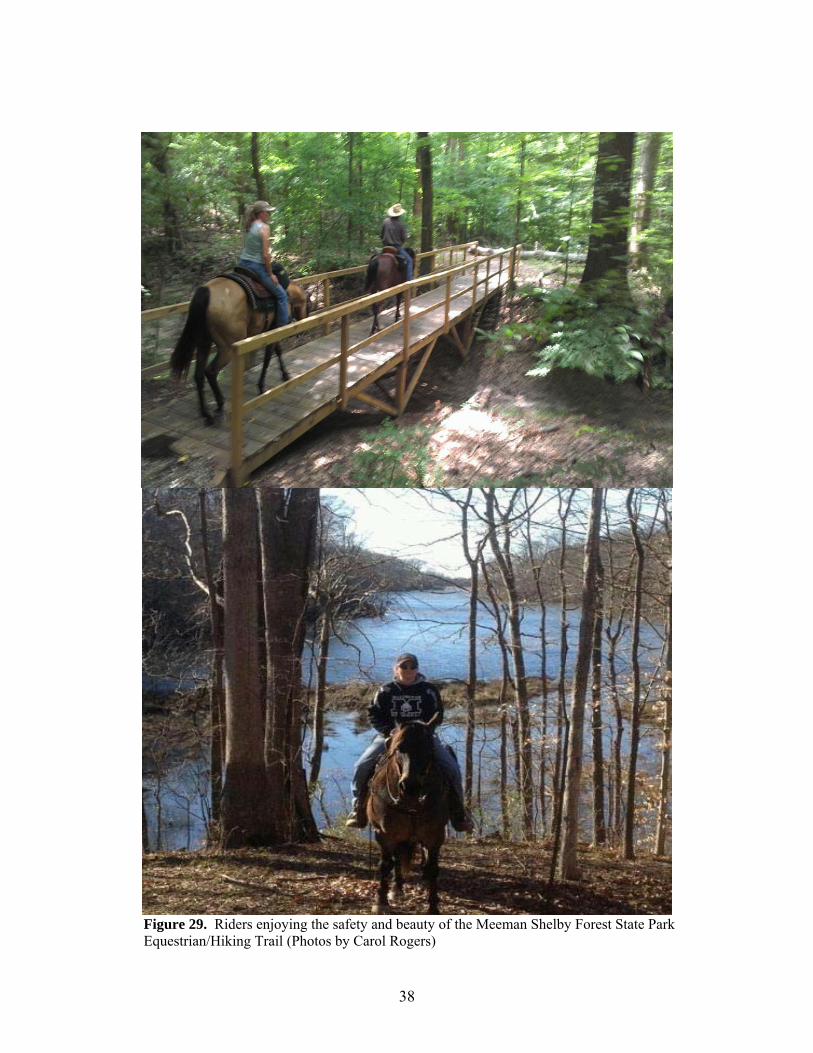
This study showed that the MSFSPT are good for the area. Since there is a lack
of riding areas in Shelby County, TN, MSFSPT is a great resource for trail riders and
hikers. Many users come from near and far to enjoy the safe and beautiful trails located
in MSFSP (Figure 44). Having a trail designed and maintained by volunteers shows how
citizens and government can work together to create a positive outcome for everyone
involved. Volunteers are the foundation for the success of MSFSPT; without volunteers,
there would be no trails at Meeman Shelby Forest State Park. The findings of this study
have implications for other parks where there is a need for recreational trails, but there is
no funding available for design, construction and maintenance. MSFSPT is a great
example of government and private citizens working together for the good of everyone.
38
Figure 29. Riders enjoying the safety and beauty of the Meeman Shelby Forest State Park Equestrian/Hiking Trail (Photos by Carol Rogers)
39
References
Auchter, K. 2008. An analysis of Kentucky equestrian trail riders: determining rider behaviors and valuing site amenities that contribute to repeat visits. Masters Thesis. Paper 572. http://uknowledge.uky.edu/gradschool_theses/572.
Bailey, T. 2008. Meeman Shelby Forest State Park's horseback riding/hiking trail to
open November 8. The Commercial Appeal. Oct 29. http://www.commercialappeal.com/news/2008/oct/29/new-place -to-hoof-03/?feedback=1. Viewed 22SEP2011.
Blackwell, M., Pagoulatos, A., Wuyang, H., Aucter, K. 2009. Recreational demand for
equestrian trail-riding. ARER. 38:229-239. Cole, D. 1995. Experimental trampling of vegetation. I. Relationship between
trampling intensity and vegetation response. J. Appl. Ecol. 32:203-214. Deloitte, 2005. The economic impact of the horse industry on the United States, Vol 1.
American Horse Council. Digitized 02MAR2011. Hancock, J., Hoek, K., Bradshaw, S., Coffman, J. D., Engelmann, J. 2007. Equestrian
design guidebook for trails, trailheads and campgrounds. USDA-For. Serv., Tech. and develop. Prog., 2300 Recreation, 0723-2816-MTDC.
Missouri Department of Conservation. 2007. "Equestrian Trail Guidelines For
Construction and Maintenance." Conservation Commission of the State of Missouri. 2007. Web. 21Sep2011.
Stormer, S. 2009. Sustainable trails for equestrian use – design, construction,
maintenance and proper use make a difference. http://www.applesnoats.com/sustainable2.pdf. Viewed 07FEB2012.
Tennessee Agricultural Statistics. 2004. Tennessee Department of Agriculture and US
Department of Agriculture. United States Department of Agriculture National Agricultural Statistics Service. 2004.
Tennessee Department of Agricultural Economics. 2010. Tennessee's equine industry:
overview and estimated economic impacts. http://www.aimag.ag.utk.edu/pubs/equine.pdf. Viewed 03FEB2012.
Tennessee. Department of Environment and Conservation. Recreation Educational
Services Division. 2007. "Pathways to Trail Building." Tennessee Recreation Trails Manual, 4th edition. TN Dept. Environment and Conservation, 11 Dec. 2007. Viewed 21JAN2012.

40
United States Department of Agriculture (USDA), National Agricultural Statistics Service. 2009. 2007 Census of Agriculture http://www.agcensus.usda.gov/Publications/2007/Full_Report/usv1.pdf. Viewed 23FEB2012.
Wood, G.W. 2005. The Meeman Shelby Forest State Park equestrian trail system. A
Proposal. Wood, G.W. 2006. Trail riders: hopes, dreams, values, perceptions, and peril.
http://www.etaca.info/pdf3/Trail_Riders_Hopes_ETACA_110609.pdf. Viewed 31JAN2012.
Wood, G.W. 2007. Recreational horse trails in rural and wildland areas: design,
construction and maintenance. Department of Forestry and Natural Resources, Clemson University, Clemson, SC.

41
Appendix
Meeman Shelby Forest State Park Equestrian/Hiker Trails Survey 2012 This survey is being administered by the University of Tennessee at Martin (UT Martin),
Department of Agriculture, Geosciences, and Natural Resources and has been approved by the
UT Martin Institutional Review Board (IRB) – IRB number 12-165-E05-4005/Roge,Car. The
survey is designed to determine the economic and social impact of the equestrian/hiker trails in
Meeman Shelby Forest State Park. Your response to this survey is completely voluntary and no
personal identifiable information will be released. All data collected for this study will be
aggregated and only summarized data will be discussed. You may choose to not answer any part
or question on the survey and you may discontinue the survey at any time. Survey results will be
stored separately from this consent document, which will be kept in a locked cabinet for three
years in the faculty advisor’s office, per University of Tennessee at Martin IRB requirements.
Thank you so much for your participation in this survey. Carol Rogers
Trail Use 1. From what zip code did you travel from to get to Meeman Shelby Forest Trails?
_____________________ Approximately how many miles?___________
2. Approximately how much did you spend on fuel to get here? $
3. Is this your first time to visit Meeman Shelby Forest Trails? (circle one) Yes / No
4. How do you plan on using the trail or how did you use the trail? (circle one)
a. Walking
b. Jogging
c. Horseback
d. Mule
e. Other (Please specify):

42
5. How often do you use the trail in each of the seasons? Check one per row.
Season Daily Weekly Monthly Less than once per month
Don’t use in this season
Winter (Dec, Jan, Feb)
Spring (Mar, Apr, May)
Summer (Jun, Jul, Aug)
Fall (Sep, Oct, Nov)
6. For what primary reason do you use the trail? (circle one)
a. Health and exercise
b. Recreation/relaxation
c. Fitness training
d. Enjoy nature
e. Photography
f. Other (Please specify):
7. Generally when do you use the trail? (circle one)
a. Weekdays
b. Weekends
c. Both
8. What time of day do you use the trail? (circle all that apply)
a. Mornings
b. Afternoons
c. Evenings
d. All day
9. How did you hear about the trail? (circle one)
a. Word of mouth
b. Park brochure
c. Park website
d. Newspaper
e. Other (Please specify): ___________________________________
43
10. If you ride horses, approximately how many years of riding experience do you
have?_________ Years
11. Do you primarily use the trail: (circle one)
a. alone
b. with a few friends
c. with family
d. Other (Please Specify): ____________________________________
12. Approximately how much did you spend on items such as horses, horse gear, clothing/footwear, walking/jogging gear in the past year? (circle one)
a. Less than $50
b. $51 to 100
c. $101 to 250
d. $251 to 500
e. $501 – 1000
f. More than $1000
13. In conjunction with this trip to the trail how much did you spend or do you plan to spend on concessions (beverages, snacks, candy, ice, etc.) at the park? (Circle one)
a. Less than $10.00
b. $10.01 to 25.00
c. $25.01 to 50.00
d. More than $50.00
14. On this trip, did you stay overnight in one of the following types of accommodations at or near Meeman Shelby State Park? (circle one)
a. Did not stay overnight
b. Hotel/motel
c. Campground
d. Friend or relative
e. Other (Please specify):______________________________________
15. Approximately how much did you spend on overnight accommodations per night? $_____

44
16. If horses were available for rent, would you be interested in renting a horse and how much
would you be willing to pay to rent a horse?
a. No, I am not interested in renting a horse
b. Yes, I would like to rent a horse and would be willing to pay: $ per hour
17. Please indicate if you agree or disagree with the following statements by checking the appropriate box for each:
Statement Strongly
Agree Agree Neutral Disagree
Strongly Disagree
The trail is safe for all users (equines and hikers).
□ □ □ □ □
The bridges on the Meeman trail are safe for equines.
□ □ □ □ □
The width of the trail and bridges are adequate for equines.
□ □ □ □ □
Erosion of the trail is problematic.
□ □ □ □ □
There are enough amenities for users and equines at the trail head (parking area).
□ □ □ □ □
The trail is working well as a multi-use trail (equestrian and hiking).
□ □ □ □ □
The trail should be closed when the park authorities deem it to be too wet/muddy for use.
□ □ □ □ □
Rising fuel prices will have an effect on my number of visits to the Meeman Shelby Forest Equestrian/Hiking trail.
□ □ □ □ □
Meeman Shelby Forest Equestrian/ Hiking trail is similar to other trails I visit.
□ □ □ □ □

45
Trail Preferences:
18. Please indicate if you agree or disagree with the following statements by checking the appropriate box for each:
Statement Strongly
Agree Agree Neutral Disagree
Strongly Disagree
I prefer a level, relatively easy grade. □ □ □ □ □
I prefer a more challenging trail with varied terrain including uphill and downhill grades.
□ □ □ □ □
I prefer a trail in which I can easily reach a view overlook.
□ □ □ □ □
I prefer going up a grade to reach a view overlook.
□ □ □ □ □
I prefer a trail where I can retrace my steps in and out on the same trail.
□ □ □ □ □
I prefer a trail with a circular route. □ □ □ □ □
I prefer a wide trail to a narrow trail. □ □ □ □ □
Trail Maintenance
19. Trail maintenance is: (circle one)
a. Excellent
b. Good
c. Fair
d. Poor
20. Do you perform or have you performed volunteer work on the Shelby Forest
Equestrian/Hiking trail (Circle one)? Yes / No
21. If you have performed volunteer work on the Shelby Forest Equestrian/Hiking trail, how
many hours per year do you volunteer?
a. N/A
b. 1 – 5
c. 6 – 10
d. 11 – 20
e. 21 – 30
f. Over 30

46
22. How many hours per year would you be willing to volunteer for upkeep of this trail?
hours per year
23. How much would you be willing to donate per year for maintenance and upkeep of the trails?
$ per year
24. How much would you be willing to donate (in the form of a one-time donation) to have an
extra 2 miles added to the trail? $
25. Would you be willing to volunteer to help with construction of an extra two miles? Yes / No
Demographics
26. Sex (circle one): Male Female 27. Age: years
28. Highest level of education completed (circle one):
a. Did not complete high school
b. High School
c. Associate Degree
d. Bachelor Degree
e. Graduate Degree (MS, PhD, etc)
f. Professional Degree (MD, lawyer, etc.)
29. Household Annual Income (circle one):
a. $0 – 25,000
b. $25,001 – 50,000
c. $50,001 – 75,000
d. $75,001 – 100,000
e. $100,001 – 150,000
f. Over $150,000
30. Please provide any additional comments here (for example, what did you like or not like
about the trail?):