medium and long-term scenarios for global · pdf filemedium and long-term scenarios for global...
TRANSCRIPT

OECD Economic Outlook,
Volume 2012/1
© OECD 2012
191
Chapter 4
MEDIUM AND LONG-TERM SCENARIOS FOR GLOBAL GROWTH
AND IMBALANCES

4. MEDIUM AND LONG-TERM SCENARIOS FOR GLOBAL GROWTH AND IMBALANCES
OECD ECONOMIC OUTLOOK, VOLUME 2012/1 © OECD 2012 – PRELIMINARY VERSION192
Introduction and summary
This chapter considerslong-term prospects and
risks for the world economy
Many countries face a long period of adjustment to erase the legacies
of the crisis, particularly high unemployment, excess capacity and large
fiscal imbalances. Further ahead, demographic changes, including ageing,
and fundamental forces of economic convergence will bring about
massive shifts in the composition of global GDP. To illustrate the nature
and scale of some of the policy challenges posed by these developments,
this chapter describes medium and long-term scenarios for OECD and
non-OECD G20 countries using a new modelling framework to extend the
short-term projections described in Chapters 1 to 3. This framework
focuses on the interaction between technological progress, demographic
change, fiscal adjustment, current account imbalances and structural
policies. The scenarios suggest that gradual but ambitious fiscal
consolidation and structural reforms could bring about substantial gains
in growth as well as reducing a range of risks, particularly by reducing
large fiscal and current account imbalances.
The key findings are: The main conclusions are:
The next 40 years willsee major changes in the
relative size of economies…
l Growth of the present non-OECD economies will continue to outpace
that of the present OECD countries, driven primarily by catch-up in
multi-factor productivity, but the difference will likely narrow
substantially over coming decades. From over 7% per year on average
over the last decade, non-OECD growth may decline to around 5% in
the 2020s and to about half that by the 2040s. Until 2020, China will
have the highest growth rate among major countries, but could be then
surpassed by both India and Indonesia. Fast growth in China and India
will take their combined GDP, measured at 2005 purchasing power
parities (PPPs), from less than half of the total output of the major seven
OECD economies in 2010 to exceeding it by around 2025. China’s GDP is
projected to surpass that of the United States in 2017.
… but large gaps in livingstandards will persist
in 2050
l Large GDP per capita differences will persist despite more rapid growth
in poorer countries; for example, by 2050 GDP per capita in China and
Russia will be about half of that of the leading countries, while in Brazil
it will be about 40% and in India and Indonesia it will be about one-
quarter. Among OECD countries, the most rapid catch-up in income per
capita will likely occur in initially lower-income countries (Mexico,
Turkey, Chile and Eastern European countries) while the dispersion in
income per capita among initially high-income countries will change
only marginally.

4. MEDIUM AND LONG-TERM SCENARIOS FOR GLOBAL GROWTH AND IMBALANCES
OECD ECONOMIC OUTLOOK, VOLUME 2012/1 © OECD 2012 – PRELIMINARY VERSION 193
Fiscal and current accountimbalances are expected to
worsen
l In the absence of ambitious policy changes, in particular if
governments just undertake sufficient measures to stabilise public
debt, worsening and re-emerging imbalances could undermine growth
prospects. Firstly, as the current cycle unwinds, the scale of global
current account imbalances may increase to pre-crisis peaks by the
late 2020s. In addition, in many OECD countries government
indebtedness will exceed thresholds at which there is evidence of
adverse effects on interest rates, growth and the ability to stabilise the
economy.
Consolidation needs tostabilise debt are
substantial for manycountries
l Fiscal consolidation requirements are substantial in many countries,
particularly in the two largest. For Japan, stabilising the debt-to-GDP
ratio would eventually require a total improvement in the underlying
primary balance of 13 percentage points of GDP from the 2011 position,
with little progress expected over the next two years.1 For the United
States, the total required fiscal consolidation to stabilise debt is about
6½ percentage points of GDP, of which about 2½ percentage points is
expected to be achieved by 2013. Other countries for which
consolidation requirements are large include the euro area countries
that have been under financial market pressure: Ireland, Greece,
Portugal and Spain. To stabilise debt they require between 4 and
7 percentage points of GDP improvement in the underlying primary
balance from the 2011 position on average until 2030, but most of this
adjustment is expected to be completed within the next two years.
Other OECD countries requiring more than 4 percentage points of GDP
of consolidation from 2011 include Poland, Slovak Republic, Slovenia
and United Kingdom. In addition, for a typical OECD country, additional
offsets of 3 to 4% of GDP will have to be found over the coming 20 years
to meet spending pressures due to increasing pension and health care
costs.
On this basis there are largedifferences in the adequacy
of current official plans
l The United States and Japan also stand out because there is, as yet, a
lack of any detailed official medium-term fiscal plan that would be
sufficient to stabilise debt. Japan has a medium-term plan, but it is not
sufficiently ambitious. In the United States, there are a number of fiscal
plans, but political disagreement makes the extent, pace and
instruments of future consolidation very uncertain. Very substantial
front-loaded consolidation is planned in those euro area countries –
Greece, Ireland and Portugal – that requested assistance from the
European Union and the IMF. For these countries, and for most other
1. For both Japan and the United States, the consolidation requirements reportedhere are higher than the average consolidation reported in Table 4.3, because aprotracted period of adjustment implies the total increase in the underlyingprimary balance by the end-year (2030 for the United States and 2040 for Japan)is significantly larger than the average increase over the period from 2011 to theend-year. For other countries, where the requirement is smaller and/or much ofthe adjustment is expected by 2013, the difference between the average andend-year measure is typically small.

4. MEDIUM AND LONG-TERM SCENARIOS FOR GLOBAL GROWTH AND IMBALANCES
OECD ECONOMIC OUTLOOK, VOLUME 2012/1 © OECD 2012 – PRELIMINARY VERSION194
countries where consolidation needs are most severe, official medium-
term consolidation plans exceed the requirements to stabilise debt, so
their implementation would put the debt ratio on a downward path.
To reduce debt levels rapidlywould require much greater
consolidation
l Consolidation requirements would be more demanding if the aim were
to lower debt-to-GDP ratios to 60%, which for most countries could be
achieved before 2030. For the OECD area as a whole, fiscal tightening
equivalent to a 6 percentage points of GDP increase in the underlying
primary balance from the 2011 position would be required on average
until 2030, although this calculation is dominated by the requirements
of the two largest OECD economies. Among OECD economies for which
debt exceeds 100% of GDP, lowering the debt ratio to 60% by 2030
requires 2-3 percentage points of GDP more consolidation than to only
stabilise debt. Japan is an exception, however, as it would require much
more consolidation and even then there would be little prospect of
reaching a debt ration of 60% within the next two decades.
Sustaining fiscalconsolidation would helpreduce global imbalances
and risks
l Because consolidation needs are higher in current account deficit
countries, more ambitious long-term fiscal consolidation among OECD
countries would help relieve global current account imbalances.
Lowering government indebtedness to below thresholds where they
risk affecting interest rates and lowering trend growth would also
create fiscal space for dealing with future shocks, as well as reduce
vulnerability to any future decline in global saving, whether due to
ageing or other factors.
Ambitious reforms couldboost growth and reduce
imbalances
l A combination of ambitious fiscal consolidation efforts and deep
structural reforms can both raise long-run living standards and reduce
the risks of major disruptions to growth by mitigating global
imbalances, raising aggregate OECD GDP in 2050 by 7% and non-OECD
GDP by 13%, with much larger effects in countries where policy lags
most behind best practice.
A new modelling framework based on conditional convergence
Scenarios are underpinnedby a new modelling
framework
Long-term growth projections are needed to facilitate the analysis of
macroeconomic issues related to fiscal and international imbalances and
demographic shifts, which develop gradually over long time horizons, as
well as the effects of structural reforms on trend growth over the long run.
While there is no single theory of economic growth, there is wide support
for a view in which each country converges to its own steady-state
trajectory of GDP per capita determined by the interface between global
technological development and country-specific structural conditions
and policies (so-called conditional convergence). The scenarios presented
in this chapter are underpinned by a new model which is used to extend
the short-term projections presented in Chapters 1 to 3 by about 40 years
within a conditional convergence economic growth framework (Box 4.1).
4. MEDIUM AND LONG-TERM SCENARIOS FOR GLOBAL GROWTH AND IMBALANCES
OECD ECONOMIC OUTLOOK, VOLUME 2012/1 © OECD 2012 – PRELIMINARY VERSION 195
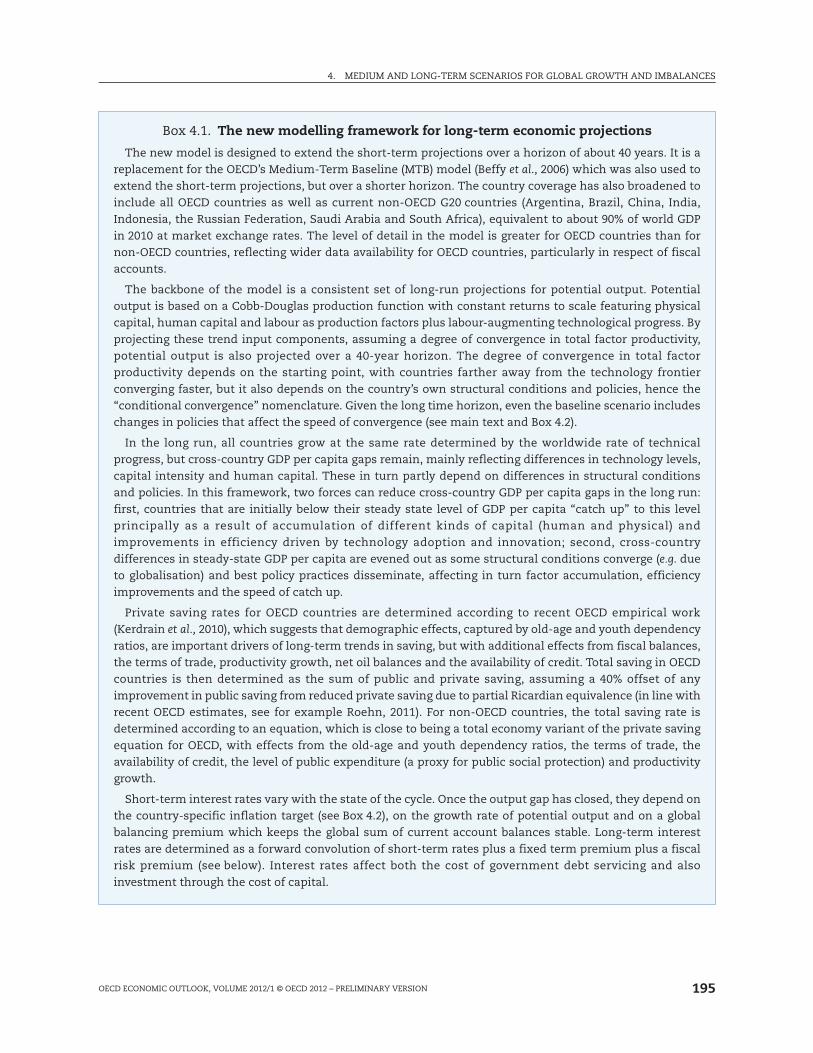
Box 4.1. The new modelling framework for long-term economic projections
The new model is designed to extend the short-term projections over a horizon of about 40 years. It is areplacement for the OECD’s Medium-Term Baseline (MTB) model (Beffy et al., 2006) which was also used toextend the short-term projections, but over a shorter horizon. The country coverage has also broadened toinclude all OECD countries as well as current non-OECD G20 countries (Argentina, Brazil, China, India,Indonesia, the Russian Federation, Saudi Arabia and South Africa), equivalent to about 90% of world GDPin 2010 at market exchange rates. The level of detail in the model is greater for OECD countries than fornon-OECD countries, reflecting wider data availability for OECD countries, particularly in respect of fiscalaccounts.
The backbone of the model is a consistent set of long-run projections for potential output. Potentialoutput is based on a Cobb-Douglas production function with constant returns to scale featuring physicalcapital, human capital and labour as production factors plus labour-augmenting technological progress. Byprojecting these trend input components, assuming a degree of convergence in total factor productivity,potential output is also projected over a 40-year horizon. The degree of convergence in total factorproductivity depends on the starting point, with countries farther away from the technology frontierconverging faster, but it also depends on the country’s own structural conditions and policies, hence the“conditional convergence” nomenclature. Given the long time horizon, even the baseline scenario includeschanges in policies that affect the speed of convergence (see main text and Box 4.2).
In the long run, all countries grow at the same rate determined by the worldwide rate of technicalprogress, but cross-country GDP per capita gaps remain, mainly reflecting differences in technology levels,capital intensity and human capital. These in turn partly depend on differences in structural conditionsand policies. In this framework, two forces can reduce cross-country GDP per capita gaps in the long run:first, countries that are initially below their steady state level of GDP per capita “catch up” to this levelprincipally as a result of accumulation of different kinds of capital (human and physical) andimprovements in efficiency driven by technology adoption and innovation; second, cross-countrydifferences in steady-state GDP per capita are evened out as some structural conditions converge (e.g. dueto globalisation) and best policy practices disseminate, affecting in turn factor accumulation, efficiencyimprovements and the speed of catch up.
Private saving rates for OECD countries are determined according to recent OECD empirical work(Kerdrain et al., 2010), which suggests that demographic effects, captured by old-age and youth dependencyratios, are important drivers of long-term trends in saving, but with additional effects from fiscal balances,the terms of trade, productivity growth, net oil balances and the availability of credit. Total saving in OECDcountries is then determined as the sum of public and private saving, assuming a 40% offset of anyimprovement in public saving from reduced private saving due to partial Ricardian equivalence (in line withrecent OECD estimates, see for example Roehn, 2011). For non-OECD countries, the total saving rate isdetermined according to an equation, which is close to being a total economy variant of the private savingequation for OECD, with effects from the old-age and youth dependency ratios, the terms of trade, theavailability of credit, the level of public expenditure (a proxy for public social protection) and productivitygrowth.
Short-term interest rates vary with the state of the cycle. Once the output gap has closed, they depend onthe country-specific inflation target (see Box 4.2), on the growth rate of potential output and on a globalbalancing premium which keeps the global sum of current account balances stable. Long-term interestrates are determined as a forward convolution of short-term rates plus a fixed term premium plus a fiscalrisk premium (see below). Interest rates affect both the cost of government debt servicing and alsoinvestment through the cost of capital.

4. MEDIUM AND LONG-TERM SCENARIOS FOR GLOBAL GROWTH AND IMBALANCES
OECD ECONOMIC OUTLOOK, VOLUME 2012/1 © OECD 2012 – PRELIMINARY VERSION196
Output is assumed toreturn to potential over four
to five years…
The long-term scenarios are anchored on the short-term projections
for 2013,2 beyond which output gaps are assumed to close smoothly over a
period of four to five years (under both fiscal rules considered), depending
on their initial size, and are generally almost entirely closed by 2018. This
implies above-trend growth for the first few years of the projections in
countries with negative output gaps in 2013, including where this gap is
exceptionally large such as Greece, Ireland, Portugal and Spain. Also,
despite continued and, in many cases, large negative output gaps over this
period, no country experiences sustained deflation. Once the output gap is
closed, output grows in line with potential and monetary policy ensures
that inflation returns to a country or region-specific target (see Box 4.2).3
… but there are large risksand uncertainties around
this path
The scenarios presented in this chapter thus provide a benign, even
optimistic, medium-term outlook for the world economy. There are large
risks around this central path that could derail the recovery in one or
more countries, including: further crises of confidence around the debt of
one or more governments; disorderly debt defaults; the collapse of one or
more systemically important financial institutions or renewed concerns
Box 4.1. The new modelling framework for long-term economic projections (cont.)
Through the global interest rate balancing premium just mentioned, movements in long-term interestrates ensure that global saving and investment remain aligned, whereas imbalances at the national levelare reflected in current account balances. An exception is a group of major non-OECD oil exportingcountries, defined to include Saudi Arabia, Russia as well as 27 smaller non-OECD countries. For thesecountries, no individual projections of current balances are made. Rather, the combined current accountbalance of all non-OECD oil exporting countries is calculated based on projections of their balance of tradein oil. The real price of oil is assumed to rise by 5% per annum to 2020 and continue rising thereafter, but ata more moderate pace (see Box 4.2).
The fiscal side of the model ensures that government debt-to-GDP ratios stabilise over the medium term. Thisis achieved through alternative fiscal closure rules for the primary balance which either stabilise debt througha gradual improvement in the primary balance or target a specific (usually lower) debt-to-GDP ratio. Debt serviceresponds to changes in debt and market interest rates, but with lags which reflect the maturity structure ofdebt. Higher debt levels are assumed to entail higher country-specific fiscal risk premia consistent with thefindings of Égert (2010) and Laubach (2009): for every percentage point that the debt ratio exceeds a threshold of75% of GDP, the fiscal risk premium applied to long-term interest rates increases by 2 basis points, with anadditional increase of 2 basis points for every percentage point that the debt ratio exceeds 125%. No allowancefor an additional interest rate premium is made for countries which do not have their own national currency.
Further details on the new model and on the methodology used to make the long-term projections areavailable in Johansson et al. (2012).
It should be kept in mind that projections made over several decades are inherently speculative, withmany layers of uncertainty including the determinants of growth and the size of their impact on growth.
2. An exception is that there is a minor discrepancy between the short-term andlong-term projections for Japan, with the former including the most recentquarterly GDP update.
3. This is consistent with inflation expectations remaining fairly well anchored(both upwards and downwards) and with the operation of “speed-limit” effects.
4. MEDIUM AND LONG-TERM SCENARIOS FOR GLOBAL GROWTH AND IMBALANCES
OECD ECONOMIC OUTLOOK, VOLUME 2012/1 © OECD 2012 – PRELIMINARY VERSION 197
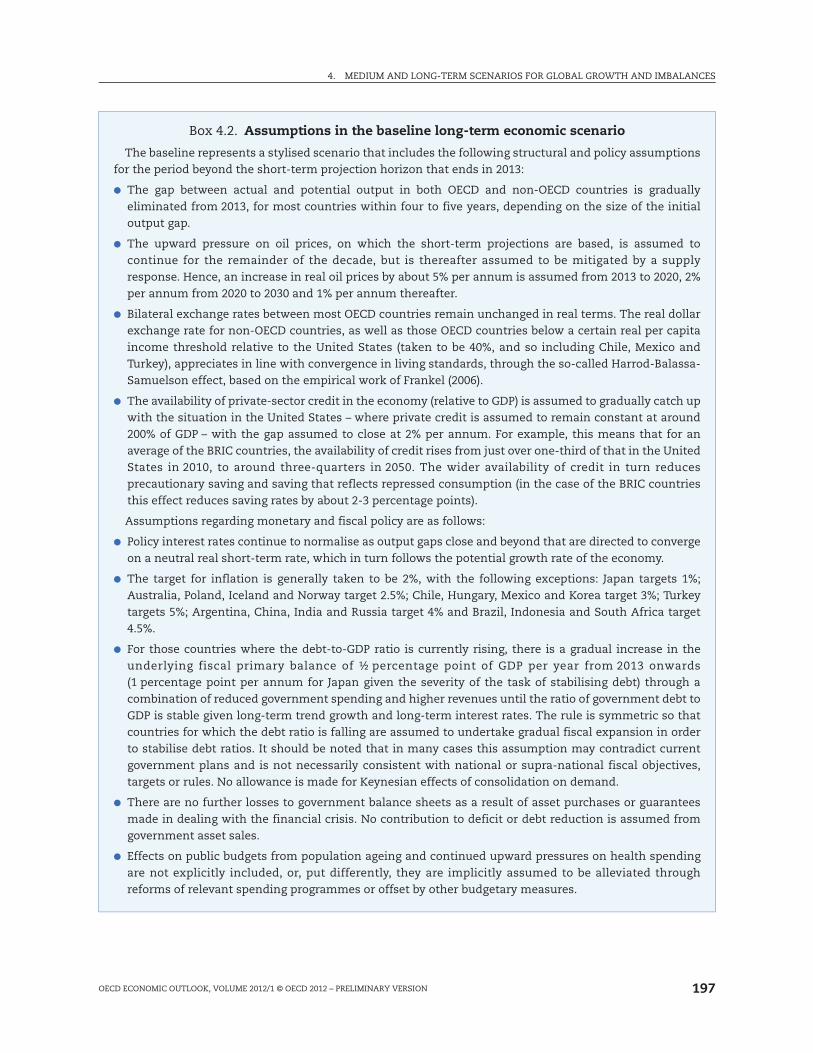
Box 4.2. Assumptions in the baseline long-term economic scenario
The baseline represents a stylised scenario that includes the following structural and policy assumptionsfor the period beyond the short-term projection horizon that ends in 2013:
l The gap between actual and potential output in both OECD and non-OECD countries is graduallyeliminated from 2013, for most countries within four to five years, depending on the size of the initialoutput gap.
l The upward pressure on oil prices, on which the short-term projections are based, is assumed tocontinue for the remainder of the decade, but is thereafter assumed to be mitigated by a supplyresponse. Hence, an increase in real oil prices by about 5% per annum is assumed from 2013 to 2020, 2%per annum from 2020 to 2030 and 1% per annum thereafter.
l Bilateral exchange rates between most OECD countries remain unchanged in real terms. The real dollarexchange rate for non-OECD countries, as well as those OECD countries below a certain real per capitaincome threshold relative to the United States (taken to be 40%, and so including Chile, Mexico andTurkey), appreciates in line with convergence in living standards, through the so-called Harrod-Balassa-Samuelson effect, based on the empirical work of Frankel (2006).
l The availability of private-sector credit in the economy (relative to GDP) is assumed to gradually catch upwith the situation in the United States – where private credit is assumed to remain constant at around200% of GDP – with the gap assumed to close at 2% per annum. For example, this means that for anaverage of the BRIC countries, the availability of credit rises from just over one-third of that in the UnitedStates in 2010, to around three-quarters in 2050. The wider availability of credit in turn reducesprecautionary saving and saving that reflects repressed consumption (in the case of the BRIC countriesthis effect reduces saving rates by about 2-3 percentage points).
Assumptions regarding monetary and fiscal policy are as follows:
l Policy interest rates continue to normalise as output gaps close and beyond that are directed to convergeon a neutral real short-term rate, which in turn follows the potential growth rate of the economy.
l The target for inflation is generally taken to be 2%, with the following exceptions: Japan targets 1%;Australia, Poland, Iceland and Norway target 2.5%; Chile, Hungary, Mexico and Korea target 3%; Turkeytargets 5%; Argentina, China, India and Russia target 4% and Brazil, Indonesia and South Africa target4.5%.
l For those countries where the debt-to-GDP ratio is currently rising, there is a gradual increase in theunderlying fiscal primary balance of ½ percentage point of GDP per year from 2013 onwards(1 percentage point per annum for Japan given the severity of the task of stabilising debt) through acombination of reduced government spending and higher revenues until the ratio of government debt toGDP is stable given long-term trend growth and long-term interest rates. The rule is symmetric so thatcountries for which the debt ratio is falling are assumed to undertake gradual fiscal expansion in orderto stabilise debt ratios. It should be noted that in many cases this assumption may contradict currentgovernment plans and is not necessarily consistent with national or supra-national fiscal objectives,targets or rules. No allowance is made for Keynesian effects of consolidation on demand.
l There are no further losses to government balance sheets as a result of asset purchases or guaranteesmade in dealing with the financial crisis. No contribution to deficit or debt reduction is assumed fromgovernment asset sales.
l Effects on public budgets from population ageing and continued upward pressures on health spendingare not explicitly included, or, put differently, they are implicitly assumed to be alleviated throughreforms of relevant spending programmes or offset by other budgetary measures.

4. MEDIUM AND LONG-TERM SCENARIOS FOR GLOBAL GROWTH AND IMBALANCES
OECD ECONOMIC OUTLOOK, VOLUME 2012/1 © OECD 2012 – PRELIMINARY VERSION198
around bank solvency that would further impair private credit necessary
to fuel the recovery; worse-than-anticipated growth impacts from private-
sector deleveraging; worse-than-anticipated drag from sustained and
concurrent fiscal consolidation; a spike in energy prices from already
elevated levels; and more generally risks from political turmoil, conflict or
natural disaster. Any or a combination of these factors could tip countries
back into recession or lead to stagnation (OECD, 2011a). Policies that could
help reduce some of these risks are discussed in Chapter 1.
Policies play an importantrole in the baseline scenario
Structural and fiscal policies play an important role in the scenarios
presented here. The projection framework takes into account the effect of
labour market policies on developments in unemployment and labour
force participation, the effect of product market and trade regulations on
innovation and technological diffusion, as well as the effect of fiscal
consolidation and enhanced welfare policies in emerging economies on
Box 4.2. Assumptions in the baseline long-term economic scenario (cont.)
Assumptions regarding structural policies are as follows:
l The share of active life in life expectancy is assumed to remain constant, hence the legal pensionable ageis implicitly assumed to be indexed to longevity. In addition, recently-legislated pension reforms thatinvolve an increase in the normal retirement age by 2020 are assumed to be implemented as planned,which lowers exit rates for the 50-to-64 age group in the countries concerned according to estimatedelasticities and thus raises overall participation rates.1 On average, these reforms raise total labour forceparticipation in 2050 by 0.7 percentage points.
l Structural unemployment in OECD countries gradually returns to the lowest value estimatedbetween 2007 and 2013. Unemployment in non-OECD countries where the level is currently above theOECD average is assumed to gradually converge to the average level of unemployment in OECDcountries, while it remains unchanged in countries currently below the OECD average.
l The long-term trend increase in average years of schooling per worker (the proxy that represents humancapital) is assumed to continue in all countries, which has two countervailing effects on aggregate labourforce participation. On the one hand, a longer schooling period lowers the labour force entry rate ofyoung cohorts. On the other hand, educated workers are more likely to enter the labour force once theyhave completed their education and possibly less likely to exit the labour force at older age. Due to theseoffsetting forces, the projected increase in educational attainment only moderately raises labour forceparticipation – on average by 0.5 percentage points in 2050, although the effect is noticeably larger insome countries (e.g. Turkey, Mexico, Korea, Italy and Hungary).
l Countries with relatively stringent product market and trade regulations are assumed to graduallyconverge towards the average regulatory stance observed in OECD countries in 2011. For other countriesregulations remain unchanged. This implies faster MFP growth in countries where the regulatory stanceis currently more stringent than the OECD average.
l For non-OECD countries, a gradual increase in public spending on social protection is assumed,amounting on average to an increase of four percentage points of GDP to a level of provision similar tothe average OECD country. It is further assumed that this is financed in a way in which there is no effecton public saving.
1. Countries for which adjustments to the exit rates of older workers are made on the basis of recently-legislated pension reformsinclude Australia, Belgium, Canada, the Czech Republic, Germany, Spain, Estonia, France, the United Kingdom, Greece,Hungary, Ireland, Israel, Italy, Japan, New Zealand, the Slovak Republic, Slovenia, Turkey and the United States.

4. MEDIUM AND LONG-TERM SCENARIOS FOR GLOBAL GROWTH AND IMBALANCES
OECD ECONOMIC OUTLOOK, VOLUME 2012/1 © OECD 2012 – PRELIMINARY VERSION 199
saving, global imbalances, indebtedness and capital accumulation via
changes in the cost of capital. Over a time horizon covering several decades,
these structural conditions and policies are likely to evolve, and so the
baseline scenario incorporates a number of policy developments seen as
probable in several areas (Box 4.2).4 While these policy changes are, in some
respects, significant and perhaps even ambitious, there remains
considerable scope for further fiscal consolidation and structural reforms
over the projection period to improve trend growth and reduce the build-up
of macroeconomic imbalances, as explored in variant scenarios.
The crisis had permanentadverse effects on the level
of potential output
Another optimistic assumption that underlies the scenarios presented
here is that the crisis has only reduced the level of potential output and has
had no permanent adverse effect on its growth rate. Compared with pre-
crisis projections, the level of aggregate OECD potential output, both
currently and over the next few years, has been revised downwards by
about 2½ per cent.5, 6 Underlying the loss are permanent reductions in
capital endowment as firms have adjusted to the end of cheap financing
and increases in the number of people becoming detached from the labour
force as long-duration cyclical unemployment has evolved into structural
unemployment. Some of the smaller countries, including Greece and
Ireland, experienced losses exceeding 10% of potential output relative to
pre-crisis projections, the difference vis-à-vis the OECD as a whole being
attributable mainly to much larger negative hysteresis effects due to very
large and sustained negative output gaps. Because even very large output
gaps are assumed to close fairly quickly, the possibility of large negative
output gaps persisting for several years, with hysteresis-type effects
continuing to drag down the level of potential output, is thus a downside
risk to the scenarios presented here.
OECD potential growthrates moderate over the
long term mainly fordemographic reasons
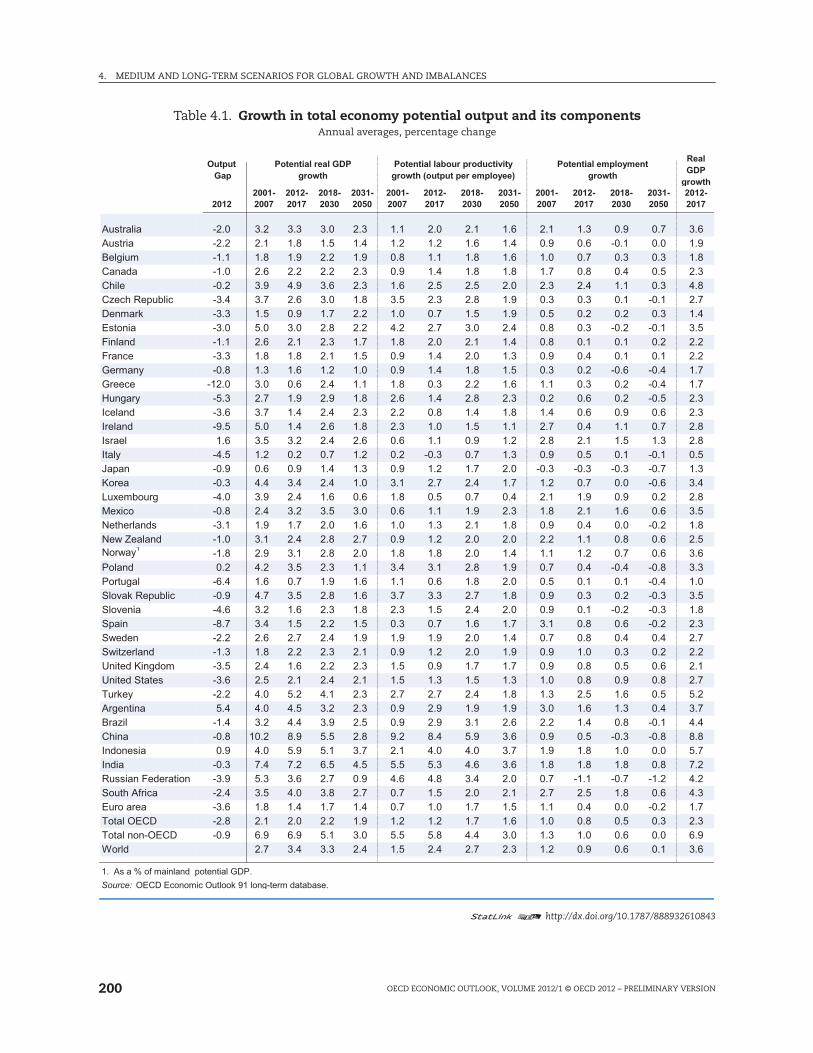
From 2013 onwards the growth rate of OECD-wide potential output
recovers from the immediate post-crisis slowdown to average 2¼ per cent
per annum over the period 2018-30 and beyond that 2% to 2050 (Table 4.1).
The moderation of OECD potential growth over the long term is due to
demographic factors, particularly ageing, as the population of working age
and aggregate participation rates grow more slowly. The slowdown in the
potential growth of non-OECD countries is much more marked, particularly
because, in addition to the demographic effects, productivity growth slows
as their economies catch up with the technology frontier and gaps in
human capital, represented by years of schooling, begin to close.
4. Baseline projections for euro area countries receiving assistance from theEuropean Union and IMF (e.g. Greece) do not take into account the impact ofstructural reforms announced in the recent programmes, which could altergrowth prospects and fiscal positions for these countries.
5. Studies of the effect of past financial crises on GDP tend to find considerableheterogeneity in responses across different countries, with an important factorbeing how policy responds to the crisis, see for example Haugh et al. (2009).
6. While the downward revision may appear small, even prior to the crisispotential output growth was projected to fall significantly in most OECDcountries on account of demographic changes.
4. MEDIUM AND LONG-TERM SCENARIOS FOR GLOBAL GROWTH AND IMBALANCES
OECD ECONOMIC OUTLOOK, VOLUME 2012/1 © OECD 2012 – PRELIMINARY VERSION200
Table 4.1. Growth in total economy potential output and its componentsAnnual averages, percentage change
1 2 http://dx.doi.org/10.1787/888932610843
Output
Gap
Potential real GDP
growth
Potential labour productivity
growth (output per employee)
Potential employment
growth
Real
GDP
growth
2001- 2012- 2018- 2031- 2001- 2012- 2018- 2031- 2001- 2012- 2018- 2031- 2012-
2012 2007 2017 2030 2050 2007 2017 2030 2050 2007 2017 2030 2050 2017
Australia -2.0 3.2 3.3 3.0 2.3 1.1 2.0 2.1 1.6 2.1 1.3 0.9 0.7 3.6
Austria -2.2 2.1 1.8 1.5 1.4 1.2 1.2 1.6 1.4 0.9 0.6 -0.1 0.0 1.9
Belgium -1.1 1.8 1.9 2.2 1.9 0.8 1.1 1.8 1.6 1.0 0.7 0.3 0.3 1.8
Canada -1.0 2.6 2.2 2.2 2.3 0.9 1.4 1.8 1.8 1.7 0.8 0.4 0.5 2.3
Chile -0.2 3.9 4.9 3.6 2.3 1.6 2.5 2.5 2.0 2.3 2.4 1.1 0.3 4.8
Czech Republic -3.4 3.7 2.6 3.0 1.8 3.5 2.3 2.8 1.9 0.3 0.3 0.1 -0.1 2.7
Denmark -3.3 1.5 0.9 1.7 2.2 1.0 0.7 1.5 1.9 0.5 0.2 0.2 0.3 1.4
Estonia -3.0 5.0 3.0 2.8 2.2 4.2 2.7 3.0 2.4 0.8 0.3 -0.2 -0.1 3.5
Finland -1.1 2.6 2.1 2.3 1.7 1.8 2.0 2.1 1.4 0.8 0.1 0.1 0.2 2.2
France -3.3 1.8 1.8 2.1 1.5 0.9 1.4 2.0 1.3 0.9 0.4 0.1 0.1 2.2
Germany -0.8 1.3 1.6 1.2 1.0 0.9 1.4 1.8 1.5 0.3 0.2 -0.6 -0.4 1.7
Greece -12.0 3.0 0.6 2.4 1.1 1.8 0.3 2.2 1.6 1.1 0.3 0.2 -0.4 1.7
Hungary -5.3 2.7 1.9 2.9 1.8 2.6 1.4 2.8 2.3 0.2 0.6 0.2 -0.5 2.3
Iceland -3.6 3.7 1.4 2.4 2.3 2.2 0.8 1.4 1.8 1.4 0.6 0.9 0.6 2.3
Ireland -9.5 5.0 1.4 2.6 1.8 2.3 1.0 1.5 1.1 2.7 0.4 1.1 0.7 2.8
Israel 1.6 3.5 3.2 2.4 2.6 0.6 1.1 0.9 1.2 2.8 2.1 1.5 1.3 2.8
Italy -4.5 1.2 0.2 0.7 1.2 0.2 -0.3 0.7 1.3 0.9 0.5 0.1 -0.1 0.5
Japan -0.9 0.6 0.9 1.4 1.3 0.9 1.2 1.7 2.0 -0.3 -0.3 -0.3 -0.7 1.3
Korea -0.3 4.4 3.4 2.4 1.0 3.1 2.7 2.4 1.7 1.2 0.7 0.0 -0.6 3.4
Luxembourg -4.0 3.9 2.4 1.6 0.6 1.8 0.5 0.7 0.4 2.1 1.9 0.9 0.2 2.8
Mexico -0.8 2.4 3.2 3.5 3.0 0.6 1.1 1.9 2.3 1.8 2.1 1.6 0.6 3.5
Netherlands -3.1 1.9 1.7 2.0 1.6 1.0 1.3 2.1 1.8 0.9 0.4 0.0 -0.2 1.8
New Zealand -1.0 3.1 2.4 2.8 2.7 0.9 1.2 2.0 2.0 2.2 1.1 0.8 0.6 2.5
Norway1
-1.8 2.9 3.1 2.8 2.0 1.8 1.8 2.0 1.4 1.1 1.2 0.7 0.6 3.6
Poland 0.2 4.2 3.5 2.3 1.1 3.4 3.1 2.8 1.9 0.7 0.4 -0.4 -0.8 3.3
Portugal -6.4 1.6 0.7 1.9 1.6 1.1 0.6 1.8 2.0 0.5 0.1 0.1 -0.4 1.0
Slovak Republic -0.9 4.7 3.5 2.8 1.6 3.7 3.3 2.7 1.8 0.9 0.3 0.2 -0.3 3.5
Slovenia -4.6 3.2 1.6 2.3 1.8 2.3 1.5 2.4 2.0 0.9 0.1 -0.2 -0.3 1.8
Spain -8.7 3.4 1.5 2.2 1.5 0.3 0.7 1.6 1.7 3.1 0.8 0.6 -0.2 2.3
Sweden -2.2 2.6 2.7 2.4 1.9 1.9 1.9 2.0 1.4 0.7 0.8 0.4 0.4 2.7
Switzerland -1.3 1.8 2.2 2.3 2.1 0.9 1.2 2.0 1.9 0.9 1.0 0.3 0.2 2.2
United Kingdom -3.5 2.4 1.6 2.2 2.3 1.5 0.9 1.7 1.7 0.9 0.8 0.5 0.6 2.1
United States -3.6 2.5 2.1 2.4 2.1 1.5 1.3 1.5 1.3 1.0 0.8 0.9 0.8 2.7
Turkey -2.2 4.0 5.2 4.1 2.3 2.7 2.7 2.4 1.8 1.3 2.5 1.6 0.5 5.2
Argentina 5.4 4.0 4.5 3.2 2.3 0.9 2.9 1.9 1.9 3.0 1.6 1.3 0.4 3.7
Brazil -1.4 3.2 4.4 3.9 2.5 0.9 2.9 3.1 2.6 2.2 1.4 0.8 -0.1 4.4
China -0.8 10.2 8.9 5.5 2.8 9.2 8.4 5.9 3.6 0.9 0.5 -0.3 -0.8 8.8
Indonesia 0.9 4.0 5.9 5.1 3.7 2.1 4.0 4.0 3.7 1.9 1.8 1.0 0.0 5.7
India -0.3 7.4 7.2 6.5 4.5 5.5 5.3 4.6 3.6 1.8 1.8 1.8 0.8 7.2
Russian Federation -3.9 5.3 3.6 2.7 0.9 4.6 4.8 3.4 2.0 0.7 -1.1 -0.7 -1.2 4.2
South Africa -2.4 3.5 4.0 3.8 2.7 0.7 1.5 2.0 2.1 2.7 2.5 1.8 0.6 4.3
Euro area -3.6 1.8 1.4 1.7 1.4 0.7 1.0 1.7 1.5 1.1 0.4 0.0 -0.2 1.7
Total OECD -2.8 2.1 2.0 2.2 1.9 1.2 1.2 1.7 1.6 1.0 0.8 0.5 0.3 2.3
Total non-OECD -0.9 6.9 6.9 5.1 3.0 5.5 5.8 4.4 3.0 1.3 1.0 0.6 0.0 6.9
World 2.7 3.4 3.3 2.4 1.5 2.4 2.7 2.3 1.2 0.9 0.6 0.1 3.6
1. As a % of mainland potential GDP.
Source: OECD Economic Outlook 91 long-term database.

4. MEDIUM AND LONG-TERM SCENARIOS FOR GLOBAL GROWTH AND IMBALANCES
OECD ECONOMIC OUTLOOK, VOLUME 2012/1 © OECD 2012 – PRELIMINARY VERSION 201
A higher oil price may lowergrowth but is unlikely to
disrupt the recovery
High and rising oil prices are yet another factor that may hinder
economic growth over the medium term. Sharp rises in oil and commodity
prices combined with macroeconomic policy mistakes led to stagflation in
the 1970s. By draining away funds that consumers would otherwise spend
on other things, high oil prices reduce consumption and output in the short
run (see Chapter 1). But high oil prices can affect the economy’s supply side
as well. Previous OECD estimates based on a Cobb-Douglas production
approach (OECD, 2008) suggest that over the full scenario horizon to 2050,
with assumed increases in real oil prices amounting to more than 125%, the
level of potential GDP in 2050 could be reduced by 1.2% to 3.2% depending
on the country.7 On the other hand, this does not account for attendant
revenues accruing to oil-producing countries being recycled into safe
government securities in major OECD countries, resulting in lower long-
term interest rates that may boost growth.
Fiscal imbalances will build up without stronger policy action
The baseline scenariosuggests a build up of
imbalances
Over a horizon to 2030, the period of focus in this and the next
sections of the chapter, the baseline scenario shows a build-up of a
number of major macroeconomic imbalances including: high and
widespread government indebtedness; rising global current account
imbalances; and upward pressures on interest rates (Table 4.2). These
imbalances should be viewed as identifying future tensions which will
need to be addressed by policy rather than most likely outcomes, not only
because projections made over several decades are inevitably subject to
huge uncertainty, but also because no specific policy or endogenous
economic response to these tensions is built into the baseline.
Government indebtednesswill be high and
widespread among OECDcountries
Fiscal consolidation is planned in almost all OECD countries in 2012
and 2013. Nonetheless, fiscal deficits are projected to remain large in 2013
(see Chapter 1) and with a substantial component that is not explained by
the cycle. In the absence of further action, debt would remain on an
increasing trajectory in about a third of OECD countries, so some fiscal
consolidation (at least 1 percentage point of GDP) needs to continue
after 2013 just to stabilise debt-to-GDP ratios (Table 4.3). Here it is
assumed to follow a stylised rule whereby, beyond the improvement
which results from the operation of the automatic stabilisers as output
gaps close, underlying primary balances improve in a gradual manner
which is just sufficient to stabilise gross debt-to-GDP ratios (Box 4.2).8 The
7. These estimates are likely to exaggerate the long-run costs of higher energyprices because they assume fixed factor shares and do not allow for changes intechnology in response to changing relative factor prices.
8. Actual fiscal consolidation requirements are typically larger than implied by thisrule because fiscal consolidation would also be required to offset the fiscalimplications of ageing populations that are not explicitly incorporated in theframework. On the basis of unchanged policies, public spending on pensions for atypical OECD country could increase by about 3 percentage points of GDP by 2050(OECD, 2011b) and even under optimistic assumptions about “cost containment”spending on health and long-term care could increase by 3-4 percentage points ofGDP to 2050 (Oliveira Martins and de la Maisonneuve, 2006).

4. MEDIUM AND LONG-TERM SCENARIOS FOR GLOBAL GROWTH AND IMBALANCES
OECD ECONOMIC OUTLOOK, VOLUME 2012/1 © OECD 2012 – PRELIMINARY VERSION202
Table 4.2. Summary of the baseline long-term scenarioAs percentage of GDP (unless otherwise specified)
1 2 http://dx.doi.org/10.1787/888932610862
Average
2000-072010 2013 2020 2025 2030
Potential real GDP growth (%) 2.6 1.7 2.1 2.3 2.4 2.4
Fiscal balance -2.6 -10.7 -6.5 -4.1 -4.1 -4.1
Gross government debt 62 98 111 115 116 116
Real Interest rates (%) 2.4 1.7 1.4 3.3 3.5 3.5
Total national savings 14.7 12.5 12.7 11.6 10.7 9.9
Total investment 19.7 15.8 17.0 16.6 16.7 16.5
Current balance -4.9 -3.2 -4.3 -4.9 -5.9 -6.6
Potential real GDP growth (%) 0.7 0.6 0.8 1.3 1.4 1.4
Fiscal balance -5.4 -8.4 -10.1 -6.9 -4.7 -4.6
Gross government debt 157 193 223 257 263 264
Real Interest rates (%) 2.7 2.4 3.0 2.9 3.3 3.3
Total national savings 26.4 23.2 22.8 22.3 23.1 22.5
Total investment 23.1 19.8 21.0 22.7 23.8 23.8
Current balance 3.3 3.6 1.9 -0.3 -0.6 -1.1
Potential real GDP growth (%) 1.9 1.0 1.3 1.8 1.7 1.5
Fiscal balance -1.9 -6.2 -2.0 -2.1 -2.2 -2.1
Gross government debt 75 93 100 97 97 97
Real Interest rates (%) 2.4 2.3 3.2 2.9 2.6 2.4
Total national savings 21.6 19.4 20.5 17.4 16.2 14.8
Total investment 19.2 20.5 19.9 20.4 20.2 19.6
Current balance 0.3 0.4 1.6 -2.0 -2.9 -3.9
Potential real GDP growth (%) 2.2 1.5 1.9 2.2 2.2 2.1
Fiscal balance -2.1 -7.5 -4.2 -3.2 -3.0 -2.9
Gross government debt 74 99 109 116 117 116
Real Interest rates (%) 2.5 1.9 2.2 3.1 3.1 3.0
Total national savings 19.8 18.0 18.8 17.3 16.6 15.6
Total investment 21.0 18.6 19.5 19.2 20.1 18.6
Current balance -1.2 -0.6 -0.9 -2.2 -2.7 -3.3
China
Potential real GDP growth (%) 10.0 10.2 9.5 6.8 5.1 4.0
Total national savings 44 6 51 8 50 1 42 9 38 3 33 2
United States
Japan
Euro Area
OECD Total
Total national savings 44.6 51.8 50.1 42.9 38.3 33.2
Total investment 40.1 47.8 48.3 38.8 32.1 27.7
Current balance 4.6 4.0 1.7 4.1 6.2 5.5
India
Potential real GDP growth (%) 7.4 7.8 7.3 6.9 6.4 5.9
Total national savings 29.6 31.8 28.3 26.1 24.5 22.8
Total investment 29.1 34.3 31.2 30.4 29.1 27.5
Current balance 0.0 -3.2 -2.9 -4.2 -4.6 -4.7
Brazil
Potential real GDP growth (%) 3.1 4.2 4.5 4.1 3.9 3.6
Total national savings 16.1 17.5 16.7 16.5 15.8 14.7
Total investment 17.1 20.2 19.9 19.1 18.4 17.4
Current balance 0.7 -2.2 -3.2 -2.6 -2.6 -2.7
Potential real GDP growth (%)
OECD 2.2 1.5 1.9 2.2 2.2 2.1
non-OECD 6.8 7.5 7.3 5.8 4.8 4.1
World 2.8 2.7 3.4 3.5 3.2 3.0
Source: OECD Economic Outlook 91 long-term database.

4. MEDIUM AND LONG-TERM SCENARIOS FOR GLOBAL GROWTH AND IMBALANCES
OECD ECONOMIC OUTLOOK, VOLUME 2012/1 © OECD 2012 – PRELIMINARY VERSION 203
stylised rule provides a common metric against which to assess the need
for further consolidation, although it should be recognised that this
assumption may contradict current government plans and is not
necessarily consistent with national or supra-national fiscal objectives,
Table 4.3. Fiscal trends with debt stabilisationAs percentage of nominal GDP
1 2 http://dx.doi.org/10.1787/888932610881
Underlying
fiscal
balance
Average consolidation to
stabilise debt from:1
Financial
balances2
Net financial
liabilities3
Gross financial
liabilities4
2011 2011 2013 2011 2020 2030 2011 2020 2030 2011 2020 2030
Australia -3.5 3.7 -1.0 -3.9 -0.4 -0.3 5 6 6 27 27 28
Austria -2.0 0.8 -0.4 -2.6 -1.8 -1.7 46 48 49 80 84 84
Belgium -3.9 1.2 -1.2 -3.9 -3.5 -3.2 82 81 82 102 101 102
Canada -4.1 2.4 0.9 -4.5 -1.8 -1.7 33 39 39 84 84 85
Czech Republic -3.0 3.2 1.0 -3.1 -0.8 -0.6 8 13 14 48 54 54
Denmark 0.1 -0.2 0.2 -1.9 -0.3 -0.4 4 9 9 62 64 65
Estonia 0.0 1.3 0.9 1.0 1.4 1.0 -33 -26 -26 10 15 15
Finland -0.7 2.8 2.1 -0.9 2.0 1.7 -53 -47 -46 57 65 66
France -4.0 2.6 -0.1 -5.2 -2.9 -2.6 63 66 67 100 106 107
Germany -1.0 -0.3 -0.4 -1.0 -1.8 -1.5 52 50 51 87 88 89
Greece -5.8 6.9 2.2 -9.2 -6.7 -5.2 135 145 143 170 177 175
Hungary -4.7 3.2 -1.3 4.2 -3.1 -2.8 52 52 52 85 82 83
Iceland -1.4 1.6 -0.1 -4.4 -2.2 -2.4 50 47 47 128 125 126
Ireland -5.2 4.3 0.6 -13.0 -3.9 -4.0 74 89 89 114 129 129
Israel -5.3 1.3 0.8 -4.4 -3.0 -3.1 67 71 70 74 77 76
Italy -3.1 2.3 -2.5 -3.8 -1.6 -2.4 94 84 83 120 110 110
Japan6
-8.8 8.9 9.3 -9.5 -6.9 -4.6 126 177 184 205 257 264
Korea 1.2 0.9 0.1 1.8 2.1 1.8 -37 -38 -38 35 34 34
Luxembourg 0.5 1.3 1.1 -0.6 1.8 1.2 -48 -41 -41 24 31 31
Netherlands -3.9 2.9 0.1 -4.6 -1.9 -1.8 39 45 45 75 83 84
New Zealand -4.6 3.8 1.9 -8.2 -1.0 -1.1 11 21 22 44 54 55
Poland -5.5 4.2 0.5 -5.1 -1.9 -1.5 33 36 36 63 64 64
Portugal -5.7 5.9 0.9 -4.2 -3.1 -3.3 74 85 84 118 130 129
Slovak Republic -5.4 4.0 1.1 -4.8 -1.7 -1.4 27 32 33 47 55 56
Slovenia -4.2 4.2 0.4 -6.4 -0.6 -0.6 7 15 15 56 64 64
Spain -5.2 5.0 -2.1 -8.5 -1.4 -2.0 49 48 48 75 82 81
Sweden 0.4 1.0 0.2 0.1 0.8 0.7 -21 -19 -18 49 47 47
Switzerland 0.6 0.0 -0.2 0.8 0.1 0.1 -3 -4 -4 41 39 40
United Kingdom -7.0 4.5 2.5 -8.4 -3.5 -3.6 68 84 85 98 113 114
United States -7 7 5 1 3 0 -9 7 -4 1 -4 1 80 92 93 103 115 116United States 7.7 5.1 3.0 9.7 4.1 4.1 80 92 93 103 115 116
Euro Area -3.1 2.1 -0.7 -4.1 -2.1 -2.1 61 60 60 95 97 97
OECD -5.5 3.9 2.0 -6.3 -3.2 -2.9 65 79 79 103 116 116
Note: These fiscal projections are the consequence of applying a stylised fiscal consolidation path and should not be interpreted as a forecast.
1. The average improvement in the underlying primary balance to 2030 (or 2040 for Japan) required to stabilise the gross government debt-to-GDP ratio, assuming consolidation in 2012-13 is consistent with the short-term projections described in Chapters 1 and 2 and thereafter amounts to ½ percent of GDP
per annum (1 percent of GDP in Japan).
2. General government fiscal surplus (+) or deficit (-) as a percentage of GDP.
3. Includes all financial liabilities minus financial assets as defined by the system of national accounts (where data availability permits) and covers the general
government sector, which is a consolidation of central, state and local governments and the social security sector.
4. Includes all financial liabilities as defined by the system of national accounts (where data availability permits) and covers the general government sector,
which is a consolidation of central, state and local governments and the social security sector. The definition of gross debt differs from the Maastricht
definition used to assess EU fiscal positions.
5. Interest rate on 10-year government bonds.
6. Japan requires more consolidation from 2013 than from 2011 because given its high debt level, projected improvements in the underlying primary balance
in 2012 and 2013 reduce future deficits less than the future cost of servicing the extra debt accumulated in these two years.
Source: OECD Economic Outlook 91 long-term database.

4. MEDIUM AND LONG-TERM SCENARIOS FOR GLOBAL GROWTH AND IMBALANCES
OECD ECONOMIC OUTLOOK, VOLUME 2012/1 © OECD 2012 – PRELIMINARY VERSION204
targets or rules. Japan and the United States are the countries requiring the
most consolidation beyond 2013 with, respectively, an extra 13 and
4 percentage points of GDP in budget restraint by 2030 to stabilise debt
burdens.9 In Italy and Spain, the substantial fiscal consolidation projected
for 2012 and 2013 should be more than sufficient to stabilise debt ratios,
and in Greece, Ireland and Portugal the additional 2, ½ and 1 percentage
points of GDP of consolidation, respectively, which would be required
beyond 2013 appears modest against the planned tightening over 2012-13.
Nevertheless, government indebtedness increases substantially relative to
pre-crisis levels (Table 4.3). The OECD government debt-to-GDP ratio
increases from a pre-crisis level of 74% to stabilise at some 115-120% of GDP.
Rising government debtposes a risk to the growth
outlook
In many OECD countries, government debt-to-GDP ratios are
projected to increase well above levels at which a growing empirical
literature suggests adverse effects on interest rates and growth.10
Applying estimates from this literature in a crude ready-reckoner fashion
to compute the effect of the recent and projected build-up of government
debt leads to rather alarming conclusions: if applied to the baseline
projections described above for the OECD area as whole, the estimates
imply a loss in the trend GDP growth rate of ½-¾ percentage point. The
transmission mechanism by which negative growth effects occur is likely
to involve higher interest rates and a crowding out of private investment
and R&D, with adverse consequences for trend productivity growth. In the
scenarios presented here, they arise only via the effect of higher real
interest rates, which occur both at the country level from higher fiscal risk
premia and at the global level to the extent that fiscal imbalances
contribute to an ex ante shortage of global savings and so push up interest
rates everywhere. Higher interest rates in turn lower capital investment
and thus potential output. Many OECD countries would appear vulnerable
to these effects, with the gross debt-to-GDP ratio projected to stabilise at
above 75% in more than half of all OECD countries, and above 90% in
nearly one-third of OECD countries.
Higher interest rates andlower growth aggravate
debt dynamics
Together with the primary fiscal balance, interest rates and growth
are the main determinants of public debt dynamics. Higher nominal GDP
growth reduces the debt-to-GDP ratio (simply by virtue of increasing the
9. The consolidation requirements reported here are higher than the ’average’figure reported in Table 4.3 because for Japan and the United States theprotracted period of adjustment implies that the average increase in theprimary balance over 2013-30 is smaller than the final increase between 2013and 2030.
10. Reinhart and Rogoff (2010) find that GDP growth rate in advanced economiesfalls by one percentage point when gross public debt reaches 90% of GDP;Kumar and Woo (2010) find that each 10 percentage point increase in the grossdebt-to-GDP ratio is associated with a slowdown in annual real per-capita GDPgrowth of about 0.15-0.2 percentage points per year for advanced economies,the effect being larger when debt goes above 90% of GDP; Cecchetti et al. (2011)find that government debt can be a drag on growth beyond a threshold of 85%of GDP (2010); whereas Elmeskov and Sutherland (2012) find even lower debtthresholds, of around 40% and 70% of GDP.

4. MEDIUM AND LONG-TERM SCENARIOS FOR GLOBAL GROWTH AND IMBALANCES
OECD ECONOMIC OUTLOOK, VOLUME 2012/1 © OECD 2012 – PRELIMINARY VERSION 205
denominator), while higher interest rates raise it by increasing debt
service. During the years prior to the crisis, this differential between
interest rates on government bonds and nominal potential growth rates
was unusually favourable to restraining the endogenous snowballing of
debt. It was negative for many OECD economies, compared with an
average positive differential of over 200 basis points over the 1980s
and 1990s (Turner and Spinelli, 2011). With potential output growth
generally projected to decline relative to the pre-crisis period and interest
rates to rise as financial conditions and policy rates normalise, the
interest rate-growth differential is expected to increase rapidly and soon
be positive across the OECD, thereby worsening debt dynamics.
Japan’s situation looksparticularly daunting
Japan’s fiscal situation appears particularly challenging. Not only is it
projected to have the highest gross debt ratio in the OECD in 2013 at 223%
of GDP, but at 9% of GDP in 2013, its structural deficit is such that, according
to the stylised fiscal rule used in the baseline scenario, it would need
13 percentage points of GDP of fiscal consolidation before the debt ratio
would stabilise. And it would do so at the extreme level of more than 260%
of GDP. Moreover, because Japan has seen a substantial increase in
indebtedness over the past two decades with little effect so far on interest
rates, it is treated as an exception in the baseline scenario by assuming that
the magnitude of its fiscal risk premium, in terms of the increase in interest
rates per percentage point of public debt ratio beyond certain thresholds, is
only one-quarter that of other OECD countries. One reason why the risk
premium may be low in Japan is the high proportion of government debt
which is financed from domestic sources. This has been possible thanks to
a high private saving rate, to a stable domestic institutional investor base
and to a current account that has been in surplus since the early 1980s, so
that for the past three decades Japan has not had to rely on external sources
to finance its government deficits. However, in the baseline scenario,
Japan’s current account is expected to move into deficit by the late 2010s,
mostly because of a decline in the private saving rate due to population
ageing. When this occurs, and the government needs to seek foreign
sources of financing, foreigners may well ask for a more “normal” fiscal risk
premium, which could quickly generate an unsustainable and unstable
situation. Set against these arguments, Japanese government financial
assets are particularly high in international comparison.
On a net debt measure thesituation looks less
worrisome in some countries
The evolution of government indebtedness is presented here using
the gross government debt concept, but net debt (net of financial assets
held by government) is another measure that is sometimes used. Both
concepts are useful. Gross debt is preferable when looking at the
borrowing needs of governments as it is a good approximation of the debt
that must be financed on the markets. When looking at debt burdens and
long-term sustainability, however, the net debt measure is conceptually
preferable as it represents the amount of debt that would remain if the
government were to liquidate all the financial assets it holds, although
government assets may not always easily be used to offset liabilities. The

4. MEDIUM AND LONG-TERM SCENARIOS FOR GLOBAL GROWTH AND IMBALANCES
OECD ECONOMIC OUTLOOK, VOLUME 2012/1 © OECD 2012 – PRELIMINARY VERSION206
gap between gross and net debt is particularly large for Norway (gross debt
of 49% of GDP in 2009 against a net debt of –157%), Japan (189% vs 106%),
Sweden (52% vs –22%) and Canada (82% vs 28%).11 The more practical
reason to focus on gross debt is that it is more comparable across
countries because data on financial assets are of unequal quality.
Requirements to put public indebtedness on a lower path
Many OECD countriesrequire consolidation just to
stabilise debt ratios
In many countries, including Japan and the United States, following
the fiscal consolidation rule assumed in the baseline scenario would
stabilise debt ratios, but at very high levels which are neither desirable nor
likely to prove sustainable. Fiscal consolidation needs to be more
ambitious if the aim is to reduce debt-to-GDP ratios to sustainable levels
rather than merely stabilise them. Lower debt ratios would avoid the high
interest rates associated with high public debt undermining economic
growth and provide a safety margin for public finances to tackle future
shocks.
Reducing debt ratios to 60%would require greater
consolidation
In an alternative scenario, OECD countries are assumed to undertake
deeper fiscal consolidation, improving their fiscal balance by up to
1 percentage point of GDP each year (1.5 percentage point in the case of
Greece, Ireland, Italy, Portugal, United States, United Kingdom and Japan)
and targeting a gross debt ratio of 60%, unless the debt ratio is already
projected to be lower than 60% in 2013 in which case the 2013 ratio is
maintained (Table 4.4, Figure 4.1).12 While in the baseline scenario where
debt is stabilised, total required consolidation depends mostly on the size
of the underlying primary balance projected for 2013, here it also depends
importantly on the debt ratio in 2013. Countries such as Greece, Ireland
and Portugal, where the planned consolidation in 2012 and 2013 was
almost enough to stabilise debt but at a high level, require further
substantial consolidation to get it down to 60%. Other countries requiring
very substantial consolidation beyond 2013 to meet a 60% debt ratio target
are the United States (average consolidation of nearly 6 percentage points
11. At the same time, some governments hold financial assets in special accountsthat are meant to “pre-fund” future liabilities such as pension promises (e.g. USSocial Security Trust Fund). And while they may recognise the financial assetson their books, they do not always recognise the corresponding long-termliability. Netting out financial assets against a gross debt concept that does notrecognise the present value of the corresponding long-term liabilities couldthus distort the picture of a government’s fiscal health. The issue of includingin government liabilities the present value of pension, health and other servicespromised is a separate one, however.
12. Gradual fiscal consolidation paths consistent with debt stabilisation at thetarget are obtained using a fiscal rule derived by Rawdanowicz (2012). The fiscalrule accounts for the current gross debt-to-GDP ratio, its target, the current levelof government assets, the current fiscal balance, nominal GDP growth relativeto potential in the current year as well as projected nominal GDP growth10 years ahead (the rule is forward-looking). There is also a parameter toaccount for the size of automatic stabilisers. In years where the rule would callfor fiscal consolidation greater than a certain cap (here 1% of GDP) the cap isapplied instead.

4. MEDIUM AND LONG-TERM SCENARIOS FOR GLOBAL GROWTH AND IMBALANCES
OECD ECONOMIC OUTLOOK, VOLUME 2012/1 © OECD 2012 – PRELIMINARY VERSION 207
Table 4.4. Fiscal trends in the baseline scenario with debt targetingAs percentage of nominal GDP
1 2 http://dx.doi.org/10.1787/888932610900
Underlying
fiscal balanceFinancial
balances2
Net financial
liabilities3
Gross financial
liabilities4
2011 2011 2013 2011 2020 2030 2011 2020 2030 2011 2020 2030
Australia -3.5 3.7 -1.0 -3.9 -0.6 -0.4 5 7 7 27 28 29
Austria -2.0 2.0 1.0 -2.6 0.8 -0.6 46 34 25 80 70 61
Belgium -3.9 3.2 1.0 -3.9 1.1 -1.3 82 56 41 102 76 61
Canada -4.1 3.7 2.4 -4.5 0.9 -0.4 33 24 15 84 69 61
Czech Republic -3.0 3.4 1.3 -3.1 -0.4 -0.5 8 13 12 48 53 52
Denmark 0.1 0.2 0.6 -1.9 0.3 -0.1 4 7 5 62 63 60
Estonia 0.0 1.2 0.9 1.0 1.0 1.0 -33 -23 -23 10 18 18
Finland -0.7 3.6 2.9 -0.9 2.7 2.1 -53 -50 -52 57 62 60
France -4.0 4.9 2.4 -5.2 2.6 -0.2 63 45 22 100 84 62
Germany -1.0 1.1 1.1 -1.0 1.0 -0.5 52 31 23 87 69 61
Greece -5.8 9.6 5.2 -9.2 5.6 0.3 135 92 34 170 123 65
Hungary -4.7 4.2 -0.1 4.2 -0.3 -1.5 52 38 30 85 68 60
Iceland -1.4 4.8 3.4 -4.4 5.2 1.8 50 17 -16 128 95 63
Ireland -5.2 7.4 4.1 -13.0 2.9 0.4 74 71 25 114 111 65
Israel -5.3 2.0 1.6 -4.4 -1.4 -2.3 67 60 54 74 65 60
Italy -3.1 4.1 -0.5 -3.8 3.5 -0.4 94 57 35 120 84 62
Japan6
-8.8 14.1 15.0 -9.5 0.4 10.8 126 148 41 205 228 121
Korea 1.2 1.2 0.5 1.8 2.2 1.8 -37 -38 -38 35 33 34
Luxembourg 0.5 1.5 1.3 -0.6 1.7 1.1 -48 -38 -39 24 34 33
Netherlands -3.9 4.1 1.5 -4.6 0.9 -0.6 39 33 23 75 71 61
New Zealand -4.6 4.1 2.2 -8.2 -0.6 -0.8 11 19 17 44 52 50
Poland -5.5 4.4 0.8 -5.1 -1.6 -1.3 33 33 32 63 61 60
Portugal -5.7 8.6 3.9 -4.2 4.7 0.2 74 51 18 118 96 63
Slovak Republic -5.4 4.0 1.2 -4.8 -1.6 -1.3 27 33 32 47 55 55
Slovenia -4.2 4.6 0.8 -6.4 -0.1 -0.3 7 14 11 56 63 60
Spain -5.2 6.1 -0.9 -8.5 1.1 -0.8 49 40 28 75 74 61
Sweden 0.4 1.4 0.6 0.1 1.1 0.8 -21 -20 -21 49 46 45
Switzerland 0.6 0.1 0.0 0.8 0.1 0.2 -3 -4 -4 41 39 39
United Kingdom -7.0 7.0 5.3 -8.4 2.6 -0.5 68 62 33 98 92 63
Average
consolidation to
target 60% from:1
United States -7.7 7.6 5.8 -9.7 2.4 -0.9 80 67 39 103 90 62
Euro Area -3.1 3.8 1.2 -4.1 1.9 -0.4 61 41 24 95 78 61
OECD -5.5 6.3 4.7 -6.3 1.7 0.7 65 59 29 103 96 66
Note: These fiscal projections are the consequence of applying a stylised fiscal consolidation path and should not be interpreted as a forecast.
1. The average improvement in the underlying primary balance to 2030 (2040 for Japan) required to reach a target gross debt-to-GDP ratio of 60%,
assuming consolidation in 2012-13 is consistent with the short-term projections described in Chapters 1 and 2 and thereafter amounts to 1 per cent
of GDP per annum (1.5 percentage points in the case of Greece, Ireland, Italy, Portugal, United States, United Kingdon and Japan). Some countries have
not quite achieved the 60% debt target by 2030, but with the exception of Japan, it is close enough that it is achieved within a few years after 2030 with
little further consolidation. Countries with a projected debt ratio lower than 60% in 2013 are assumed to target their 2013 debt ratio.
2. General government fiscal surplus (+) or deficit (-) as a percentage of GDP.
3. Includes all financial liabilities minus financial assets as defined by the system of national accounts (where data availability permits) and covers the general
government sector, which is a consolidation of central, state and local governments and the social security sector.
4. Includes all financial liabilities as defined by the system of national accounts (where data availability permits) and covers the general government sector,
which is a consolidation of central, state and local governments and the social security sector. The definition of gross debt differs from the Maastricht
definition used to assess EU fiscal positions.
5. Interest rate on 10-year government bonds.
6. Japan requires more consolidation from 2013 than from 2011 because, given its high debt level, projected improvements in the underlying primary balance
in 2012 and 2013 reduce future deficits less than the future cost of servicing the extra debt accumulated in these two years.
Source: OECD Economic Outlook 91 long-term database.

4. MEDIUM AND LONG-TERM SCENARIOS FOR GLOBAL GROWTH AND IMBALANCES
OECD ECONOMIC OUTLOOK, VOLUME 2012/1 © OECD 2012 – PRELIMINARY VERSION208
of GDP), the United Kingdom (5 percentage points) and Japan
(15 percentage points).13 Average gross government debt in the OECD is
lower by about 50 percentage points of GDP by 2030. Not only does OECD-
wide public indebtedness go down substantially, but, perhaps more
importantly, the number of OECD countries with debt ratios in excess of
100% in 2013 declines from ten to only one (Japan) by 2030.
Sustained fiscalconsolidation would lower
interest rates and boostgrowth…
As the recovery becomes established, sustaining OECD-wide fiscal
consolidation has two distinct effects on interest rates: firstly, lower
government indebtedness lowers a country’s fiscal risk premium;
secondly, it increases global savings and so puts downward pressure on
Figure 4.1. Consolidation required to meet alternative debt targetsAverage increase in the underlying primary balance from 2011 to 2030, in percentage points of GDP1
1. The bars show the average improvement in the underlying primary balance between 2011 and 2030 necessary to either stabilisegovernment debt ratios or bring them down to 60% of GDP. When simply stabilising debt ratios, the average increase in the underlyingprimary balance over this period corresponds closely to the peak increase over the same period. When targeting 60%, however, thepeak increase will be substantially higher than the average increase, but past the peak fiscal policy can be loosened and theunderlying primary balance decrease before the debt ratio stabilises at 60% of GDP. In some cases the debt target is reached onlyafter 2030.
2. In Japan’s case, the average consolidation shown would be sufficient to stabilise the debt ratio but only after 2030.
Source: OECD Economic Outlook 91 long-term database.1 2 http://dx.doi.org/10.1787/888932609304
JPN² PRT ESP IRL SVN OECD AUS CZE FIN CAN EA15 LUX ISR SWE AUT DNK
GRC USA GBR POL SVK NZL HUN NLD FRA ITA ISL EST BEL KOR CHE DEU
0
5
10
15
0
5
10
15Debt stabilisation Debt ratio to 60%
13. For these countries, lowering the debt burden down to 60% of GDP initiallyrequires substantial fiscal consolidation, but the fiscal stance can eventually beloosened so that the ratio stabilises at 60% rather than continuing to fall. Totake the United States as an example, the underlying primary balance must gofrom –3½ per cent of GDP in 2013 to as high as 5% of GDP in the early 2020s, fora total maximum consolidation effort of more than 8 percentage points of GDPover roughly a decade, but the fiscal stance can then be loosened gradually andthe underlying primary balance eventually stabilised at around ½ per cent ofGDP for the debt ratio to stabilise at 60% around the same time. Theconsolidation requirement reported in the text and in Table 4.4 corresponds tothe average increase in the underlying primary balance to 2030 (5.8 percentagepoints from 2013 in the case of the United States). Although this debt targetingrule does not generate a 60% debt ratio (or less) for all countries by 2030, withthe exception of Japan, it is close enough so that it is achieved within a fewyears.

4. MEDIUM AND LONG-TERM SCENARIOS FOR GLOBAL GROWTH AND IMBALANCES
OECD ECONOMIC OUTLOOK, VOLUME 2012/1 © OECD 2012 – PRELIMINARY VERSION 209
global interest rates (Figure 4.2). The second effect is obviously more
important when larger rather than smaller countries undertake
substantial consolidation, as is the case in this alternative scenario
because the United States, Japan, Italy, the United Kingdom and France
are among the countries with the highest levels of debt in the baseline.
Overall, by 2030 the average OECD long-term real interest rate is about
90 basis points lower in this alternative scenario than in the baseline, with
a much larger difference for countries undertaking the most
consolidation. OECD potential output growth is noticeably higher for a
period as lower real interest rates reduce the cost of capital, thereby
increasing capital deepening. The level of potential OECD output
increases by more than 2% by 2030 and by much more in those countries
where indebtedness falls most; for example, potential output in Greece is
boosted by more than 7%.
Figure 4.2. More ambitious fiscal consolidation boosts potential growth
Source: OECD Economic Outlook 91 long-term database.1 2 http://dx.doi.org/10.1787/888932609323
2000 2005 2010 2015 2020 2025 203050
60
70
80
90
100
110
120
% of GDP
Baseline scenario
More ambitious fiscal consolidation
Panel A: Gross government debt, OECD average
2000 2005 2010 2015 2020 2025 2030
0
2
4
6
8
10
12
Number of countries
Baseline scenario
More ambitious fiscal consolidation
Panel B: OECD countries with gross governmentdebt greater than 100% of GDP
2000 2005 2010 2015 2020 2025 20300.0
0.5
1.0
1.5
2.0
2.5
3.0
3.5
4.0
%
Baseline scenario
More ambitious fiscal consolidation
Panel C: Real interest rate, OECD average
2000 2005 2010 2015 2020 2025 2030
0.0
0.5
1.0
1.5
2.0
2.5
3.0
%
Baseline scenario
More ambitious fiscal consolidation
Panel D: Potential output growth, OECD average

4. MEDIUM AND LONG-TERM SCENARIOS FOR GLOBAL GROWTH AND IMBALANCES
OECD ECONOMIC OUTLOOK, VOLUME 2012/1 © OECD 2012 – PRELIMINARY VERSION210
… but there may still be atrade-off between
consolidation and growth
An important qualification to the more ambitious fiscal consolidation
scenario presented above is that no explicit account is taken of the short-
term adverse effect of fiscal consolidation on demand, rather the focus is
on the medium and long-term effects on potential output. There is
unfortunately a trade-off between slowing the accumulation of
government debt to stave off its possible negative effect on growth, and
the risk that fiscal consolidation itself may create sustained headwinds
for the recovery and reduce growth for the duration of the consolidation
effort. The size of the adverse demand effects will vary by country and
depend on the scope to cut policy interest rates, the effect of consolidation
on confidence and thus private spending and interest rates, the fiscal
instruments used and the speed of consolidation. In some circumstances,
fiscal austerity could potentially be self-defeating if it reduces growth and
magnifies negative hysteresis effects on trend output by enough to
worsen long-term government solvency more than short-term deficit
reductions help (DeLong and Summers, 2012).
A judicious choice ofmeasures would minimise
growth impacts
Countries face particularly difficult choices regarding the speed of
consolidation and the instruments to use, but both provide opportunities
to reduce adverse effects. Fiscal consolidation should be more ambitious
if there is scope for monetary policy to offset some of the negative
demand effects. If the recovery proceeds at the projected pace, the
constraints on monetary policy should be less of a concern from 2014
onwards for most countries and the pace of normalisation of interest
rates could be then adjusted to partially or fully offset demand weakness
resulting from budget improvements. The growth trade-off can be further
improved by placing more weight on measures that improve long-term
fiscal positions but which have relatively limited immediate negative
effects on demand. Country-specific estimates of budgetary gains from a
wide range of spending and revenue measures which have little adverse
or even a positive effect on growth, at least in the medium term, amount
to 7% on average across OECD countries (OECD, 2012). On the expenditure
side, these include adopting best practices in many spending areas such
as health and education (Joumard et al., 2010; Sutherland et al., 2007);
reforming public pensions and transfer programmes to better target the
poor and sharpen incentives to work and save; and reducing distortionary
subsidies. On the revenue side, measures include broadening tax bases,
for instance by reducing poorly targeted and distorting tax expenditures
such as those aimed at boosting retirement savings, promoting
homeownership and charitable giving (OECD, 2010); and choosing less
harmful taxes such as those on immobile property and corrective taxes
such as pollution charges.14
14. See OECD (2012) and references therein for detailed discussions of the pros andcons of different fiscal consolidation instruments on both the revenue andspending sides.

4. MEDIUM AND LONG-TERM SCENARIOS FOR GLOBAL GROWTH AND IMBALANCES
OECD ECONOMIC OUTLOOK, VOLUME 2012/1 © OECD 2012 – PRELIMINARY VERSION 211
Current consolidation plans
Among countries requiringsubstantial consolidation…
Most governments recognise the need for further consolidation and
have objectives that imply moving back towards more sustainable fiscal
positions. Among a group of 11 OECD countries where consolidation
needs are greatest, there are, however, considerable differences in the
extent to which such objectives are clearly articulated in terms of credible
medium-term fiscal plans (Table 4.5).
… US medium-term fiscalplans are unclear…
l In the United States, there are a number of fiscal plans, but political
disagreement makes the extent, pace and tools of future consolidation
uncertain, as discussed in Chapter 1. Given the scale of the needed
consolidation, such plans would need to include the major spending
categories, notably entitlement spending and defence outlays, as well
as revenue increases. Agreeing on a credible consolidation path to
restore long-term fiscal sustainability will become more urgent as the
recovery firms and government borrowing costs may increase.
… and those of Japanappear inadequate
l In Japan, the government’s medium-term fiscal objectives, announced
in June 2010, aimed at halving the primary deficit of the central and
local governments by fiscal year (FY) 2015 and eliminating it by FY 2020.
Given the very high sovereign debt level, specifying a more detailed
medium-term consolidation plan that identifies the revenue and
spending measures to achieve these long-term objectives is a priority.
The government has proposed raising the consumption tax rate to 10%
by 2015, and the phase-in of this measure should be swiftly initiated to
demonstrate commitment to longer-term fiscal goals.
Planned consolidationwould put debt on adownward trend in
Portugal, Ireland andGreece…
l Very substantial front-loaded consolidation is planned in those euro
area countries – Greece, Ireland, Portugal – that have been under the
greatest pressure from financial markets and requested assistance
from the European Union and the IMF. The extent of the planned
consolidation beyond 2013 exceeds the stylised rule of the debt-
stabilisation scenario presented above and would be sufficient to put
the debt-to-GDP ratio on a clear downward trajectory.
… and in the UnitedKingdom
l In the United Kingdom, current plans embody cumulative structural
fiscal tightening of 3.6% of GDP over the next three fiscal years, with
additional medium-term policy measures worth around 1.3% of GDP to
be implemented from 2015 onwards to ensure a decline in the debt ratio
from fiscal year 2015/16. These plans are more ambitious than the
stylised rule for debt-stabilisation in the scenario presented above.
Other EU countries alsorequire credible medium-
term fiscal plans
l Other EU countries requiring substantial consolidation beyond 2011 to
stabilise debt include Poland, the Slovak Republic and Slovenia. While
aggregate fiscal objectives in these countries are consistent with
stabilising debt ratios, specific consolidation objectives and measures
need to be specified to reduce uncertainty. In Belgium, Italy, France and

4. MEDIUM AND LONG-TERM SCENARIOS FOR GLOBAL GROWTH AND IMBALANCES
OECD ECONOMIC OUTLOOK, VOLUME 2012/1 © OECD 2012 – PRELIMINARY VERSION212
Spain, planned fiscal consolidation to 2013 should be more than
sufficient to stabilise debt ratios, but additional measures may be
warranted after 2013 to reduce these ratios from high levels.
Table 4.5. Medium-term fiscal plans in OECD countries requiring substantial consolidation
1 2 http://dx.doi.org/10.1787/888932610919
Fiscal
balance
Average
consolidation
to stabilise
debt1
Gross
debtSummary of latest official medium-term fiscal plans
As percentage of nominal GDP
Belgium -3.9 1.2 102 Achieve a nominal balanced budget in 2015, requiring fiscal consolidation of 1% of
GDP per year.
Greece -9.2 6.9 170
Reduce the fiscal deficit to around 2% of GDP by 2014, primary balance remaining at
around 4½ per cent of GDP until 2020, through cuts in spending in areas such as
pharmaceuticals and the wage bill, a reform of the tax system, improvements in tax
administration and the implementation of the revised privatisation programme.
Ireland -13.0 4.3 114
Reduce the headline deficit to 2.8% of GDP in 2015, mainly through expenditure
reduction (2/3 of measures) including cutting public sector employment, capital
spending and the coverage of welfare benefits. Revenue raising measures include
raising VAT, capital taxes and user charges and abolishing tax reliefs.
Italy -3.8 2.3 120 Reduction of the deficit to 1.7% of GDP in 2012, 0.5% in 2013 and 0.1% in 2014. Tax
increases make the main contribution in 2012, expenditure restraint thereafter.
Japan -9.5 8.9 205
Halving the primary budget deficit of central and local governments by FY2015,
achieving a primary budget surplus by FY 2020 and putting the public debt ratio on a
downward trend from FY 2021. To meet these objectives, central government primary
spending, excluding reconstruction, is to be held stable until FY2014 and the
government has proposed doubling the consumption tax rate to 10% by 2015.
Poland -5.1 4.2 63 Reduce the general government deficit to 2.9% of GDP in 2012, 2.5% in 2013 and 1%
by 2015.
Portugal -4.2 5.9 118 Reduce the nominal budget deficit to 4.5% of GDP in 2012, 3% in 2013 and 0.5% in
2016, through mainly expenditure-based consolidation.
-4.8 4.0 47 Reduce the fiscal deficit below 3% of GDP by 2013. According to recently introduced
fiscal rules, keep the debt below 60% of GDP until 2017 and below 50% from 2028.
S i 8 5 5 0 75Specific measures have been taken to reduce the government deficit to 5.3% of GDP
Fiscal situation in 2011
Slovak
Republic
Spain -8.5 5.0 75 Specific measures have been taken to reduce the government deficit to 5.3% of GDP
in 2012. The government aims to reduce the deficit to 3% of GDP in 2013.
-8.4 4.5 98
The consolidation programme aims at a cyclically-adjusted current budget surplus by
fiscal year 2016-17 and declining public sector net debt by 2015-16, essentially
through spending cuts. Entitlements, including pensions, are being limited.
-9.7 5.1 103
No specific medium-term plan has yet been adopted. Current law provides for
substantial consolidation but is likely to be overridden. The Administration�s FY 2013
budget proposal, which also is unlikely to be adopted, provides for deficit reductions of
2% of GDP in both 2013 and 2014 and smaller reductions to 2018 and would halt the
rise in the debt-to-GDP ratio by 2015.
Note:
1.
Sources: Most recent budget documentation or, for EU countries, the latest Stability Programme.
The average improvement in the underlying primary balance to 2030 (or 2040 for Japan) required to stabilise the gross government debt-to-GDP ratio,
assuming consolidation in 2012-13 is consistent with the short-term projections described in Chapters 1 and 2 and thereafter amounts to ½ percent of GDP
per annum (1 percent of GDP in Japan).
United
Kingdom
United
States
This table summarises official medium-term fiscal plans for those countries where consolidation requirements are judged to be substantial, based on two
criteria, either (a) the required increase in the underlying primary balance to stabilise the debt-to-GDP ratio in 2011 is at least 4% points of GDP or (b)
gross government debt as a share of GDP exceeds 100% in 2011.
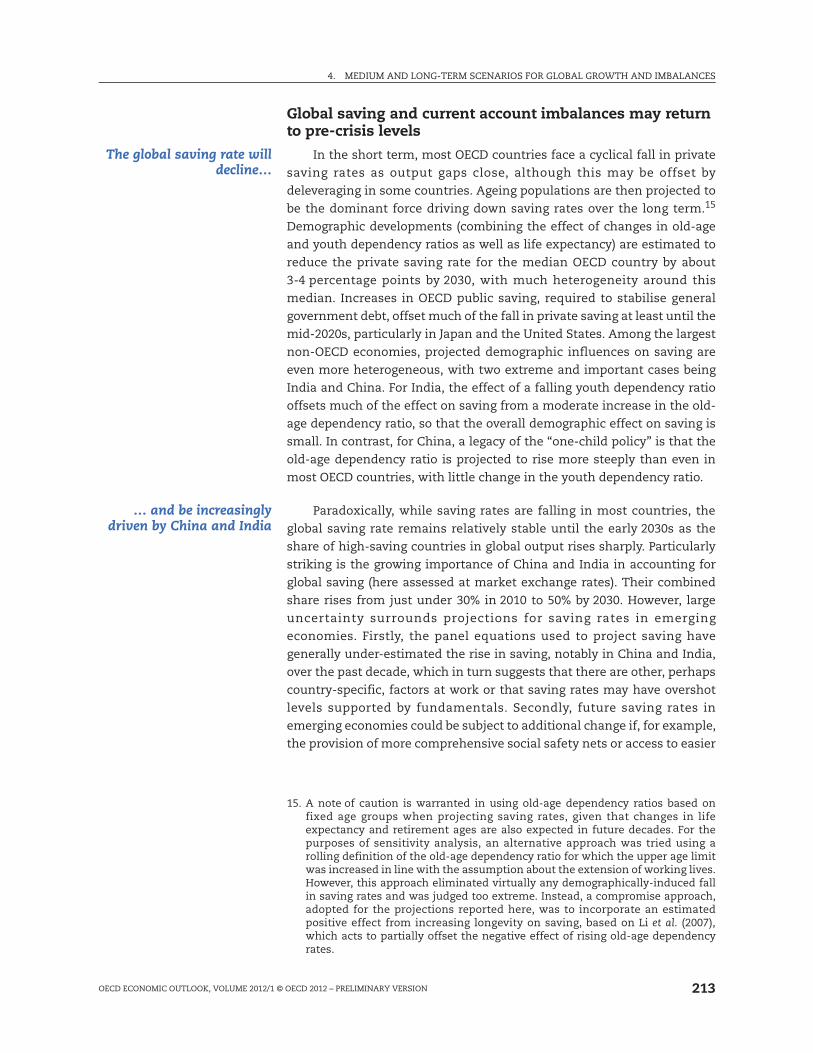
4. MEDIUM AND LONG-TERM SCENARIOS FOR GLOBAL GROWTH AND IMBALANCES
OECD ECONOMIC OUTLOOK, VOLUME 2012/1 © OECD 2012 – PRELIMINARY VERSION 213
Global saving and current account imbalances may return to pre-crisis levels
The global saving rate willdecline…
In the short term, most OECD countries face a cyclical fall in private
saving rates as output gaps close, although this may be offset by
deleveraging in some countries. Ageing populations are then projected to
be the dominant force driving down saving rates over the long term.15
Demographic developments (combining the effect of changes in old-age
and youth dependency ratios as well as life expectancy) are estimated to
reduce the private saving rate for the median OECD country by about
3-4 percentage points by 2030, with much heterogeneity around this
median. Increases in OECD public saving, required to stabilise general
government debt, offset much of the fall in private saving at least until the
mid-2020s, particularly in Japan and the United States. Among the largest
non-OECD economies, projected demographic influences on saving are
even more heterogeneous, with two extreme and important cases being
India and China. For India, the effect of a falling youth dependency ratio
offsets much of the effect on saving from a moderate increase in the old-
age dependency ratio, so that the overall demographic effect on saving is
small. In contrast, for China, a legacy of the “one-child policy” is that the
old-age dependency ratio is projected to rise more steeply than even in
most OECD countries, with little change in the youth dependency ratio.
… and be increasinglydriven by China and India
Paradoxically, while saving rates are falling in most countries, the
global saving rate remains relatively stable until the early 2030s as the
share of high-saving countries in global output rises sharply. Particularly
striking is the growing importance of China and India in accounting for
global saving (here assessed at market exchange rates). Their combined
share rises from just under 30% in 2010 to 50% by 2030. However, large
uncertainty surrounds projections for saving rates in emerging
economies. Firstly, the panel equations used to project saving have
generally under-estimated the rise in saving, notably in China and India,
over the past decade, which in turn suggests that there are other, perhaps
country-specific, factors at work or that saving rates may have overshot
levels supported by fundamentals. Secondly, future saving rates in
emerging economies could be subject to additional change if, for example,
the provision of more comprehensive social safety nets or access to easier
15. A note of caution is warranted in using old-age dependency ratios based onfixed age groups when projecting saving rates, given that changes in lifeexpectancy and retirement ages are also expected in future decades. For thepurposes of sensitivity analysis, an alternative approach was tried using arolling definition of the old-age dependency ratio for which the upper age limitwas increased in line with the assumption about the extension of working lives.However, this approach eliminated virtually any demographically-induced fallin saving rates and was judged too extreme. Instead, a compromise approach,adopted for the projections reported here, was to incorporate an estimatedpositive effect from increasing longevity on saving, based on Li et al. (2007),which acts to partially offset the negative effect of rising old-age dependencyrates.

4. MEDIUM AND LONG-TERM SCENARIOS FOR GLOBAL GROWTH AND IMBALANCES
OECD ECONOMIC OUTLOOK, VOLUME 2012/1 © OECD 2012 – PRELIMINARY VERSION214
credit were to be introduced more quickly than assumed in the baseline
scenario.
Current accountimbalances will build up
again
After narrowing during the global recession of 2008/09, global current
account imbalances started widening again as economies recovered,
though they remain well below the peaks seen prior to the crisis. Going
forward, the same factors that drove increased global financial flows
before the crisis are projected to continue reasserting themselves. In the
baseline scenario, a widening of global current account imbalances in the
short term is mostly a cyclical response given the assumption that output
gaps close mainly through a recovery in domestic demand, because those
countries that had been running the largest deficits prior to the crisis
(most obviously the United States) have more typically experienced
sharper downturns than those that had been running surpluses (most
obviously China but also Germany and to a lesser extent Japan). Over the
longer term, the negative effect of ageing populations on saving is the
dominant effect, leading to lower current account balances in most OECD
countries. China’s current account surplus widens until 2030 as the
investment rate falls more rapidly than the saving rate due to slowing
potential growth. Moreover, the increasing share of China in world GDP
means that the increase in the surplus as a share of Chinese GDP becomes
a relatively much larger increase as a share of world GDP. The current
account surplus of oil exporters rises sharply to 2020 before roughly
stabilising as a share of world GDP, reflecting the profile of increasing real
oil prices which offset the tendency for oil exporters to gradually run
down any overall current account surplus. Overall, the scale of current
account imbalances (normalised on world GDP) reaches the pre-crisis
(2007) peak by the late 2020s (Figure 4.3).
Over the longer term, living standards in non-OECD countries will slowly catch up to OECD levels
Growth in the non-OECDwill outpace that of the
OECD, shrinking gaps inliving standards
In the baseline scenario, the aggregate trend real GDP growth rate of
the OECD remains at about 2% per annum to 2050, whereas that of the
non-OECD declines from 7-8% per annum over the last decade to 4-6% per
annum in the 2020s and 2-3% per annum in the 2040s. Until 2020, China
has the highest growth rate of any country, but it is then surpassed by
India and by Indonesia a few years later.16 The trend growth rate of world
real GDP declines gradually as of the next decade as the contribution from
the non-OECD economies from their rising share in global output does not
entirely compensate for their declining growth rate.
Looking at the evolution of per capita measures to assess living
standards, income differences between poor and rich countries are
reduced when compared with 2011, with the most noticeable
16. There is uncertainty about how quickly the rate of growth of China will decline.For example, Eichengreen et al. (2011) and Herd and Dougherty (2007) suggestthe slowdown may be more gradual.
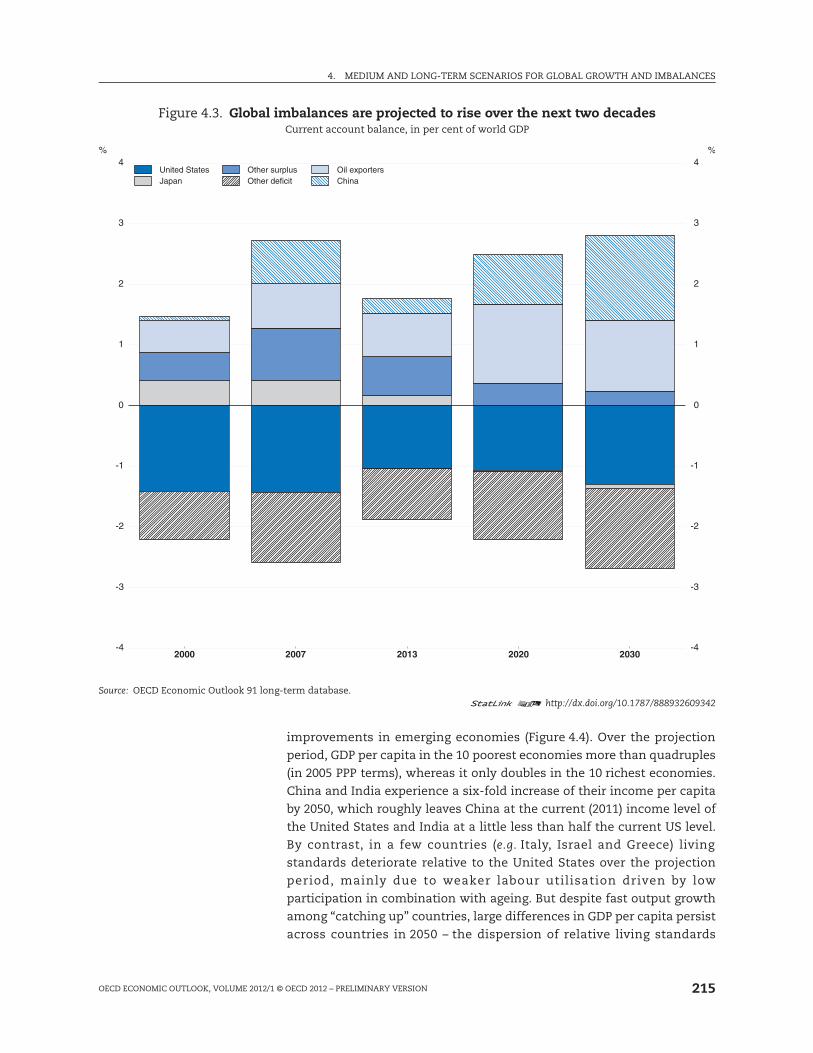
4. MEDIUM AND LONG-TERM SCENARIOS FOR GLOBAL GROWTH AND IMBALANCES
OECD ECONOMIC OUTLOOK, VOLUME 2012/1 © OECD 2012 – PRELIMINARY VERSION 215
improvements in emerging economies (Figure 4.4). Over the projection
period, GDP per capita in the 10 poorest economies more than quadruples
(in 2005 PPP terms), whereas it only doubles in the 10 richest economies.
China and India experience a six-fold increase of their income per capita
by 2050, which roughly leaves China at the current (2011) income level of
the United States and India at a little less than half the current US level.
By contrast, in a few countries (e.g. Italy, Israel and Greece) living
standards deteriorate relative to the United States over the projection
period, mainly due to weaker labour utilisation driven by low
participation in combination with ageing. But despite fast output growth
among “catching up” countries, large differences in GDP per capita persist
across countries in 2050 – the dispersion of relative living standards
Figure 4.3. Global imbalances are projected to rise over the next two decadesCurrent account balance, in per cent of world GDP
Source: OECD Economic Outlook 91 long-term database.1 2 http://dx.doi.org/10.1787/888932609342
2000 2007 2013 2020 2030-4
-3
-2
-1
0
1
2
3
4
%
-4
-3
-2
-1
0
1
2
3
4
%
United States
Japan
Other surplus
Other deficit
Oil exporters
China

4. MEDIUM AND LONG-TERM SCENARIOS FOR GLOBAL GROWTH AND IMBALANCES
OECD ECONOMIC OUTLOOK, VOLUME 2012/1 © OECD 2012 – PRELIMINARY VERSION216
across all countries is reduced by only about one quarter between 2011
and 2050.17
The relative size ofeconomies will change
dramatically
The next 40 years will see major changes in country rankings and
shares of world GDP (Figure 4.5). On the basis of 2005 PPPs, in 2017 China
surpasses the United States to become the largest economy in the world,
and India is about now surpassing Japan. The combined GDP of China and
India exceeds that of the major seven (G7) OECD economies by
around 2025 and by 2050 it is 1½ times larger, whereas in 2010 these two
countries accounted for less than one-half of the G7’s GDP. Using market
exchange rates rather than 2005 PPPs, China surpasses the United States
in the early 2020s and India only surpasses Japan in the late-2020s, but the
combined GDP of China and India grows from less than one-quarter the
size of the G7 in 2010 to exceed it by 2040.
Convergence in livingstandards is driven mostly
by efficiency gains…
Multi-factor productivity (MFP) is the main driver of growth and the
main driver of convergence between non-OECD and OECD countries. MFP
projections are driven by the global rate of technological progress,
assumed to be 1.3% per year (corresponding to the average rate of MFP
growth observed among advanced economies over the period 1996-2006)
and by catching up toward country-specific steady-state levels of MFP.
This catch-up occurs at a speed dependent on the country’s trade
openness and the strength of domestic competition.18 In this set-up,
Figure 4.4. Stronger convergence will be experienced by poorer countriesGDP per capita, measured at 2005 PPPs, relative to the United States
Source: OECD Economic Outlook 91 long-term database.1 2 http://dx.doi.org/10.1787/888932609361
IND CHN BRA TUR CHL HUN POL PRT GRC SVN ESP ISR FRA FIN GBR BEL SWE IRL AUT CHE
IDN ZAF MEX RUS ARG EST SVK SAU CZE NZL ITA KOR JPN DNK ISL DEU AUS CAN NLD NOR
0
20
40
60
80
100
120
140
USA=100
0
20
40
60
80
100
120
140
USA=100
2011 2050
17. One caveat to these comparisons of GDP levels is that using PPP estimates witha fixed base year may bias comparisons far into the future, as discussed inJohansson et al. (2012).
18. On average across countries, the estimated speed of convergence is 6% per year,broadly in line with existing empirical evidence (e.g. Bouis et al., 2011; Bourlès etal., 2010; Fouré et al., 2010), implying that it takes roughly 12 years to eliminatehalf of the initial MFP gap.

4. MEDIUM AND LONG-TERM SCENARIOS FOR GLOBAL GROWTH AND IMBALANCES
OECD ECONOMIC OUTLOOK, VOLUME 2012/1 © OECD 2012 – PRELIMINARY VERSION 217
Figure 4.5. There will be major changes in the composition of world GDPPercent of world GDP
Note: World GDP is taken as the sum of GDP for all countries which are distinguished by the model.
Source: OECD Economic Outlook 91 long-term database.1 2 http://dx.doi.org/10.1787/888932609380
United States23%
Japan7%
Other G717%Other OECD
19%
China16%
India6%
Other non-OECD12%
Real GDP at 2005 PPPs in 2010
United States18%
Japan4%
Other G711%
Other OECD 16%
China28%
India11%
Other non-OECD12%
Real GDP at 2005 PPPs in 2030
United States17%
Other non-OECD12%
Real GDP at 2005 PPPs in 2050
United States26%
Japan10%
Other G721%
Other OECD 20%
China11%
India3%
Other non-OECD9%
Nominal $ GDP at market exchange rates in 2010
United States20%
Japan6%
Other G714%
Other OECD 17%
China25%
India7%
Other non-OECD11%
Nominal $ GDP at market exchange rates in 2030
United States18%
India
Other non-OECD10%
Nominal $ GDP at market exchange rates in 2050
United States17%
Japan3%
Other G79%
Other OECD 14%
China29%
India16%
OECD12%
United States18%
Japan5%
Other G712%
Other OECD 16%
China28%
India11%
OECD10%

4. MEDIUM AND LONG-TERM SCENARIOS FOR GLOBAL GROWTH AND IMBALANCES
OECD ECONOMIC OUTLOOK, VOLUME 2012/1 © OECD 2012 – PRELIMINARY VERSION218
countries exhibiting comparatively low initial MFP levels – such as India,
China, Indonesia and Eastern European countries – tend to grow faster
than more developed economies. However, in fast-growing catching-up
countries (e.g. Brazil, China, Czech Republic, Estonia, India, Slovak
Republic and Slovenia), MFP growth tends to slow down over the
projection period as MFP levels approach steady-state.
… and additions to humancapital
Educational attainment of cohorts aged 25-29 slowly converge in all
countries towards those in the leading country (Korea) at the average
speed observed globally over the period 1960-2005, with attainment in
Korea also continuing to rise slowly. Average years of schooling of the
adult population thus increases by two years on average over the
period 2011-50, compared with an increase of four years over 1970-2010.
In several countries with initially low levels of education, particularly in
India, Turkey, China, Portugal and South Africa, the contribution of
human capital to annual GDP per capita growth is more than
0.6 percentage points, driven by fast catch-up.
Capital intensity varieswith interest rates
Compared with human capital, physical capital accumulation
contributes little to potential output growth in the baseline scenario. Any
recent trend in the capital-to-output ratio is a priori assumed to stabilise
gradually, which means that there can be a slight negative or positive
contribution at the beginning of the projection period. After that,
investment and thus capital intensity are affected to the extent that
interest rates respond to changes in government indebtedness or to the
global saving-investment balance. For countries where the capital-to-
output ratio has been trending strongly in recent years, the assumption
that trends gradually disappear over the projection period can produce
large changes in the share of investment in output. One such country is
China: with an investment share in output of 45-50% in recent years, the
capital-to-output ratio has been rising quickly. Over the projection period,
however, the assumed stabilisation of this ratio combined with declining
potential growth lowers the investment share in output gradually to about
30% in 2030.
Demographics will dragdown growth in most
countries
Population ageing generally has a negative effect on trend per capita
growth rates as it leads to a declining share of the population of
traditional working age and a declining participation rate in most
countries. Only a few countries experience a demographic dividend
to 2050, either due to a significant increase in the share of the population
of traditional working age (India and South Africa) or a significant
increase in labour force participation (Chile, Estonia, the United States
and New Zealand). Net migration mitigates the increase in dependency
ratios in most countries, by 2 percentage points on average between now
and 2050, but given the sheer size of projected increases in dependency
ratios (23 percentage points on average to 2050), policies aimed at
attracting migrants would be unable to offset the adverse consequences
of population ageing on the labour force.
4. MEDIUM AND LONG-TERM SCENARIOS FOR GLOBAL GROWTH AND IMBALANCES
OECD ECONOMIC OUTLOOK, VOLUME 2012/1 © OECD 2012 – PRELIMINARY VERSION 219
Bold fiscal and structural policies can boost growth and reduce global current account imbalances
An alternative scenarioassumes more ambitiousstructural policy reforms
This section presents the results of an alternative scenario where
OECD countries consolidate their budget positions faster than in the
baseline scenario to reduce debt ratios to 60% or lower and,
simultaneously, OECD and non-OECD countries implement more
ambitious structural reforms than those assumed in the baseline scenario
(Table 4.6). These more ambitious structural policy reforms provide for
stronger improvement in product market regulation, reductions in the tax
wedge to lower trend unemployment and higher labour force
participation rates. In addition, welfare and financial reforms in non-
OECD countries are assumed to occur more quickly than in the baseline
scenario: whereas public spending on social protection was assumed to
increase gradually to 2040 in the baseline, the same increases are
assumed to take place by 2025; similarly, the availability of credit
(expressed as a share of GDP) is assumed to reach the same level in 2035
as was previously achieved in the baseline by 2050.
Product marketliberalisation would speed
up convergence
The baseline scenario assumption of relatively slow convergence of
product market policies towards average OECD levels of regulation may be
too conservative given the push for structural reform currently exerted in
the context of the G20 mutual assessment process and given the further
urgency of reform as one response to the euro area crisis. If more rapid
liberalisation in product markets is achieved, productivity gaps may be
closed faster. Hence, the alternative scenario assumes that the target for
product market regulation is the average level of regulation in the five
“best practice” countries in 2011 (i.e. the United States, the United
Kingdom, Ireland, Canada and the Netherlands). More rapid product
market liberalisation raises GDP by an average of 7% in 2050 relative to the
baseline, the impact being greater in countries with relatively stringent
regulation, including most non-OECD countries and Turkey, Slovenia and
Greece (when some of these adjustments may already be taking place as
part of the current programme).
Labour market reforms canpartly counteract
demographic effects
The alternative scenario also assumes deeper labour market reforms
than the baseline scenario, which results in convergence towards higher
labour force participation rates.19 Cross-country differences in active life
expectancy are assumed to progressively disappear: the average duration
of individual active life slowly converges in all countries towards 46% of
life expectancy, which is the standard observed in Switzerland, one of the
leading countries in terms of aggregate participation. The increases in
participation rates add on average about 3½ per cent to potential output
by 2050, but with much larger increases in Italy (25%), Israel (11%) and
19. It should be noted that this stylised scenario does not take into account anyramifications on public budgets and interest rates from the labour marketreforms.

4. MEDIUM AND LONG-TERM SCENARIOS FOR GLOBAL GROWTH AND IMBALANCES
OECD ECONOMIC OUTLOOK, VOLUME 2012/1 © OECD 2012 – PRELIMINARY VERSION220
Table 4.6. Summary of scenario with more ambitious fiscal consolidation and structural reform
As percentage of GDP (unless otherwise specified)
1 2 http://dx.doi.org/10.1787/888932610938
Average
2000-072010 2013 2020 2025 2030
Potential real GDP growth (%) 2.6 1.7 2.1 2.5 2.5 2.4
Fiscal balance -2.6 -10.7 -6.5 2.3 0.6 -0.9
Gross government debt 62 98 111 90 70 62
Real Interest rates (%) 2.4 1.7 1.4 3.1 3.3 3.6
Total national savings 14.7 12.5 12.7 15.6 13.6 11.8
Total investment 19.7 15.8 17.0 17.4 17.2 16.1
Current balance -4.9 -3.2 -4.3 -1.7 -3.5 -4.3
Potential real GDP growth (%) 0.7 0.6 0.8 1.3 1.6 1.8
Fiscal balance -5.4 -8.4 -10.1 0.4 7.9 10.9
Gross government debt 157 193 223 228 187 121
Real Interest rates (%) 2.7 2.4 3.0 2.8 3.3 3.2
Total national savings 26.4 23.2 22.8 26.8 30.8 32.1
Total investment 23.1 19.8 21.0 23.6 25.0 26.3
Current balance 3.3 3.6 1.9 3.2 5.9 5.8
Potential real GDP growth (%) 1.9 1.0 1.3 2.2 2.0 1.8
Fiscal balance -1.9 -6.2 -2.0 1.8 0.4 -0.5
Gross government debt 75 93 100 77 65 61
Real Interest rates (%) 2.4 2.3 3.2 2.9 3.0 3.2
Total national savings 21.6 19.4 20.5 20.0 18.0 15.9
Total investment 19.2 20.5 19.9 22.2 20.9 19.2
Current balance 0.3 0.4 1.6 -0.9 -1.7 -2.2
Potential real GDP growth (%) 2.2 1.5 1.9 2.4 2.4 2.3
Fiscal balance -2.1 -7.5 -4.2 1.6 1.3 0.7
Gross government debt 74 99 109 96 78 66
Real Interest rates (%) 2.5 1.9 2.2 3.0 3.3 3.5
Total national savings 19.8 18.0 18.8 20.1 19.0 17.6
Total investment 21.0 18.6 19.5 20.2 20.5 18.4
Current balance -1.2 -0.6 -0.9 -0.2 -0.6 -1.0
China
P i l l GDP h (%) 10 0 10 2 9 5 7 1 5 4 4 3
United States
Japan
Euro Area
OECD Total
Potential real GDP growth (%) 10.0 10.2 9.5 7.1 5.4 4.3
Total national savings 44.6 51.8 50.1 37.9 29.6 27.2
Total investment 40.1 47.8 48.3 39.7 32.3 27.5
Current balance 4.6 4.0 1.7 -1.8 -2.6 -0.2
India
Potential real GDP growth (%) 7.4 7.8 7.3 7.0 6.6 6.1
Total national savings 29.6 31.8 28.3 23.4 19.7 19.0
Total investment 29.1 34.3 31.2 30.6 29.1 27.3
Current balance 0.0 -3.2 -2.9 -7.3 -9.4 -8.2
Brazil
Potential real GDP growth (%) 3.1 4.2 4.5 4.4 4.2 3.8
Total national savings 16.1 17.5 16.7 16.2 15.2 13.8
Total investment 17.1 20.2 19.9 19.5 18.5 17.3
Current balance 0.7 -2.2 -3.2 -3.3 -3.2 -3.5
Potential real GDP growth (%)
OECD 2.2 1.5 1.9 2.4 2.4 2.3
non-OECD 6.8 7.5 7.3 6.1 5.1 4.4
World 2.8 2.7 3.4 3.7 3.5 3.2
Source: OECD Economic Outlook 91 long-term database.

4. MEDIUM AND LONG-TERM SCENARIOS FOR GLOBAL GROWTH AND IMBALANCES
OECD ECONOMIC OUTLOOK, VOLUME 2012/1 © OECD 2012 – PRELIMINARY VERSION 221
Korea (14%). The overall effect of these labour market reforms is to raise
GDP by 4% on average in 2050 compared with the baseline scenario.
More ambitious structuraland fiscal reforms boost
growth
The main macroeconomic impact of more ambitious structural and
fiscal reforms is to boost trend output. The level of potential output
in 2050 is higher in both OECD and non-OECD countries, by about 7% and
13%, respectively (Figure 4.6). There are, however, large differences in the
magnitude of this effect across countries, the effect being generally larger
in countries with the greatest scope for improvement in structural polices
relative to best practice. The largest gainers are Italy, Korea and Israel,
where there are large potential gains from raising labour force
participation, as well as many countries which currently have relatively
stringent product market regulation and stand to gain around 10% or
more of GDP by 2050 by improving competition and so speeding up the
convergence process. On the other hand, countries such as Canada,
Denmark, Iceland, and the Netherlands benefit less from structural
reforms, but this is only because they are currently at, or close to, best
practices in respect of product market regulation and labour force
participation. The effects of reform are generally lower when all countries
take action than they would be if reforms applied to only one country.
This reflects that simultaneous reform boosts global growth, which again
raises global interest rates, thereby partially offsetting the positive effect
of structural reforms on GDP. Exceptions are countries where fiscal
consolidation is so large that the domestic reduction in interest rates
more than compensates for this global effect (notably Greece and Japan).
Figure 4.6. Structural reforms and more ambitious fiscal consolidation raise GDPDifference in level of GDP in 2050, compared to baseline
Source: OECD Economic Outlook 91 long-term database.1 2 http://dx.doi.org/10.1787/888932609399
CAN NLD ESP USA NOR FIN SWE MEX TUR AUS JPN ARG CZE PRT AUT SVK HUN SAU BEL POL KOR
DNK ISL IRL GBR CHE NZL EST ZAF CHL IND DEU BRA LUX CHN SVN RUS GRC IDN FRA ISR ITA
-5
0
5
10
15
20
25
30
35
40
%
-5
0
5
10
15
20
25
30
35
40
%
Combined scenario National structural policies

4. MEDIUM AND LONG-TERM SCENARIOS FOR GLOBAL GROWTH AND IMBALANCES
OECD ECONOMIC OUTLOOK, VOLUME 2012/1 © OECD 2012 – PRELIMINARY VERSION222
Structural reforms canreduce current account
imbalances
More ambitious structural policy reforms combined with faster fiscal
consolidation reduce global current account imbalances. This
improvement comes about principally by lowering large current account
surpluses in some non-OECD economies, especially China, because
precautionary saving falls more rapidly as a consequence of more rapid
welfare and financial reforms. By narrowing the gaps between public (and
thereby national) saving and investment, fiscal tightening also
contributes to reducing external imbalances as the need for such
tightening is generally higher in external deficit countries. The peak effect
on total global imbalances – measured as half the sum of individual
current balances in absolute value as a share of world GDP – occurs in the
late 2020s when they are approximately 0.6 percentage point of world GDP
lower than in the baseline scenario, implying a reduction in total global
imbalances by more than one-fifth (Figure 4.7). The timing for the peak
effect is opportune as it is when global imbalances would otherwise have
returned to their pre-crisis maximum.
Figure 4.7. Policy action can reduce global imbalancesAbsolute sum of current account balances, as a share of world GDP divided by 2
Source: OECD Economic Outlook 91 long-term database.1 2 http://dx.doi.org/10.1787/888932609418
2000 2002 2004 2006 2008 2010 2012 2014 2016 2018 2020 2022 2024 2026 2028 20301.4
1.6
1.8
2.0
2.2
2.4
2.6
2.8
3.0
% of world GDP
1.4
1.6
1.8
2.0
2.2
2.4
2.6
2.8
3.0
% of world GDP
Baseline scenario
More ambitious fiscal consolidation
More ambitious fiscal consolidation and better structural policies

4. MEDIUM AND LONG-TERM SCENARIOS FOR GLOBAL GROWTH AND IMBALANCES
OECD ECONOMIC OUTLOOK, VOLUME 2012/1 © OECD 2012 – PRELIMINARY VERSION 223
Bibliography
Beffy, P. et al. (2006), “New OECD Methods for Supply-side and Medium-termAssessments: A Capital Services Approach”, OECD Economics Department WorkingPapers, No. 482.
Bouis, R., R. Duval and F. Murtin (2011), “The Policy and Institutional Drivers ofEconomic Growth Across OECD and Non-OECD Economies: New Evidence fromGrowth Regressions”, OECD Economics Department Working Papers, No. 843.
Bourlès, R., G. Cette, J. Lopez, J. Mairesse and G. Nicoletti (2010), “Do Product MarketRegulations in Upstream Sectors Curb Productivity Growth?: Panel DataEvidence for OECD Countries”, OECD Economics Department Working Papers,No. 791.
Cecchetti, S., M. Mohanty and F. Zampolli (2011), “The Real Effects of Debt”, BISWorking Papers, No. 352.
DeLong, B. and L. Summers (2012), “Fiscal Policy in a Depressed Economy”, paperprepared for the Spring 2012 Brookings Panel on Economic Activity, 22-23 March, Washington, D.C.
Égert, B. (2010), “Fiscal Policy Reaction to the Cycle in the OECD: Pro- or Counter-Cyclical?”, OECD Economics Department Working Papers, No. 763.
Eichengreen, B., D. Park and K. Shin (2011), “When Fast Growing Economies SlowDown: International Evidence and Implications for China”, NBER Working Papers,No. 16919.
Elmeskov, J. and D. Sutherland (2012), “Post-Crisis Debt Overhang: GrowthImplications Across Countries”, paper prepared for the Reserve Bank of India’sSecond International Research Conference 2012, 1-2 February, Mumbai, India.
Fouré, J., A. Bénassy-Quéré and L. Fontagné (2010), “The World Economy in 2050: ATentative Picture”, CEPII Working Papers, No. 2010-27.
Frankel, J. (2006), “The Balassa-Samuelson Relationship and the Renminbi”, HarvardWorking Paper, December.
Haugh, D., P. Ollivaud and D. Turner (2009), “The Macroeconomic Consequences ofBanking Crises in OECD Countries”, OECD Economics Department Working Papers,No. 683.
Herd, R. and S. Dougherty (2007), “Growth Prospects in China and India Compared”,The European Journal of Comparative Economics, Vol. 4.
IEA (International Energy Agency) (2011), World Energy Outlook 2011, OECD/IEA,Paris.
Johansson, A. et al. (2012), “Long-Term Growth Scenarios”, OECD EconomicsDepartment Working Papers, forthcoming.
Joumard, I., C. André and C. Nicq (2010), “Health Care Systems: Efficiency andInstitutions”, OECD Economics Department Working Papers, No. 769.
Kerdrain, C., I. Koske and I. Wanner (2010), “The Impact of Structural Policies onSaving Investment and Current Accounts”, OECD Economics Department WorkingPapers, No. 815.
Kumar, M. S. and J. Woo (2010), “Public Debt and Growth”, IMF Working Papers,No. 10/174.
Laubach, T. (2009), “New Evidence on the Interest Rate Effects of Budget Deficitsand Debt”, Journal of the European Economic Association, Vol. 7.
Li, H., J. Zhang and J. Zhang (2007), “Effects of Longevity and Dependency Rates onSaving and Growth: Evidence from a Panel of Cross Countries”, Journal ofDevelopment Economics, Vol. 84.
OECD (2008), “Chapter 3 – The Implications of Supply-Side Uncertainties forEconomic Policy”, OECD Economic Outlook, Vol. 2008/1, Paris.
OECD (2010), “Choosing a Broad Base – Low Rate Approach to Taxation”, OECD TaxPolicy Studies, No. 19, OECD Publishing.

4. MEDIUM AND LONG-TERM SCENARIOS FOR GLOBAL GROWTH AND IMBALANCES
OECD ECONOMIC OUTLOOK, VOLUME 2012/1 © OECD 2012 – PRELIMINARY VERSION224
OECD (2011a), “Medium and Long-Term Developments: Challenges and Risks” inOECD Economic Outlook, Vol. 2011/1, OECD Publishing.
OECD (2011b), Pensions at a Glance, Paris.
OECD (2012), “What are the Best Policy Instruments for Fiscal Consolidation?”,OECD Economics Department Policy Notes, No. 12, April.
Oliveira Martins, J. and C. de la Maisonneuve (2006), “The Drivers of PublicExpenditure on Health and Long-Term Care: An Integrated Approach”, OECDEconomic Studies, No. 43.
Rawdanowicz, L. (2012), “Measuring Fiscal Consolidation Requirements”, OECDEconomics Department Working Papers, forthcoming.
Reinhart, C. M. and K. S. Rogoff (2010), “Growth in a Time of Debt”, AmericanEconomic Review, Vol. 100.
Röehn, O. (2010), “New Evidence on the Private Saving Offset and RicardianEquivalence”, OECD Economics Department Working Papers, No. 762.
Sutherland, D., R. Price, I. Joumard and C. Nicq (2007), “Performance and Indicatorsfor Public Spending Efficiency in Primary and Secondary Education”, OECDEconomics Department Working Papers, No. 546.
Turner, D. and F. Spinelli (2011), “Explaining the Interest-Rate-Growth DifferentialUnderlying Government Debt Dynamics”, OECD Economics Department WorkingPapers, No. 919.