medium access control, packet routing, and internet
TRANSCRIPT
Medium Access Control,Packet Routing, and
Internet Gateway Placementin Vehicular Ad Hoc Networks
by
Hassan Aboubakr Omar
A thesispresented to the University of Waterloo
in fulfillment of thethesis requirement for the degree of
Doctor of Philosophyin
Electrical and Computer Engineering
Waterloo, Ontario, Canada, 2014
c© Hassan Aboubakr Omar 2014


Author’s Declaration
I hereby declare that I am the sole author of this thesis. This is a true copy of the thesis,including any required final revisions, as accepted by my examiners.
I understand that my thesis may be made electronically available to the public.
iii


Abstract
Road accidents represent a serious social problem and are one of the leading causes ofhuman death and disability on a global scale. To reduce the risk and severity of a roadaccident, a variety of new safety applications can be realized through wireless communica-tions among vehicles driving nearby each other, or among vehicles and especially deployedroad side units (RSUs), a technology known as a vehicular ad hoc network (VANET).Most of the VANET-enabled safety applications are based on broadcasting of safety mes-sages by vehicles or RSUs, either periodically or in case of an unexpected event, such as ahard brake or dangerous road condition detection. Each broadcast safety message shouldbe successfully delivered to the surrounding vehicles and RSUs without any excess delay,which is one of the main functions of a medium access control (MAC) protocol proposed forVANETs. This thesis presents VeMAC, a new multichannel time division multiple access(TDMA) protocol specifically designed to support the high priority safety applications ina VANET scenario. The ability of the VeMAC protocol to deliver periodic and event-driven safety messages in VANETs is demonstrated by a detailed delivery delay analysis,including queueing and service delays, for both types of safety messages. As well, com-puter simulations are conducted by using MATLAB, the network simulator ns-2, and themicroscopic vehicle traffic simulator VISSIM, in order to evaluate the performance of theVeMAC protocol, in comparison with the IEEE 802.11p standard and the ADHOC MACprotocol (another TDMA protocol proposed for ad hoc networks). A real city scenario issimulated and different performance metrics are evaluated, including the network goodput,protocol overhead, channel utilization, protocol fairness, probability of a transmission colli-sion, and safety message delivery delay. It is shown that the VeMAC protocol considerablyoutperforms the existing MAC schemes, which have significant limitations in supportingVANET safety applications.
In addition to enhancing road safety, in-vehicle Internet access is one of the main appli-cations of VANETs, which aims at providing the vehicle passengers with a low-cost accessto the Internet via on-road gateways. This thesis presents a new strategy for deployingInternet gateways on the roads, in order to minimize the total cost of gateway deployment,while ensuring that a vehicle can connect to an Internet gateway (using multihop commu-nications) with a probability greater than a specified threshold. This cost minimizationproblem is formulated by using binary integer programming, and applied for optimal gate-way placement in a real city scenario. To the best of our knowledge, no previous strategyfor gateway deployment has considered the probability of multihop connectivity among thevehicles and the deployed gateways. In order to allow a vehicle to discover the existenceof an Internet gateway and to communicate with the gateway via multihops, a novel data
v

packet routing scheme is proposed based on the VeMAC protocol. The performance of thiscross-layer design is evaluated for a multichannel VANET in a highway scenario, mainly interms of the end-to-end packet delivery delay. The packet queueing at each relay vehicle isconsidered in the end-to-end delay analysis, and numerical results are presented to studythe effect of various parameters, such as the vehicle density and the packet arrival rate, onthe performance metrics.
The proposed VeMAC protocol is a promising candidate for MAC in VANETs, whichcan realize many advanced safety applications to enhance the public safety standards andimprove the safety level of drivers/passengers and pedestrians on roads. On the other hand,the proposed gateway placement strategy and packet routing scheme represent a strongstep toward providing reliable and ubiquitous in-vehicle Internet connectivity.
vi

Acknowledgements
I would like to express my deep appreciation to Prof. Weihua Zhuang for her exemplarysupervision, great support, and valuable advice throughout my PhD program.
I sincerely would like to thank Prof. Sherman (Xuemin) Shen and all my colleaguesat the Broadband Communications Research (BBCR) group for the beneficial discussions,research collaboration, and continuous exchange of knowledge.
I gratefully acknowledge my PhD committee members, Prof. Fakhri Karray, Prof.Nasser Azad, Prof. Sagar Naik, and Prof. Yi Qian, for their constructive comments andsuggestions, which helped to improve the quality of the thesis. Also, it is a pleasure totruly acknowledge Prof. Jon Mark for accepting to serve as a delegate in my PhD thesisexamining committee.
I would like to thank my colleague Usama Shahdah, a PhD student in the Transporta-tion Systems Research group at the University of Waterloo, for his very useful guidancefor conducting vehicle traffic computer simulations.
Sincere thanks go to Prof. Emad Al-Hussaini, Prof. Hany Abd El-Malek, and Prof.Nabila Seif, from the Faculty of Engineering at Cairo University, for providing supportiverecommendation letters at the time of my application for a PhD program at the Universityof Waterloo.
vii


Praise be to Allah
This PhD thesis is dedicated to my mother, Samia, my father, Aboubakr,and my sister, Dina.
ix


Table of Contents
List of Figures xv
List of Tables xix
List of Abbreviations xxi
List of Symbols xxv
1 Introduction 1
1.1 Vehicular Ad Hoc Networks . . . . . . . . . . . . . . . . . . . . . . . . . . 1
1.2 VANET Applications . . . . . . . . . . . . . . . . . . . . . . . . . . . . . . 3
1.2.1 Safety Applications . . . . . . . . . . . . . . . . . . . . . . . . . . . 3
1.2.2 In-vehicle Internet Access . . . . . . . . . . . . . . . . . . . . . . . 5
1.3 MAC in VANETs . . . . . . . . . . . . . . . . . . . . . . . . . . . . . . . . 5
1.4 Routing in VANETs . . . . . . . . . . . . . . . . . . . . . . . . . . . . . . 7
1.5 Thesis Objectives and Outline . . . . . . . . . . . . . . . . . . . . . . . . . 8
2 System Model 11
2.1 VANET Description: Elements and Applications . . . . . . . . . . . . . . . 11
2.2 Communications Channels . . . . . . . . . . . . . . . . . . . . . . . . . . . 12
2.3 Node Equipment and Identification . . . . . . . . . . . . . . . . . . . . . . 13
2.4 Time Slot Synchronization . . . . . . . . . . . . . . . . . . . . . . . . . . . 13
2.5 Definitions . . . . . . . . . . . . . . . . . . . . . . . . . . . . . . . . . . . . 13
xi

3 VeMAC: A TDMA MAC Protocol for Reliable Broadcast in VANETs 15
3.1 VeMAC Basics . . . . . . . . . . . . . . . . . . . . . . . . . . . . . . . . . 15
3.1.1 Safety Message Queueing and Service . . . . . . . . . . . . . . . . . 15
3.1.2 Transmission Collision Types on The CCH . . . . . . . . . . . . . . 17
3.1.3 VeMAC Packet Types . . . . . . . . . . . . . . . . . . . . . . . . . 18
3.2 CCH Access . . . . . . . . . . . . . . . . . . . . . . . . . . . . . . . . . . . 18
3.3 SCH Access . . . . . . . . . . . . . . . . . . . . . . . . . . . . . . . . . . . 22
3.4 Analysis of Time Slot Acquisition . . . . . . . . . . . . . . . . . . . . . . . 25
3.5 Simulations . . . . . . . . . . . . . . . . . . . . . . . . . . . . . . . . . . . 28
3.5.1 Analysis Verification . . . . . . . . . . . . . . . . . . . . . . . . . . 28
3.5.2 Simulation Scenarios and Performance Metrics . . . . . . . . . . . . 29
3.5.3 Simulated Protocols . . . . . . . . . . . . . . . . . . . . . . . . . . 33
3.5.4 Simulation Results . . . . . . . . . . . . . . . . . . . . . . . . . . . 36
3.5.4.1 Highway Scenario . . . . . . . . . . . . . . . . . . . . . . . 36
3.5.4.2 City Scenario . . . . . . . . . . . . . . . . . . . . . . . . . 39
3.6 Summary . . . . . . . . . . . . . . . . . . . . . . . . . . . . . . . . . . . . 41
4 Performance Evaluation of VeMAC Supporting VANET Safety Applica-tions 43
4.1 Delay Analysis . . . . . . . . . . . . . . . . . . . . . . . . . . . . . . . . . 43
4.1.1 Service Delay . . . . . . . . . . . . . . . . . . . . . . . . . . . . . . 45
4.1.1.1 τ = 0 . . . . . . . . . . . . . . . . . . . . . . . . . . . . . 45
4.1.1.2 τ =∞ . . . . . . . . . . . . . . . . . . . . . . . . . . . . . 46
4.1.2 Queueing Delay . . . . . . . . . . . . . . . . . . . . . . . . . . . . . 47
4.1.2.1 Event-driven Safety Messages . . . . . . . . . . . . . . . . 48
4.1.2.2 Periodic Safety Messages . . . . . . . . . . . . . . . . . . . 48
4.2 Numerical Results . . . . . . . . . . . . . . . . . . . . . . . . . . . . . . . . 49
4.2.1 Analytical Results . . . . . . . . . . . . . . . . . . . . . . . . . . . 49
xii

4.2.2 Simulation Results . . . . . . . . . . . . . . . . . . . . . . . . . . . 51
4.2.3 Discussion . . . . . . . . . . . . . . . . . . . . . . . . . . . . . . . . 53
4.3 Comparison of VeMAC with IEEE 802.11p . . . . . . . . . . . . . . . . . . 55
4.3.1 Square Network . . . . . . . . . . . . . . . . . . . . . . . . . . . . . 57
4.3.2 City Scenario . . . . . . . . . . . . . . . . . . . . . . . . . . . . . . 59
4.4 Summary . . . . . . . . . . . . . . . . . . . . . . . . . . . . . . . . . . . . 65
5 Gateway Placement and Packet Routing For Multihop In-Vehicle Inter-net Access 67
5.1 Gateway Placement . . . . . . . . . . . . . . . . . . . . . . . . . . . . . . . 68
5.2 Packet Routing Scheme . . . . . . . . . . . . . . . . . . . . . . . . . . . . . 70
5.2.1 SCH Packet Queueing and Serving . . . . . . . . . . . . . . . . . . 70
5.2.2 Gateway Discovery . . . . . . . . . . . . . . . . . . . . . . . . . . . 71
5.2.3 Packet Forwarding . . . . . . . . . . . . . . . . . . . . . . . . . . . 73
5.3 Performance Analysis . . . . . . . . . . . . . . . . . . . . . . . . . . . . . . 75
5.3.1 Highway Model . . . . . . . . . . . . . . . . . . . . . . . . . . . . . 78
5.3.2 Total Packet Arrival Rate . . . . . . . . . . . . . . . . . . . . . . . 80
5.3.3 End-to-end Packet Delay . . . . . . . . . . . . . . . . . . . . . . . . 83
5.3.4 Percentage of Occupied Time Slots . . . . . . . . . . . . . . . . . . 84
5.4 Numerical Results . . . . . . . . . . . . . . . . . . . . . . . . . . . . . . . . 85
5.4.1 Gateway Placement in a City Scenario . . . . . . . . . . . . . . . . 85
5.4.2 Packet Routing in a Highway Scenario . . . . . . . . . . . . . . . . 90
5.5 Summary . . . . . . . . . . . . . . . . . . . . . . . . . . . . . . . . . . . . 95
6 Conclusions and Future Works 97
6.1 Conclusions . . . . . . . . . . . . . . . . . . . . . . . . . . . . . . . . . . . 97
6.2 Further Research Topics . . . . . . . . . . . . . . . . . . . . . . . . . . . . 98
References 106
xiii


List of Figures
1.1 Illustration of a VANET. . . . . . . . . . . . . . . . . . . . . . . . . . . . . 2
1.2 The DSRC spectrum allocated by the FCC, with the effective isotropicallyradiated power (EIRP) limits as specified in the ASTM E2213 standard [1]for public RSUs. . . . . . . . . . . . . . . . . . . . . . . . . . . . . . . . . 2
1.3 Examples of safety applications based on V2R (Fig. 1.3a) and V2V (Fig. 1.3b)
communications as defined in [2]. . . . . . . . . . . . . . . . . . . . . . . . . 4
2.1 Right and left directions of vehicle movement. . . . . . . . . . . . . . . . . . . 12
2.2 Partitioning of each frame on the CCH into L,R and F sets. . . . . . . . . . . 12
3.1 Safety message queues. . . . . . . . . . . . . . . . . . . . . . . . . . . . . . . 16
3.2 Merging collision caused by node mobility. . . . . . . . . . . . . . . . . . . . . 17
3.3 VeMAC packet types. . . . . . . . . . . . . . . . . . . . . . . . . . . . . . . 18
3.4 The SRP condition preventing node x from unnecessarily releasing its time slot. 20
3.5 Node x offering a service to node z on channel c1. . . . . . . . . . . . . . . . . 24
3.6 Markov chain for Xn when K ≤ N . . . . . . . . . . . . . . . . . . . . . . . . 26
3.7 Markov chain for Xn when K > N . . . . . . . . . . . . . . . . . . . . . . . . 26
3.8 Probability that all nodes acquire a time slot within n frames. . . . . . . . . . 28
3.9 Average number of nodes acquiring a time slot within n frames. . . . . . . 29
3.10 A snap shot of the simulated highway segment. . . . . . . . . . . . . . . . . . 31
3.11 A snap shot of the simulated area of the city. . . . . . . . . . . . . . . . . . . 31
3.12 The number of vehicles acquiring a time slot for the three ADHOC MAC versions
in the highway scenario, at THSO = 0.6 (i.e., 60 vehicle/THS). . . . . . . . . . 35
xv

3.13 The rate of merging collisions in highway. . . . . . . . . . . . . . . . . . . . . 36
3.14 The rate of access collisions in highway. . . . . . . . . . . . . . . . . . . . . . 37
3.15 The Tx throughput in highway. . . . . . . . . . . . . . . . . . . . . . . . . . 37
3.16 The Rx throughput in highway. . . . . . . . . . . . . . . . . . . . . . . . . . 38
3.17 The rate of merging collisions in city. . . . . . . . . . . . . . . . . . . . . . . 39
3.18 The rate of access collisions in city. . . . . . . . . . . . . . . . . . . . . . . . 40
3.19 The Tx throughput in city. . . . . . . . . . . . . . . . . . . . . . . . . . . . . 40
3.20 The Rx throughput in city. . . . . . . . . . . . . . . . . . . . . . . . . . . . . 41
4.1 The CDF of the service delay, FWs , for a node moving in a left direction with
100 time slots per frame and 40 time slots associated with the left direction, i.e.,
L = 100 and |L| = 40. . . . . . . . . . . . . . . . . . . . . . . . . . . . . . . 50
4.2 The average total delay, W , of a single-fragment periodic message (nf = 1) for a
node moving in a left direction with 40 percent of the time slots associated with
the left direction, i.e., |L| = 0.4L. . . . . . . . . . . . . . . . . . . . . . . . . 50
4.3 The average total delay, W , of an event-driven safety message for a node moving in
a left direction with 40 percent of the time slots associated with the left direction,
i.e., |L| = 0.4L. . . . . . . . . . . . . . . . . . . . . . . . . . . . . . . . . . . 51
4.4 Analysis and simulation (Sim) results of the average delays for a node moving in
a left direction with k = 1 and |L| = 0.4L. . . . . . . . . . . . . . . . . . . . . 52
4.5 Average delays of a periodic safety message with nf = 4 for an RSU when I = 150,
|F| = 0.4L, and τ = 0. . . . . . . . . . . . . . . . . . . . . . . . . . . . . . . 54
4.6 Simulation results for the square network. . . . . . . . . . . . . . . . . . . . . 58
4.7 A snap shot of the simulations showing the road network with the simulated roads
in blue, a 2D view of the intersection of University/Seagram streets, and a 3D
view of the intersection of University/Westmount streets. . . . . . . . . . . . . 60
4.8 Simulation results for the city scenario: goodput, probability of a transmission
collision, and protocol overhead. . . . . . . . . . . . . . . . . . . . . . . . . . 62
4.9 Simulation results for the city scenario: total delay and fairness indicators of the
VeMAC protocol. . . . . . . . . . . . . . . . . . . . . . . . . . . . . . . . . . 64
5.1 The GDP relaying process based on a time slot assignment on the CCH. . . . . 72
xvi

5.2 Routing tables update during a GDP propagation. . . . . . . . . . . . . . . . 74
5.3 A relay vehicle with Ninput one-hop neighbours in comparison with an M/G(b)/1
queueing system with b = 16. . . . . . . . . . . . . . . . . . . . . . . . . . . . 77
5.4 Highway segment consisted of M hop-regions. . . . . . . . . . . . . . . . . . . 78
5.5 The number of deployed gateways versus ρmax for α = 0.8 and two different
communication ranges. . . . . . . . . . . . . . . . . . . . . . . . . . . . . . . 87
5.6 The number of deployed gateways versus vehicle traffic for R = 150 m. . . . . . 87
5.7 The locations of the deployed gateways for α = 0.8 and R = 250 m. . . . . . . . 88
5.8 The probability of reaching a gateway in a low traffic density for α = 0.7, ρmax =
3, and R = 250 m. . . . . . . . . . . . . . . . . . . . . . . . . . . . . . . . . 89
5.9 The average probability of reaching a gateway versus the threshold α for R = 250 m. 89
5.10 Total packet arrival rate λmr at the vehicles in each hop-region. . . . . . . . . . 91
5.11 Number of acquired time slots per frame kmr by each of the first five vehicles in
each hop-region for ηlane
= 30 vehicles/mile and λ = 10 packets/s. . . . . . . . . 92
5.12 Average percentage of occupied time slots per frame for each TH region for ηlane
=
67 vehicles/mile. . . . . . . . . . . . . . . . . . . . . . . . . . . . . . . . . . 93
5.13 Average end-to-end packet delay for each hop-region for nR = 10 and ηlane
=
30 vehicles/mile. . . . . . . . . . . . . . . . . . . . . . . . . . . . . . . . . . 95
xvii


List of Tables
3.1 Simulation parameters . . . . . . . . . . . . . . . . . . . . . . . . . . . . . . 30
3.2 The simulated protocols . . . . . . . . . . . . . . . . . . . . . . . . . . . . . 34
4.1 ns-2 simulation parameters . . . . . . . . . . . . . . . . . . . . . . . . . . . . 56
4.2 VISSIM simulation parameters . . . . . . . . . . . . . . . . . . . . . . . . . . 61
xix


List of Abbreviations
AcS Acceptance of Services.
AnS Announcement of Services.
HPSA High Priority Short Applications.
1PPS One Pulse Per Second.
A-opt ADHOC-optimal.
AC Access Category.
AE ADHOC-enhanced.
AIFS Arbitrary Interfram Space.
BSM Basic Safety Message.
CCH Control Channel.
CDF Cumulative Distribution Function.
CDMA Code Division Multiple Access.
CPThresh Capture Threshold.
CSThresh Carrier Sensing Threshold.
CTS Clear-To-Send.
CW Contention Window.
DSRC Dedicated Short Range Communications.
EDCA Enhanced Distributed Channel Access.
xxi

ETSI European Telecommunications Standards Institute.
FCC Federal Communication Comission.
FCS Frame Check Sequence.
GDP Gateway Discovery Packet.
GPS Global Positioning System.
GPSR Greedy Perimeter Stateless Routing.
HOL Head of Line.
i.i.d. Independent and Identically Distributed.
ID Identifier.
ITS Intelligent Transportation System.
LTE-A Long Term Evolution Advanced.
MAC Medium Access Control.
MANET Mobile Ad Hoc Network.
MPDU MAC Layer Protocol Data Unit.
MSDU MAC Layer Service Data Unit.
MTU Maximum Transmission Unit.
OBU On-Board Unit.
OFDM Orthogonal Frequency Division Multiplexing.
PDF Probability Density Function.
PDU Protocol Data Unit.
PGF Probability Generating Function.
PLCP Physical Layer Convergence Procedure.
PMF Probability Mass Funciton.
PN Pseudo Noise.
QoS Quality-of-Service.
xxii

RSU Road Side Unit.
RTS Request-To-Send.
RxThresh Receiving Threshold.
SCH Service Channel.
SDMA Space Division Multiple Access.
SRP Slot Release Prevention.
TDMA Time Division Multiple Access.
TH Two Hop.
THS Two-Hop Set.
THSO Two-Hop Set Occupancy.
TTL Time-To-Live.
USDoT United States Department of Transportation.
UW University of Waterloo.
V-inf VeMAC with τ =∞.
V0 VeMAC with τ = 0.
V2R Vehicle-To-Road Side Unit.
V2V Vehicle-To-Vehicle.
VANET Vehicular Ad Hoc Network.
VSC Vehicle Safety Communications.
xxiii


List of Symbols
αi Minimum probability threshold required to a vehicle located at the ith cell toconnect to each of νi gateways
βi Index set of all gateways which can be reached by a vehicle located in cell iwithin ρmax hops
η Rate of the Poisson process which represents the distribution of the vehiclesalong a highway segment at any time instant
ηlane Rate of the Poisson process which represents the distribution of the vehiclesin each lane of a highway segment at any time instant
γj Cost of deploying a gateway at the jth location
λ Arrival rate of event-driven safety messages (Chapter 4) or packet generationrate at the application layer of each vehicle (Chapter 5)
λmr Total packet arrival rate at the rth vehicle in the mth hop-region
λv Rate of vehicle arrival from each possible entry of the road network in theVISSIM simulations
E(X) Expected value of a random variable X
Ax Set of time slots that node x can attempt to access on the control channel
Dx Set of one-hop neighbors of node x which have not successfully received acertain packet broadcasted on the control channel (possibly by node x itself)
F Set of time slots on the control channel associated with road side units
J Optimal set of gateway location indices
xxv

L Set of time slots on the control channel associated with vehicles moving to theleft directions
Nx Set of one-hop neighbours of node x, from which node x has received VeMACType1 packets on the control channel in the previous L slots
Qx Set of time slots acquired by node x on the control channel
R Set of time slots on the control channel associated with vehicles moving to theright directions
Rx Set of potential relays included by vehicle x in a broadcasted gateway discoverypacket
Tx Set of time slots that node x must not use on the control channel in the nextL time slots
T mx Set of time slots that node x must not use on channel cm in the next lm timeslots
E Event (probability theory)
Gm Event that random variable Gm takes a value gm
Hm Event that random variable Hm takes a value hm
Nm Event that random variable Nm takes a value nm
Umi,r Event that the ith vehicle in the mth hop-region exists and its communication
range can reach the rth vehicle in the (m− 1)st hop-region
Vmi,r Event that the ith vehicle in the mth hop-region exists and uses the rth vehicle
in the (m− 1)st hop-region as a relay to a gateway
Wmi Event that Wm
i takes a value wmi
min(x, y) Minimum of x and y
µn Average number of contending nodes which acquire a time slot within n framesobtained from mathematical analysis
µsimn Average number of contending nodes which acquire a time slot within n framesobtained from computer simulations
xxvi
νi Number of gateways that a vehicle located at the ith cell can connect to, eachwith a probability not less than a threshold αi
X2 Second moment of a random variable X
X First moment of a random variable X
Π(z) Probability generating function of the number of packets in the queue justbefore the start of the service time of a head of line batch
πj The (j − 1)st constant among the b constants in Π(z)
ρmax Maximum allowed value of ρj for any j
ρj Maximum number of hops that a gateway deployed at the jth location can useto connect to a certain vehicle
σijk Probability that a vehicle at the ith cell can reach a gateway at the jth positionwithin k hops
τ VeMAC split up parameter
BXadd Additive part of the safety distance
BXmult Multiplicative part of the safety distance
IDxk VeMAC ID used by node x to access time slot k
Lengthh Length of the highway segment simulated in MATLAB
Lengths Length of a street in the city scenario simulated in MATLAB
M/G(b)/1 A queueing system with Poisson arrival of customers and independent time in-tervals between successive occasions of service, where the customers are servedin batches of a maximum batch-size b
% Average number of packet arrivals to an M/G(b)/1 between two successiveoccasions of service divided by the batch-size b
ϑmx Set of time slots over which a provider node x offers a service on service channelcm
Nm Total number of vehicles in the mth hop-region which can reach at least onevehicle in the (m+ 1)st hop-region
xxvii

ξi Packet arrival rate coming to a relay vehicle from its ith one-hop neighbour
Anr Number of ways of obtaining an ordered subset of r elements from a set of nelements
amy Time slot over which a user node x transmits an acknowledgement packet onservice channel cm
b Batch-size, i.e., the maximum number of packets that a node can announceover a time slot on the control channel to be transmitted on the same servicechannel
ci Service channel number i
Cnr Number of ways of obtaining a subset of r elements from a set of n elements
dmax A delay threshold on the average packet delay required to be achieved at eachvehicle
Dmr Average packet delay at a randomly chosen relay in the mth hop-region
Dmv Average packet delay at a randomly chosen vehicle in the mth hop-region
Em Average end-to-end delay from a randomly chosen vehicle in themth hop-regionto a gateway
Fn Probability that a specific node (among the contending ones) acquires a timeslot within n frames
F alln Probability that all the contending nodes acquire a time slot within n frames
FX Cumulative distribution function of a discrete random variable
fX Probability mass function of a discrete random variable
G′X(z) Derivative of GX(z) with respect to z
Gm Gap between the first vehicle in the mth hop-region and the farthest edge ofthe region with respect to the gateway
GX Probability generating function of a discrete random variable which takes non-negative integer values
xxviii

Hm Distance separating the first vehicle in the mth hop-region and that in the(m− 1)st hop-region
I Inter-arrival time of periodic safety messages
I(a<b) Indicator variable which equals 1 if a < b and equals 0 otherwise
Imi,r Indicator variable which equals 1 whenever event Vmi,r occurs, and equals 0
otherwise.
J Index of a time slot at the start of which a safety message becomes the headof line
K Total number of nodes which need to acquire a time slot on the control channel
k Number of time slots that a node acquires per frame
K(z) Probability generating function of the number of packet arrivals during Smr
ke Number of event-driven time slots that a node acquires per frame on the controlchannel
kp Number of periodic time slots that a node acquires per frame on the controlchannel
kmr Number of time slots that the rth vehicle in the mth hop-region acquires perframe, over which the vehicle can transmit VeMAC Type1 packets
L Number of time slots per frame on the control channel
lm Number of time slots per frame on channel cm
M Number of hop-regions which partition a highway segment
Mi,j Entry of a matrix M , located at the ith row and jth column
N Number of available time slots in a frame
Ncells Total number of road cells under consideration
Ngate Total number of potential gateway locations
Nlanes Number of lanes of a highway segment
xxix

Nc Number of contending nodes attempting to acquire a specific time slot
Nf Number of periodic safety message fragments queued before a tagged fragmentwithin a batch
nf Total number of fragments of a periodic safety message
Nm Number of vehicles located in the mth hop-region
Nq Total number of vehicles successfully acquiring a time slot
Ns Total number of streets in the city scenario simulated in MATLAB
Nv Total number of vehicles used for MATLAB simulations in highway and cityscenarios
Ninput Number of one-hop neighbours of a relay vehicle
Nsch Number of service channels
Nmax Maximum number of nodes which can exist in a two-hop set
Nxsucc Number of nodes in the two-hop neighbourhood of node x which have success-
fully acquired a time slot
Om Total number of time slots used by all the vehicles in the mth hop-region
P One-step transition probability matrix of a Markov chain
P n n-step transition probability matrix of a Markov chain
pacc Probability of accessing an available time slot in the ADHOC MAC protocol
pij Transition probability from state i to state j in a Markov chain
popt Optimal probability of accessing an available time slot
Qmr Packet queueing delay at the rth vehicle in the mth hop-region
R Communication range
rx Ratio of the number of safety messages transmitted by node x to the totalnumber of safety messages transmitted by all nodes during the simulationtime
xxx

Smr Time duration (in the unit of a time slot) between successive occasions ofannouncement for a head of line batch on the control channel
sx Total number of safety messages generated at node x normalized by the totalnumber of safety messages generated at all nodes during the simulation time
t Duration of a time slot on the control channel
Tm Total number of time slots used by all the vehicles in the mth two-hop region
tx One of the time slots acquired by node x on the control channel
tin Total time of arrival of vehicles to the road network in the VISSIM simulations
tw Warm up period in the VISSIM simulations
Vm Total number of time slots used by Nm
W Total delay (sum of the service delay and queueing delay)
W (l, u, v) Number of ways by which l nodes can acquire a time slot given that thereare u contending nodes each randomly choosing a time slot among v availabletime slots
Wb Total service delay of a batch of fragments of a periodic safety message
Wmi Distance between the first vehicle in the mth hop-region and the ith vehicle (if
exists) in the same region
Wq Queueing delay
Ws Service delay
Wq1 Delay since a batch of fragments of a periodic safety enters the queue until thefirst fragment of the batch becomes the head of line
Wq2 Service delay of all the periodic safety message fragments queued before atagged fragment within a batch
xj Binary decision variable which equals 1 iff a gateway is deployed at the jth
potential gateway location
Xn Total number of nodes which acquired a time slot within n frame
xxxi

yjk Binary decision variable which equals 1 iff a gateway is deployed at the jth
location and has ρj = k
zij Binary decision variable which equals 1 if [only if] a gateway is deployed atthe jth location and can reach a vehicle at the ith cell within ρj hops with aprobability greater than [greater than or equal to] αi
AX Average standstill distance
xxxii

Chapter 1
Introduction
1.1 Vehicular Ad Hoc Networks
An ad hoc network is defined as a collection of nodes dynamically forming a networkwithout any existing infrastructure or centralized administration. One special type ofmobile ad hoc networks is the network among moving vehicles, which is known as vehicularad hoc network (VANET). A VANET is an emerging technology which consists of a set ofvehicles, each equipped with a communication device called on-board unit (OBU), and a setof stationary units along the road, referred to as road side units (RSUs). As shown in Fig.1.1, some RSUs can act as a gateway for connectivity to other communication networks,such as the Internet. Each vehicle OBU has a wireless network interface which allows thevehicle to directly connect to other vehicles and RSUs within its communication range,as well as a wireless or wired interfaces to which application units can be attached. Byemploying vehicle-to-vehicle (V2V) and vehicle-to-RSU (V2R) communications, VANETscan support a wide variety of applications in road safety, passenger infotainment, andvehicle traffic optimization [2, 3, 4], which is the main reason that VANETs have receivedsignificant support from government, academia, and industrial organizations over the globe.
Motivated by the importance of vehicular communications, in 1999, the United StatesFederal Communication Comission (FCC) has allocated 75 MHz radio spectrum in the 5.9GHz band for dedicated short range communications (DSRC) to be exclusively used by V2Vand V2R communications. Similarly, in 2008, the European Telecommunications StandardsInstitute (ETSI) has allocated 30 MHz of spectrum (also in the 5.9 GHz band) for IntelligentTransportation System (ITS) applications. As shown in Fig. 1.2, the DSRC spectrum isdivided into seven 10 MHz channels: six service channels for safety and non-safety related
1

1. Introduction
Figure 1.1: Illustration of a VANET.
Figure 1.2: The DSRC spectrum allocated by the FCC, with the effective isotropicallyradiated power (EIRP) limits as specified in the ASTM E2213 standard [1] for public
RSUs.
2

1.2. VANET Applications
applications, and one control channel for transmission of control information and highpriority safety messages. Such allocation of radio spectrum for vehicular communicationshas motivated the establishment of many national and international research projects, e.g.,[5, 6, 7, 8, 9, 10, 11, 12, 13, 14], which are all dedicated to the research in VANETs. Everyproject has its unique objectives, focusing on safety related applications [11, 12], securityof vehicular communications [7, 8], the development of a simulation platform for V2V andV2R communications [14], and so on.
1.2 VANET Applications
1.2.1 Safety Applications
The primary category of VANET applications is to enhance the public safety standards andprovide a safer environment for drivers/passengers and pedestrians on road. For instance,at a signalized intersection as shown in Fig. 1.3a, an RSU can continuously broadcast tothe approaching vehicles information about the traffic signal status and timing, stoppinglocation, type of road surface, weather conditions, etc. Then, based on this broadcastinformation, the in-vehicle system can predict a traffic signal violation and give a warningto the driver, or advise him/her with an optimal speed to reach the traffic signal during thegreen light phase. Fig. 1.3b illustrates examples of safety applications that are based onV2V communications. As shown in Fig. 1.3b, if a vehicle suddenly breaks, it broadcastsinformation about its current status (i.e., position, speed, deceleration, etc.), which is usedby the surrounding vehicles to early detect the sudden brake, even in limited visibilityconditions, such as due to heavy fog. In case a vehicle senses that a crash is unavoidable,necessary actions such as extending the front bumper or pre-arming the airbags can betaken to reduce the severity of the crash.
In order to estimate the potential benefits of VANET safety applications and definetheir communication requirements, the Vehicle Safety Communications (VSC) project [2]has been established by seven car manufacturers (including GM, BMW, and Ford), inpartnership with the United States Department of Transportation (USDoT). In the VSCproject, the VANET safety applications are classified into periodic and event-driven safetyapplications, based on the way that the corresponding safety messages are transmitted byeach node (i.e., vehicle or RSU). The periodic safety applications (e.g., blind spot warning)require automatic transmission of safety messages by each node at regular time intervals,while the event-driven safety applications (e.g., road condition warning [2]) require trans-mission of safety messages only in case of an event such as a hard brake, approaching an
3

1. Introduction
(a) Traffic signal violation warning and green light optimal speed advisory
(b) Emergency electronic brake light and pre-crash sensing
Figure 1.3: Examples of safety applications based on V2R (Fig. 1.3a) and V2V (Fig. 1.3b)communications as defined in [2].
4

1.3. MAC in VANETs
emergency vehicle, and dangerous road condition detection. The applications in Fig. 1.3aand 1.3b are examples of periodic and event-driven safety applications respectively [2].
Most (if not all) of the safety applications are based on broadcasting of safety messages,either periodic or event-driven, to all the nodes within the communication range. Forinstance, as shown in Fig. 1.3, the information broadcast by the RSU (Fig. 1.3a) or bythe breaking vehicle (Fig. 1.3b) should be successfully delivered to all the surroundingvehicles with a high level of precision and without any excess delay. Given that anyinaccuracy in the broadcast safety messages may result in serious consequences, such asdamage of vehicles or injuries of drivers and passengers, it is necessary to develop a mediumaccess control (MAC) protocol which provides an efficient broadcast service, in order tosupport the quality-of-service (QoS) requirements of the high priority safety applicationsin VANETs.
1.2.2 In-vehicle Internet Access
Although safety applications are the key motivation for VANETs, the applications targetingpassenger infotainment have been gaining significant interests [4]. Infotainment improvesthe driving experience, makes the trips more enjoyable, and may accelerate the deploymentof VANETs due to a small market penetration requirement as compared to that needed formost of the safety applications [15]. One of the main infotainment services of VANETs is in-vehicle Internet access, which allows a vehicle to connect to the Internet by communicatingwith Internet gateways deployed along the road sides [4]. A vehicle can communicate witha gateway either directly (when they are within the communication range of each other) orvia multihop communications, i.e., by using other vehicles to relay data packets to/fromthe gateway. In order to support multihop in-vehicle Internet access, a routing protocol isrequired to allow a vehicle to discover the existence of an Internet gateway, and to deliverdata packets between a vehicle and a gateway via multihop communications. Additionally,a gateway deployment strategy should be employed in order to determine optimal locationsof Internet gateways, which ensure that a vehicle can connect to the Internet (i.e., can finda network path to an Internet gateway) with a probability greater than an acceptablethreshold.
1.3 MAC in VANETs
Various MAC protocols have been proposed for VANETs, based either on IEEE 802.11 oron channelization such as space division multiple access (SDMA), code division multiple
5

1. Introduction
access (CDMA), and time division multiple access (TDMA). In SDMA schemes, eachvehicle decides whether or not it is allowed to access the channel based on its location onthe road [16, 17]. An SDMA scheme consists of the following three components. First, adiscretization procedure divides the road into small areas called cells. Each cell may containone [16] or more vehicles [17] based on the size of the cell determined by the SDMA scheme.Second, a mapping function assigns to each of the cells a unique time slot. To avoid thehidden terminal problem, two cells are assigned the same time slot only if the distancebetween them is greater than twice of the communication range. Third, an assignmentrule specifies which time slots a vehicle is allowed to access based on its current location.For any SDMA scheme, the vehicles should be able to correctly determine their currentposition, store the mapping of the cells into time slots, and synchronize to a commonreference. One main problem of SDMA schemes is that, when most of the cells on a roadare unoccupied by vehicles, the unused time slots assigned to these cells represent a wasteof bandwidth.
Similarly, CDMA is proposed for MAC in VANETs due to its robustness against inter-ference and noise [18, 19]. The main issue which arises with CDMA in VANETs is how toallocate the pseudo noise (PN) codes to different vehicles. Due to a large number of vehi-cles, if every vehicle is assigned a unique PN code, the length of these codes will becomeextremely long, and the required bit rates for VANET applications may not be attained.Consequently, it is mandatory that the PN codes be shared among different vehicles ina dynamic and fully distributed way. One solution for distributed PN code allocation isto provide each node with several filters matched to the available PN codes, which areshared by all nodes [18]. Then, each node attempts to select a PN code that is not used byother nodes within its communication range, by selecting the PN code corresponding tothe matched filter which gives the minimal output. However, this scheme suffers from thehidden terminal problem, and its implementation is impractical due to its requirement ofa matched filter for each PN code. Although the number of matched filters can be reducedby using a location based PN allocation scheme [19], the complexity of these matched fil-ters increases since they need to be adaptive. That is, each filter should match to differentPN codes based on the area where the vehicle is currently located. The complexity ofimplementation is the main disadvantage of CDMA schemes.
The ADHOC MAC is the most well known TDMA protocol proposed for inter-vehiclecommunication networks [20]. The ADHOC MAC protocol operates in a time slotted struc-ture, where time slots are grouped into virtual frames, i.e., no frame alignment is needed.By letting each node report the status of all the time slots in the previous (sliding) vir-tual frame, the ADHOC MAC can support an acknowledged broadcast service without thehidden terminal problem [20]. However, the ADHOC MAC protocol has major limitations
6

1.4. Routing in VANETs
which significantly degrades its performance, as will be discussed in details in Subsection3.5.3. On the other hand, the main solution currently proposed for MAC in VANETs is theIEEE 802.11p standard [21]. The protocol is based on the legacy IEEE 802.11 standard[22] which is widely implemented, with new parameter values for the enhanced distributedchannel access (EDCA) [22, 21] scheme to be used for communications over the controlchannel (CCH) (as recommended by the IEEE 1609.4 standard [23]). However, as will beexplained in Section 4.3, the IEEE 802.11p standard does not provide a reliable broadcastservice, which considerably reduces its ability to support the periodic and event-drivensafety applications in VANETs.
1.4 Routing in VANETs
The routing protocols proposed for point-to-point communications in VANETs can be clas-sified into topology-based and position-based protocols. Topology based protocols makethe routing decisions relying mainly on information about the topology of the network.That is, they use the information about the existence of communication links among dif-ferent nodes to determine which path a packet should be routed through. This class can becategorized into proactive and reactive protocols. In proactive protocols [24, 25], the nexthop to a certain destination can be directly found from a routing table stored at each node,while in reactive protocols [26, 27, 28], a route discovery procedure is initiated before thestart of transmission of data packets between the source and destination nodes. Also, thereexist hybrid proactive-reactive protocols [29], which proactively maintain routing informa-tion in a local neighborhood, and reactively discover the paths to destinations beyond thislocal neighborhood. Most of the topology-based routing protocols are originally designedfor mobile ad hoc networks (MANETs) and do not consider the special characteristics ofa VANET. In VANETs, due to a large number and high mobility of nodes, link failuresoccur more frequently than in a regular MANET. Consequently, the control packets re-quired to update the routing tables for proactive protocols [24, 25] or to find/repair thenetwork routes for reactive protocols represent a great overhead which can degrade theVANET performance. Also, each time a link failure occurs, a certain delay is requireduntil this failure information propagates throughout the network and updates the routingtable stored at each node (for proactive protocols) or until a source node re-initiates aroute discovery procedure to find a new route to a destination node (for reactive proto-cols). During this delay, each packet which is en route to a destination through an invalidroute will potentially be lost.
The second class of routing protocols, known as the position-based protocols [30, 31, 32],
7

1. Introduction
makes routing decisions based solely on position information, and without reliance on anytopology information. Each relay node is aware of the positions of its one-hop neighborsas well as the position of the destination node. The position of the destination node isdetermined by the mean of a location service [33, 34, 35], while the positions of one-hopneighbors are determined by using a neighbor discovery algorithm, such as the exchange ofHello messages. Based on this position information, each relay node forwards a packet toa candidate among its one hop-neighbors, which is expected to deliver the packet closer orfaster to the final destination. The position-based protocols have some disadvantages whichmay decrease their chances to be applied in a VANET. First, it is not guaranteed that alocation service will exist in VANETs to inform the source node about the location of thedestination node. Additionally, even if a location service exists, the query of this locationservice before the transmission of each packet represents a considerable routing overheadwhich is completely neglected in the evaluation of position based protocols: it is assumedthat each packet header contains the correct position of the destination without consideringany additional overhead. Second, the greedy forwarding strategy, which is employed byposition-based protocols, is based on forwarding a packet to the one-hop neighbor closest tothe destination (either the real destination [30] or the next road intersection [32]). By usingthis strategy, a packet can reach a node which cannot find other neighbors closer to thedestination than itself. In this case the packet is said to have reached a local maximum,which is a likely situation in VANETs, especially in city scenarios. The position-basedprotocols deal with this situation by switching from the greedy forwarding to a recoverystrategy. However, the proposed recovery strategies are inefficient in terms of the hopnumber and packet delivery delay, and some of which may even fail to deliver a packetto the destination [31, 36]. Note that, the long delivery delay decreases the probability ofsuccessful delivery of a packet since the destination position stored in the packet headerbecomes less accurate due to mobility of the destination.
1.5 Thesis Objectives and Outline
Motivated by the limitations of the current networking schemes proposed for VANETs, asdiscussed in Sections 1.3 and 1.4, this thesis has the following objectives:
1. to introduce a multichannel TDMA MAC protocol which can provide a reliable one-hope broadcast service, necessary to support the QoS requirements of VANET peri-odic and event-driven safety applications;
8

1.5. Thesis Objectives and Outline
2. to present a strategy for deploying Internet gateways on the roads, in order to mini-mize the total cost of gateway deployment, and ensure multihop in-vehicle Internetaccess with a probability greater than a specified threshold;
3. to develop a data routing protocol, consisting of gateway discovery and packet for-warding schemes, to allow a vehicle to communicate with an Internet gateway byusing multihop communications.
The rest of the thesis is organized as follows. Chapter 2 describes the system model underconsideration, while Chapter 3 introduces a novel multichannel TDMA protocol, calledVeMAC, and compares its performance with that of ADHOC MAC, via simulations inhighway and city scenarios [37, 38, 39]. The ability of the VeMAC protocol to supportperiodic and event-driven safety messages is investigated in Chapter 4 in comparison withthe IEEE 802.11p standard [40, 41]. This performance evaluation is done by presentinga detailed delivery delay analysis for periodic and event-driven safety messages, and con-ducting computer simulations in a realistic city scenario consisting of roads around theUniversity of Waterloo (UW). Chapter 5 first explains a new strategy for deploying In-ternet gateways on the roads, then proposes a packet routing scheme, designed over theVeMAC protocol, for multihop in-vehicle Internet access [42, 43]. The gateway deploymentstrategy is applied for optimal placement of Internet gateways around the UW campus,while the proposed routing scheme is evaluated in a highway scenario, in terms of differentperformance metrics, including the end-to-end packet delivery delay. Finally, Chapter 6concludes this thesis and suggests some further research topics.
9


Chapter 2
System Model
2.1 VANET Description: Elements and Applications
The VANET under consideration consists of a set of RSUs and a set of vehicles movingin opposite directions on two-way vehicle traffic roads. A vehicle is said to be moving ina left (right) direction if it is currently heading to any direction from north/south to west(east). Based on this definition, as shown in Fig. 2.1, if two vehicles are moving in oppositedirections on a two-way road, regardless of the orientation of the road, it is guaranteedthat one vehicle is moving in a left direction while the other vehicle is moving in a rightone. The vehicles and RSUs broadcast periodic and event-driven safety messages for thepurpose of safety applications. The periodic safety messages broadcast by different vehicleshave the same (fixed) message size1. Similarly, the periodic safety messages broadcast byan RSU have equal message size, which may differ from the size of the periodic messagesbroadcast by another RSU depending on the application. Also, a set of gateways is placedalong the road sides to provide Internet connectivity to the vehicles. The vehicles employmultihop communications to connect to the gateways, and a gateway can communicateonly with the vehicles located within a maximum number of hops from the gateway. Thelocation of each gateway and the maximum number of hops that it can use to communicatewith a vehicle are determined as described in Chapter 5.
1A generic safety message format, called the Basic Safety Message (BSM), is specified in the SAEJ2735 application layer standard [44] to be periodically broadcast by vehicles. The BSM exploits the largeoverlap among the vehicle state information required by various V2V applications in order to avoid usingapplication-specific messages and wasting the wireless network resources [45].
11

2. System Model
Figure 2.1: Right and left directions of vehicle movement.
Figure 2.2: Partitioning of each frame on the CCH into L,R and F sets.
2.2 Communications Channels
The VANET has one CCH and Nsch service channels (SCHs), denoted by c1, c2, . . . , cNsch.
The CCH is used for transmission of two kinds of information: high priority short applica-tions (such as periodic or event driven safety messages), and control information requiredfor the nodes to organize the communications over the service channels. The Nsch SCHs areused for transmission of safety or non-safety related application messages. It is assumedthat the transmission power levels on all channels are fixed and known to all nodes. Allchannels are symmetric, in the sense that node x is in the communication range of node yif and only if node y is in the communication range of node x.
On the CCH, the time is partitioned to frames consisting of a constant number L oftime slots of equal duration t. Each frame is partitioned into three sets of time slots: L, R,and F , in that order, as shown in Fig. 2.2. The F set is associated with RSUs, while theL and R sets are associated with vehicles moving in left and right directions respectively.Each second contains an integer (fixed) number of frames, and each time slot is identifiedby the index (from 0 to L− 1) of the time slot within a frame.
12

2.3. Node Equipment and Identification
2.3 Node Equipment and Identification
Each node (i.e., vehicle or RSU) has two transceivers: Transceiver1 is always tuned to theCCH, while Transceiver2 switches among the SCHs. Also, each node is equipped with aglobal positioning system (GPS) receiver and can accurately determine its position andmoving direction using GPS. The current position of each node is included in the headerof each packet transmitted on the CCH. Each node is identified by a unique MAC addressand a set of short identifiers (IDs), called VeMAC IDs, where each VeMAC ID correspondsto a certain time slot that the node is accessing per frame on the CCH (more details inChapter 3). Each VeMAC ID is chosen by a node at random, included in the header ofeach packet transmitted in the corresponding time slot, and changed if the node detectsthat its ID is already in use by another node [20].
2.4 Time Slot Synchronization
Synchronization among nodes is performed using the one pulse per second (1PPS) signalprovided by any GPS receiver. The rising edge of this 1PPS is aligned with the startof every GPS second with accuracy within 100 ns even for inexpensive GPS receivers.Consequently, this accurate 1PPS signal can be used as a common time reference amongall the nodes. Hence, at any instant, each node can determine the index of the currentslot within a frame on the CCH, and whether it belongs to the L, R, or F set. In caseof a temporary loss of GPS signal, the synchronization among different nodes can still bemaintained within a certain accuracy for a time duration which depends on the stability ofthe GPS receiver’s local oscillator at each node [46]. If the GPS signal is lost in a certainarea for a long duration (longer than a specified threshold), a distributed synchronizationscheme, such as the one presented in [46], should be employed until the GPS signal isrecovered. Details of such a back up synchronization scheme are out of scope of this thesis.
2.5 Definitions
For a certain node, x, set Nx denotes the set of one-hop neighbours of node x, from whichnode x has received VeMAC Type1 packets (defined in Section 3.1.3) on the CCH in theprevious L slots. Set Tx is defined as the set of time slots that node x must not use on theCCH in the next L time slots. This set is used by node x to determine which time slots it
13

2. System Model
can access on the CCH without causing any hidden terminal problem. How each node xconstructs and updates sets Nx and Tx is discussed in Chapter 3.
A two-hop set (THS) is defined as a set of nodes in which each node can reach anyother node in two hops at most. The term ‘message’ refers to a MAC layer service dataunit (MSDU), i.e., the unit of information arriving to the MAC layer entity from the layerabove. On the other hand, the term ‘packet’ refers to either a MAC layer protocol dataunit (MPDU) (in Chapters 3 and 4), or a network layer protocol data unit (PDU) (inChapter 5).
14

Chapter 3
VeMAC: A TDMA MAC Protocolfor Reliable Broadcast in VANETs
This chapter presents VeMAC, a novel multichannel TDMA protocol developed specificallyfor a VANET scenario [37, 38, 39]. The VeMAC supports an efficient one-hop broadcastservices on the CCH, by using implicit acknowledgments and eliminating the hidden termi-nal problem, in order to successfully deliver both periodic and event-driven safety messagesin VANETs. The protocol reduces transmission collisions due to node mobility on the con-trol channel by assigning disjoint sets of time slots to vehicles moving in opposite directionsand to road side units. Analysis and simulation results in highway and city scenarios arepresented to evaluate the performance of VeMAC and compare it with ADHOC MAC[20]. It is shown that, due to its ability to decrease the rate of transmission collisions, theVeMAC protocol can provide significantly higher throughput on the CCH than ADHOCMAC.
3.1 VeMAC Basics
3.1.1 Safety Message Queueing and Service
As discussed in Section 2.1, the vehicles and RSUs broadcast periodic and event-drivensafety messages on the CCH for the purpose of safety applications, and the periodic safetymessages broadcast by different vehicles have the same (fixed) message size. As shown inFig. 3.1, at each node, the periodic and event-driven safety messages are mapped to two
15

3. VeMAC: A TDMA MAC Protocol for Reliable Broadcast in VANETs
Figure 3.1: Safety message queues.
different queues, which are served independently by the VeMAC protocol, as described indetails in Section 3.2.
Based on a given transmission rate determined by the physical layer, the VeMACmaximum transmission unit (MTU) is defined as the maximum amount of data (withoutthe physical layer overhead) which can be transmitted in the duration of one time slot. Theduration of a time slot, t, is chosen such that the MTU is equal to the size of a periodic safetymessage broadcast by a vehicle plus the maximum size of control information introduced bythe VeMAC protocol. For RSUs, if the size of a periodic safety message plus the VeMACcontrol information exceeds the MTU, the message is fragmented to be transmitted asmultiple VeMAC packets, as indicated in Fig. 3.1. This fragmentation is typical forapplications such as curve speed warning and left turn assistant [2], in which the size of aperiodic safety message broadcast by an RSU is considerably larger than that of the periodicmessages broadcast by vehicles [2]. On the other hand, all the event-driven safety messagesare assumed to be small enough to fit in a single VeMAC packet, without fragmentation.Each VeMAC packet carries at most one safety message and only one VeMAC packet canbe transmitted per time slot.
In the VeMAC protocol, in order to serve the two safety message queues in Fig. 3.1,each node must acquire at least one time slot per frame on the CCH. A time slot acquired
16

3.1. VeMAC Basics
Figure 3.2: Merging collision caused by node mobility.
by a certain node is referred to as a periodic or event-driven slot, according to the type ofthe safety message transmitted during this time slot. The number of periodic slots thatthe node acquires per frame, denoted by kp, depends on the fixed size and arrival rate ofthe periodic safety messages. Similarly, the number of event-driven slots that the node canaccess per frame, denoted by ke, depends on the average arrival rate of the event-drivensafety messages. A node should use a unique VeMAC ID to access each of the kp and keslots. As mentioned in Section 2.3, each VeMAC ID is chosen by the node at random,included in the header of each packet transmitted in the corresponding time slot, andchanged if the node detects that its VeMAC ID is already in use by another node [20].The kp and ke values are chosen such as to satisfy the delay constraints of the periodicand event-driven safety messages based on the delay analysis in Chapter 4. Once a nodeacquires a periodic or event-driven slot, it keeps using the same slot in all subsequentframes unless there is no packet waiting for transmission in the corresponding queue or atransmission collision is detected.
3.1.2 Transmission Collision Types on The CCH
Two types of transmission collision can happen on the CCH: access collision and mergingcollision. An access collision happens when two or more members of the same THS attemptto acquire the same available time slot. On the other hand, a merging collision happenswhen two or more nodes acquiring the same time slot become members of the same THSdue to node activation or node mobility. In VANETs, merging collisions are more likely tooccur among vehicles moving in opposite directions or between a vehicle and a stationaryRSU since they approach each other with a much higher relative velocity as compared tovehicles moving in the same direction. For example, in Fig. 3.2, if vehicle x moves to THS2and if x is using the same time slot as z, then collision will occur at y. Upon detection of a
17

3. VeMAC: A TDMA MAC Protocol for Reliable Broadcast in VANETs
(a) Type1 packet
(b) Type2 packet
Figure 3.3: VeMAC packet types.
merging collision on the CCH, each colliding node should release its time slot and acquirea new one, which may generate more access collisions.
3.1.3 VeMAC Packet Types
Two different types of VeMAC packets can be transmitted on the CCH, as shown in Fig.3.3. A Type1 packet is divided into four main fields: Type1 header, announcement ofservices (AnS ), acceptance of services (AcS ), and high priority short applications (HPSA).The HPSA field is to include the periodic and event-driven safety messages, while the AnSand AcS fields are used to control the communications over the SCHs. A Type2 packetdoes not contain any control information: it consists of an HPSA field and a short Type2header (the difference between Type1 and Type2 headers will be discussed). Each nodemust transmit exactly one Type1 packet in each frame using one of its acquired periodictime slots, and if the node is accessing more than one time slot per frame, Type2 packetsare transmitted over the rest of time slots. The transmission of one Type1 packet in eachframe is mandatory since the information in the Type1 header, AnS and AcS fields, isnecessary for other nodes to decide which time slots they can access on the CCH andSCHs. On the other hand, the transmission of Type2 packets is to decrease the protocoloverhead by removing all the control information which needs to be transmitted only onceper frame. As the event-driven safety messages are always transmitted using Type2 packets(i.e., without control information and with a large HPSA field in the packet), fragmentationis not considered for this type of safety messages.
3.2 CCH Access
For the purpose of time slot assignment on the CCH, in the header of each Type1 packettransmitted on the CCH, the transmitting node x should broadcast the VeMAC ID(s) and
18

3.2. CCH Access
the corresponding time slot(s) of each node in set Nx. The short length of a VeMAC ID(9 bits as suggested in Chapter 4) serves to decrease the protocol overhead as comparedto broadcasting the corresponding MAC address. The main difference between Type1 andType2 headers is that the Type2 one is shorter as it does not contain the VeMAC IDs orthe corresponding time slots of the nodes in set Nx. Now, suppose node x is just poweredon and needs to acquire a time slot. By listening to the CCH for L successive time slots(not necessarily in the same frame), node x can determine set Nx and the time slot(s)used by each node in Nx. Also, since each one-hop neighbour y ∈ Nx announces (in theheader of its transmitted Type1 packet) the time slot(s) used by each node in Ny, node xcan determine all the time slots used by each of its two-hop neighbours, z ∈ Ny, z /∈ Nx,∀y ∈ Nx. Accordingly, node x sets Tx to the set of time slots used by all nodes within itstwo-hop neighbourhood. Then, sets Nx and Tx are updated by node x at the end of eachtime slot (always based on the packets received in the previous L slots).
Given Tx, node x determines the set of accessible time slots, Ax, (to be discussed) andthen attempts to acquire a time slot by randomly accessing any time slot in Ax, say timeslot k. If no other node in the two-hop neighbourhood of node x simultaneously attemptsto acquire time slot k, then no access collision happens. In this case, the attempt of node xis successful and each one-hop neighbour w of node x adds node x to set Nw and record theVeMAC ID used by node x to access time slot k, denoted by IDx
k. On the other hand, if atleast one node within the two-hop neighbourhood of node x accesses time slot k, then allthe transmissions in the slot fail and time slot k is not acquired by any of the contendingnodes. Node x will determine whether or not its attempt was successful by observing theL− 1 time slots following k. The attempt of node x is considered successful iff the Type1packet received from each node w ∈ Nx includes IDx
k in its headers. Otherwise, node xre-accesses one of the time slots in Ax until it successfully acquires a time slot. Oncenode x acquires a time slot, it keeps using the same slot in all subsequent frames unless amerging collision happens. Similar to an access collision, a merging collision on time slotk is detected by node x as soon as it receives a Type1 packet from a node w ∈ Nx withoutincluding IDx
k in its header. Upon detection of a merging collision, each colliding nodeshould release its time slot and acquire a new one using the same procedure. In order toacquire more than one time slot per frame, node x employs the same procedure using aunique VeMAC ID for accessing each extra time slot.
At the end of each time slot, the collision detection by a certain node x should be donebefore updating set Nx. Upon receiving a Type1 packet from a node y without includingIDx
k in its header, we stress on that, node x should approve this collision detection andrelease time slot k iff the transmitting node y ∈ Nx. This condition is referred to as theslot release prevention (SRP) condition, and its main objective is to prevent node x from
19
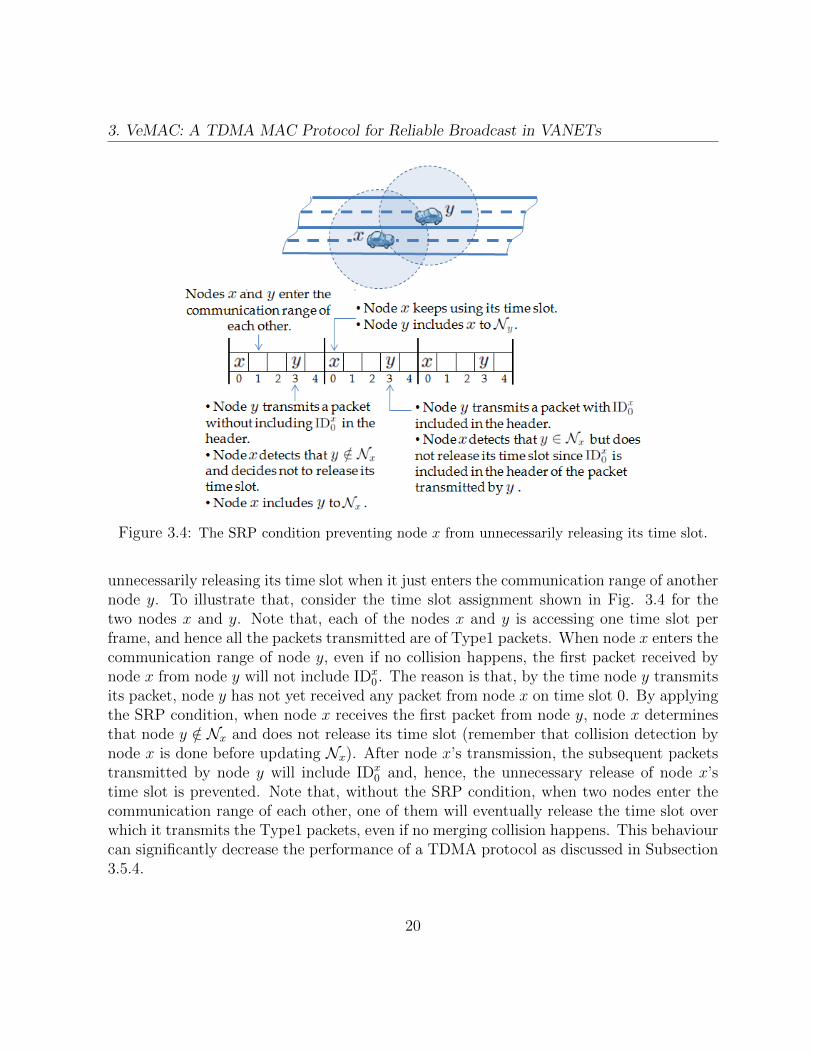
3. VeMAC: A TDMA MAC Protocol for Reliable Broadcast in VANETs
Figure 3.4: The SRP condition preventing node x from unnecessarily releasing its time slot.
unnecessarily releasing its time slot when it just enters the communication range of anothernode y. To illustrate that, consider the time slot assignment shown in Fig. 3.4 for thetwo nodes x and y. Note that, each of the nodes x and y is accessing one time slot perframe, and hence all the packets transmitted are of Type1 packets. When node x enters thecommunication range of node y, even if no collision happens, the first packet received bynode x from node y will not include IDx
0 . The reason is that, by the time node y transmitsits packet, node y has not yet received any packet from node x on time slot 0. By applyingthe SRP condition, when node x receives the first packet from node y, node x determinesthat node y /∈ Nx and does not release its time slot (remember that collision detection bynode x is done before updating Nx). After node x’s transmission, the subsequent packetstransmitted by node y will include IDx
0 and, hence, the unnecessary release of node x’stime slot is prevented. Note that, without the SRP condition, when two nodes enter thecommunication range of each other, one of them will eventually release the time slot overwhich it transmits the Type1 packets, even if no merging collision happens. This behaviourcan significantly decrease the performance of a TDMA protocol as discussed in Subsection3.5.4.
20

3.2. CCH Access
When a node, x, is attempting to acquire a time slot, a parameter called the split upparameter, denoted by τ , determines how node x accesses the time slots belonging to theL, R, and F sets. Consider that node x is moving in one of the right directions. Initially,node x limits the set Ax to the available time slots associated with the right directions, i.e.,Ax = Tx ∩ R. If after τ frames node x cannot acquire a time slot, then node x augmentsAx by adding the time slots associated with the opposite direction, i.e., Ax = Tx∩ (R∪L).If, after τ more frames, node x still cannot acquire a time slot, node x will start to accessany available time slot, i.e., Ax = Tx. The same procedure applies for a vehicle moving ina left direction by replacing R with L. Similarly, if node x is an RSU, for the first τ framesAx = Tx ∩ F , and then Ax = Tx. Note that, when τ = ∞, regardless of the number ofaccess collisions that node x has encountered to acquire a time slot, it can only access thetime slots reserved for its moving direction (i.e., in the R set). On the other extreme, whenτ = 0, node x can access any available time slot on the CCH even if it does not experienceany access collision. Hence, the choice of the τ value can significantly affect the rates ofaccess collision and merging collision. For example, when τ = 0, all the vehicles and RSUsare accessing the same set of time slots. Hence, a merging collision is possible betweenany two nodes. However, when a merging collision happens, each colliding node x is freeto access any time slot in Tx, which can decrease the probability of an access collision. Onthe other extreme, when τ =∞, the vehicles moving in opposite directions and the RSUsare accessing disjoint sets of time slots. However, when a merging collision happens, forexample among vehicles moving in a right direction, there is a higher probability of anaccess collision (compared with the τ = 0 case) since the choice of each colliding node x islimited to time slots in Tx ∩R. A performance comparison between the τ = 0 and τ =∞cases is provided in Section 3.5, and the effect of the τ value on the delay of periodic andevent-driven safety messages is investigated in Chapter 4 for these two extreme cases.
Using the proposed scheme, a reliable broadcast service can be provided on the CCH.That is, if node x transmits a broadcast packet on time slot k, by listening to the L−1 timeslots following k, node x can determine the set Dx of one-hop neighbors which have notsuccessfully received the packet, where Dx = {y ∈ Nx : IDx
k is not broadcast by node y}.In other words, when node y includes IDx
k in the header of its Type1 packet, it is consideredas an implicit acknowledgement by node y of receiving the packet broadcast by node x ontime slot k.
21

3. VeMAC: A TDMA MAC Protocol for Reliable Broadcast in VANETs
3.3 SCH Access
On the SCHs, time is partitioned to frames consisting of a constant number of fixed durationtime slots. All the SCHs are slot synchronized with the CCH, and on each SCH, each secondcontains an integer number of frames. The number of time slots per frame on channel cmis denoted by lm, m = 0, . . . , Nsch , and a time slot on channel cm is identified by the index(from 0 to lm−1) of this time slot within a frame on channel cm. Note that, the same timeslot can have different indices on channels ci and cj, i 6= j, since li is not necessarily equalto lj.
A provider is a node which announces on the CCH for a service offered on a specificSCH, while a user is a node which receives the announcement for a service and decides tomake use of this service1. For a certain node x, let T mx denote the set of time slots thatnode x must not use on channel cm in the next lm time slots, m = 0, . . . , Nsch . Set T mx isused by node x to determine which time slots it can access on channel cm without causingany hidden terminal problem, as described in the following.
Consider that a node x has an MSDU to be delivered to a certain destination (assumingunicast) on SCH cm. By using T mx (how node x constructs T mx will be explained), nodex determines the set of time slots that it will access on channel cm to offer the service,denoted by ϑmx , such that ϑmx ∩ T mx = φ. Accordingly, node x announces the followinginformation in the AnS field of its next packet transmitted on the CCH: a) priority ofthe service, b) reliability of the service (i.e., acknowledged or not), c) MAC address of theintended destination y, d) the index m of the service channel, and e) ϑmx . Once the providerx announces for the service, no further action is needed unless the destination accepts theservice as described below.
Based on the information announced by provider x on the CCH, the destination ydetermines whether or not to make use of the announced service. If node y decides touse the service by provider x on channel cm, it accepts the service by including ϑmx in theAcS field of its next packet transmitted on the CCH. The announcement of ϑmx by theuser y is for each surrounding node, z, to update its T mz set as to be discussed. Also, fora reliable service, node y should include in the AnS field the time slot that will be usedby node y to transmit the acknowledgement packet, denoted by amy . Node y determinesamy such that amy /∈ T my . When provider x receives the acceptance of the service, it tunesits Transceiver2 to channel cm and starts offering the service on the time slots announcedin ϑmx . As well, if the service is reliable, node x should include amy in the AcS field of itsnext packet transmitted on the CCH. Again, the announcement of amy by provider x is
1The term ‘service’ refers to the delivery of an MSDU on a certain service channel.
22

3.3. SCH Access
to avoid the collision of the acknowledgement packet by properly updating the T mz set ofeach surrounding node z. Node y should transmit the acknowledgement only after node xannounces amy on the CCH.
Each node, x, updates sets T mx , m = 1, . . . , Nsch , as follows. When node x receives apacket on the CCH from another node y, based on the position of node y which is includedin the header of the packet, and the position of node x obtained from the GPS receiver,node x can estimate its distance to node y. Based on this estimated distance and on thefixed transmission power on all channels which is known to node x, node x can determinewhether or not node y is in its communication range on channel cm, m = 1, . . . , Nsch
2. Ifnode x decides that it can reach node y on a certain channel cm, node x adds to set T mxthe time slots indicated by each ϑmy set and amy slot included in the AcS field of the packettransmitted by y. The reason is that, each ϑmy represents a set of time slots over which nodey will receive a packet on channel cm from a certain provider in the next lm slots. Similarly,each amy indicates a time slot over which node y will receive an acknowledgement packeton channel cm from a certain user in the next lm slots. Consequently, by updating T mx inthe way described, collision at node y can be prevented since each node x in the one-hopneighbourhood of node y will avoid using the time slots over which node y will receivepackets. At the end of time slot im on channel cm, if im ∈ T mx , node x removes im fromT mx , m = 1, . . . , Nsch and im = 0, . . . , lm − 1. Note that updating the T mx , m = 1 . . . , Nsch ,sets for each node x is based on information in the AcS (not in the AnS ) field, whicheliminates any exposed terminal problem. The following example illustrates how the nodesaccess the service channels.
Consider the THS configuration shown in Fig. 3.5, node x has a reliable service tooffer to node z on time slots numbered 1, 2, and 4 on channel c1. Fig. 3.5 shows thesequence of actions taken by provider x, user z, and the surrounding nodes y and w.First, node x announces for the service and includes ϑ1
x = {1, 2, 4} in the AnS field of itspacket transmitted on the CCH. Following this announcement, no action is taken by bothsurrounding nodes w and y. Once node z accepts the service and announces ϑ1
x, node xstarts offering the service on channel c1 on time slots {1, 2, 4} as announced in ϑ1
x. Whennode y receives the packet transmitted by node z on the CCH, it adds ϑ1
x to T 1y to avoid
using the upcoming time slots {1, 2, 4} over which node z will receive packets from node x(assume that node y can reach node z on channel c1). Note that, node w is free to use thetime slots in ϑ1
x = {1, 2, 4} since it did not receive the acceptance of service transmitted bynode z on the CCH; hence, simultaneous transmissions from node w to v and from node xto z are allowed on channel c1, i.e., no exposed terminal problem. However, in the absenceof the exposed terminal problem, it is possible that node w announces a service to node
2It is assumed that each node has a path loss model for each service channel cm,m = 1, . . . , Nsch .
23

3. VeMAC: A TDMA MAC Protocol for Reliable Broadcast in VANETs
Figure 3.5: Node x offering a service to node z on channel c1.
y on time slots {1, 2, 4} after node x did the same announcement to node z (note thatsimultaneous transmissions from node w to y and from node x to z result in a collisionat node y). In this case, if node y accepts the service and includes ϑ1
w = {1, 2, 4} in theAcS field of its packet transmitted on the CCH (on time slot {6}), node x will receive thispacket transmitted by node y, includes ϑ1
w to T 1x , and avoids using the upcoming time slots
{1, 2, 4} on channel c1 to prevent collision at node y (recall the definition of T 1x ), although
node x was supposed to transmit a packet to node z on the time slot {2} following nodey’s acceptance of service. This missing packet, together with the other packets incorrectlyreceived by node z, are (re)transmitted by node x after it receives the acknowledgmentpacket from node z. The acknowledgement packet is transmitted using the same procedureas illustrated in Fig. 3.5.
24

3.4. Analysis of Time Slot Acquisition
3.4 Analysis of Time Slot Acquisition
The objective of the analysis in this subsection is to investigate how fast the contendingnodes can acquire a time slot on the CCH by using the VeMAC protocol. Let K denotethe number of contending nodes, each of which needs to acquire a time slot on the CCH.We want to determine the average number of nodes which acquire a time slot within nframes, the probability that a specific node acquires a time slot within n frames, and theprobability that all the nodes acquire a time slot within n frames. To simplify the analysis,the following assumptions are made: a) all the contending nodes belong to the same set ofTHSs, e.g., node w and node x in its final position in Fig. 3.2; b) the set of THSs to whichthe contending nodes belong does not change; c) when a node, x, fails to acquire a timeslot after τ frames, the set Ax is not augmented, i.e., τ = 0; d) at the end of each frame,each node, x, is aware of all acquired time slots during the frame, and updates the sets Txand Ax accordingly, i.e., all nodes are within the communication range of each other; e) atthe end of each frame, all contending nodes are informed whether or not their attemptsto access a time slot during this frame were successful. Based on this information, eachcolliding node, x, randomly chooses an available time slot from the updated Ax set, andattempts to access this slot during the coming frame.
Let N be the number of initially available time slots in a frame, and Xn be the totalnumber of nodes which acquired a time slot within n frames. Under the assumptions, Xn
is a stationary discrete-time Markov chain with the following transition probabilities.
If K ≤ N ,
pij =
W (j−i,K−i,N−i)
(N−i)K−i , 0 ≤ i ≤ K − 1,
i ≤ j ≤ K
1, i = j = K
0, elsewhere
where W (l, u, v) is the number of ways by which l nodes can acquire a time slot given thatthere are u contending nodes each randomly choosing a time slot among v available timeslots. A node acquires a time slot if no other nodes choose to access the same slot. TheMarkov chain is illustrated in Fig. 3.6.
25

3. VeMAC: A TDMA MAC Protocol for Reliable Broadcast in VANETs
Figure 3.6: Markov chain for Xn when K ≤ N .
If K > N ,
pij =
W (j−i,K−i,N−i)
(N−i)K−i , 0 ≤ i ≤ N − 1,
i ≤ j ≤ N − 1
1, i = j,N ≤ i ≤ K
0, elsewhere.
The Markov chain is illustrated in Fig. 3.7. To calculate W (l, u, v), considering u different
Figure 3.7: Markov chain for Xn when K > N .
balls randomly distributed in v different boxes with equal probabilities, W (l, u, v) is thenumber of ways of having l boxes each containing exactly one ball. This special occupancyproblem is solved in a recursive way as follows [47].
If u ≤ v,
W (l, u, v) =
Cul A
vl
((v − l)u−l−∑u−l
i=1W (i, u− l, v − l)), 0 ≤ l < u
Avl , l = u
0, l > u
where Avl = v!(v−l)! and Cu
l =Au
l
l!.
26

3.4. Analysis of Time Slot Acquisition
If u > v,
W (l, u, v) =
Cul A
vl
((v − l)u−l−∑v−l
i=1W (i, u− l, v − l)), 0 ≤ l < v
0, l ≥ v.
Let P be the one-step transition probability matrix, and P n the n-step transition proba-bility matrix. Given that initially all nodes are contending for time slots, i.e., X0 = 0 withprobability 1, the unconditional probability distribution of Xn is represented by the firstrow of P n. That is,
p(Xn = i) = P n1,i+1, i = 0, . . . , K
where P n1,i+1, denotes the entry of the matrix P n, located at the first row and (i + 1)st
column. The probability that all nodes acquire a time slot within n frames is denoted byF alln , where
F alln = p(Xn = K) = P n
1,K+1.
Let µn denote the average number of nodes which acquire a time slot within n frames.Therefore,
µn =K∑i=0
iP n1,i+1.
The probability that a specific node, say node x, acquires a time slot within n frames isdenoted by Fn, where
Fn =K∑i=0
p(E |Xn = i)p(Xn = i)
=K∑i=1
CK−1i−1
CKi
P n1,i+1 =
µnK
where E is the event that node x acquires a time slot within n frames and p(E |Xn = i) =CK−1
i−1
CKi
= iK
since all nodes have equal chances of acquiring a time slot. Note that, since the
VeMAC assumes a fixed number of constant duration time slots in a frame on the CCH,the choice of the L value should always ensure that K ≤ N . However, the analysis of theprotocol for the case K > N can be useful in order to determine an optimal value for L.This analysis gives an indication of how the protocol will behave if the number of nodes ina THS becomes larger than L.
Fig. 3.8 illustrates F alln for different values of N and K. As shown in Fig. 3.8, in a
27

3. VeMAC: A TDMA MAC Protocol for Reliable Broadcast in VANETs
0 1 2 3 4 5 6 7 8 9 100
0.1
0.2
0.3
0.4
0.5
0.6
0.7
0.8
0.9
1
n (frame)
Fnall
N=15 K=5
N=15 K=10
N=15 K=15
N=20 K=7
N=20 K=12
N=20 K=17
N=20 K=20
Figure 3.8: Probability that all nodes acquire a time slot within n frames.
dense scenario such as (N = 15, K = 15), there is a probability greater than 0.9 that allthe contending nodes acquire a time slot within 8 frames. Hence, given a frame durationaround 100 ms (as discussed in Chapter 4), the simplifying assumption of invariant THSs(assumption b) is acceptable, since it is reasonable to assume that the THS configurationremains constant for a sufficiently large time after all the contending nodes acquire a timeslot. The analysis presented in this subsection is verified in Subsection 3.5.1 via MATLABsimulations.
3.5 Simulations
This section presents MATLAB simulation results to study the accuracy of the analysis inSubsection 3.4, and evaluate the performance of VeMAC as compared with ADHOC MACin accessing the CCH in highway and city scenarios.
3.5.1 Analysis Verification
Simulations have been conducted using MATLAB to verify the analysis in Section 3.4. Inthe simulations, assumption e) is removed, and the average number of nodes which acquirea time slot within n frames is calculated for different K and N , and denoted by µsimn . The
28

3.5. Simulations
Figure 3.9: Average number of nodes acquiring a time slot within n frames.
98% confidence interval of µsimn is less than 0.33 node for all n, K, and N . As shown in Fig.3.9, the results of µsimn obtained from simulations without assumption e) are very close toµn obtained from analysis for different K and N .
3.5.2 Simulation Scenarios and Performance Metrics
The first scenario under consideration is a segment of a two-way vehicle traffic highway.A vehicle can communicate with all the vehicles within its communication range, i.e., noobstacles. Each vehicle moves with a constant speed drawn from a normal distribution,and the number of vehicles on the highway segment remains constant during the simulationtime. When a vehicle reaches one end of the highway segment, it re-enters the segmentfrom the other end. For this reason, to prevent the unrealistic merging collisions causedby vehicles which jump from one end to the other end, if a vehicle is located at a distanced ≤ R from one end of the highway segment, where R denotes the communication range,it can communicate with vehicles located within a distance R − d from the other end ofthe segment. In this way, for each traffic direction, the vehicles at the end of the segmentact as if they are following the vehicles at the start of the segment.
The second scenario is a city grid layout consisting of three horizontal and three verticaltwo-way vehicle traffic streets. All the streets have the same dimensions, and the horizontaland vertical streets are evenly spaced resulting in four identical square city blocks (a city
29

3. VeMAC: A TDMA MAC Protocol for Reliable Broadcast in VANETs
Table 3.1: Simulation parameters
Parameter Highway City
Highway length 1 Km –
# horizontal streets – 3
# vertical streets – 3
City street length – 430 m
# city blocks – 4
City block edge length – 200 m
# lanes/direction 2 1
Lane width 5 m 5 m
Speed mean value 100 km/h 50 km/h
Speed standard deviation 20 km/h 10 km/h
Transmission range 150 m 150 m
# slots/frame 100 100
# slots for left directions 50 50
# slots for right directions 50 50
# slots for RSUs 0 0
Slot duration 1 ms 1 ms
Simulation time 2 min. 2 min.
# vehicles 80 to 280 (step = 20) 150 to 600 (step = 50)
THSO 0.24 to 0.96 (step = 0.06) 0.17 to 0.70 (step = 0.06)
block is the smallest area that is surrounded by streets). The area of intersection of ahorizontal street with a vertical one is referred to as a junction area. Each vehicle moveswith a constant speed drawn from a normal distribution. When a vehicle reaches a junctionarea, it chooses one of all possible moving directions with equal probability (vehicles arenot allowed to leave the simulation area during the simulation time). A vehicle locatedat a junction area can communicate with vehicles within its communication range locatedon both streets intersecting at the junction area. On the other hand, a vehicle locatedat a street but not at a junction area cannot communicate with vehicles located on otherstreets due to the existence of city blocks which obstruct the wireless signal.
For both scenarios under consideration, all the transmitted packets are broadcast pack-ets, the wireless channel is ideal, and the only source of packet errors is the transmissioncollision. Table 3.1 summarizes the simulation parameters and Figs. 3.10 and 3.11 showsnap shots of the simulated highway and city scenarios respectively, where the black and
30

3.5. Simulations
0 200 400 600 800 10000
5
10
15
20
(m)
Figure 3.10: A snap shot of the simulated highway segment.
0 100 200 300 4000
100
200
300
400
(m)
Figure 3.11: A snap shot of the simulated area of the city.
31

3. VeMAC: A TDMA MAC Protocol for Reliable Broadcast in VANETs
white triangles represent vehicles moving in opposite directions. The same slot durationand total number of time slots per frame are used for all the MAC protocols under consid-eration (Subsection 3.5.3).
We define a parameter, called the two-hop set occupancy (THSO), equal to Nv ×2R
Lengthh× 1
Lor Nv
Ns× 2R
Lengths× 1
Lin the highway and city scenarios respectively, where Nv
is the total number of vehicles, Ns is the total number of streets in the city, Lengthh isthe length of the highway segment, and Lengths is the length of a city street. Note that,the ratio Nv
Nsapproximately equals the number of vehicles on a city street, the number L
represents the maximum number of time slots available for a THS, and the length 2R isthe maximum length that a THS can occupy on the highway segment or on a city street.Consequently, the THSO indicates the ratio of the number of time slots required by aTHS to the total number of time slots available for a THS. However, the THSO is notguaranteed for each THS in the simulations. The reason is that, if there are Nv movingvehicles, this does not mean that at each instant, each THS on the highway consists ofNv × 2R
Lengthhvehicles or each THS in the city consists of Nv
Ns× 2R
Lengthsvehicles. Also, in the
city scenario under consideration, a THS located near a junction area can occupy a lengthon the streets up to 4R (2R on each of the horizontal and vertical street intersecting atthe junction area).
The following performance metrics are considered:
a) rate of merging collisions: the average number of merging collisions per frame per THS;
b) rate of access collisions: the average number of access collisions per slot per THS;
c) Tx throughput: the average number of successful transmissions per slot per THS. Atransmission by a vehicle x in a certain time slot is considered successful iff no othervehicles in the two-hop neighbourhood of x transmits in the same slot;
d) Rx throughput: the average number of successfully received packets per slot per THS.As mentioned, packet errors only happen due to transmission collision.
Each of the metrics is calculated first for the whole simulation area, and then multipliedby 2R
Lengthhor 1
Ns× 2R
Lengthsfor the highway and city scenarios respectively. Note that, unlike
the other three metrics, the rate of merging collisions is calculated per frame not per slot.The reason is that, merging collisions happen due to the movement of the vehicles, whichis negligible in the duration of one time slot. The metrics are obtained for each of theMAC protocols mentioned in Subsection 3.5.3. At the beginning of the simulations, thevehicles are randomly (uniformly) placed on the highway segment and on all streets of the
32

3.5. Simulations
city. The vehicles remain stationary and try to acquire a time slot by using the MACprotocol under consideration. Once no more vehicle can acquire a time slot, the vehiclesbegin moving and the simulation timer starts. The objective of this process is to quicklybring the system to a steady state where most of the vehicles have acquired a time slot.
3.5.3 Simulated Protocols
Two versions of the VeMAC protocol are considered: VeMAC with τ = 0 (V0) and VeMACwith τ = ∞ (V-inf). As will be shown in Subsection 3.5.4, both versions of the VeMACprotocol significantly outperform the ADHOC MAC protocol in [20]. The poor performanceof ADHOC MAC is caused by the following two main reasons. First, due to the lack of acondition similar to the SRP condition in VeMAC, when two vehicles having acquired a timeslot enter the communication range of each other, one of them releases its time slot even ifno merging collision happens. Second, as mentioned in [20], a node which needs to acquirea time slot should attempt transmission in the next available time slot with probabilitypacc. For a certain time slot, the optimal probability popt = 1/Nc, where Nc is the number ofcontending nodes attempting to acquire this time slot [20]. However, since Nc is not knownto any of the contending nodes, each contending node x sets Nc = Nmax − Nx
succ, whereNmax is the maximum number of nodes which can exist in a THS and Nx
succ is the number ofnodes in the two-hop neighbourhood of node x which have successfully acquired a time slotas derived from the framing information received by node x [20]. This estimation of Nc isfar from accurate. The reason is that, if a node x detects that Nx
succ nodes have successfullyacquired a time slot, this does not mean at all that there are Nmax − Nx
succ nodes whichneed to acquire a time slot in the two-hop neighbourhood of node x. Also, even if there areexactly Nmax−Nx
succ contending nodes, they do not necessarily contend for the same timeslots since each of the nodes may belong to a different set of THSs. Additionally, Nmax
is not constant since it depends on parameters such as the inter-vehicle distance and thenumber of lanes which considerably vary based on the scenario (i.e., highway, city, urban,sub-urban, or rural areas).
In terms of communication over the control channel, the main similarities and differ-ences between the VeMAC and ADHOC MAC protocols can be summarized as follows.Both protocols are based on TDMA, work over the physical layer of different standards(such as the IEEE 802.11), and achieve an efficient multi-hop broadcast service (Subsection5.2.2) as well as a reliable one-hop broadcast service without the hidden terminal prob-lem. Also, they both require each node to periodically announce the time slots used by allnodes within its one-hop neighbourhood. However, as will be shown in subsection 3.5.4,the VeMAC protocol significantly outperforms the ADHOC MAC protocol, thanks to the
33
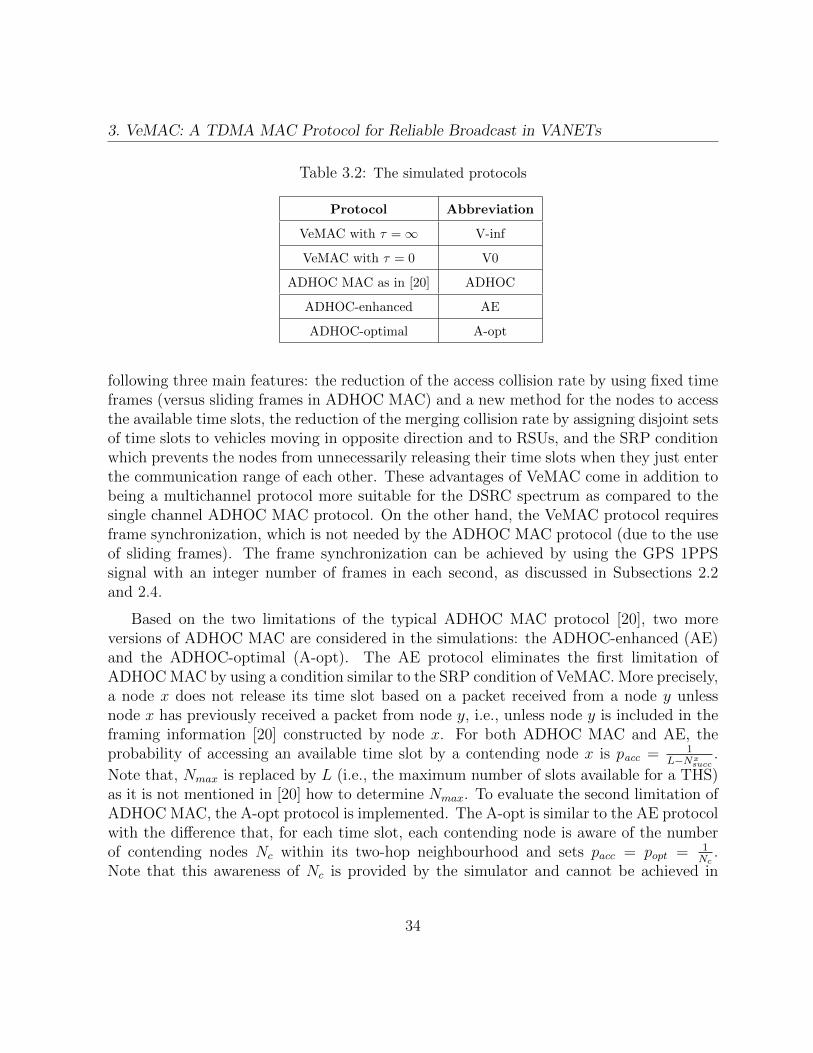
3. VeMAC: A TDMA MAC Protocol for Reliable Broadcast in VANETs
Table 3.2: The simulated protocols
Protocol Abbreviation
VeMAC with τ =∞ V-inf
VeMAC with τ = 0 V0
ADHOC MAC as in [20] ADHOC
ADHOC-enhanced AE
ADHOC-optimal A-opt
following three main features: the reduction of the access collision rate by using fixed timeframes (versus sliding frames in ADHOC MAC) and a new method for the nodes to accessthe available time slots, the reduction of the merging collision rate by assigning disjoint setsof time slots to vehicles moving in opposite direction and to RSUs, and the SRP conditionwhich prevents the nodes from unnecessarily releasing their time slots when they just enterthe communication range of each other. These advantages of VeMAC come in addition tobeing a multichannel protocol more suitable for the DSRC spectrum as compared to thesingle channel ADHOC MAC protocol. On the other hand, the VeMAC protocol requiresframe synchronization, which is not needed by the ADHOC MAC protocol (due to the useof sliding frames). The frame synchronization can be achieved by using the GPS 1PPSsignal with an integer number of frames in each second, as discussed in Subsections 2.2and 2.4.
Based on the two limitations of the typical ADHOC MAC protocol [20], two moreversions of ADHOC MAC are considered in the simulations: the ADHOC-enhanced (AE)and the ADHOC-optimal (A-opt). The AE protocol eliminates the first limitation ofADHOC MAC by using a condition similar to the SRP condition of VeMAC. More precisely,a node x does not release its time slot based on a packet received from a node y unlessnode x has previously received a packet from node y, i.e., unless node y is included in theframing information [20] constructed by node x. For both ADHOC MAC and AE, theprobability of accessing an available time slot by a contending node x is pacc = 1
L−Nxsucc
.
Note that, Nmax is replaced by L (i.e., the maximum number of slots available for a THS)as it is not mentioned in [20] how to determine Nmax. To evaluate the second limitation ofADHOC MAC, the A-opt protocol is implemented. The A-opt is similar to the AE protocolwith the difference that, for each time slot, each contending node is aware of the numberof contending nodes Nc within its two-hop neighbourhood and sets pacc = popt = 1
Nc.
Note that this awareness of Nc is provided by the simulator and cannot be achieved in
34

3.5. Simulations
0 1 2 3 4 510
20
30
40
50
60
Time (s)
Nq
(ve
hic
le/T
HS
)
ADHOC
AE A−opt
Figure 3.12: The number of vehicles acquiring a time slot for the three ADHOC MAC versionsin the highway scenario, at THSO = 0.6 (i.e., 60 vehicle/THS).
reality. Hence, the A-opt is not a realistic protocol, it just represents an upper boundon the performance of ADHOC MAC. The five MAC protocols under consideration aresummarized in Table 3.2.
To demonstrate the difference among the three ADHOC MAC versions, Fig. 3.12 showsthe total number of vehicles successfully acquiring a time slot, denoted by Nq, in the firstfive seconds of the simulation in the highway scenario. For the ADHOC protocol, due tothe lack of the SRP condition, Nq drops from 60 to 20 vehicle/THS in the first second ofthe simulation. Also, each vehicle which releases its time slot in the first second cannotquickly acquire a new one due to the inexact probability of accessing an available time slot.For this reason, Nq remains below 20 vehicle/THS at the end of the five seconds. UnlikeADHOC MAC, in the AE protocol, the sudden decrease in Nq is eliminated thanks to theSRP condition. For this protocol, Nq decreases gradually and reaches 54 vehicle/THS atthe end of the five seconds. On the other hand, the A-opt protocol does not show anydecrease in Nq at the end of the five seconds since it can control the access collisions byusing the optimal probability popt for accessing the available time slots. Similar behavioursof the three ADHOC MAC versions were seen in the city scenario.
35

3. VeMAC: A TDMA MAC Protocol for Reliable Broadcast in VANETs
0.2 0.3 0.4 0.5 0.6 0.7 0.8 0.9 10
0.25
0.5
0.75
1
1.25
1.5
1.75
2
2.25
THSO
Ra
te o
f m
erg
ing
co
llisi
on
s
(c
olli
sio
n/f
ram
e/T
HS
)
ADHOC
AE
V0
V−inf
A−opt
Figure 3.13: The rate of merging collisions in highway.
3.5.4 Simulation Results
3.5.4.1 Highway Scenario
Fig. 3.13 shows the rate of merging collisions for all the MAC protocols under consideration.The V-inf protocol achieves a low rate of merging collisions since it assigns disjoint setsof time slots to vehicles moving in opposite directions. The V0 and A-opt protocols havealmost the same rate of merging collisions for different THSO values. Note that for a highTHSO, the ADHOC protocol provides a low rate of merging collision, even less than theV-inf protocol, due to a small number of nodes which successfully acquire a time slot ascompared to other protocols (recall that, by definition, a merging collision happens onlyamong the nodes which are successfully acquiring a time slot).
The rate of access collisions is shown in Fig. 3.14 for all the protocols. As expected, theA-opt protocol shows a considerably smaller rate of access collisions than both ADHOCand AE protocols, which verifies the inefficiency of both protocols in determining theprobability of accessing an available slot. Due to the ability of the V-inf protocol todecrease the rate of merging collisions, as shown in Fig. 3.13, it also achieves a less rate ofaccess collisions than that of the V0 protocol. The reason is that, each merging collisiongenerates access collisions, especially for a high THSO, until each node which released itstime slot reacquires a new one. Both VeMAC protocols (V-inf and V0) provide a rate ofaccess collisions which is slightly higher than that of the A-opt protocol but significantly
36

3.5. Simulations
0.2 0.3 0.4 0.5 0.6 0.7 0.8 0.9 10
0.5
1
1.5
2
2.5
3
3.5
THSO
Ra
te o
f a
cce
ss c
olli
sio
ns
(co
llisi
on
/slo
t/T
HS
)
ADHOC
AE
V0
V−inf
A−opt
Figure 3.14: The rate of access collisions in highway.
0.2 0.3 0.4 0.5 0.6 0.7 0.8 0.9 10.1
0.2
0.3
0.4
0.5
0.6
0.7
THSO
Tx
thro
ug
hp
ut
(pa
cke
t/sl
ot/
TH
S)
ADHOC
AE
V0
V−inf
A−opt
Figure 3.15: The Tx throughput in highway.
37

3. VeMAC: A TDMA MAC Protocol for Reliable Broadcast in VANETs
0.2 0.3 0.4 0.5 0.6 0.7 0.8 0.9 10
10
20
30
40
50
60
70
THSO
Rx
thro
ug
hp
ut
(pa
cke
t/sl
ot/
TH
S)
ADHOC
AE
V0
V−inf
A−opt
Figure 3.16: The Rx throughput in highway.
lower than the rates provided by the ADHOC and AE protocols especially for a high THSO.
Fig. 3.15 shows the Tx throughput for all the protocols. Because of the limitationsdiscussed in Subsection 3.5.3, the performance of the ADHOC protocol is the lowest amongall the MAC protocols for all the THSO values. The AE protocol has better performancethan the ADHOC protocol, but its Tx throughput decreases for a high THSO due to itsinability to handle the access collisions. For a THSO < 0.7, the V-inf and V0 protocolshave almost the same Tx throughput, while for a THSO > 0.7, the V-inf protocol startsto perform better than the V0 protocol. Both protocols outperform the AE and ADHOCprotocols for all the THSO values, and the Tx throughput of the V-inf is slightly less thanthe unrealistic A-opt protocol for a THSO > 0.7.
The Rx throughput is shown in Fig. 3.16. It is clear that, the V-inf and V0 protocolsachieve a higher Rx throughput than both of the AE and ADHOC protocols for all theTHSO values. For instance, at THSO = 0.78, the V-inf protocol provides an Rx throughputof 51 packet/slot/THS as opposed to only 21 packet/slot/THS in the case of the ADHOCprotocol (i.e., a 143% increase in the Rx throughput). Note that, for a high THSO, evenif the Tx throughput remains constant or slightly decreases, the Rx throughput continuesincreasing. The reason is that, for the same Tx throughput, when the number of vehicleson the highway segment increases (i.e., when the THSO increases), more vehicles canreceive packets since all the packets transmitted are of broadcast type. Similar to theTx throughput, the V-inf protocol provides a slightly less Rx throughput than the A-
38

3.5. Simulations
0.15 0.2 0.25 0.3 0.35 0.4 0.45 0.5 0.55 0.6 0.65 0.70
1
2
3
4
5
6
THSO
Ra
te o
f m
erg
ing
co
llisi
on
s
(
colli
sio
n/f
ram
e/T
HS
)
ADHOC
AE
V0
V−inf
A−opt
Figure 3.17: The rate of merging collisions in city.
opt protocol. For the range of THSO considered in the highway, the maximum relativedifference3 between the Rx throughput of the V-inf and A-opt protocols is approximately3.9% (achieved at THSO = 0.72).
3.5.4.2 City Scenario
The rate of merging collision in the city scenario is shown in Fig. 3.17 for all the protocols.It is noted that, the relative difference between the rate of merging collision provided bythe V-inf protocol and that provided by the V0 protocol is reduced as compared to thehighway scenario. For instance, at a THSO = 0.7 in the highway scenario, the V0 protocolshows approximately 150% higher rate of merging collision than the V-inf protocol, asopposed to only an 8% increase in the city scenario at the same THSO. The reason isthat, in the city scenario, the V-inf protocol suffers from the merging collisions near thejunction areas due to vehicles which change their moving direction. This kind of mergingcollision does not exist with the V-inf protocol when employed in the highway scenario(the merging collisions only happens among vehicles moving in the same direction). Theclose rate of merging collisions of both V-inf and V0 protocols also results in a close rateof access collisions, as shown in Fig. 3.18. Similar to the highway scenario, both V-inf
3The relative difference between two values x and y is defined as |x−y|min(x,y)
39

3. VeMAC: A TDMA MAC Protocol for Reliable Broadcast in VANETs
0.15 0.2 0.25 0.3 0.35 0.4 0.45 0.5 0.55 0.6 0.65 0.70
0.3
0.6
0.9
1.2
1.5
1.8
THSO
Ra
te o
f a
cce
ss c
olli
sio
ns
(co
llisi
on
/slo
t/T
HS
)
ADHOC
AE
V0
V−inf
A−opt
Figure 3.18: The rate of access collisions in city.
0.15 0.2 0.25 0.3 0.35 0.4 0.45 0.5 0.55 0.6 0.65 0.70.15
0.2
0.25
0.3
0.35
0.4
0.45
0.5
THSO
Tx
thro
ug
hp
ut
(pa
cke
t/sl
ot/
TH
S)
ADHOC
AE
V0
V−inf
A−opt
Figure 3.19: The Tx throughput in city.
40

3.6. Summary
0.15 0.2 0.25 0.3 0.35 0.4 0.45 0.5 0.55 0.6 0.65 0.70
5
10
15
20
25
30
35
THSO
Rx
thro
ug
hp
ut
(pa
cke
t/sl
ot/
TH
S)
ADHOC
AE
V0
V−inf
A−opt
Figure 3.20: The Rx throughput in city.
and V0 protocols provide a rate of access collision which is higher than that of the A-optprotocol but lower than those provided by the AE and ADHOC protocols.
The Tx throughput and Rx throughput are shown in Figs. 3.19 and 3.20 respectively.The V-inf and V0 protocols have the same performance for a THSO < 0.5, while the V-infprotocol performs slightly better for a THSO > 0.5. Unlike the highway scenario, wherethe A-opt and V-inf protocols have very close Tx and Rx throughputs, in the city scenariothe A-opt outperforms the V-inf protocol. This outperforming is a result of the excessmerging collisions that the V-inf protocol experiences in the city scenario due to vehicleswhich change their moving directions. However, similar to the highway scenario, bothV-inf and V0 protocols provide higher Tx and Rx throughputs than the AE and ADHOCprotocols.
3.6 Summary
This chapter presents VeMAC, a novel multichannel MAC protocol based on TDMA forVANETs. How the periodic and event-driven safety messages are queued and served bythe VeMAC protocol is described, and the techniques employed by the protocol for access-ing the CCH and SCHs are explained. Mathematical analysis and computer simulationsare presented to evaluate the performance of the VeMAC protocol in highway and city
41
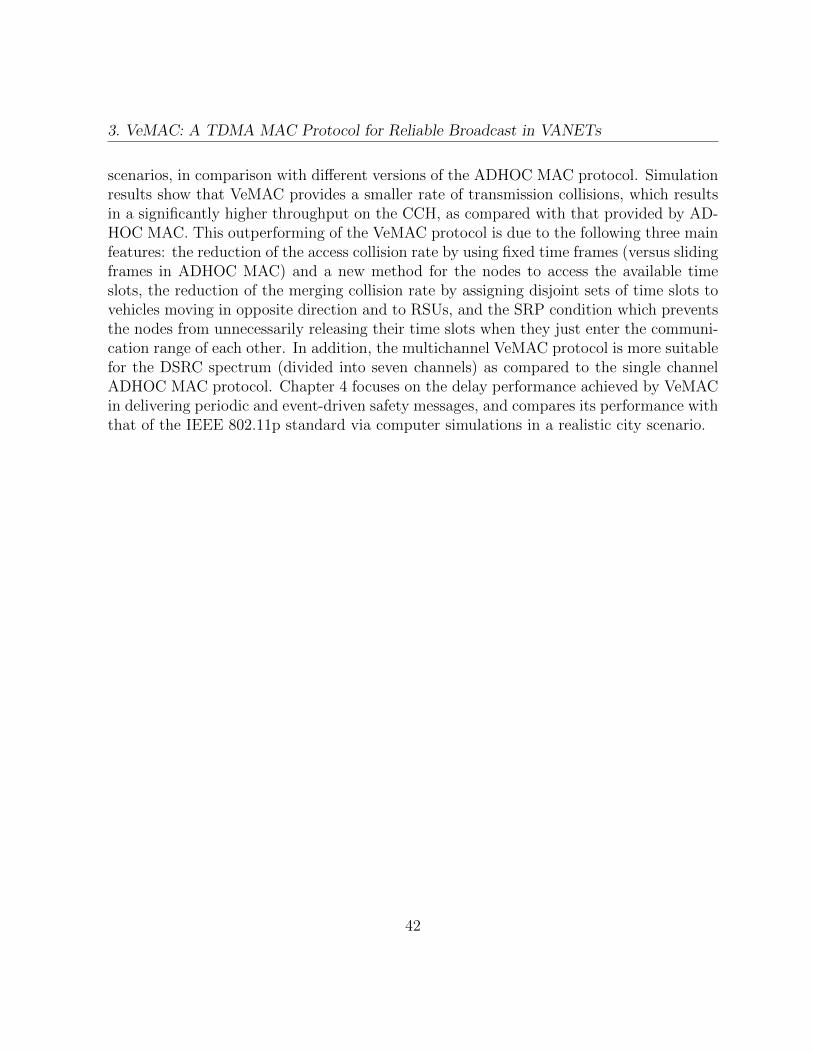
3. VeMAC: A TDMA MAC Protocol for Reliable Broadcast in VANETs
scenarios, in comparison with different versions of the ADHOC MAC protocol. Simulationresults show that VeMAC provides a smaller rate of transmission collisions, which resultsin a significantly higher throughput on the CCH, as compared with that provided by AD-HOC MAC. This outperforming of the VeMAC protocol is due to the following three mainfeatures: the reduction of the access collision rate by using fixed time frames (versus slidingframes in ADHOC MAC) and a new method for the nodes to access the available timeslots, the reduction of the merging collision rate by assigning disjoint sets of time slots tovehicles moving in opposite direction and to RSUs, and the SRP condition which preventsthe nodes from unnecessarily releasing their time slots when they just enter the communi-cation range of each other. In addition, the multichannel VeMAC protocol is more suitablefor the DSRC spectrum (divided into seven channels) as compared to the single channelADHOC MAC protocol. Chapter 4 focuses on the delay performance achieved by VeMACin delivering periodic and event-driven safety messages, and compares its performance withthat of the IEEE 802.11p standard via computer simulations in a realistic city scenario.
42

Chapter 4
Performance Evaluation of VeMACSupporting VANET SafetyApplications
This chapter investigates how the VeMAC protocol can deliver both periodic and event-driven safety messages in VANETs, by presenting a detailed delivery delay analysis, includ-ing queueing and service delays, for both types of safety messages [40, 41]. The probabilitymass function of the service delay is first derived, then the D/G/1 and M/G/1 queueingsystems are used to calculate the average queueing delay of the periodic and event-drivensafety messages respectively. As well, a comparison between the VeMAC protocol andthe IEEE 802.11p standard [21] is presented via extensive simulations using the networksimulator ns-2 [48] and the microscopic vehicle traffic simulator VISSIM [49]. A real cityscenario is considered and different performance metrics are evaluated, including the net-work goodput, protocol overhead, channel utilization, protocol fairness, probability of atransmission collision, and message delivery delay. Although the VeMAC is a multichan-nel protocol, this chapter focuses only on the operation of the VeMAC on the CCH, overwhich the high priority periodic and event-driven safety messages under consideration aretransmitted.
4.1 Delay Analysis
The total delay that a safety message experiences on the CCH before reaching all theone-hop neighbours consists of five components: 1) upper layers delay from the time that
43

4. Performance Evaluation of VeMAC Supporting VANET Safety Applications
a safety message is generated at the application layer until it is assigned to one of the twoqueues in Fig. 3.1, including the fragmentation time of periodic safety messages; 2) queueingdelay between the time that a safety message (or a fragment of a safety message) is assignedto one of the queues in Fig. 3.1 and the time that it becomes the head of line (HOL);3) access delay from the time that a safety message (or a fragment of a safety message)becomes the HOL until the start of its transmission. This delay is mainly the time spentby the transmitting node waiting for one of its acquired periodic or event-driven time slots;4) transmission duration of a safety packet; 5) propagation delay until the safety packetcompletely reaches the farthest one-hop neighbour. The upper layers delay and propagationdelay are not considered in the following analysis since they are negligible as compared tothe other delay components. The transmission duration of any safety packet is assumed tobe equal to the duration of one time slot. Note that, the duration of one time slot representsthe maximum transmission duration which can be experienced by a safety packet on theCCH. However, the difference between the maximum and actual transmission durations(fraction of a time slot) is negligible as compared to the queueing delay and access delay(multiple time slots). The sum of the access delay and transmission duration is referredto as the service delay. To simplify the analysis of the service delay and queueing delay,denoted by Ws and Wq respectively, we assume that a node releases its periodic or event-driven time slot(s) and acquires a new one(s) after the transmission of each periodic orevent-driven safety packet respectively. This assumption guarantees that the service delaysof the successive periodic and event-driven safety messages assigned to the two queues inFig. 3.1 form two sequences of independent and identically distributed (i.i.d.) randomvariables, which is a necessary condition for the application of the D/G/1 and M/G/1queuing systems in Subsection 4.1.2. The assumption is reasonable in scenarios with highrates of access collisions and merging collisions, where the nodes frequently release theirtime slots and acquire new ones. The number of periodic and event-driven time slots, kpand ke, that a node can access per frame are assumed to be constant. The total delay,denoted by W , is the sum of Ws and Wq, and all delays are represented in the unit of atime slot. For any discrete random variable X, the probability mass function (PMF) andthe cumulative distribution function (CDF) are denoted by fX and FX respectively, whilethe first and second moments are denoted by X and X2 respectively. If random variableX takes only non-negative integer values, its probability generating function (PGF) isdenoted by GX(z) = zX =
∑x fX(x)zx, while G′X(z) denotes d
dzGX(z). The service delay
and queueing delay are considered separately in Subsections 4.1.1 and 4.1.2 in the following.The accuracy of the analysis in this section under the simplified assumptions is studied viaMATLAB simulations in Subsection 4.2.2.
44

4.1. Delay Analysis
4.1.1 Service Delay
Since the VeMAC protocol serves the two queues in Fig. 3.1 independently using the kpand ke time slots, the PMF fWs is similar for both queues and differs only due to thedifference between the kp and ke values. Hence, the PMF fWs is derived in a generic way(i.e., irrespective of the type of the transmitted safety message) given that the transmittingnode is accessing k time slots per frame. For the periodic and event-driven safety messages,the PMF fWs can be calculated just by replacing k in the generic fWs with kp and kerespectively. Let random variable J denote the index of the time slot at the start of whicha safety message becomes the HOL. Note that, since the transmission delay is equal to 1,if the inter-arrival time of periodic safety messages is an integer value, and assuming thatthe first message arrives at the start of a time slot, it is guaranteed that a periodic messagealways becomes the HOL at the start of a time slot. On the other hand, due to randomarrivals of event-driven safety messages with non-integer inter-arrival times, it is possiblethat, when the queue is empty, an arriving event-driven message becomes the HOL withinthe duration of a certain time slot. In this case, we neglect a fraction of time slot in thecalculation of the service delay and assume that the event-driven message becomes theHOL at the start of the next slot. Hence, the service delay Ws can take only integer valuesranging from 1 to L − k + 1. The calculation of fWs(i), i = 1, ..., L − k + 1, is consideredseparately for the two extreme values of the split up parameter, τ = 0 and τ =∞.
4.1.1.1 τ = 0
In this case, if a safety message becomes the HOL at the start of time slot j, the transmittingnode can be accessing any k of the L time slots following (and including) time slot j withequal probabilities. Hence,
p(Ws = i|J = j) =CL−ik−1
CLk
,
1 ≤ k ≤ L, 1 ≤ i ≤ L− k + 1, 0 ≤ j ≤ L− 1
where Cnk = n!
(n−k)!k! . The denominator is the number of ways that the transmitting node
can access k time slots among the L time slots following (and including) time slot j, whilethe numerator is the number of ways that one of the k time slots that the node is accessingis the ith time slot starting from j, denoted by ja = (j + i − 1)modS, and the remainingk − 1 time slots are among the L − i time slots following time slot ja. In other words,the numerator is the number of ways that the node is accessing the ith time slot startingfrom j but not any of the i− 1 time slots following (and including) time slot j. Note that,
45

4. Performance Evaluation of VeMAC Supporting VANET Safety Applications
with τ = 0, the probability p(Ws = i|J = j) is independent of the value of j since thetransmitting node is allowed to access all the available time slots in a frame with equalprobabilities. Hence,
fWs(i) =L−1∑j=0
p(Ws = i|J = j)× fJ(j) =L−1∑j=0
CL−ik−1
CLk
× fJ(j) =CL−ik−1
CLk
,
1 ≤ i ≤ L− k + 1, 1 ≤ k ≤ L.
4.1.1.2 τ =∞
Consider that a node is moving in one of the left directions. When a safety messagebecomes the HOL at the start of time slot j, the transmitting node can be accessing any ktime slots in set L with equal probabilities. There is no probability that the node accessesany of the time slots in sets R and F . Hence, unlike the τ = 0 case, the probabilityp(Ws = i|J = j) depends on the value of j.
a) For |L| ≤ j ≤ L− 1, we have
p(Ws = i|J = j) =
C|L|−[i−(L−j)]k−1
C|L|k
, L− j + 1 ≤ i ≤ L− j + 1 + |L| − k,
1 ≤ k ≤ |L|,0, elsewhere.
The denominator represents the total number of ways that the node can access k slotsamong the |L| time slots, while the numerator represents the number of ways which resultin Ws equal to i. Note that, the smallest possible value of Ws is L− j+ 1, since j ∈ R∪Fwhile the node cannot access any time slot in set R∪ F .
b) For 0 ≤ j ≤ |L| − 1, we have the following two cases
• If j < k, we have Ws ≤ |L| − k + 1, since at least one of the k time slots that thenode is accessing is among the next |L|− j time slots starting from time slot j. Then
p(Ws = i|J = j) =
C|L|−ik−1
C|L|k
, 1 ≤ i ≤ |L| − k + 1,
0, elsewhere.
46

4.1. Delay Analysis
• If j ≥ k, there is a probability that the k time slots that the node is accessing are allbefore time slot j, which results in Ws taking values between L− j+ 1 and L−k+ 1.Hence
p(Ws = i|J = j) =
C|L|−ik−1
C|L|k
, 1 ≤ i ≤ |L| − j,CL−i
k−1
C|L|k
, L− j + 1 ≤ i ≤ L− k + 1,
0, elsewhere.
Given p(Ws = i|J = j) for all 0 ≤ j ≤ L− 1, we have
fWs(i) =L−1∑j=0
p(Ws = i|J = j)× fJ(j),
1 ≤ i ≤ L− k + 1, 1 ≤ k ≤ |L|.
For a node moving in a left direction, we assume that
fJ(j) =
{1|L| , 0 ≤ j ≤ |L| − 1,
0, elsewhere.
This assumption means that, first, a safety message cannot become the HOL at the startof time slots in set R∪ F and, second, a safety message becomes the HOL at the start oftime slots in set L equally likely. Note that, although the transmitting node is not allowedto access time slots in set R ∪ F , a safety message still can become the HOL at the startof a time slot belonging to this set, e.g., when a message arrives at the start of a time slotj ∈ R ∪ F and finds the queue empty. The same procedure in this subsubsection can beused to derive fWs for a node moving in a right direction or for an RSU.
4.1.2 Queueing Delay
Although the PMF of the service delay is the same for periodic and event-driven safetymessages, their queueing delays are different due to different arrival patterns for the twodifferent types of safety messages.
47

4. Performance Evaluation of VeMAC Supporting VANET Safety Applications
4.1.2.1 Event-driven Safety Messages
As mentioned in Chapter 1, the event-driven safety messages are triggered by certain eventssuch as a sudden brake, road feature notification, approaching an emergency vehicle, etc.Given the variety of such events, it is reasonable to assume that their arrival process hasindependent and stationary increments, with no group arrivals. That is, the numbersof events occurring in disjoint time intervals are independent, the PMF of the number ofevents occurring in a time interval only depends on the length of the interval, and there is nosimultaneous arrival of events. Based on these properties, the arrival process of the event-driven safety messages can be modeled by a Poisson process with rate λ message/slot.Hence, the event-driven safety message queue in Fig. 3.1 is an M/G/1 queue with theservice delay distribution fWs as derived in Subsection 4.1.1. Consequently, provided thatWs <
1λ, which is the necessary and sufficient condition for stability of the event-driven
safety message queue [50], by applying the P-K formula [51], we have
Wq =λWs
2
2(1− λWs).
4.1.2.2 Periodic Safety Messages
Based on the assumption of fixed-size periodic safety messages (Section 2.1), the numberof fragments of a periodic safety message is assumed to be fixed for a given node. Ifnf denotes the number of fragments of a periodic safety message for a certain node, thearrival of each periodic safety message results in a simultaneous arrival of nf fragments inthe periodic safety message queue in Fig. 3.1. Consequently, this queue can be modeledas a D/G/1 queue with fixed-size batch arrivals. Hence, the queueing delay that a taggedfragment of a periodic safety message experiences consists of two components: the delaysince the batch (to which the tagged fragment belongs) enters the queue until the firstfragment of the batch becomes the HOL, plus the service delay of all the fragments queuedbefore the tagged fragment within the batch. The two components of the queueing delayare independent and denoted by Wq1 and Wq2 respectively. Let integer I denote the inter-arrival time of periodic safety messages, i.e., the batch inter-arrival time. The PGF of theservice delay of one batch, denoted by Wb, is
GWb(z) =
(GWs(z)
)nf .
Hence, provided that Wb = G′Wb(1) < I, which is the necessary and sufficient condition for
stability of the periodic safety message queue [50], the PGF of Wq1 can be calculated as
48

4.2. Numerical Results
follows [52, 53]
GWq1(z) =
ξ[∏I−1
i=1 (z − zi)](z − 1)
zI −GWb(z)
where
ξ = limz→1
zI −GWb(z)[∏I−1
i=1 (z − zi)](z − 1)
and complex numbers z1, z2, . . . , zI−1 are the roots of the function zI−GWb(z), which are on
or inside the unit circle but not equal to 1. The PGF, GWq2(z), can be calculated by noting
that Wq2 =∑Nf
i=0Ws, where Nf is a random variable representing the number of fragmentsqueued before the tagged fragment within the batch. Since the tagged fragment can beany fragment within the batch with equal probabilities, fNf
(i) = 1nf, i = 0, . . . , nf − 1, and
GNf(z) = 1
nf
∑nf−1i=0 zi. Hence, by using the law of total expectation,
GWq2(z) = GNf
(GWs(z)).
Consequently,GWq(z) = GWq1
(z)×GWq2(z)
Wq = G′Wq(1).
4.2 Numerical Results
4.2.1 Analytical Results
We use MATLAB R2011b and the Symbolic Math Toolbox V5.7 for the calculation of theaverage delays as described in Section 4.1. Figs. 4.1a and 4.1b show FWs for a node movingin a left direction with τ = 0 and τ =∞ respectively. The main difference between the twocases is that, when τ =∞, FWs(n) remains constant for a certain range of n. With τ =∞,the node can only access time slots in set L. As a result, there should be a range of n wherefWs(n) = 0. For instance, if k = 2, L = 100, and |L| = 40, fWs(n) = 0,∀n ∈ {40, . . . , 61}.
Fig. 4.2a shows the average total delay W of a periodic safety message with nf = 1(a typical case for vehicles) for a node moving in a left direction with k = 1. Both τ = 0and τ = ∞ cases are plotted in Fig. 4.2a for various I values. Although the τ = 0 andτ =∞ cases have different FWs (in Figs. 4.1a and 4.1b), when k = 1, both τ values resultin the same Ws, which is represented by the straight line in Fig. 4.2a. As shown in Fig.
49

4. Performance Evaluation of VeMAC Supporting VANET Safety Applications
0 10 20 30 40 50 60 70 80 90 1000
0.1
0.2
0.3
0.4
0.5
0.6
0.7
0.8
0.9
1
n (slot)
FW
s(n)
k=1
k=2
k=4
k=16
k=8
(a) Split up parameter τ = 0
0 10 20 30 40 50 60 70 80 90 1000
0.1
0.2
0.3
0.4
0.5
0.6
0.7
0.8
0.9
1
n (slot)
FW
s(n) k=1
k=2
k=16
k=4
k=8
(b) Split up parameter τ =∞
Figure 4.1: The CDF of the service delay, FWs , for a node moving in a left direction with 100time slots per frame and 40 time slots associated with the left direction, i.e.,
L = 100 and |L| = 40.
0 100 200 300 4000
100
200
300
400
500
600
L (slot)
Ave
rage
tota
l del
ay (
slot
)
τ = 0τ = ∞
Average service delay
I = 150
I = 200
I = 100
(a) Number of time slots accessedper frame k = 1
0 100 200 300 400 500 600 7000
100
200
300
400
500
600
L (slot)
Ave
rage
tota
l del
ay (
slot
)
τ = 0τ = ∞ k = 2
k = 1
k = 4
(b) Periodic message inter-arrivaltime I = 150
Figure 4.2: The average total delay, W , of a single-fragment periodic message (nf = 1) for anode moving in a left direction with 40 percent of the time slots associated with the left
direction, i.e., |L| = 0.4L.
50

4.2. Numerical Results
0 100 200 300 4000
100
200
300
400
500
600
L (slot)
Ave
rage
tota
l del
ay (
slot
)
τ = 0τ = ∞
Average service delay
λ = 1/100
λ = 1/200
λ = 1/300
(a) Number of time slots accessed per framek = 1
0 100 200 300 400 500 600 700 800 9000
100
200
300
400
500
600
700
800
L (slot)
Ave
rage
tota
l del
ay (
slot
)
τ = 0τ = ∞
k = 4
k = 2
k = 1
(b) Event-driven message average arrival rateλ = 1
200 message/slot
Figure 4.3: The average total delay, W , of an event-driven safety message for a node moving ina left direction with 40 percent of the time slots associated with the left direction, i.e.,
|L| = 0.4L.
4.2a, if L ≤ I, W is the same as Ws since each safety message is served before the next onearrives, i.e., Wq = 0. When L > I, the queueing component Wq is added to the total delayW , and the value of W continues to increase with L and approaches ∞ when L tends tothe instability value L∗ at Ws = I. Eventually, the value of L∗ increases with the numberof time slots, k, that the node is allowed to access per frame. To illustrate the effect of kon the total delay W , Fig. 4.2b shows W for I = 150 and different k values. As shown inFig. 4.2b, while a frame duration L = 300 results in instability for the k = 1 case, when kis increased to 2, the value of W remains below 200 slots for both τ = 0 and τ =∞.
Fig. 4.3a illustrates the average total delay W of an event-driven safety message fora node moving in a left direction with k = 1. Unlike the periodic safety message case inFig. 4.2a, due to the Poisson arrival of event-driven safety messages, even if L ≤ 1
λ, the
queueing delay Wq > 0 and W > Ws. The effect of k on the total delay of event-drivensafety messages is shown in Fig. 4.3b for λ = 1
200message/slot.
4.2.2 Simulation Results
Computer simulations have been conducted using MATLAB to simulate the two queuesin Fig. 3.1. The objectives of the simulations are to study the effect of the assumption on
51

4. Performance Evaluation of VeMAC Supporting VANET Safety Applications
0 100 200 300 4000
100
200
300
400
500
600
L (slot)
Ave
rage
ser
vice
and
que
uein
g de
lays
(sl
ot)
Sim, I = 100Sim, I = 150Sim, I = 200Sim, I = 200Analysis
Average service delay
Average queueing delays
(a) Periodic, nf = 1, and τ = 0
0 50 100 150 200 250 300 350 400 450 5000
100
200
300
400
500
600
L (slot)
Ave
rage
que
uein
g de
lay
(slo
t)
Sim, λ = 1/100Sim, λ = 1/200Sim, λ = 1/300Analysis
(b) Event-driven and τ = 0
0 100 200 300 4000
100
200
300
400
500
600
L (slot)
Ave
rage
ser
vice
and
que
uein
g de
lays
(sl
ot)
Sim, I = 100Sim, I = 150Sim, I = 200Sim, I = 200Analysis
Average service delay
Average queueing delays
(c) Periodic, nf = 1, and τ =∞
0 50 100 150 200 250 300 350 400 450 5000
100
200
300
400
500
600
L (slot)
Ave
rage
que
uein
g de
lay
(slo
t)
Sim, λ = 1/100Sim, λ = 1/200Sim, λ = 1/300Analysis
(d) Event-driven and τ =∞
Figure 4.4: Analysis and simulation (Sim) results of the average delays for a node moving in aleft direction with k = 1 and |L| = 0.4L.
52

4.2. Numerical Results
fJ for the τ = ∞ case, the impact of neglecting a fraction of time slot in the derivationof fWs for the event-driven safety messages, and the influence of the numerical errors suchas in calculating the roots of zI − GWb
(z). Fig. 4.4a shows Ws and Wq of a periodicsafety message with nf = 1 for a node moving in a left direction with k = 1, τ = 0, and|L| = 0.4L. The same parameter values are used in Fig. 4.4b to show the average queueingdelay Wq of an event-driven safety message. Note that, the average service delay Ws is notshown in Fig. 4.4b since it is the same as in Fig. 4.4a (Ws is independent of the arrivalpattern). As shown in Figs. 4.4a and 4.4b, there is a close match between the analysis andsimulation results of the delays of both periodic and event-driven safety messages. Thesame delays are shown in Figs. 4.4c and 4.4d for τ = ∞. Different from the τ = 0 case,a slight mismatch between the analysis and simulation results appears in Figs. 4.4c and4.4d, mainly for large I and small λ values, due to the assumption on fJ . The effect ofthis assumption is worse on the periodic safety messages than on the event-driven safetymessages. However, the analysis and simulation results for both types of safety messagesare still close to each other in Figs. 4.4c and 4.4d.
To consider a case of large-size periodic safety messages (typically for RSUs), the threedelay components Ws, Wq1 , and Wq2 of a multi-fragment periodic safety message withnf = 4 are shown respectively in Figs. 4.5a, 4.5b, and 4.5c for an RSU with τ = 0 anddifferent k values. As shown in Figs. 4.5a and 4.5c, there is a close match between theanalysis and simulation results of Ws and Wq2 . However, some mismatch is noticed for Wq1
in Fig. 4.5b. This mismatch is the effect of numerical errors, mainly in the calculation ofthe roots of zI −GWb
(z). The numerical errors are more significant for large nf and L dueto an increase in the degree of the polynomial zI − GWb
(z), since GWb(z) =
(GWs(z)
)nf
and GWs(z) itself is a polynomial of degree L− k + 1.
4.2.3 Discussion
Based on the numerical results in Subsections 4.2.1 and 4.2.2, it is observed that the delayperformance of the VeMAC with τ = 0 is better than τ =∞ for both periodic and event-driven safety messages, especially for large k and I, and small λ values. If the size of theperiodic safety messages broadcast by vehicles is 150 bytes, a VeMAC MTU of 675 bytesis suitable to include one periodic safety message and all the VeMAC control informationwhich should be transmitted on the CCH. For a transmission rate of 18 Mbps, which isone of the rates supported by the IEEE 802.11p orthogonal frequency division multiplexing(OFDM) physical layer for the 5 GHz band, the VeMAC MTU transmission time is 0.3 ms.By including guard periods and considering the physical layer overhead, a slot durationof 0.35 ms can be assumed. Given this slot duration, for the periodic safety messages of
53

4. Performance Evaluation of VeMAC Supporting VANET Safety Applications
0 50 100 150 200 250 3000
5
10
15
20
25
30
35
40
L (slot)
Ave
rage
ser
vice
del
ay (
slot
)
Sim, k = 1Sim, k = 2Sim, k = 4Sim, k = 6Analysis
(a) Service delay Ws of a fragment
0 50 100 150 200 250 3000
100
200
300
400
500
L (slot)
Ave
rage
bat
ch q
ueue
ing
dela
y (s
lot)
Sim, k = 1Sim, k = 2Sim, k = 4Sim, k = 6Analysis
(b) Batch queueing delay Wq1
0 50 100 150 200 250 3000
5
10
15
20
25
30
35
40
45
50
55
60
L (slot)
Ave
rage
in−
batc
h qu
euin
g de
lay
(slo
t)
Sim, k = 1Sim, k = 2Sim, k = 4Sim, k = 6Analysis
(c) In-batch queueing delay Wq2
Figure 4.5: Average delays of a periodic safety message with nf = 4 for an RSU when I = 150,|F| = 0.4L, and τ = 0.
54

4.3. Comparison of VeMAC with IEEE 802.11p
vehicles, if I = 200 slots = 70 ms, and each vehicle is allowed to access one periodic timeslot per frame, then from Fig. 4.2a, a frame duration L = 300 results in an average totaldelay around 185 slots (65 ms) for the τ = 0 case. Similarly, for the event-driven safetymessages in Fig. 4.3a, if λ = 1
300message/slot = 9.5 message/s, and if the transmitting
node is allowed to access only one event-driven time slot per frame, a frame duration of 300slots results in an average delay around 250 slots (88 ms). Note that, the frame durationL represents the maximum number of time slots available for any THS in the network.For instance, if L = 300 slots and the transmission range is 200 m (corresponding to themaximum length of 400 m occupied by a THS on a road segment), the total number of timeslots available for all the nodes on a road segment of any 400 m is equal to 300 slots. Theresults in this section help to determine the VeMAC parameters, such as τ, kp, ke, and L,used for the comparison with the IEEE 802.11p standard as follows.
4.3 Comparison of VeMAC with IEEE 802.11p
Computer simulations are conducted using the network simulator ns-2 [48] to evaluate theperformance of the VeMAC protocol in comparison with the IEEE 802.11p standard inbroadcasting the safety messages. Periodic safety messages are generated continuously,while event-driven safety messages are generated according to an exponential ON/OFFmodel (i.e., the ON and OFF periods are exponentially distributed) at each node in thesimulations. For the VeMAC protocol, the periodic and event-driven safety messages arequeued and served as specified in Sections 3.1 and 3.2 1. On the other hand, for theIEEE 802.11p, we have employed the EDCA scheme, which assigns any MSDU to one offour different access categories (ACs) [22]. The event-driven and periodic safety messagesare respectively assigned to the highest and second-highest priority ACs, i.e., AC VO andAC VI [21]. Two simulation scenarios are considered: a square network and a realisticcity scenario2. For both scenarios, the ns-2 parameters are summarized in Table 4.1. TheIEEE 802.11p parameter values in Table 4.1 are as specified by the IEEE 802.11p OFDMphysical layer for the 5 GHz band [21, 22]. The carrier frequency of 5.89 GHz represents thecenter frequency of the DSRC channel 178 (the CCH), and the transmission power of 33dBm is the maximum power allowed on this channel for private OBUs and RSUs as in theASTM E2213 standard [1]. Given these values of the carrier frequency and the transmission
1A website [54] is created in order to upload the ns-2 implementation of the VeMAC protocol, includingthe periodic and event-driven message queues, for interested researchers.
2To the best of our knowledge, currently there is no benchmark vehicle mobility scenarios which canbe used for the evaluation of VANET networking protocols.
55

4. Performance Evaluation of VeMAC Supporting VANET Safety Applications
Table 4.1: ns-2 simulation parameters
power, the receiving threshold (RxThresh) and the carrier sensing threshold (CSThresh)in Table 4.1 result in a communication range of 150 m and a carrier sensing range of 200m for free space propagation. The capture threshold (CPThresh) is the minimum ratiobetween the powers of two received signals required for the receiver to capture the signalwith the higher power and discard the one with the lower power. The dumb agent usedin the network layer just passes the data from the transport layer to the MAC layer whilesending, and vice versa while receiving (since all the safety messages under considerationare single-hop broadcast messages).
In addition to the total delay (as defined in Section 4.1), the following performancemetrics are considered:
a) goodput: the average rate of safety messages which are successfully delivered to all theone-hop neighbours;
b) channel utilization: the percentage of time that the channel is used for successful trans-mission of payload data (a transmission is considered successful only if it is correctlyreceived by all the one-hop neighbours);
56

4.3. Comparison of VeMAC with IEEE 802.11p
c) overhead: the percentage of control information relative to the total information trans-mitted on the channel;
d) probability of a transmission collision: the probability that a transmitted safety messageexperiences a collision at one or more one-hop neighbours; and
e) fairness indicator: for each node x, a metric denoted by rx is first calculated, whichrepresents the ratio of the number of safety messages transmitted by node x to thetotal number of safety messages transmitted by all nodes. The fairness indicator is thedeviation (in percentage) of rx from a fair share, sx, that equals the total number ofsafety messages generated at node x normalized by the total number of safety messagesgenerated at all nodes. That is, the fairness indicator for a node x is equal to | rx−sx
sx|
×100.
All the performance metrics, except the overhead and the channel utilization, are calculatedseparately for the periodic and event-driven safety messages.
4.3.1 Square Network
The first scenario under consideration is a set of stationary nodes uniformly distributed ina square network with side length of 500 m. Fig. 4.6a shows the periodic and event-drivenmessage goodputs of the VeMAC and the IEEE 802.11p protocols using two different phys-ical layer transmission rates. Note that, based on the parameters in Table 4.1, the averagerates of periodic and event-driven safety messages generated at each node are 10 messages/sand 3.3 messages/s respectively. As shown in Fig. 4.6a, the VeMAC outperforms the IEEE802.11p for all the node densities and transmission rates under consideration. For instance,when the number of nodes in the network is 250, the VeMAC protocol can successfullydeliver almost all the periodic and event-driven safety messages to all the one-hop neigh-bours, while the IEEE 802.11p fails to deliver around 50% of the event-driven messagesand more than 40% of the periodic messages using a transmission rate of 12 Mbps. Thisoutperforming of the VeMAC protocol in terms of safety message goodput is due to itsability to reduce the probability of a transmission collision as compared with the IEEE802.11p standard. As shown in Fig. 4.6b, there is a significant difference between the prob-ability of a transmission collision achieved by the two protocols. For the VeMAC protocol,the probability of a transmission collision of an event-driven safety packet is higher thanthat of a periodic safety packet, especially at high node densities. The reason is that, whenthe event-driven safety message queue is empty, a node releases its event-driven time slot(i.e., no information is transmitted in the slot) and re-acquires a new one when the next
57

4. Performance Evaluation of VeMAC Supporting VANET Safety Applications
100 150 200 250 300 3500
1
2
3
4
5
6
7
8
9
10
Number of nodes
Go
od
pu
t (m
ess
ag
e/s
ec.
/no
de
)
VeMAC − 12 Mbps
VeMAC − 18 Mbps
802.11p − 12 Mbps
802.11p − 18 Mbps
Periodic
Event−driven
(a) Goodput
100 150 200 250 300 3500
0.1
0.2
0.3
0.4
0.5
0.6
0.7
Number of nodes
Pro
ba
bili
ty o
f a
tra
nsm
issi
on
co
llisi
on
Periodic − 12 Mbps
Periodic − 18 Mbps
Event−driven − 12 Mbps
Event−driven − 18 Mbps
802.11p
VeMAC
(b) Probability of a transmission collision
100 150 200 250 300 35010
15
20
25
30
35
40
45
50
55
60
Number of nodes
Channel utilization (percent)
12 Mbps
18 Mbps
VeMAC
802.11p
(c) Channel utilization
100 150 200 250 300 35010
−4
10−3
10−2
10−1
Number of nodes
To
tal d
ela
y (s
)
Periodic
Event−driven
VeMAC
802.11p
(d) Average delay for a transmission rate of 12 Mbps
Figure 4.6: Simulation results for the square network.
58

4.3. Comparison of VeMAC with IEEE 802.11p
event-driven safety message is generated. This technique relatively increases the rate ofaccess collisions of the event-driven safety packets, as compared with that of the periodicones. Note that, if the periodic safety message queue is empty, a node must transmit aType1 packet (including only control information in this case) in its periodic time slot,which allows the node to keep reserving its periodic time slot even when there is no pe-riodic safety packet waiting for transmission. In Figs. 4.6a and 4.6b, the performance ofthe IEEE 802.11p improves with the higher transmission rate, since the transmission du-ration of each packet is reduced, which decreases the probability of a transmission collisionfrom the neighbouring nodes. On the other hand, the effect of the channel rate on theperformance of the VeMAC in Figs. 4.6a and 4.6b is negligible. As the VeMAC protocolachieves a higher message goodput than the IEEE 802.11p, it also provides a better chan-nel utilization, as illustrated in Fig. 4.6c. The channel utilization in Fig. 4.6c improveswith the lower transmission rate, due to an increase in the packet transmission duration,which consequently increases the percentage of time that the channel is used for successfultransmissions. When the transmission rate decreases from 18 Mbps to 12 Mbps, the chan-nel utilization of the VeMAC protocol increases by a factor of 1.5 (the same ratio betweenthe two transmission rates), while that of the IEEE 802.11p increases by a factor less than1.5, as the probability of a transmission collision also increases with the lower transmissionrate.
Fig. 4.6d shows the total delay of the VeMAC and the IEEE 802.11p protocols. Forboth periodic and event-driven safety messages, the total delay of the VeMAC protocol isdominated by the access delay component, which is around 48 ms (one half the durationof a frame). At the lowest node density in Fig. 4.6d, the total delay of the periodicsafety messages for the IEEE 802.11p protocol is around 280 µs, which is the sum ofthe durations of one AC VI arbitrary interframe space (AIFS) (71 µs), one periodic safetypacket transmission duration (164 µs), and the average backoff time (CW size
2×aSlotTime =
45.5 µs). This delay increases with the node density, due to an increase in the number ofbackoff cycles that a periodic safety packet encounters. The delay of the event-driven safetymessages for the IEEE 802.11p protocol is higher than that of the periodic safety messages,due to a large size of the event-driven messages, which results in a higher transmissionduration. Although the VeMAC has a higher total delay than the IEEE 802.11p protocol,it is well below the 100 ms delay bound required for most of the safety applications [2].
4.3.2 City Scenario
We consider the city scenario as shown in Fig. 4.7, which consists of a set of roads aroundthe UW campus. To simulate vehicle traffic, the microscopic vehicle traffic simulator VIS-
59

4. Performance Evaluation of VeMAC Supporting VANET Safety Applications
Figure 4.7: A snap shot of the simulations showing the road network with the simulated roadsin blue, a 2D view of the intersection of University/Seagram streets, and a 3D view of the
intersection of University/Westmount streets.
SIM is employed [49, 55]. The simulator generates a vehicle trace file, which is transformedto an ns-2 scenario file using a MATLAB parser3. At the start of the simulation, vehiclesenter the road network from every possible entry according to a Poisson process with rateλv. After a certain time duration tin, the vehicle input to the road network is stopped,and after an additional warm up period tw (to reduce transient state effects), the positionand speed of each vehicle are recorded at the end of every simulation step. Two types ofvehicles are considered: cars and buses. The two vehicle types differ mainly in the vehicledimensions, as well as the maximum/desired acceleration and deceleration as functionsof the vehicle speed. All cars and buses have the same desired speed distribution, whichdiffers from one road to another, and during the left and right turns at intersections. Everyintersection in the road network is controlled either by a traffic light, or a stop sign, basedon how the intersection is controlled in reality. At signalized intersections, left turns arecontrolled by the traffic light controller, and right turns are allowed during the red signalphase. Before a vehicle enters an intersection area, it decides whether to turn left, turnright, or not to make any turn, according to a certain probability mass function, whichdiffers from one intersection to another.
The car following model used is the Wiedemann 74 model [58] developed for urbantraffic. A vehicle can be in one of four modes: free driving, approaching, following, and
3Videos of the VISSIM and ns-2 simulations have been recorded and uploaded to [56] and [57] respec-tively.
60

4.3. Comparison of VeMAC with IEEE 802.11p
Table 4.2: VISSIM simulation parameters
braking. In each mode, the vehicle acceleration is a function of the vehicle speed, thecharacteristics of the driver and the vehicle, as well as the distance and the speed differencebetween the subject vehicle and the vehicle in front [58]. The last two variables alsodetermine the thresholds between the four driving modes of a vehicle. The Wiedemann 74model uses three parameters: the average standstill distance (AX), the additive part ofthe safety distance (BXadd), and the multiplicative part of the safety distance (BXmult).The AX parameter is the average desired distance between stationary vehicles, and is usedwith the BXadd and BXmult parameters to determine the desired following distance of avehicle [58]. A vehicle can perform a lane change, either to turn left or right, or becauseit has a higher speed than the vehicle in front and there is more space in an adjacentlane. The lane change decision depends on the desired safety distance parameters (i.e.,BXadd and BXmult), as well as on the speeds and decelerations of the vehicle making thelane change and the vehicle coming from behind in the destination lane. The VISSIMsimulation parameters are summarized in Table 4.2.
As shown in Figs. 4.8a and 4.8b, for all the vehicle densities under consideration, theVeMAC protocol can successfully deliver almost all the periodic and event-driven safetymessages to all the vehicles in the one-hop neighbourhoud. At the highest vehicle density,the VeMAC protocol achieves around 23% and 32% higher goodput respectively in the pe-riodic and event-driven safety message goodputs, as compared to the IEEE 802.11p. Fig.4.8c shows the significant difference in the probability of a transmission collision achievedby the two protocols. For instance, when the number of vehicles is 839, the probabilityof a collision of a periodic (event-driven) safety message for the IEEE 802.11p is around 2
61
4. Performance Evaluation of VeMAC Supporting VANET Safety Applications
292 603 839 9480
1
2
3
4
5
6
7
8
9
10
11
Number of vehicles
Periodic message goodput
(message/s/vehicle)
VeMAC
802.11p
(a) Periodic message goodput
292 603 839 9480
0.5
1
1.5
2
2.5
3
3.5
Number of vehicles
Eve
nt−
drive
n m
ess
ag
e g
oo
dp
ut
(me
ssa
ge
/s/v
eh
icle
)
VeMAC
802.11p
(b) Event-driven message goodput
200 400 600 800 100010
−4
10−3
10−2
10−1
100
Number of vehicles
Pro
ba
bili
ty o
f a
tra
nsm
issi
on
co
llisi
on
Periodic
Event−driven
802.11p
VeMAC
(c) Probability of a transmission collision
292 603 839 9480
5
10
15
20
25
30
35
40
Number of vehicles
Overhead (percent)
VeMAC
802.11p
(d) Overhead
Figure 4.8: Simulation results for the city scenario: goodput, probability of a transmissioncollision, and protocol overhead.
62

4.3. Comparison of VeMAC with IEEE 802.11p
order of magnitude (1.5 order of magnitude) greater than for the VeMAC protocol. Onemain reason of the high probability of a transmission collision for the IEEE 802.11p isthe hidden terminal problem, since for broadcast packets, no handshaking [request-to-send (RTS)/clear-to-send (CTS)] information exchange is used and no acknowledgementis transmitted from any recipient of the packet [22]. Another reason is that, although thesmall contention window (CW) size assigned to the AC VO and AC VI allows the safetypackets to be transmitted with small delays, it increases the probability of a transmissioncollision when multiple vehicles within the same THS are simultaneously trying to broad-cast their safety packets. Further, if a transmission collision of a broadcast packet happens,the CW size is not doubled (such as in the unicast case), as there is no collision detectionwithout CTS and acknowledgment packets.
The reduction in the probability of a transmission collision by the VeMAC protocol,which results in the high periodic and event-driven message goodputs in Figs. 4.8a and4.8b, is achieved at the expense of an increase in the protocol overhead as shown in Fig.4.8d. The main source of the VeMAC overhead is that every Type1 packet transmittedby a certain vehicle x includes the set of VeMAC IDs (as indicated in Table 4.1), and thecorresponding time slot indices, of each one-hop neighbour in Nx. On the other hand, theoverhead of the IEEE 802.11p protocol is due to control information such as the framecheck sequence (FCS) and the physical layer convergence procedure (PLCP) header. Atlow vehicle density, the overheads of the VeMAC protocol and IEEE 802.11p are similar,as shown in Fig. 4.8d. However, when the vehicle density increases, the overhead of theIEEE 802.11p remains the same, while that of the VeMAC protocol increases due to alarge number of one-hop neighbours of each vehicle, which results in a large amount ofcontrol information included in the header of transmitted Type1 packets. Note that, allthe VeMAC control information is transmitted on the CCH, which is reserved only forthe transmission of safety messages and control information. As well, the VeMAC controlinformation provides each vehicle with knowledge about all the other vehicles in the two-hopneighbourhood. This knowledge can reduce the overhead of some layer 3 protocols, suchas the elimination of the Hello messages of position based routing protocols. On the otherhand, in a high vehicle density scenario, a large size of the VeMAC control informationmay increase the number of fragments of each periodic safety message broadcast by anRSU. This excess fragmentation can result in a higher delay of a periodic safety message,unless the RSU accesses more periodic time slots per frame, kp, to serve the periodic safetymessage queue. The VeMAC overhead can be significantly reduced if each vehicle, x,broadcasts the VeMAC IDs and the corresponding time slot indices of the nodes in set Nxonce every m frames, instead of once in every frame as described in Section 3.2. However,since the VeMAC IDs of set Nx and the corresponding time slot indices broadcast by a
63

4. Performance Evaluation of VeMAC Supporting VANET Safety Applications
292 603 839 9480
10
20
30
40
50
60
70
80
Number of vehicles
To
tal d
ela
y (m
s)
Periodic
Event−driven
(a) Average total delay for VeMAC
0 100 200 300 400 500 600 700 800 900 10000
1
2
3
4
5
6
7
8
9
10
Vehicle index
Periodic message fairness indicator
(percent)
(b) Periodic fairness indicator for VeMAC
0 100 200 300 400 500 600 700 800 900 10000
1
2
3
4
5
6
7
Vehicle index
Eve
nt−
drive
n m
ess
ag
es
fairn
ess
ind
ica
tor
(pe
rce
nt)
(c) Event-driven fairness indicator for VeMAC
Figure 4.9: Simulation results for the city scenario: total delay and fairness indicators of theVeMAC protocol.
64

4.4. Summary
certain node x are required for the one-hop neighbours to detect any transmission collision,as described in Subsection 3.2, the lack of broadcasting this control information in eachframe (i.e., m > 1) may result in a longer time duration for a colliding node to detect atransmission collision, and consequently to resolve the collision by releasing its time slotand acquiring a new one, a behaviour which can increase the rates of access collisions andmerging collisions. The effect of the reduction of the VeMAC overhead when m > 1 on theother performance metrics and on the multihop broadcast service (described in Subsection5.2.2) needs further investigation.
The total delay of the VeMAC protocol for the periodic and event-driven safety messagesis shown in Fig. 4.9a. For both types of safety messages, the VeMAC achieves a total delaythat is well below 100 ms. One reason of the relative increase in the VeMAC delays at thehighest vehicle density is the high contention on the time slots among different vehicles,which may force a vehicle to delay the transmission of a safety packet until a time slotis available. To study the fairness of the VeMAC protocol, Figs. 4.9b and 4.9c show thefairness indicators of the periodic and event-driven messages respectively at the highestvehicle density under consideration. The periodic (event-driven) message fairness indicatoris below 0.3% (0.2%) for most of the vehicles, with a maximum value of 8.3% (6.2%). Theseresults indicate that, even in a high vehicle density, the VeMAC protocol allows all thevehicles to transmit their safety messages in a fair way.
4.4 Summary
This chapter presents a detailed delivery delay analysis for VANET safety messages broad-cast on the CCH, based on the VeMAC protocol described in Chapter 3. Both queueingand service delays of periodic and event-driven safety messages are analyzed, by takinginto consideration the size and the arrival pattern of each type of safety messages. Thedelay analysis helps to determine the values of VeMAC parameters, such as τ, kp, ke, and L,to satisfy the delay requirement of periodic and event-driven safety applications. Theseprotocol parameter values are used to compare the performance of VeMAC with that ofthe IEEE 802.11p standard via computer simulations in a square network and in a cityscenario consisting of roads around the UW campus. Simulation results show that, theVeMAC protocol has a low probability of a transmission collision, which results in a highersafety message goodput and better channel utilization, as compared with the IEEE 802.11pstandard. Also, for both types of safety messages, the VeMAC protocol achieves a totaldelivery delay that is well below 100 ms, which represents the maximum delay requiredfor most of the safety applications. Additionally, by using suitable values of the VeMAC
65
4. Performance Evaluation of VeMAC Supporting VANET Safety Applications
parameters, the protocol allows all the vehicles to transmit their safety messages in a fairway, even in a high vehicle density scenario. Chapter 5 shows how some VeMAC features,such as the knowledge of all the nodes which exist in a two-hop neighbourhood, can beexploited for designing an efficient network layer protocol.
66

Chapter 5
Gateway Placement and PacketRouting For Multihop In-VehicleInternet Access
As discussed in Section 1.2.2, In-vehicle Internet access is a VANET application whichaims at providing the vehicle passengers with a low-cost access to the Internet via on-road gateways. This chapter first develops a new deployment technique to determinethe locations of the Internet gateways on the roads and define the maximum number ofhops that a gateway can use to communicate with a certain vehicle [43]. The proposedtechnique minimizes the total cost of gateway deployment, and guarantees that a vehiclecan connect to an Internet gateway with a probability greater than a specified threshold.The probability that a vehicle can connect to a certain gateway is the probability of theexistence of a network path between them, where the network path consists of a maximumnumber of hops that is determined by the proposed technique for each deployed gateway.To the best of our knowledge, no previous strategy for gateway placement has consideredthe existence of network paths among the vehicles and the deployed gateways. Since theexistence of a network path mainly depends on the vehicle traffic conditions in the regionwhere the gateways are deployed, the VISSIM vehicle traffic simulator [49] is employedto simulate the vehicle movement in the deployment region. The proposed strategy isevaluated by considering the gateway placement on the roads around the UW campus.
In addition to the deployment strategy of Internet gateways, this chapter introduces anovel packet routing scheme which allows a vehicle to discover the existence of an Internetgateway and to send/receive packets to/from the gateway via multihop communications
67

5. Gateway Placement and Packet Routing For Multihop In-Vehicle Internet Access
[42, 43]. The proposed routing scheme is designed over the VeMAC protocol to exploit someuseful VeMAC features, such as the knowledge of all the nodes which exist in a two-hopneighbourhood. This VANET architecture aims at achieving multihop in-vehicle Internetaccess by using the routing scheme, while satisfying the QoS requirements of the safetyapplications via the VeMAC protocol. The proposed cross-layer design between the MACand network layers is evaluated in a highway scenario by studying the end-to-end delayrequired to deliver a packet from a vehicle to a gateway through multiple relay vehicles.The packet queueing at each relay vehicle is considered in the end-to-end packet delayanalysis. Another performance metric under consideration is the percentage of time slotsper frame occupied by all the vehicles members of the same THS, required to limit theaverage packet delay to below a certain threshold at each vehicle. Numerical results arepresented to study the effect of different parameters, including the vehicle density and thepacket arrival rate, on the performance metrics.
5.1 Gateway Placement
In order to deploy Internet gateways in a certain geographical region, the map of theregion is partitioned into equal-size square areas, called cells, by overlaying a uniformsquare grid over the map. Each cell which cannot be traversed by a vehicle (e.g., a cellwith no overlap with any part of the roads) is removed from the set of cells, and the rest ofthe cells are indexed from 1 to Ncells , where Ncells denotes the total number of remainingcells. Potential locations for deploying an Internet gateway are defined on the map (e.g.,equally spaced along each road) and the total number of potential gateway locations isdenoted by Ngate . The potential locations are indexed from 1 to Ngate , and the cost ofdeploying a gateway at the jth location is denoted by γj. If a gateway is deployed at thejth location, j = 1, ..., Ngate , let ρj denote the maximum number of hops that the gatewaycan use to connect to a certain vehicle, and ρmax the maximum allowed value of ρj for anyj. Given the potential gateway locations, it is required to find an optimal set J of locationindices, and determine the values of ρj ∀j ∈ J . Set J and the corresponding ρj valuesshould minimize the total cost of gateway deployment, while ensuring that the number ofgateways, which a vehicle located at the ith cell can connect to, is not less than a specifiedvalue denoted by νi, each with a probability not less than a specified threshold, denotedby αi ∈ (0, 1], i = 1, ..., Ncells . Based on the vehicle traffic conditions in the region wherethe gateways are deployed, let σijk denote the probability that a vehicle at the ith cell canreach a gateway at the jth position within k hops, where i = 1, ..., Ncells , j = 1, ..., Ngate ,and k = 1, ..., ρmax . The values of σijk ∀i, j, k can be calculated by using a simulation
68

5.1. Gateway Placement
model of the vehicle traffic in the region where the gateways are deployed, as described inSubsection 5.4.1. For each cell i, define set βi as the index set of all gateways which canbe reached by a vehicle located in cell i within ρmax hops, i.e., βi = {j : σijρmax 6= 0}.
The gateway deployment is formulated by binary integer programming problem (5.1),which has three sets of decision variables: xj, yjk, and zim, where i = 1, ..., Ncells , j =1, ..., Ngate , k = 1, ..., ρmax , and m ∈ βi for each i. Let xj = 1 iff a gateway is deployed atthe jth potential gateway location, and yjk = 1 iff a gateway is deployed at the jth locationand has ρj = k. Therefore, objective function (5.1a) represents the total cost of gatewaydeployment. For the third set of decision variables, constraints (5.1b)-(5.1d) ensure that,a variable zij = 1 if [only if] a gateway is deployed at the jth location and can reach avehicle at the ith cell within ρj hops with a probability greater than [greater than or equalto] αi. Given this proposition, constraint (5.1e) guarantees that a vehicle at any cell i cancommunicate with at least νi gateways, each with a probability not less than αi. To showthe validity of the proposition, first suppose that xj′ = 1 for a certain j′ ∈ {1, ..., Ngate}.Hence, constraint (5.1b) ensures that there exists exactly one value k′ ∈ {1, .., ρmax} suchthat yj′k′ = 1, which means ρj′ = k′. Consequently, for each cell i such that j′ ∈ βi, dueto constraints (5.1c) and (5.1d), zij′ = 1 if σij′k′ > αi, and zij′ = 0 if σij′k′ < αi (note
thatρmax∑k=1
σij′kyj′k = σij′k′). If it happens that σij′k′ = αi, the value of zij′ can be 0 or
1 (more likely the solver let zij′ = 1 to satisfy constraint (5.1e)). On the other hand, ifxj′ = 0, then constraint (5.1b) sets yj′k = 0 ∀k, while constraints (5.1c) and (5.1d) setzij′ = 0 ∀i such that j′ ∈ βi.
minimizexj ,yjk,zim∈{0,1}
∀i,j,k,m
Ngate∑j=1
γjxj (5.1a)
subject to
ρmax∑k=1
yjk = xj, j = 1, ..., Ngate , (5.1b)
zim ≥( ρmax∑k=1
σimkymk
)− αi, i = 1, ..., Ncells ,m ∈ βi, (5.1c)
zim ≤ 1 +( ρmax∑k=1
σimkymk
)− αi, i = 1, ..., Ncells ,m ∈ βi, (5.1d)
∑m∈βi
zim ≥ νi, i = 1, ..., Ncells . (5.1e)
69

5. Gateway Placement and Packet Routing For Multihop In-Vehicle Internet Access
Note that, the solution of problem (5.1) depends on the values of σimk in constraints (5.1c)and (5.1d), which mainly depend on the vehicle traffic conditions in the region where thegateways are deployed, as will be shown in Subsection 5.4.1. The traffic conditions indifferent situations (e.g., weekday, weekend, morning, rush hour, etc.) can be simulated bythe traffic simulator which generates the σimk values, by adjusting suitable parameters suchas the rate of vehicle arrivals to the road network, the probabilities of a left or right turnat intersections, the schedule of public transit buses, etc. Additionally, special incidencescan be introduced in the simulation, such as an accident or a road closure, to simulate thevehicle traffic during such events. Hence, problem (5.1) can be solved by using the σimkvalues obtained from the simulator based on target vehicle traffic.
5.2 Packet Routing Scheme
The proposed packet routing scheme consists of two main components: 1. gateway discov-ery, which determines how the vehicles discover the existence of a gateway and how theyobtain the information necessary to connect to that gateway; and 2. packet forwarding,which defines how a packet is delivered via multihop communications from a vehicle to agateway and vice versa.
5.2.1 SCH Packet Queueing and Serving
For a certain node, x, letQx denote the set of time slots acquired by node x on the CCH. Ateach node, the packets which require transmission over the SCHs are queued and served ona first-come-first-served basis as follows. Suppose that node x needs to transmit a packetto its one-hop neighbour y on a SCH. At its first opportunity to access the CCH, node xuses the corresponding time slot in set Qx to announce for node y the index of the SCHover which the packet will be transmitted. Following this announcement, both of nodes xand y turn Transceiver2 to the correct SCH and exchange packets (this SCH access schemeis different from the one described in Section 3.3 based on TDMA). In each time slot inQx, node x can announce on the CCH for a maximum of b packets to be transmitted onthe same SCH (not necessarily to the same one-hop neighbour). At the start of a time slotin Qx, if the number of queued packets is less than the constant b, referred to as the batch-size, node x does NOT wait until the number of queued packets reaches b, but announceson the CCH to transmit the existing packets on the chosen SCH. Only one SCH index canbe announced by node x in a time slot on the CCH, and the batch-size b represents the
70

5.2. Packet Routing Scheme
maximum number of packets which can be transmitted by node x on the SCH after eachannouncement.
5.2.2 Gateway Discovery
In order to announce for its service, a gateway, g, periodically broadcasts a gateway dis-covery packet (GDP) containing the necessary information that a vehicle needs to accessthe gateway’s service, such as the network layer address of gateway g and the maximumnumber of hops, ρg, that it can use to communicate with a certain vehicle, where ρg is de-termined as described in Section 5.1. Before broadcasting a GDP, as mentioned in Section5.2.1, gateway g first announces on the CCH the index of the SCH over which the GDPwill be broadcasted. Accordingly, each one-hop neighbour which receives the announce-ment turns its Transceiver2 to the correct SCH in order to receive the GDP. Among theseone-hop neighbours, a subset is chosen to re-broadcast the GDP, and so on, until the GDPinitiated by gateway g propagates ρg hops away from the gateway. The propagation of theGDP in the network is controlled via a time-to-live (TTL) field in the GDP header, whichis originally set to ρg − 1 by gateway g and decremented by each vehicle which relays theGDP. Every GDP is identified by a broadcast ID, together with the network layer addressof the gateway which initiated the GDP. These two fields are used by a vehicle to discardany duplicate of a previously received GDP. At each hop, the subset of the vehicles whichrelay the GDP is determined as follows. Suppose that a node, x, announces for a GDP onone of its time slots, tx, on the CCH. For each node y which receives the announcement, letDy denote the set of one-hop neighbours of node y which did not receive the announcementfor the GDP sent by node x. Node y does NOT relay the GDP if any of the followingconditions holds:
• TTL = 0;
• Dy = φ;
• ∃ z ∈ Ny\Dy such that Dy ⊆ Nz and |Ny| < |Nz|, where | · | denotes the cardinalityof a set;
• ∃ z ∈ Ny\Dy such that Dy ⊆ Nz, |Ny| = |Nz|, and mintz∈Qz
tz − tx + L × I(tz<tx) <
minty∈Qy
ty − tx + L × I(ty<tx), where the notation I(a<b) equals 1 if a < b and equals 0
otherwise.
71

5. Gateway Placement and Packet Routing For Multihop In-Vehicle Internet Access
Figure 5.1: The GDP relaying process based on a time slot assignment on the CCH.
When node y receives an announcement for the GDP from node x on time slot tx, itlistens to the CCH for the L−1 time slots following tx. At the end of this listening period,node y can determine sets Qz and Nz for each one-hop neighbour z (recall that, each one-hop neighbour z broadcasts the VeMAC IDs of the nodes in its Nz set at least once in eachframe). Consequently, node y sets Dy = {z ∈ Ny : IDx
tx is not broadcasted by node z},where IDtx is the VeMAC ID of node x corresponding to time slot tx. Consequently, nodey relays the GDP if none of the mentioned conditions is true. The last condition meansthat, node y does not relay the GDP if it has a one-hop neighbour z which satisfies thatDy ⊆ Nz and |Ny| = |Nz|, and which can access the CCH before node y at the end of thelistening period following time slot tx. This condition allows for a faster propagation ofthe GDP in the network by choosing the relay which can announce for the GDP on theCCH first.
Fig. 5.1 explains how a GDP broadcasted by gateway g is delivered to all the vehicleslocated within ρg = 3 hops from the gateway by using a few number of transmissions. InFig. 5.1, a group of nodes is surrounded by an ellipse iff any two nodes in the group canreach each other in one hop (the same applies to Fig. 5.2). That is, the set of one-hopneighbours of a node, x, consists of all the nodes that are surrounded with node x bya certain ellipse. Fig. 5.1 also shows the time slot assignment on the CCH for all thenodes. Note that, different nodes may access the same time slot if they do not belong tothe same THS, e.g., nodes x and w accessing time slot number 7. Each time slot thatis highlighted in Fig. 5.1 is a time slot over which an announcement for the GDP isbroadcasted. When gateway g announces for the GDP in the first frame, vehicles h, i, andj receive the announcement and listen to the CCH for a duration of 9 time slots (L = 10)in order to decide whether or not to relay the GDP. Vehicle h does not relay the GDPbecause Dh = φ. Similarly, vehicle j does not relay the GDP since Dj = {m,n, u, v} ⊆ Ni,
72

5.2. Packet Routing Scheme
|Nj| = |Ni|, and vehicle i can access the CCH before vehicle j at the end of the listeningperiod. Consequently, vehicle i is the only vehicle which relays the GDP at the first hop. Atthe second hop, vehicles u, v, m, and n receive the GDP relayed by vehicle i. Vehicle v relaysthe GDP since none of its one-hop neighbours, u, m, and n (which received the GDP fromvehicle i) can reach vehicles x and y in the third hop, i.e., @ z ∈ Nv\Dv such that Dv ⊆ Nz.On the other hand, among the three vehicles u, m, and n, only vehicle u relays the GDP,while vehicles m and n do not, for the same reason explained before for vehicle j. At thispoint, TTL = 0 as it has been decremented by the first and second hop relays. Hence, atthe third hop, when vehicles, x, y, and w receive the GDP, none of these vehicles will relayit further. Note that, when a certain relay broadcasts the GDP, every vehicle which haspreviously received the same GDP can discard the relayed copy by checking the broadcastID and the address of the initiating gateway, e.g., nodes j and h discard the GDP relayedby node i.
5.2.3 Packet Forwarding
The packet routing from a vehicle to a gateway is done in a proactive way. That is, eachvehicle, v, stores a routing table which has an entry corresponding to each gateway g locatedwithin ρg hops from vehicle v. Each routing table entry at vehicle v consists of the networkaddress of a certain gateway, the number of hops that the gateway can be reached in, andthe MAC addresses of the one-hop neighbours of vehicle v which can relay a packet to thegateway. The routing table entry corresponding to a gateway, g, is created/updated duringthe propagation of each GDP broadcasted by gateway g, as explained in the following. Eachvehicle, v, which relays a GDP initiated by gateway g includes in the relayed GDP theVeMAC IDs of a subset of its one-hop neighbours as potential vehicles which can relay apacket to gateway g. This set of potential relays included by vehicle v is denoted by Rv,and the cardinality |Rv| should be limited to a certain number, denoted by nR . The setRv consists of the one-hop neighbours of vehicle v which received the GDP and which canreach (in one hop) the highest number of one-hop neighbours of vehicle v which have notyet received the GDP, i.e., Rv = {z ∈ Nv\Dv : |Rv| ≤ nR ,Dv ∩ Nz 6= φ, |Dv ∩ Nz| ≥|Dv ∩ Nz′ | ∀ z′ /∈ Rv}. If vehicle v has more than one one-hop neighbour z ∈ Nv\Dv thathave the same |Dv ∩Nz| > 0, vehicle v gives priority of inclusion in set Rv to the one-hopneighbours that are farther from the node from which vehicle v has received the GDP(each vehicle is aware of the positions of all its one-hop neighbours, which are includedin the headers of their transmitted Type1 packets). The reason is that, those one-hopneighbours are likely to be closer to the vehicles to which vehicle v is going to relay theGDP. When a vehicle, w, receives the GDP relayed by vehicle v, by calculating Rv ∩Nw,
73

5. Gateway Placement and Packet Routing For Multihop In-Vehicle Internet Access
Figure 5.2: Routing tables update during a GDP propagation.
vehicle w determines the set of its one-hop neighbours which can relay a packet to gatewayg. Also, by subtracting the TTL field from ρg, vehicle w determines the number of hopscurrently separating it from gateway g. Consequently, vehicle w creates/updates the entryin its routing table corresponding to gateway g. If vehicle w does not receive a GDP fromgateway g for a time duration larger than a specified threshold, the entry corresponding togateway g is removed from the routing table. The GDPs should be broadcasted by eachgateway at a broadcast rate which ensures that the routing table at each vehicle is alwaysup-to-date based on the current network topology.
Fig. 5.2 explains how different vehicles update their routing table entries correspondingto gateway g. When the gateway broadcasts a GDP, among all the vehicles which receivethe GDP at the first hop (in the blue ellipse), only one vehicle will relay the GDP basedon the relaying scheme described in Subsection 5.2.2. If the time slot assignment on theCCH requires that vehicle e is the one to relay the GDP, and if we assume that nR = 4,then vehicle e includes in the relayed GDP set Re = {e, d, c, b}. We have Re = {e, d, c, b},because De = {h, i, f}, Ne\De = {e, d, c, b, a}, and De ∩ Na = φ. When the GDP relayedby vehicle e is received by vehicles f , h, and i at the second hop (in the red ellipse), each ofthese vehicles finds the intersection of its N set with the Re set, and updates the routingtable entry corresponding to gateway g accordingly. Vehicle f indicates in its routing tablethat vehicles e, d, c, and b can relay a packet to gateway g, while each of vehicles i andh only indicates vehicles e, d, and c as potential relays (since vehicle b is not a one-hopneighbour of either vehicle i or h). Similarly, at the second hop, assuming that vehicle idecides to relay the GDP, it includes set Ri = {i, h} in the relayed GDP, which is used byvehicle j at the third hop to determine the set of possible relays to gateway g by calculatingRi ∩Nj = {i, h}.
74

5.3. Performance Analysis
To deliver a packet from a vehicle to a gateway, the vehicle forwards the packet to arandomly chosen relay among the ones listed in the routing table entry corresponding tothe intended gateway. This process is repeated by each relay vehicle until the packet isfinally delivered to the destination gateway. For instance, in Fig. 5.2, if vehicle j wantsto send a packet to gateway g, by consulting its routing table, vehicle j will forward thepacket to either vehicle i or vehicle h equally likely. Then, assuming that vehicle j choosesvehicle h to relay the packet, vehicle h in turn forwards the packet to a randomly chosenrelay among vehicles e, d, and c, which delivers the packet directly to gateway g.
Unlike the packet routing from a vehicle to a gateway, which is done on a proactive hop-by-hop basis, packets are routed from a gateway to a vehicle on a reactive source-routingbasis. That is, a source gateway includes in the header of each transmitted packet theMAC address of each vehicle which should relay the packet until it reaches the destinationvehicle. This information about the whole network path to a certain vehicle, v, is providedto a gateway, g, through the packets that it receives from vehicle v. That is, each relaywhich forwards a packet from vehicle v to gateway g includes its MAC address in theheader of the relayed packet. In this way, gateway g can find a network path to vehicle vby reversing the order of the relays in the header of the most recent packet received fromvehicle v. Note that, the way that the routing table at each vehicle is built ensures thatall the links on a network path from a vehicle to a gateway are bidirectional. If gateway gdoes not have information about the network path to a certain vehicle, or if the availablenetwork path has not been updated for a time duration larger than a specified threshold,the gateway broadcasts a route-request packet, which propagates in the network as theGDP does, until it reaches the destination vehicle. The vehicle then replies by a route-reply packet which accumulates a network path in its header while propagating back tothe gateway.
5.3 Performance Analysis
This section investigates the end-to-end delay required to deliver a packet from a vehicleto a gateway through multiple relay vehicles on a SCH. Another performance metric underconsideration is the percentage of time slots per frame occupied by all the vehicles membersof the THS, required to limit the average packet delay to below a certain threshold at eachvehicle. The total delay that a packet encounters at each vehicle consists of two maincomponents: queueing delay and service delay1. The queueing delay is the time duration
1The definitions of the queueing and service delays of a packet transmitted over a SCH are differentfrom those mentioned in Section 4.1 for a safety message transmitted over the CCH.
75

5. Gateway Placement and Packet Routing For Multihop In-Vehicle Internet Access
from the instant that a packet arrives to the queue of a certain vehicle to the instantthat the vehicle starts to announce for the transmission of the packet on the CCH. Thisdelay includes the time duration that the packet spends in the queue until it becomes inthe HOL batch, i.e., among the first b packets, and the duration that the transmittingvehicle spends on waiting for one of its acquired time slots on the CCH (to announce theindex of the SCH over which the HOL batch will be transmitted). On the other hand,the service delay of a tagged packet in the HOL batch consists of the duration of one timeslot, which is used to transmit the announcement for the HOL batch on the CCH, and thetime duration required to deliver the tagged packet in the HOL batch to its destinationone-hop neighbour on the announced SCH. The analysis in this section neglects the secondcomponent of the packet service delay, which in general is relatively short compared to thepacket queueing delay. When “delay” is mentioned solely, it refers to the total delay, whichis the sum of the queueing delay and the duration of one time slot. To simplify the delayanalysis, we assume that each vehicle, x, releases its time slot(s) in set Qx and acquires anew one(s) after each time it accesses the CCH. This assumption guarantees that, at eachvehicle, the intervals of time between successive occasions of announcement for an HOLbatch on the CCH are i.i.d. random variables. The assumption is appropriate in scenarioswith high rates of transmission collisions, where the vehicles repeatedly release their timeslots and acquire new ones. Consequently, each vehicle can be modeled as a queueingsystem with independent time intervals between successive occasions of service, where thepackets are served in batches of a maximum batch-size b. In such a queuing system, whenthe packets arrive according to a Poisson process, we denote the system by M/G(b)/1.Hence, by considering only the arrival of packets generated at the application layer of acertain vehicle (assuming Poisson arrivals), the vehicle can be modeled as an M/G(b)/1queueing system. However, each vehicle not only transmits the packets generated at itsown application layer, but also relays the packets arriving from its one-hop neighbours.Therefore, in order to analyze the end-to-end packet delay, a network of M/G(b)/1 queuesshould be considered. The exact analysis of such a network of queues is extremely difficult,even when b = 1 [51]. Hence, to make the analysis tractable, we approximate the arrivalof packets which should be relayed by a vehicle as a single Poisson process with rateparameter equal to the sum of the packet arrival rates coming to the relay vehicle from allits one-hop neighbours. That is, the superposition of the departure processes of a number,Ninput, of M/G(b)/1 queues (representing Ninput one-hop neighbours of a relay vehicle) is
approximated by a Poisson process with rate parameter ΣNinput
i=1 ξi, where ξi is the packet
arrival rate coming from the ith M/G(b)/1 queue to the relay vehicle.
To study the accuracy of this approximation, Fig. 5.3 compares the average packetdelay at a relay vehicle when the packets arrive to the relay according to a Poisson process
76

5.3. Performance Analysis
(a) Actual scenario (b) Poisson process approximation
0.3 0.35 0.4 0.45 0.5 0.55 0.6 0.65 0.7 0.75 0.8 0.8530
40
50
60
70
80
90
100
110
Ave
rage
pac
ket d
elay
(m
s)
M/G(b)/1 N
input = 1
Ninput
= 2
Ninput
= 4
Ninput
= 8
Ninput
= 16
Ninput
= 32
(c) Average packet delay at the relay vehicle vs. theratio %
Figure 5.3: A relay vehicle with Ninput one-hop neighbours in comparison with an M/G(b)/1queueing system with b = 16.
with rate parameter ξ, as shown in Fig. 5.3b, with that in an actual case when the relayreceives packets from the output of Ninput M/G(b)/1 queues, each with a packet arrivalrate of ξ
Ninput, as shown in Fig. 5.3a. For the case in Fig. 5.3b, the average packet delay
at the relay vehicle is calculated based on the analysis of the M/G(b)/1 queuing system(Subsection 5.3.3), while for that in Fig. 5.3a, the average delay is obtained by usingMATLAB simulations, where the packets are served at the relay vehicle and at each ofthe Ninput vehicles according to the VeMAC protocol. Fig. 5.3c shows the average packetdelay at the relay vehicle versus a ratio, %, which denotes the average number of packetarrivals between two successive occasions of service divided by b. As shown in Fig. 5.3c, fordifferent % values, the average packet delay of the M/G(b)/1 queue represents a lower boundon the average delay when the packets arrive to the relay from Ninput different vehicles.
77

5. Gateway Placement and Packet Routing For Multihop In-Vehicle Internet Access
(a) Vehicle and hop-region indexing
(b) Focus on the mth and (m− 1)st hop-regions
Figure 5.4: Highway segment consisted of M hop-regions.
The lower bound becomes tighter for a large Ninput, which indicates that the suggestedPoisson process approximation is more accurate in a higher vehicle density scenario, whenthe packets arrive to a relay vehicle from a larger number of one-hop neighbours. Similarresults are found for different values of the batch-size b. Based on the Poisson processapproximation, the average packet delay at each vehicle is found by using the analysis ofthe M/G(b)/1 queuing system. However, the main challenge remains in the calculation ofthe total packet arrival rate at a relay vehicle based on the routing scheme in Section 5.2,which depends mainly on the network topology. In the following, a highway model is firstdescribed, then the total packet arrival rate, end-to-end-packet delay, and percentage ofoccupied time slots per frame are evaluated.
5.3.1 Highway Model
Consider a highway segment consisted of Nlanes lanes, where at any time instant the vehi-cles are distributed in each lane according to a Poisson process with rate parameter ηlane(vehicles/mile). By neglecting the width of the highway and the dimensions of a vehiclerelative to the communication range, R, the vehicles are distributed along the highwayaccording to a single Poisson process with rate parameter η = Nlanes ηlane, as shown in Fig.5.4a (where the black dots represent vehicles). A gateway is placed at the right end of
78

5.3. Performance Analysis
the highway segment and serves all the vehicles located within M hops of the gateway.We define M hop-regions, as shown in Fig. 5.4a, and assume that at any time instantthere is at least one vehicle in each hop-region, i.e., there exists a network path betweenthe gateway and each vehicle located within M hops of the gateway. The network pathfrom any vehicle to the gateway is always up-to-date, thanks to the periodically broad-casted GDPs (Section 5.2.2). In each of the M hop-regions, the vehicles are indexed inan increasing order starting from the vehicle that is farthest from the gateway, as shownin Fig 5.4a. Based on the routing scheme in Section 5.2, only the first nR vehicles ineach hop-region can relay packets to/from the gateway. As illustrated in Fig. 5.4b, at acertain time instant, Nm denotes the number of vehicles located in the mth hop-region,Gm the gap between the first vehicle in the mth hop-region and the farthest edge of theregion with respect to the gateway, Hm the distance separating the first vehicle in the mth
hop-region and that in the (m − 1)st hop-region, and Wmi the distance between the first
vehicle in the mth hop-region and the ith vehicle (if exists) in the same region, where allthese random variables are defined for m = 1, ...,M and i = 1, ...,∞ (except H1, whichis not defined). The event that Nm takes a value nm is denoted by Nm, and the samenotation applies to all other random variables, i.e., Gm, Hm, and Wm
i . Conditional on theoccurrence of an event E , the probability density function (PDF) of a continuous randomvariable X is denoted by fX|E(x), the PMF of a discrete random variable Y is denotedby p(Y = y|E), and the probability of the occurrence of another event E ′ is denoted byp(E ′|E). The expected value of a random variable Z (discrete or continuous) is denotedby E(Z). The set of events Um
i,r, m = 2, ...,M , i = 1, ...,∞, and r = 1, ...,∞, denotes thatthe ith vehicle in the mth hop-region exists and its communication range can reach the rth
vehicle in the (m − 1)st hop-region. Similarly, the set of events Vmi,r denotes that the ith
vehicle in the mth hop-region exists and uses the rth vehicle in the (m − 1)st hop-regionas a relay to the gateway. Indicator random variable Imi,r is equal to 1 whenever event Vm
i,r
occurs, and is equal to 0 otherwise. Packets are generated at the application layer of eachvehicle according to a Poisson process with rate parameter λ. At the rth vehicle (if exists)in the mth hop-region, let λmr , Qm
r , and Smr , m = 1, ...,M and r = 1, ...,∞, respectivelydenote the total packet arrival rate, the packet queueing delay, and the time duration (inthe unit of a time slot) between successive occasions of announcement for an HOL batch onthe CCH. Let Dm
v (Dmr ), m = 1, ...,M (m = 1, ...,M − 1) denote the average packet delay
at a randomly chosen vehicle (relay) in the mth hop-region. Also, let Em, m = 1, ..,M ,denote the average end-to-end delay from a randomly chosen vehicle in the mth hop-regionto the gateway.
79

5. Gateway Placement and Packet Routing For Multihop In-Vehicle Internet Access
5.3.2 Total Packet Arrival Rate
The total packet arrival rate, λmr , for the relay and non-relay vehicles is represented re-spectively by
λmr =
λ+ E(
∞Σi=1λm+1i Im+1
i,r ), 1 ≤ r ≤ nR ,
1 ≤ m < M ;
λ, r > nR or m = M.
(5.2)
For a relay vehicle (1 ≤ r ≤ nR , 1 ≤ m < M),
λmr = λ+∞∑i=1
λm+1i p(Im+1
i,r = 1)
= λ+∞∑i=1
λm+1i p(Vm+1
i,r ).
(5.3)
The probability p(Vm+1i,r ) can be found by summing the probabilities of the intersection of
the event Vm+1i,r with the disjoint events Um+1
i,k , k = r, ...,∞, i.e.,
p(Vm+1i,r ) = p(
∞⋃k=r
Vm+1i,r ∩ Um+1
i,k )
=∞∑k=r
p(Vm+1i,r ∩ Um+1
i,k )
=∞∑k=r
1
min(k, nR)p(Um+1
i,k ),
(5.4)
where min(k, nR) denotes the minimum of k and nR , and 1min(k,nR )
represents the probability
p(Vm+1i,r |Um+1
i,k ) according to the routing scheme in Section 5.2, since a vehicle in the (m+1)st
hop region is aware of a maximum of nR relay vehicles in the mth hop region and randomlychooses one among all the relay vehicles that it can reach. The probability p(Um+1
i,k ) can
be calculated for given values of the random variables Nm+1, Gm, Hm+1, and Wm+1i as
follows:
p(Um+11,k |Gm ∩ Hm+1) =
(η(R− hm+1)
)(k−1)e−η(R−hm+1)
(k − 1)!(5.5a)
80

5.3. Performance Analysis
p(Um+1i,k |Nm+1 ∩ Gm ∩ Hm+1 ∩Wm+1
i ) =(η(R− hm+1 +Wm+1
i ))(k−1)
e−η(R−hm+1+Wm+1i )
(k − 1)!, i > 1.
(5.5b)
Equations (5.5a) and (5.5b) are the probabilities of having exactly k − 1 vehicles in adistance R−hm+1 and R−hm+1 +Wm+1
i respectively. Note that (5.5b) is correct providedthat nm+1 ≥ i, otherwise p(Um+1
i,k |Nm+1∩Gm∩Hm+1∩Wm+1i ) = 0. By using (5.5a), (5.5b),
and the law of total probability, we have
p(Um+11,k ) =
∫ R
0
∫ hm+1
0
p(Um+11,k |Gm ∩ Hm+1) · fGm(gm) · fHm+1|Gm(hm+1, gm) dgm dhm+1
(5.6a)
p(Um+1i,k ) =
∞∑nm+1=i
∫ R
0
∫ R
Wm+1i
∫ hm+1−Wm+1i
0
p(Um+1i,k |Nm+1 ∩ Gm ∩ Hm+1 ∩Wm+1
i ) · fGm(gm)
· fHm+1|Gm(hm+1, gm) · p(Nm+1 = nm+1|Gm ∩ Hm+1)
·fWm+1i |Gm∩Hm+1∩Nm+1
(wm+1i , gm, hm+1, nm+1) dgm dhm+1 dw
m+1i , i > 1.
(5.6b)
The unknown PDFs and PMFs in (5.6) can be found as follows. The PMF p(Nm+1 =nm+1|Gm ∩ Hm+1) is the probability of having exactly (nm+1 − 1) vehicles in a distancehm+1 − gm, i.e.,
p(Nm+1 = nm+1|Gm ∩ Hm+1) =
(η(hm+1 − gm)
)nm+1−1e−η(hm+1−gm)
(nm+1 − 1)!. (5.7)
The PDF fGm(gm), m = 1, ...,M − 1, can be found in a recursive way by using [59]:
fG1(g1) =ηe−ηg1
1− e−ηR, 0 < g1 < R (5.8a)
fGm|Gm−1(gm, gm−1) =ηe−ηgm
1− e−η(R−gm−1), 0 < gm < R− gm−1, 1 < m ≤M (5.8b)
fGm(gm) =
∫ R−gm
0
fGm|Gm−1(gm, gm−1) · fGm−1(gm−1) dgm−1, 1 < m ≤M. (5.8c)
81
5. Gateway Placement and Packet Routing For Multihop In-Vehicle Internet Access
The PDF fHm+1|Gm (hm+1, gm), m = 1, ...,M − 1, is calculated by using [59]
fHm+1|Gm (hm+1, gm) =ηe−η(R−hm+1)
1− e−η(R−gm), gm < hm+1 < R. (5.9)
Finally, the PDF fWm+1i |Gm∩Hm+1∩Nm+1
(wm+1i , gm, hm+1, nm+1), m = 1, ...,M − 1 and i =
2, ...,∞, is the (i − 1)st order statistic of the uniform distribution (conditional on theexistence of nm+1 − 1 vehicles in a distance interval [0, hm+1 − gm], the locations of thesevehicles are i.i.d. uniformly distributed random variables), i.e.,
fWm+1i |Gm∩Hm+1∩Nm+1
(wm+1i , gm, hm+1, nm+1) =
(wm+1i )i−2(hm+1 − gm − wm+1
i )nm+1−i(nm+1 − 1)!
(hm+1 − gm)nm+1−1(nm+1 − i)!(i− 2)!.
(5.10)
Using (5.5), (5.7), (5.9), (5.10), the two equations (5.6a) and (5.6b) can be simplified to:
p(Um+11,k ) =
ηk
(k − 1)!
∫ R
0
∫ hm+1
0
(R− hm+1)(k−1) · e−2η(R−hm+1) · fGm(gm)
1− e−η(R−gm)dgm dhm+1
(5.11a)
p(Um+1i,k ) =
1
(k − 1)!(i− 2)!ηk+i−1
∫ R
0
∫ hm+1
0
∫ hm+1−gm
0
(wm+1i )i−2 · e−2η(R−hm+1+w
m+1i )
· (R− hm+1 + wm+1i )k−1 · fGm(gm)
1− e−η(R−gm)dwm+1
i dgm dhm+1, i > 1.
(5.11b)
By evaluating the integrals in (5.11) and substituting into (5.4) then (5.3), the total packetarrival rate at each vehicle can be calculated.
82

5.3. Performance Analysis
5.3.3 End-to-end Packet Delay
At the rth vehicle in the mth hop-region, by using λmr from Subsection 5.3.2, the PGF ofthe number of packet arrivals during Smr is denoted by K(z) and given by
K(z) =∞∑i=0
( L∑j=1
p(Smr = j)e−λ
mr jt(λmr jt)
i
i!
)zi
=L∑j=1
p(Smr = j)e−λmr jt(1−z)
(5.12)
where PMF p(Smr = j) is given by (Subsection 4.1.1.1, only the τ = 0 case is considered)
p(Smr = j) =
CL−j
kmr −1
CLkmr
, 1 ≤ j ≤ L− kmr + 1
0, elsewhere(5.13)
with kmr being the number of time slots that the rth vehicle in the mth hop-region acquiresper frame (over which the vehicle can transmit Type1 packets) and Cn
k = n!(n−k)!k! . By using
(5.12) and (5.13), the PGF of the number of packets in the queue just before the start ofthe service time of an HOL batch is denoted by Π(z) and given by [60]
Π(z) =
b−1∑j=0
πj(zb − zj)
zb
K(z)− 1
(5.14)
where constants πj, j = 0, ..., b−1, should be chosen such that the b zeros of the numeratorcancel the b zeros of the denominator on or inside the unit circle. Hence, by using theanalysis of the M/G(b)/1 queueing system [60], we have
E(Qmr ) =
Π′(1)− λmr tE(Smr )
λmr+tE((Smr )2)
2E(Smr )(5.15)
where Π′(1) = ddz
Π(z) evaluated at z = 1. Finally, the expected values of Dmv , Dm
r , andEm are given by the following set of equations:
E(Dmv ) =
∞∑i=1
p(Nm = i)1
i
i∑j=1
(E(Qmj ) + t), 1 ≤ m ≤M (5.16)
83

5. Gateway Placement and Packet Routing For Multihop In-Vehicle Internet Access
E(Dmr ) =
nR−1∑i=1
p(Nm = i)1
i
i∑j=1
(E(Qmj ) + t) + p(Nm ≥ nR)
1
nR
nR∑j=1
(E(Qmj ) + t), 1 ≤ m ≤M
(5.17)
p(N1 = i) =(ηR)ie−ηR
i!(1− e−ηR), i ≥ 1 (5.18a)
p(Nm = i) =
∫ R
0
∫ hm
0
p(Nm = i|Gm−1 ∩ Hm)·fGm−1(gm−1) · fHm|Gm−1(hm, gm−1) dgm−1 dhm
=ηi
(i− 1)!
∫ R
0
∫ hm
0
(hm − gm−1)i−1 · e−η(R−gm−1) ·fGm−1(gm−1)
1− e−η(R−gm−1)dgm−1 dhm,
1 < m ≤M, i ≥ 1
(5.18b)
E(E1) = E(D1v) (5.19a)
E(Em) = E(Dmv ) +
m−1∑i=1
E(Dir), 1 < m ≤M. (5.19b)
5.3.4 Percentage of Occupied Time Slots
Based on the batch-size b and λmr at the rth vehicle in the mth hop-region, consider thatthe vehicle adjusts its number of time slots per frame, kmr , to guarantee that the averagepacket delay, E(Qm
r ) + t, is below a threshold, denoted by dmax. This subsection studiesthe number of time slots per frame required by all the vehicles of the same THS in order tolimit the average packet delay at each vehicle below dmax. This number should not exceedL to avoid any hidden terminal problem and allow each vehicle to acquire a time slot onthe CCH. We define M − 1 two hop (TH) regions. The first TH region contains all thevehicles in the first and second hop-regions, while the mth TH region, m = 2, ...,M − 1,contains all the vehicles in the mth and (m + 1)st hop-regions, plus all the vehicles in the(m − 1)st hop-region which can reach at least one vehicle in the mth hop-region. Basedon this definition, the number of vehicles in each of TH regions 2 to M − 1 can be largerthan the number of vehicles which actually exist in one THS. The reason is that, a vehiclein the (m− 1)st hop-region which can reach some of the vehicles in the mth hop-region isnot necessarily a two-hop neighbour of all the vehicles in the (m + 1)st hop-region. Let
84
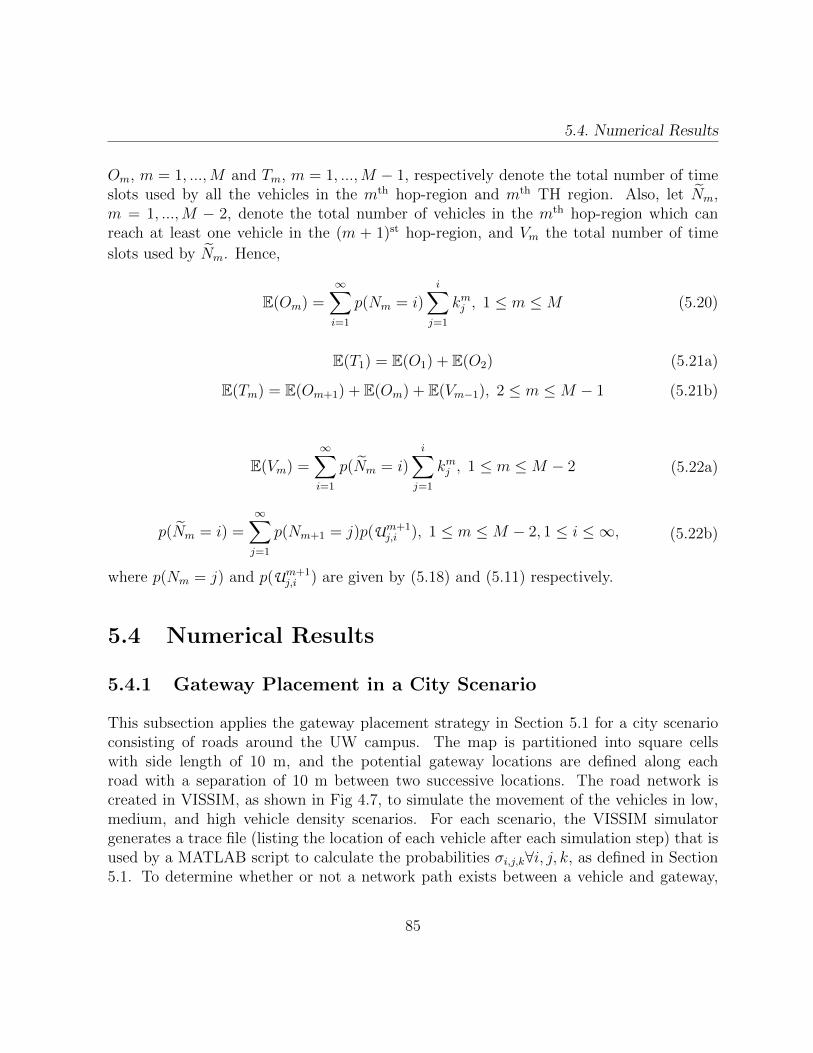
5.4. Numerical Results
Om, m = 1, ...,M and Tm, m = 1, ...,M − 1, respectively denote the total number of timeslots used by all the vehicles in the mth hop-region and mth TH region. Also, let Nm,m = 1, ...,M − 2, denote the total number of vehicles in the mth hop-region which canreach at least one vehicle in the (m + 1)st hop-region, and Vm the total number of time
slots used by Nm. Hence,
E(Om) =∞∑i=1
p(Nm = i)i∑
j=1
kmj , 1 ≤ m ≤M (5.20)
E(T1) = E(O1) + E(O2) (5.21a)
E(Tm) = E(Om+1) + E(Om) + E(Vm−1), 2 ≤ m ≤M − 1 (5.21b)
E(Vm) =∞∑i=1
p(Nm = i)i∑
j=1
kmj , 1 ≤ m ≤M − 2 (5.22a)
p(Nm = i) =∞∑j=1
p(Nm+1 = j)p(Um+1j,i ), 1 ≤ m ≤M − 2, 1 ≤ i ≤ ∞, (5.22b)
where p(Nm = j) and p(Um+1j,i ) are given by (5.18) and (5.11) respectively.
5.4 Numerical Results
5.4.1 Gateway Placement in a City Scenario
This subsection applies the gateway placement strategy in Section 5.1 for a city scenarioconsisting of roads around the UW campus. The map is partitioned into square cellswith side length of 10 m, and the potential gateway locations are defined along eachroad with a separation of 10 m between two successive locations. The road network iscreated in VISSIM, as shown in Fig 4.7, to simulate the movement of the vehicles in low,medium, and high vehicle density scenarios. For each scenario, the VISSIM simulatorgenerates a trace file (listing the location of each vehicle after each simulation step) that isused by a MATLAB script to calculate the probabilities σi,j,k∀i, j, k, as defined in Section5.1. To determine whether or not a network path exists between a vehicle and gateway,
85

5. Gateway Placement and Packet Routing For Multihop In-Vehicle Internet Access
the MATLAB script assumes that two nodes can communicate iff they are within thecommunication range of each other. Extending the script to account for the wirelesschannel effects, such as the shadowing caused by trees and buildings, is left as a futurework. At the start of the VISSIM simulations, vehicles arrive to the road network fromeach possible road entry according to a Poisson process with a rate parameter that differsbased on the capacity of the road and the desired vehicle density. The vehicles are leftto move for a warm up period of 15 min (to avoid transient effects), then their positionsare recorded for another 30 min. The control of each intersection, as well as the left andright turn decisions made by a vehicle are as described in Subsection 4.3.2. Once a vehiclereaches any end of the road network, it is removed from the simulations. The desiredspeed distributions, car following model, lane changing model, vehicle characteristics, andmaximum/desired acceleration and deceleration functions are described in Table 4.2.
After calculating the probabilities σi,j,k from the VISSIM simulations for different ve-hicle densities, problem (5.1) is solved by using the GUROBI optimizer 5.5 [61] togetherwith the YALMIP modeling language [62]. The GUROBI optimizer combines a branch-and-bound algorithm, cutting-plane methods, and multiple heuristics in order to solve abinary integer programming problem. In problem (5.1), we set γj = 1 ∀j (equivalent tominimizing the number of deployed gateways), νi = 1, and αi = α ∀i, where α is a pa-rameter ranging from 0.6 to 0.9 with step 0.1. A video showing the optimal locations ofgateways in a VISSIM simulation can be found at [63].
Fig. 5.5 shows the effect of ρmax and R on the number of deployed gateways in highand low vehicle density scenarios. As shown in Fig. 5.5a, when ρmax is increased from1 to 3, the number of gateways drops from 35 to 15 and from 19 to only 6 gatewaysfor a communication range of 150 m and 250 m respectively. The effect of increasingρmax on the reduction of the number of deployed gateways is more significant in the highdensity scenario due to the existence of more vehicles which can relay packets to/fromthe gateways. For instance, as shown in Fig. 5.5b, when R = 150 m in a low densityscenario, increasing ρmax from 1 to 3 results in a 40% reduction of the number of deployedgateways, as compared to around 57% reduction in the high density scenario in Fig. 5.5a.Note that, when ρmax = 1, the vehicle traffic density does not have any effect on thenumber of deployed gateways, which is the case when each cell is required to be within thecommunication range of at least one gateway.
The effect of the vehicle traffic density and the threshold α on the number of deployedgateways when R = 150 m is illustrated in Fig. 5.6 for ρmax = 2 and ρmax = 3. In eachof Figs. 5.6a and 5.6b, for a given α value, the number of gateways decreases when thevehicle density increases. This decrease in the number of gateways deployed in a highervehicle density is more remarkable when ρmax = 3 (Fig. 5.6b), especially for a high α value.
86

5.4. Numerical Results
1 2 30
5
10
15
20
25
30
35
ρmax
# ga
tew
ays
R = 150R = 250
(a) High vehicle density
1 2 30
5
10
15
20
25
30
35
ρmax
# ga
tew
ays
R = 150R = 250
(b) Low vehicle density
Figure 5.5: The number of deployed gateways versus ρmax for α = 0.8 and two differentcommunication ranges.
low medium high0
5
10
15
20
25
30
Vehicle traffic density
# ga
tew
ays
α = 0.6
α = 0.7
α = 0.8
α = 0.9
(a) ρmax = 2
low medium high0
5
10
15
20
25
30
Vehicle traffic density
# ga
tew
ays
α = 0.6
α = 0.7
α = 0.8
α = 0.9
(b) ρmax = 3
Figure 5.6: The number of deployed gateways versus vehicle traffic for R = 150 m.
87

5. Gateway Placement and Packet Routing For Multihop In-Vehicle Internet Access
ρmax
= 1 (# gateways = 19)
ρmax
= 2 (# gateways = 10)
ρmax
= 3 (# gateways = 6)
(a) High vehicle density
ρmax
= 1 (# gateways = 19)
ρmax
= 2 (# gateways = 12)
ρmax
= 3 (# gateways = 9)
(b) Low vehicle density
Figure 5.7: The locations of the deployed gateways for α = 0.8 and R = 250 m.
Similarly, for a certain vehicle density in Fig. 5.6a or 5.6b, increasing α usually requires thedeployment of additional gateways. The effect of α on the number of deployed gatewaysis more significant in a lower vehicle density scenario and for a higher ρmax value. Thesame results as in Fig. 5.6 are obtained for R = 250 m. When R = 250 m and α = 0.8,Figs. 5.7a and 5.7b illustrate the locations of the gateways on the map for different ρmax
values, respectively in high and low vehicle density scenarios. It is obvious from Fig. 5.7how the vehicle density affects the optimal number and locations of gateways, except whenρmax = 1. For a gateway located at position j, the value of ρj assigned by the optimizer isequal to ρmax almost for all j.
As the threshold α represents the minimum acceptable probability of reaching a gatewayfrom a certain cell, the average probability (over all cells) of reaching a gateway is eventuallygreater than α. For instance, as shown in Fig. 5.8a, while α = 0.7, for most of the cells,a vehicle can reach a gateway with a probability greater than 0.95. Hence, the averageprobability of reaching a gateway is around 0.98, as shown in Fig. 5.8b. Note that, in Fig.5.8b, the cells are indexed by scanning the map from left to right (bottom-up) and, hence,close values of the indices of two cells do not necessarily mean that the cells are located inproximity of each other on the map. The cells having a probability 1 in Fig. 5.8b are thosewhich are located within the communication range of a gateway. The relation betweenthe threshold α and the average probability of reaching a gateway achieved over all cellsis shown in Fig. 5.9 for R = 250 m. Even when α = 0.6, the average probability is above
88
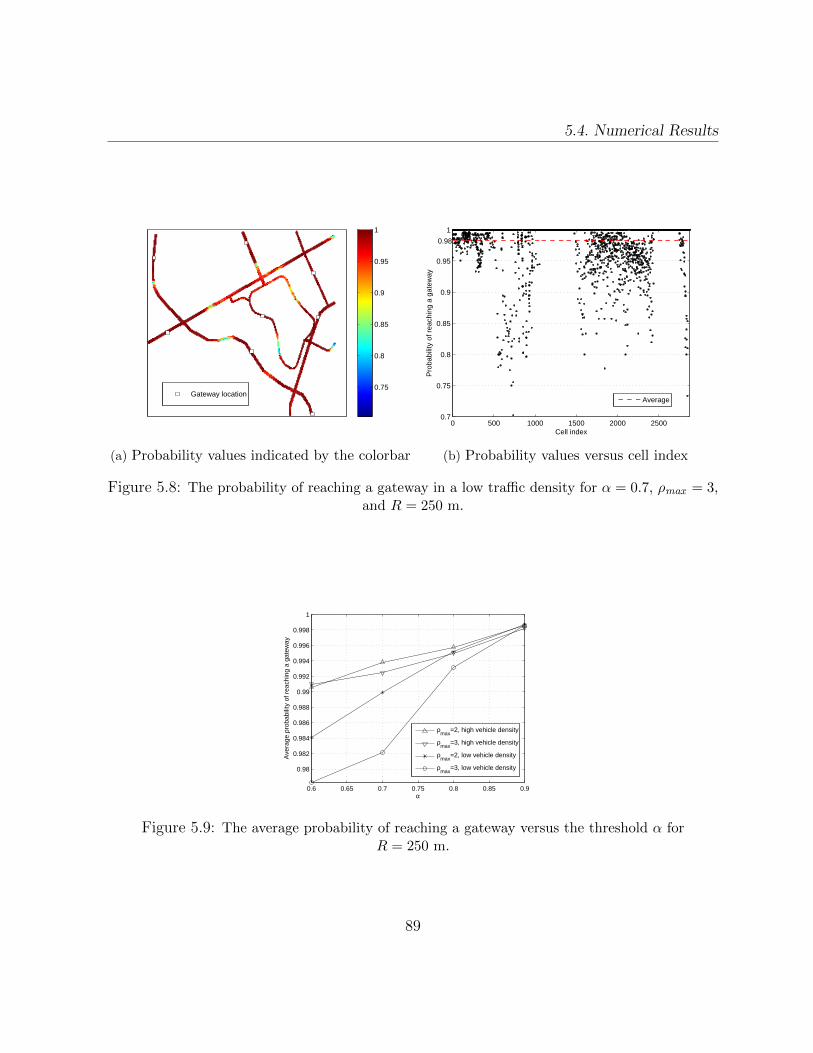
5.4. Numerical Results
0.75
0.8
0.85
0.9
0.95
1
Gateway location
(a) Probability values indicated by the colorbar
0 500 1000 1500 2000 25000.7
0.75
0.8
0.85
0.9
0.95
1
Cell indexP
roba
bilit
y of
rea
chin
g a
gate
way
0.98
Average
(b) Probability values versus cell index
Figure 5.8: The probability of reaching a gateway in a low traffic density for α = 0.7, ρmax = 3,and R = 250 m.
0.6 0.65 0.7 0.75 0.8 0.85 0.9
0.98
0.982
0.984
0.986
0.988
0.99
0.992
0.994
0.996
0.998
1
α
Ave
rage
pro
babi
lity
of r
each
ing
a ga
tew
ay
ρmax
=2, high vehicle density
ρmax
=3, high vehicle density
ρmax
=2, low vehicle density
ρmax
=3, low vehicle density
Figure 5.9: The average probability of reaching a gateway versus the threshold α forR = 250 m.
89

5. Gateway Placement and Packet Routing For Multihop In-Vehicle Internet Access
0.978 for all vehicle densities and ρmax values. Similar results were found for the othercommunication range, R = 150 m.
To apply the proposed gateway placement strategy in a big deployment region, e.g.,in a whole city, the deployment region can be partitioned into smaller regions, in orderto avoid solving a single optimization problem with a large number of constraints anddecision variables. Also, the choice of the cell size and potential gateway locations shouldguarantee the feasibility of problem 5.1. For instance, if νi = 1 ∀i, when the cell diagonalis not greater than twice the communication range of a gateway, the feasibility of problem5.1 is guaranteed by ensuring that for each cell, there is a potential location for a gatewaywhich can entirely cover the cell within its communication range.
5.4.2 Packet Routing in a Highway Scenario
This section presents numerical results for a 4-lane highway segment consisting of 5 hop-regions based on a communication range R = 150 m. The average vehicle density per lane,ηlane, varies from 12 to 67 vehicles/mile, a range which corresponds to traffic flow conditionsvarying from a free-flow scenario to a near-capacity one [64]. For the VeMAC protocol,the number of time slots per frame L = 275 slots and the slot duration t = 0.35 ms,resulting in a frame duration of 96.25 ms [40]. We use MAPLE 17 to calculate the PDFsfGm(gm), m = 1, .., 4, in (5.8), and MATLAB R2012b for all other calculations includingthe numerical evaluation of the integrals in (5.18b) and (5.11).
Fig. 5.10a shows λmr , for r = 1, ..., 10, m = 1, ..., 5, and different λ values. In Fig.5.10a, with nR = 10, the vehicles under consideration in hop-regions 1 to 4 represent allthe potential relay vehicles located in these hop-regions. In the 5th hop-region, λ5r = λ∀r,since the vehicles in this hop-region do not relay any packet. On the other hand, in themth hop region, m = 1, ..., 4, λmr increases when the vehicle index r decreases. The reasonis that, when index r is small, a relay vehicle in the mth hop region is more likely to bereached by a higher number of vehicles in the (m + 1)st hop region. Similarly, for a givenvehicle index r, λmr increases when the hop-region index m is smaller, i.e., when the rth
relay vehicle is in a hop-region closer to the gateway. The reason is that, the relay vehicleslocated at the mth hop region (m < 5) will eventually relay all the packets arriving from allthe farther hop-regions (indexed m+1, ..., 5) to the gateway. A more focused illustration ofthe variation of λmr with r and m is shown in Fig. 5.10b, which concentrates only on the firstthree relay vehicles in each hop-region with a single λ value. The increase in the λ valueeventually increases λmr ∀r,m, as shown in Fig. 5.10a. Similarly, if λ remains constantand ηlane increases, λmr increases for all the relay vehicles (m = 1, ..., 4, r = 1, .., 10), asillustrated in Fig. 5.10c.
90

5.4. Numerical Results
1 2 3 4 5 6 7 8 9101 2 3 4 5 6 7 8 9101 2 3 4 5 6 7 8 9101 2 3 4 5 6 7 8 9101 2 3 4 5 6 7 8 91010
0
101
102
103
Vehicle index r
Tot
al p
acke
t arr
ival
rat
e λ rm
(pa
cket
/s)
λ = 3
λ = 5
λ = 10
λ = 21
λ = 42
m=1m=2m=3m=4m=5
(a) First ten vehicles in each hop region fornR = 10 and η
lane= 30 vehicles/mile
5 4 3 2 10
20
40
60
80
100
120
140
160
180
200
Hop−region index m
Tot
al p
acke
t arr
ival
rat
e λ rm
(pa
cket
/s)
r = 1r = 2r = 3
(b) First three vehicles in each hop region fornR = 10, η
lane= 30 vehicles/mile, and
λ = 10 packet/s
1 2 3 4 5 6 7 8 9101 2 3 4 5 6 7 8 9101 2 3 4 5 6 7 8 9101 2 3 4 5 6 7 8 9101 2 3 4 5 6 7 8 91010
0
101
102
103
Vehicle index r
Tot
al p
acke
t arr
ival
rat
e λ rm
(pa
cket
/s)
η
lane = 12
ηlane
= 20
ηlane
= 30
ηlane
= 40
ηlane
= 67
m=5 m=4 m=3 m=2 m=1
(c) First ten vehicles in each hop region fornR = 10 and λ = 10 packets/s
1 5 10 151 5 10 151 5 10 151 5 10 150
50
100
150
200
250
Vehicle index r
Tot
al p
acke
t arr
ival
rat
e λ rm
(pa
cket
/s)
nR
= 5
nR
= 10
nR
= 15
m=3 m=1m=2m=4
(d) First 15 vehicles in each hop region forηlane
= 30 vehicles/mile and λ = 10 packets/s
Figure 5.10: Total packet arrival rate λmr at the vehicles in each hop-region.
91

5. Gateway Placement and Packet Routing For Multihop In-Vehicle Internet Access
1 2 3 4 5 1 2 3 4 5 1 2 3 4 5 1 2 3 4 5 1 2 3 4 50
1
2
3
4
5
6
7
Vehicle index r
Num
ber
of a
cqui
red
time
slot
s pe
r fr
ame
k rm
dmax
= 25ms
dmax
= 50ms
dmax
= 100ms
m=5 m=2 m=1m=4 m=3
(a) nR = 5 and b = 4
1 2 3 4 5 1 2 3 4 5 1 2 3 4 5 1 2 3 4 5 1 2 3 4 50
1
2
3
4
5
6
Vehicle index r
Num
ber
of a
cqui
red
time
slot
s pe
r fr
ame
k rm
b = 4b = 8b = 16
m=5 m=4 m=3 m=2 m=1
(b) nR = 5 and dmax = 50 ms
Figure 5.11: Number of acquired time slots per frame kmr by each of the first five vehicles ineach hop-region for η
lane= 30 vehicles/mile and λ = 10 packets/s.
The number nR of relays included in the GDP defines the number of potential relayvehicles in each hop-region. Consequently, the value of nR affects λmr for some m and r,as shown in Fig. 5.10d. When nR = 5, only the first 5 vehicles in each hop-region canrelay packets, and hence ∀m, the value of λmr increases for r = 1, ..., 5 and decreases forr = 6, ..., 15 as compared to the cases of nR = 10 and nR = 15. On the other hand, nosignificant difference in λmr ∀r,m is observed when nR is changed from 10 to 15. The reasonis that, even if there are 15 potential relays included in the GDP broadcast by a vehicle inthe mth hop region, not all the 15 relays can be reached by the vehicles in the (m + 1)st
hop region, and consequently not all of them will actually relay packets.
The effect of dmax on kmr is illustrated in Fig. 5.11a for the first five vehicles in eachhop-region. When dmax = 25 ms, while the rth vehicle in the 5th hop-region (does not relaypackets) has k5r = 2 slots∀r, some relay vehicles in the other hop-regions need to acquirea higher number of time slots per frame in order to satisfy this delay requirement, e.g.,k11 = 7 slots. When dmax is increased to 100 ms, only one time slot per frame is acquiredby each vehicle, except the relay vehicles with high packet arrival rates at the hop-regionsclose to the gateway. Fig. 5.11b shows that, when the bath-size b increases, the numberof time slots acquired by a relay vehicle can be significantly reduced, since the vehicle isable to announce for a larger number of packets in each time slot. For instance, as shownin Fig. 5.11b, while a batch-size b = 4 requires k11 = 6 slots and k21 = 4 slots, both valuesare halved when b = 8, and are reduced to only 1 slot when b = 16.
92

5.4. Numerical Results
4 3 2 10
10
20
30
40
50
60
70
80
TH region index
Ave
rage
per
cent
age
of o
ccup
ied
time
slot
s pe
r fr
ame
d
max = 25ms
dmax
= 50ms
dmax
= 100ms
(a) λ = 21 packets/s, nR = 10, and b = 4
5 10 15 20 25 3040
50
60
70
80
90
100
λ (packet/s)
Ave
rage
per
cent
age
of o
ccup
ied
time
slot
s pe
r fr
ame
TH region 1TH region 2TH region 3TH region 4
(b) nR = 10, b = 4, and dmax = 25 ms
5 10 15 20 25 30 35 40 4520
30
40
50
60
70
80
90
λ (packet/s)
Ave
rage
per
cent
age
of o
ccup
ied
time
slot
s pe
r fr
ame
TH region 1TH region 2TH region 3TH region 4
(c) nR = 10, b = 4, and dmax = 50 ms
4 3 2 10
10
20
30
40
50
60
70
80
90
100
TH region index
Ave
rage
per
cent
age
of o
ccup
ied
time
slot
s pe
r fr
ame
b = 4b = 8b = 16
(d) λ = 31 packets/s, nR = 10, anddmax = 25 ms
Figure 5.12: Average percentage of occupied time slots per frame for each TH region forηlane
= 67 vehicles/mile.
93

5. Gateway Placement and Packet Routing For Multihop In-Vehicle Internet Access
Fig. 5.12a shows the effect of dmax on the average percentage of time slots per frameoccupied by all the vehicles in each TH region, i.e., E(Tm)
L× 100,m = 1, ..., 4. Based on
the TH region definition in Subsection 5.3.4, and given the number of time slots acquiredby individual vehicles in Fig. 5.11, the second TH region is the most loaded (in terms oftime slot occupancy) since it includes all the vehicles in the second and third hop-regions,as well as all the relay vehicles in the first hop-region. As shown in Fig. 5.12a, the secondTH region has an average time slot occupancy less than 75%, even for dmax = 25 ms andηlane
= 67 vehicles/mile. In Fig. 5.12a, when dmax = 25 ms, each non-relay vehicle needsto acquire three time slots per frame, which results in a significant increase in the averageslot occupancy in all TH regions, as compared with the dmax = 50 ms and dmax = 100 mscases, in which a non-relay vehicle needs to acquire only two time slots per frame to satisfythe delay threshold. When dmax decreases from 100 ms to 50 ms, the slight increase inthe average slot occupancy shown in Fig. 5.12a is because of the extra time slots acquiredby some relay vehicles. Fig. 5.12b shows the average percentage slot occupancy for eachTH region versus λ. When λ = 31 packets/s (3 packets/frame), almost 100% average slotoccupancy is achieved at the second TH region. Hence, for the highest average vehicledensity, η
lane= 67 vehicles/mile, smallest delay threshold, dmax = 25 ms, and smallest
batch-size, b = 4, under consideration, a frame length of 275 time slots can accommodateall the vehicles in each TH region for a packet arrival rate λ up to 31 packets/s. If dmax isincreased to 50 ms, as shown in Fig. 5.12c, then for the same η
laneand b values as in Fig.
5.12b, the average percentage of occupied time slots remains below 85% for all TH regions,even for λ as high as 42 packets/sec (4 packets/frame). On the other hand, if dmax = 25 msand b is increased from 4 to 8, the average slot occupancy is reduced by approximately35% for each TH region, as shown in Fig. 5.12d.
Fig. 5.13a shows the average end-to-end packet delay for each hop-region, E(Em),m = 1, ..., 5, for different values of dmax. A packet sent from a vehicle in the 5th hop-regioncan be delivered to the gateway with an average end-to-end delay of 110 ms (178 ms) whendmax = 25 ms (dmax = 50 ms). Note that, the value of dmax represents the delay thresholdbelow which each vehicle limits its average packet delay by acquiring a suitable number oftime slots per frame. How much the actual value of the average packet delay at a certainvehicle is below dmax depends mainly on the total packet arrival rate at the vehicle. Fig.5.13b shows the effect of λ on the average end-to-end packet delay for each hop-region. Asshown in Fig. 5.13b, the increase in the average end-to-end packet delay with λ is higherwhen a hop-region is farther from the gateway. However, the effect of λ on the averageend-to-end packet delay is not significant, especially for the first two hop-regions, sincewhen λ increases, each vehicle can access more time slots per frame in order to keep itsaverage packet delay below dmax. In other words, increasing λ affects more the percentage
94
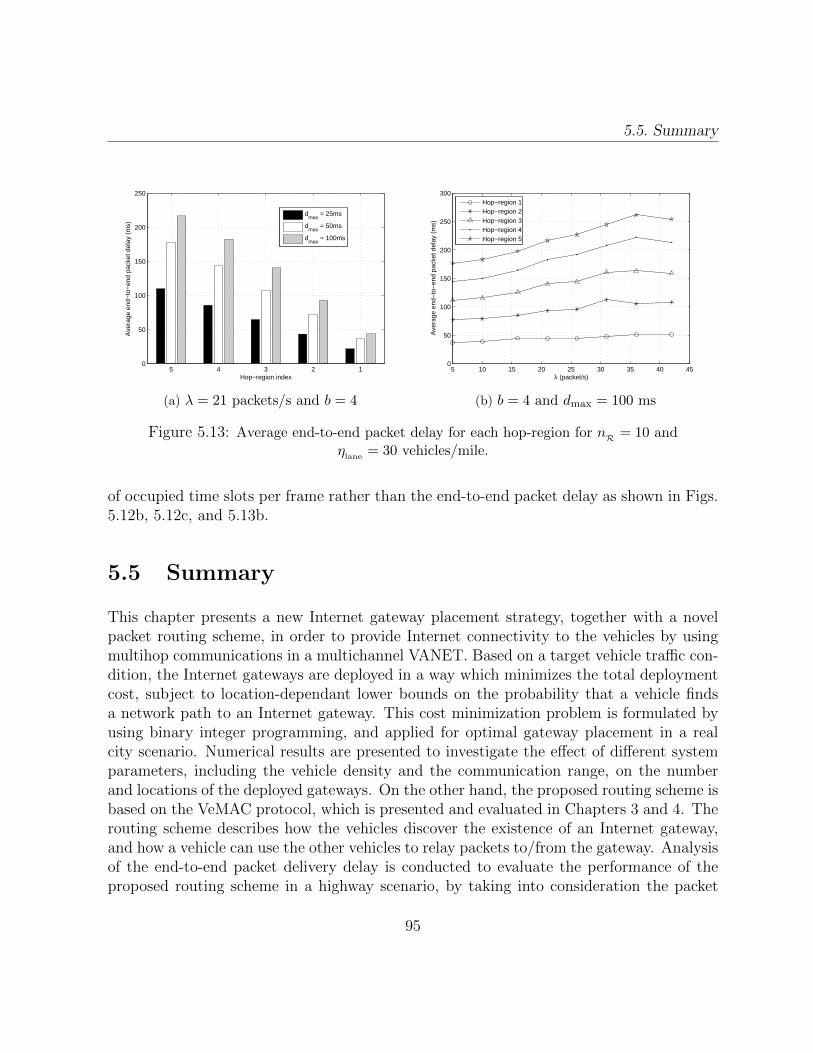
5.5. Summary
5 4 3 2 10
50
100
150
200
250
Hop−region index
Ave
rage
end
−to
−en
d pa
cket
del
ay (
ms)
dmax
= 25ms
dmax
= 50ms
dmax
= 100ms
(a) λ = 21 packets/s and b = 4
5 10 15 20 25 30 35 40 450
50
100
150
200
250
300
λ (packet/s)
Ave
rage
end
−to
−en
d pa
cket
del
ay (
ms)
Hop−region 1Hop−region 2Hop−region 3Hop−region 4Hop−region 5
(b) b = 4 and dmax = 100 ms
Figure 5.13: Average end-to-end packet delay for each hop-region for nR = 10 andηlane
= 30 vehicles/mile.
of occupied time slots per frame rather than the end-to-end packet delay as shown in Figs.5.12b, 5.12c, and 5.13b.
5.5 Summary
This chapter presents a new Internet gateway placement strategy, together with a novelpacket routing scheme, in order to provide Internet connectivity to the vehicles by usingmultihop communications in a multichannel VANET. Based on a target vehicle traffic con-dition, the Internet gateways are deployed in a way which minimizes the total deploymentcost, subject to location-dependant lower bounds on the probability that a vehicle findsa network path to an Internet gateway. This cost minimization problem is formulated byusing binary integer programming, and applied for optimal gateway placement in a realcity scenario. Numerical results are presented to investigate the effect of different systemparameters, including the vehicle density and the communication range, on the numberand locations of the deployed gateways. On the other hand, the proposed routing scheme isbased on the VeMAC protocol, which is presented and evaluated in Chapters 3 and 4. Therouting scheme describes how the vehicles discover the existence of an Internet gateway,and how a vehicle can use the other vehicles to relay packets to/from the gateway. Analysisof the end-to-end packet delivery delay is conducted to evaluate the performance of theproposed routing scheme in a highway scenario, by taking into consideration the packet
95

5. Gateway Placement and Packet Routing For Multihop In-Vehicle Internet Access
queueing delay at each relay vehicle. In addition, the percentage of time slots occupiedper frame is evaluated, when each relay vehicle is allowed to access a number of time slotsthat limits its average packet delay below a certain threshold. Numerical results showthat, due to a high total packet arrival rate, a relay vehicle may need to acquire more timeslots per frame in order to limit its average packet delay, especially when the relay vehicleis located close to a gateway. By properly adjusting the number of time slots that eachvehicle acquires per frame, increasing the packet arrival rate at each vehicle affects morethe percentage of occupied time slots per frame rather than the end-to-end packet delay.
96

Chapter 6
Conclusions and Future Works
6.1 Conclusions
VANETs are an emerging paradigm which is currently receiving significant support fromgovernment, academia, and industrial organizations over the globe. By employing V2V andV2R communications, VANETs are expected to realize a variety of advanced applicationsfor road safety, passenger infotainment, and vehicle traffic optimization. The main objec-tives of this research are to support the QoS requirements of VANET safety applications,and to provide Internet connectivity to the vehicles by using multihop communications ina multichannel VANET. To achieve these objectives, this thesis presents a multichannelMAC protocol (VeMAC), a packet routing scheme, and a strategy for deploying Internetgateways on the roads.
In the TDMA-based VeMAC protocol, the nodes access the time slots on the CCH andSCHs in distributed ways which are designed to avoid any hidden terminal problem. On theCCH, the VeMAC provides a reliable one-hop broadcast service, which is crucial for highpriority safety applications supported on this channel. How the periodic and event-drivensafety messages are queued and served by the VeMAC protocol is described, and a detailedmessage delay analysis (including queueing and service delay) is presented by taking intoconsideration the size and the arrival pattern of each type of safety messages. MATLABsimulations in highway and city scenarios show that, compared with the ADHOC MACprotocol, the VeMAC provides a smaller rate of transmission collisions, which results ina significantly higher throughput on the CCH. Additionally, the network simulator ns-2and the microscopic vehicle traffic simulator VISSIM are used to evaluate the performanceof VeMAC in comparison with the IEEE 802.11p standard in a realistic city scenario.
97

6. Conclusions and Future Works
Simulation results show that, the VeMAC protocol can deliver both types of safety messagesto all the nodes in the one-hop neighbouhoud with an acceptable average delivery delay(less than 100 ms). Moreover, it is shown that the VeMAC has a low probability of atransmission collision, which results in a higher safety message goodput and better channelutilization, as compared to the IEEE 802.11p standard. This research sheds light onTDMA as a promising technology for MAC in VANETs, and a suitable replacement of theIEEE 802.11p standard, which have significant limitations in supporting VANET safetyapplications.
The proposed strategy for deploying Internet gateways on roads minimizes the totalcost of gateway deployment based on binary integer programming. This cost minimizationis achieved subject to location-dependant lower bounds on the probability that a vehiclefinds a network path to a gateway, based on the traffic conditions in the deploymentregion. To the best of our knowledge, the proposed deployment strategy is the first studyto address the probability of existence of multihop network paths among the vehicles andthe deployed gateways. The strategy is applied for optimal placement of gateways in arealistic city scenario, and the effects of different system parameters (including the vehicletraffic density) on the number and location of deployed gateways are investigated. Howeach vehicle discovers the existence of a gateway and how the packets are delivered betweena vehicle and a gateway through multiple relay vehicles are both described in the proposedpacket routing scheme, which is designed over the VeMAC protocol. To evaluate theperformance of this cross-layer design, analysis of the end-to-end packet delivery delay isconducted in a highway scenario, by modeling the system as a network of batch-servicequeues. The packet arrival rate at each relay vehicle is calculated based on the positionof the relay vehicle relative to an Internet gateway. Also, the percentage of time slotsoccupied per frame is evaluated, when each relay vehicle is allowed to access a numberof time slots to limit its average packet delay below a certain threshold. The proposedVANET architecture can achieve multihop in-vehicle Internet access by using the routingscheme, while satisfying the QoS requirements of the safety applications via the VeMACprotocol.
6.2 Further Research Topics
In the future, the performance of the VeMAC protocol using different values of the splitup parameter τ , other than τ = 0 and τ = ∞, is worth to be investigated. Anotherissue which must be examined is how the protocol performance is affected by the exis-tence of asymmetric wireless channels among the nodes, as well as by the packet errors
98

6.2. Further Research Topics
caused by the channel impairments such as noise, fading, and shadowing. Since each nodeinterprets any packet error as a transmission collision, the packet errors due to a poorwireless channel may result in nodes unnecessarily releasing their time slots on the CCH.Also, since information security is not considered in this thesis, suitable authenticationand integrity schemes should be developed to protect the VeMAC protocol against anymalicious attack, such as broadcasting of false control information over the CCH, whichcan affect the VeMAC techniques for distributed time slot assignment and transmissioncollision detection. Concerning the communications over the SCHs, the proposed schemefor unicast should be evaluated via analysis and simulations, and then extended to supporta reliable broadcast service on the SCHs. Finally, a prototype should be created for theVeMAC protocol in order to investigate its implementation complexity and practically testits performance in a real vehicular scenario.
The routing scheme proposed over the VeMAC protocol should be evaluated by usingrealistic mobility traces of vehicles in highway and city scenarios, in comparison with abench mark routing protocol, such as the Greedy Perimeter Stateless Routing (GPSR),over the IEEE 802.11p standard. Also, suitable Internet gateway selection and handoverschemes should be developed, and results of the presented gateway deployment strategyshould be obtained by taking into consideration the effects of the wireless channel.
Another promising research topic is how to support periodic and event-driven safetymessages via the Long Term Evolution Advanced (LTE-A) mobile communications stan-dard. To date, very few studies have considered this topic, and there are still many issueswhich need investigation to determine whether or not the LTE-A standard can be employedfor road safety applications.
99


References
[1] “Specification for Telecommunications and Information Exchange Between Roadsideand Vehicle Systems 5 GHz Band Dedicated Short Range Communications (DSRC)Medium Access Control (MAC) and Physical Layer (PHY) Specifications,” ASTMStandard E2213, 2003 (2010).
[2] “Vehicle safety communications project task 3 final report,” The CAMP Vehicle SafetyCommunications Consortium, Tech. Rep. DOT HS 809 859, Mar. 2005.
[3] W. Zhuang and H. A. Omar, “Vehicular communication netwroks: opportunities andchallenges,” in Proc. 5th International Symposium and the 4th Student OrganizingInternational Mini-Conference on Information Electronics Systems, Feb. 2012.
[4] R. Baldessari, B. Bdekker, A. Brakemeier, M. Deegener, A. Festag, W. Franz, A. Hiller,C. Kellum, T. Kosch, A. Kovacs, M. Lenardi, A. Lbke, C. Menig, T. Peichl, M. Roeckl,D. Seeberger, M. Strassberger, H. Stratil, H.-J. Vgel, B. Weyl, and W. Zhang, “Car-2-car communication consortium manifesto,” Tech. Rep. Version 1.1, Aug. 2007.
[5] http://www.car-to-car.org/.
[6] http://www.cvisproject.org/.
[7] http://www.sevecom.org/.
[8] http://evita-project.org/.
[9] http://www.com2react-project.org/.
[10] http://www.ertico.com.
[11] http://www.safespot-eu.org/.
101

References
[12] http://www.comesafety.org/.
[13] http://www.geonet-project.eu/.
[14] http://www.ict-itetris.eu/index.htm.
[15] W. Specks, K. Matheus, R. Morich, I. Paulus, C. Menig, A. Lbke, B. Rech, andV. Audi, “Car-to-car communication–market introduction and success factors,” inProc. 5th European Congress and Exhibition on Intelligent Transport Systems andServices, 2005.
[16] J. J. Blum and A. Eskandarian, “A reliable link-layer protocol for robust and scal-able intervehicle communications,” IEEE Transactions on Intelligent TransportationSystems, vol. 8, no. 1, pp. 4–13, Mar. 2007.
[17] R. Mangharam, R. Rajkumar, M. Hamilton, P. Mudalige, and F. Bai, “Bounded-latency alerts in vehicular networks,” in Proc. Mobile Networking for Vehicular Envi-ronments (MOVE 2007), May 2007, pp. 55–60.
[18] F. Watanabe, M. Fujii, M. Itami, and K. Itoh, “An analysis of incident informa-tion transmission performance using MCS/CDMA scheme,” in Proc. IEEE IntelligentVehicles Symposium (IV’05), Jun. 2005, pp. 249–254.
[19] H. Nakata, T. Inoue, M. Itami, and K. Itoh, “A study of inter vehicle communicationscheme allocating PN codes to the location on the road,” in Proc. IEEE IntelligentTransportation Systems Conference (ITSC 2003), vol. 2, Oct. 2003, pp. 1527–1532.
[20] F. Borgonovo, A. Capone, M. Cesana, and L. Fratta, “ADHOC MAC: New MACarchitecture for ad hoc networks providing efficient and reliable point-to-point andbroadcast services,” Wireless Networks, vol. 10, pp. 359–366, Jul. 2004. [Online].Available: http://dx.doi.org/10.1023/B:WINE.0000028540.96160.8a
[21] “IEEE standard for information technology–telecommunications and information ex-change between systems–local and metropolitan area networks–specific requirementsPart 11: Wireless LAN medium access control (MAC) and physical layer (PHY)specifications Amendment 6: Wireless access in vehicular environments,” IEEEStd 802.11p-2010 (Amendment to IEEE Std 802.11-2007 as amended by IEEE Std802.11k-2008, IEEE Std 802.11r-2008, IEEE Std 802.11y-2008, IEEE Std 802.11n-2009, and IEEE Std 802.11w-2009), pp. 1–51, Jul. 15, 2010.
102

References
[22] “IEEE standard for information technology-telecommunications and information ex-change between systems-local and metropolitan area networks-specific requirements -Part 11: Wireless LAN medium access control (MAC) and physical layer (PHY) spec-ifications,” IEEE Std 802.11-2012 (Revision of IEEE Std 802.11-2007), pp. 1–2793,Mar. 2012.
[23] “IEEE standard for wireless access in vehicular environments (WAVE) - multi-channeloperation,” IEEE Std 1609.4-2010 (Revision of IEEE Std 1609.4-2006), pp. 1–89, Feb.2011.
[24] T. Clausen and P. Jacquet, “Optimized link state routing protocol (OLSR),” RFC3626, Oct. 2003.
[25] C. E. Perkins and P. Bhagwat, “Highly dynamic destination-sequenced distance-vectorrouting (DSDV) for mobile computers,” in Proc. Conference on CommunicationsArchitectures, Protocols and Applications (ACM SIGCOMM ’94), Sep. 1994, pp.234–244. [Online]. Available: http://doi.acm.org/10.1145/190314.190336
[26] D. B. Johnson and D. A. Maltz, “Dynamic source routing in ad hoc wireless networks,”in Mobile Computing, T. Imielinski and H. Korth, Eds. Kluwer Academic Publishers,1996, pp. 153–181.
[27] Y.-B. Ko and N. H. Vaidya, “Location-aided routing (LAR) in mobile ad hocnetworks,” Wireless Networks, vol. 6, pp. 307–321, Jul. 2000. [Online]. Available:http://dx.doi.org/10.1023/A:1019106118419
[28] C. Perkins and E. Royer, “Ad-hoc on-demand distance vector routing,” in Proc. SecondIEEE Workshop on Mobile Computing Systems and Applications (WMCSA ’99), Feb.1999, pp. 90–100.
[29] Z. J. Haas and M. R. Pearlman, “ZRP: a hybrid framework for routingin ad hoc networks,” in Ad hoc networking. Boston, MA, USA: Addison-Wesley Longman Publishing Co., Inc., 2001, pp. 221–253. [Online]. Available:http://portal.acm.org/citation.cfm?id=374547.374554
[30] B. Karp and H. T. Kung, “GPSR: greedy perimeter stateless routing for wirelessnetworks,” in Proc. 6th annual international conference on Mobile computingand networking (MobiCom ’00), Aug. 2000, pp. 243–254. [Online]. Available:http://dx.doi.org/10.1145/345910.345953
103
References
[31] C. Lochert, H. Hartenstein, J. Tian, H. Fuessler, D. Hermann, and M. Mauve, “Arouting strategy for vehicular ad hoc networks in city environments,” in Proc. IEEEIntelligent Vehicles Symposium (IV’03), Jun. 2003, pp. 156–161.
[32] C. Lochert, M. Mauve, H. Fussler, and H. Hartenstein, “Geographic routing in cityscenarios,” SIGMOBILE Mobile Computing and Communications Review, vol. 9, no. 1,pp. 69–72, Jan. 2005. [Online]. Available: http://dx.doi.org/10.1145/1055959.1055970
[33] R. Morris, J. Jannotti, F. Kaashoek, J. Li, and D. Decouto, “Carnet: a scalablead hoc wireless network system,” in Proc. 9th ACM SIGOPS European workshop“Beyond the PC: New Challenges for the Operating System” (SIGOPS EW’00), Sep.2000, pp. 61–65. [Online]. Available: http://doi.acm.org/10.1145/566726.566741
[34] S. Basagni, I. Chlamtac, V. R. Syrotiuk, and B. A. Woodward, “A distancerouting effect algorithm for mobility (DREAM),” in Proc. 4th annual ACM/IEEEinternational conference on Mobile computing and networking (MobiCom ’98), Oct.1998, pp. 76–84. [Online]. Available: http://doi.acm.org/10.1145/288235.288254
[35] M. Kasemann, H. Fußler, H. Hartenstein, and M. Mauve, “A reactive location ser-vice for mobile ad hoc networks,” Department of Computer Science, University ofMannheim, Tech. Rep. TR-02-014, Nov. 2002.
[36] V. Naumov and T. Gross, “Connectivity-aware routing (CAR) in vehicular ad-hoc net-works,” in Proc. 26th IEEE International Conference on Computer Communications(INFOCOM 2007), May 2007, pp. 1919–1927.
[37] H. A. Omar, W. Zhuang, and L. Li, “VeMAC: A TDMA-based MAC protocol forreliable broadcast in VANETs,” IEEE Transactions on Mobile Computing, vol. 12,no. 9, pp. 1724-1736, Sept. 2013.
[38] H. A. Omar, W. Zhuang, and L. Li, “Evaluation of VeMAC for V2V and V2R Com-munications Under Unbalanced Vehicle Traffic,” Proc. IEEE Vehicular TechnologyConference (VTC2012-Fall), Sept. 2012.
[39] H. A. Omar, W. Zhuang, and L. Li, “VeMAC: a novel multichannel MAC protocolfor vehicular ad hoc networks,” in Proc. IEEE International Conference on ComputerCommunications (INFOCOM) Workshop on Mobility Management in the Networksof the Future World (MobiWorld 2011), Apr. 2011, pp. 413-418.
104

References
[40] H. A. Omar, W. Zhuang, A. Abdrabou, and L. Li, “Performance evaluation of VeMACsupporting safety applications in vehicular networks,” IEEE Transactions on Emerg-ing Topics in Computing, vol. 1, no. 1, pp. 69-83, Jun. 2013.
[41] H. A. Omar, W. Zhuang, and L. Li, “Delay analysis of VeMAC supporting periodicand event-driven safety messages in VANETs,” in Proc. IEEE Global CommunicationsConference (GLOBECOM), Dec. 2013.
[42] H. A. Omar, W. Zhuang, and L. Li, “On Multihop Communications For In-VehicleInternet Access Based On a TDMA MAC Protocol,” Proc. IEEE International Con-ference on Computer Communications (INFOCOM), Apr. 2014.
[43] H. A. Omar, W. Zhuang, and L. Li, “Gateway placement and packet routing for multi-hop in-vehicle Internet access,” IEEE Transactions on Emerging Topics in Computing,2014 (to be submitted).
[44] “Dedicated short range communications (DSRC) message set dictionary,” SAE J2735Standard, Nov. 19, 2009.
[45] F. Zaid, F. Bai, S. Bai, C. Basnayake, B. Bellur, S. Brovold, G. Brown, L. Caminiti,D. Cunningham, H. Elzein, J. Ivan, D. Jiang, J. Kenny, H. Krishnan, J. Lovell,M. Maile, D. Masselink, E. McGlohon, P. Mudalige, V. Rai, J. Stinnett, L. Tellis,K. Tirey, and S. VanSickle, “Vehicle safety communications-applications (VSC-A)second annual report,” The CAMP Vehicle Safety Communications 2 Consortium,Tech. Rep. DOT HS 811 466, Aug. 2011.
[46] K. Kutzner, J.-J. Tchouto, M. Bechler, L. Wolf, B. Bochow, and T. Luckenbach,“Connecting vehicle scatternets by Internet-connected gateways,” in Proc. Workshopon Multiradio Multimedia Communications (MMC 2003), University of Dortmund,Germany, 2003. [Online]. Available: http://i30www.ira.uka.de/research/publications/p2p/
[47] “A recursive solution to an occupancy problem resulting from TDM radio communi-cation application,” Applied Mathematics and Computation, vol. 101, no. 1, pp. 1–3,Jun. 1999.
[48] http://nsnam.isi.edu/nsnam/index.php/Main Page.
[49] http://vision-traffic.ptvgroup.com/en-uk/products/ptv-vissim/.
105

References
[50] D. V. Lindley, “The theory of queues with a single server,” Mathematical Proceedingsof the Cambridge Philosophical Society, vol. 48, pp. 277–289, 1952.
[51] D. Bertsekas and R. Gallager, Data networks. Upper Saddle River, NJ, USA: Prentice-Hall, Inc., 1987.
[52] L. D. Servi, “D/G/1 queues with vacations,” Operations Research, vol. 34, no. 4, pp.619–629, 1986.
[53] W. Song and W. Zhuang, “Performance analysis of probabilistic multipath transmis-sion of video streaming traffic over multi-radio wireless devices,” IEEE Transactionson Wireless Communications, vol. 11, no. 4, pp. 1554 –1564, Apr. 2012.
[54] https://code.google.com/p/vemac/.
[55] PTV Planung Transport Verkehr AG, VISSIM 5.40-User Manual, 2012.
[56] http://youtu.be/48daRU6ZpjI.
[57] http://youtu.be/GjYWe7eLJ3s.
[58] R. Wiedemann, “Modeling of RTI-Elements on multi-lane roads,” in Advanced Telem-atics in Road Transport, Proc. the Drive Conference, Feb. 1991.
[59] Y.-C. Cheng and T. Robertazzi, “Critical connectivity phenomena in multihop radiomodels,” IEEE Transactions on Communications, vol. 37, no. 7, pp. 770–777, 1989.
[60] N. Bailey, “On queueing processes with bulk service,” Journal of the Royal StatisticalSociety. Series B (Methodological), vol. 16, no. 1, pp. 80–87, 1954.
[61] http://www.gurobi.com/.
[62] J. Lofberg, “YALMIP: A toolbox for modeling and optimization in MATLAB,”in Proc. of the CACSD Conference, Taipei, Taiwan, 2004. [Online]. Available:http://users.isy.liu.se/johanl/yalmip
[63] http://www.youtube.com/watch?v=zaLJWfTHG8s.
[64] A. D. May, Traffic flow fundamentals. Englewood Cliffs, N.J: Prentice Hall, 1990.
106