medieval distortions: the projections of ancient …
TRANSCRIPT
MEDIEVAL DISTORTIONS: THE PROJECTIONS OF ANCIENT MAPS
W. R. TOBLFX University of Michigan, Ann Arbor
ABSTRACT. Estimates of the map projection employed for an ancient map is a pre- requisite for a variety of other studies. The preliminary evaluation presented here has yielded empirical equations for the Hereford map and illustrated the agreement of a Portolan chart with an oblique Mercator projection.
HE study of ancient maps provides one of T the fascinating aspects of historical geog- raphy. Such maps can be analyzed for many purposes and from several points of view. The following comments refer only to the estima- tion of the map projection implied by the ancient mappaemundi and portolan charts. Evaluation of the map projection of these old maps is of assistance in the determination of the accuracy of the maps, and may provide insight into their method of construction. Modern theories regarding the ancients’ per- ception of the world also may require con- sideration of the map projection employed for maps.
The maps in the two classes under investiga- tion do not contain any indication of the terrestrial graticule of latitude and longitude. This has led some students to conclude that the maps are not based on any map projec- tion.1 This point requires clarification. Cer- tainly the lack of the graticule does not imply the absence of a projection. Even modern maps are occasionally published without this grid.2 More telling is the high probability the sphericity of the earth was unknown to, or was not considered relevant by, the indi- viduals who constructed the maps. If this is the case the maps would be constructed as though the earth were flat. Inconsistencies be- tween the plotting and the observational in- formation then might arise; these inconsisten- cies could be attributed to the (unavoidable) errors in one or the other, or both. For a small
Accepted for publication May 16, 1965.
A. E. Nordenskiold refers to these maps as para- tropical; Periplus, An Essay on the Early History of Charts and Sailing-Directions (Stockholm: Bather translation, 1897).
R. E. Dahlberg, “Maps without Projections,” The Journal of Geography, vol. 60 (1961), pp. 213-18.
area the errors and inconsistencies might be quite small and could go unnoticed. Incon- sistencies are not necessary or inevitable, how- ever. No set of observational information specifying the location of any terrestrial posi- tion by not more than two independent mea- sures will lead to inconsistencies when plotted. This is true whether the earth i s considered round or flat. In either of the above events it is correct to say that the map is not based on a map projection only in the sense that the cartographer involved was not consciously em- ploying a map projection.3 But, as one learns from any elementary work on map making, every map requires a map projection. The ancient maps therefore are implicitly referred to some map projection.
The next difficulty, it seems, occurs if it is assumed that this implicit projection is one of the now-known projections. For example, the portolan charts have been compared with charts drawn on Mercator’s projection and on the square pr~jection.~ Suppose that the match is sufficiently poor to conclude that the chart is not drawn on either of these two pro-
3 Similar comments apply to an engineering survey of a small area.
* H. Wagner, “Das Ratsel der Kompasskarten im Lichte der Gesamtentwickelung der Seekarten,” Ver- handlungen, XI Deutsches Geographentages, Bremen, 1895, pp. 65-87; E. Steger, “Untersuchung uber italienische Seekarten des Mittelalters auf Grund der kartometrischen Methode” Dissertation, Gottingen, 1896; M. Fiorini, Le projezioni delle carte geog- rufiche, Bologna, 1881; A. Brewing, “Zur Geschichte der Kartographie,” Zeitschrift fur Wissenschaftliche Geographie, I1 (1881), p. 168 ff; M. A. Clos-Arceduc, “L’Enigme des Portulans: Etude sur la Projection et le mode de construction des cartes a rumbs du XIV“ et du Xv” Siecle,” Bulletin, Comite des Travaux Historiques et Scientifiques, Section de Geographie, LXIX (1956), pp. 215-31. The square projection is also known by the names plate carrbe, simple cylin- drical, and cylindrical equal-spaced projection.
351
352 W. R. TOBLER June
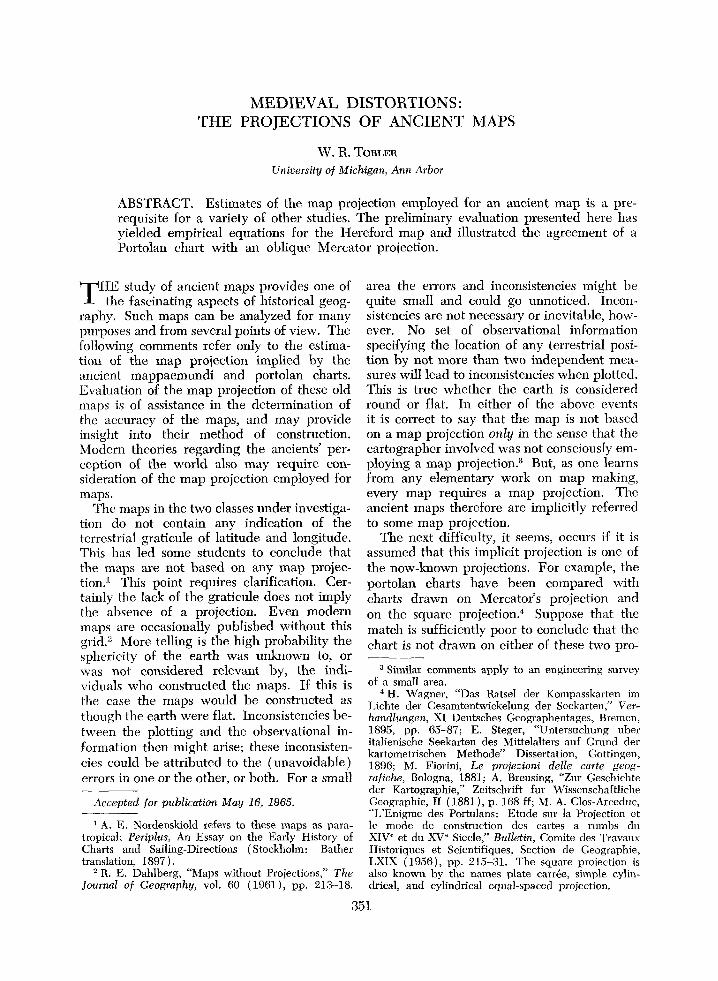
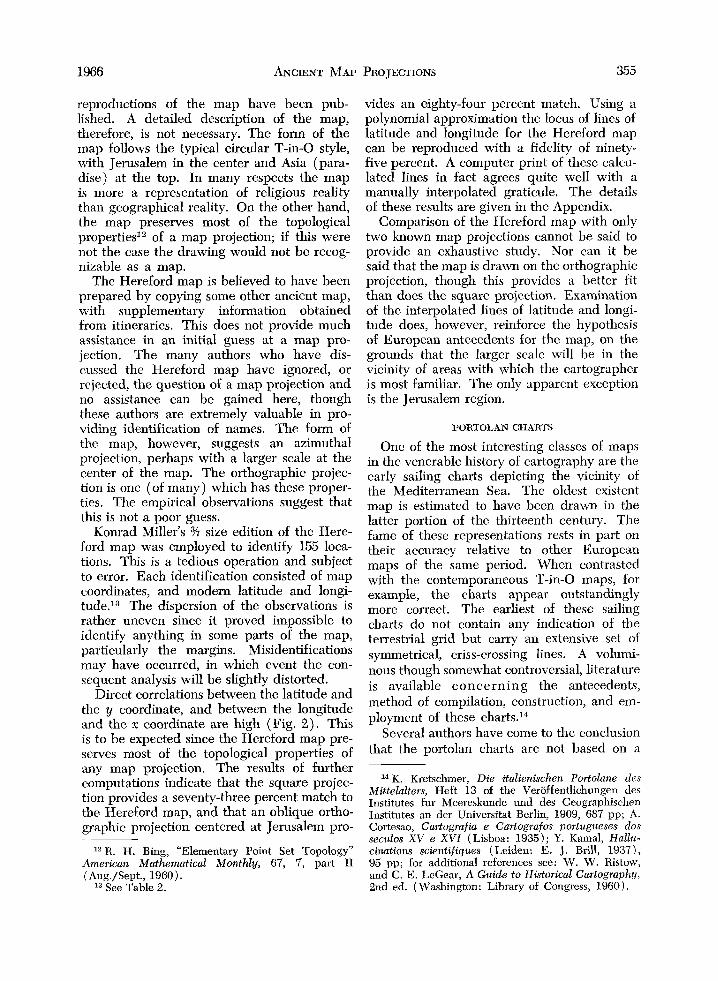
FIG. 1. Konrad Miller’s edition of the Hereford Map.
jections. This does not prove that the chart map projection, which may be any of the sev- is not based on a map projection; such a con- eral hundred now known, or may be one clusion can in fact never be drawn if one which is completely unknown today. The accepts the notion of an implicit map projec- problem can be attacked from several direc- tion. The search, then, must continue for a tions. Most helpful is an examination of the
1966 ANCIENT MAP PROJECTIONS 353
method of construction of the maps, if this is known. Typically this turns out to be incon- clusive, and is in fact one of the questions which many have attempted to answer. But there are some hints which allow the range of possible projections to be narrowed down to a relatively limited few. A second obvious approach is to attempt to sketch the lines of latitude and longitude on the map, as esti- mated by identification of locations shown thereon. Examination of the graticule, its cur- vature and so on, should provide hints as to a reasonable family of projections.
A crucial point has now been reached. On the basis of some study it is postulated that “this” projection forms the basis for the map. How is this hypothesis to be tested? The test generally consists of superimposing a map drawn on the postulated projection over the original map, with a scale adjustment and shifting until the best average coincidence is obtained. Since one knows that the agree- ment of the two maps will not be perfect, the question is now one of deciding how much agreement is necessary before the hypothesis is to be accepted. The procedure outlined below does not answer this question, but it does allow one to say, with relative precision, how great the agreement is, and thus permits one to rank, from greatest to least agreement, all projections for which one cares to carry through the necessary operations. The method requires extensive observations and computa- tions but is perfectly general and may be ap- plied whenever it is desired to ascertain the agreement of a questionable map with a particular map projection. The necessary cal- culations may seem formidable but entail less than five minutes on a modern high-speed digital computer.
To begin it is necessary to identify a large number of points on the map. By identify is meant to record the modern latitudes and longi- tudes of these points. The next step is to re- cord the map coordinates of these same points. Any system of coordinates will serve but rec- tangular (x, y ) coordinates are the most con- venient. It does not matter in the least what units are used for the coordinates, and it is not necessary to determine the scale of the chart or any distances thereon.5 Nor does the orien-
Readers of the earlier treatises (especially Wagner, op. cit. footnote 4) will recognize this as a distinct advantage.
tation of the grid system matter. The postu- lated map projection will be defined by a mathematical relation of the form:
X = f ( $ > A ) Y = d $ , A ) >
where 9 is the latitude and A is the longitude, and X and Y are the corresponding map pro- jection coordinates. Using this relation calcu- late the map projection coordinates of all of the points identified by latitude and longitude. This is where the points should be if the pro- jection were to give a perfect fit. These calcu- lated coordinates ( X , Y ) are now to be com- pared to the observed map coordinates ( x , y ). Since the coordinates employed for the record- ing of the observations were quite arbitrary, a different result would be obtained for each possible set of recording coordinates. It is therefore necessary to apply the mathematical equivalent of rotation and change of scale, as might be obtained by use of an optical reduc- ing-enlarging instrument, to give the best possible overall average fit. This is given by a least squares Euclidean transformation, which brings the numbers given the recorded observations into the same units as the calcu- lated map projection coordinates (see Ap- pendix). The comparison of the map projec- tion with the map is now made by calculating the difference between the observed and calculated locations for corresponding points. The correlation coefficient between the two sets of coordinates gives the amount of agree- ment, and areas of greatest disagreement may provide hints as to a more suitable map pro- jection. With the same observational informa- tion the entire procedure can be repeated a second time for a new map projection, and so on.
As one already has recorded, for the fore- going operations, the latitudes and longitudes of a large number of places along with the map locations (in some arbitrary coordinate system) of these same identified points, one can continue by obtaining an empirical esti- mate of the equations defining the map pro- jection. The problem can be phrased thus: find the equations which, when entered with any specific latitude and longitude value, result in the observed x and y coordinate values. The mathematical theory indicates that this can always be achieved with a suffi- ciently complicated equation. In practice it is
354 W. R. TOBLER June
+,,TO ............................... ........., ........... ........,. .................
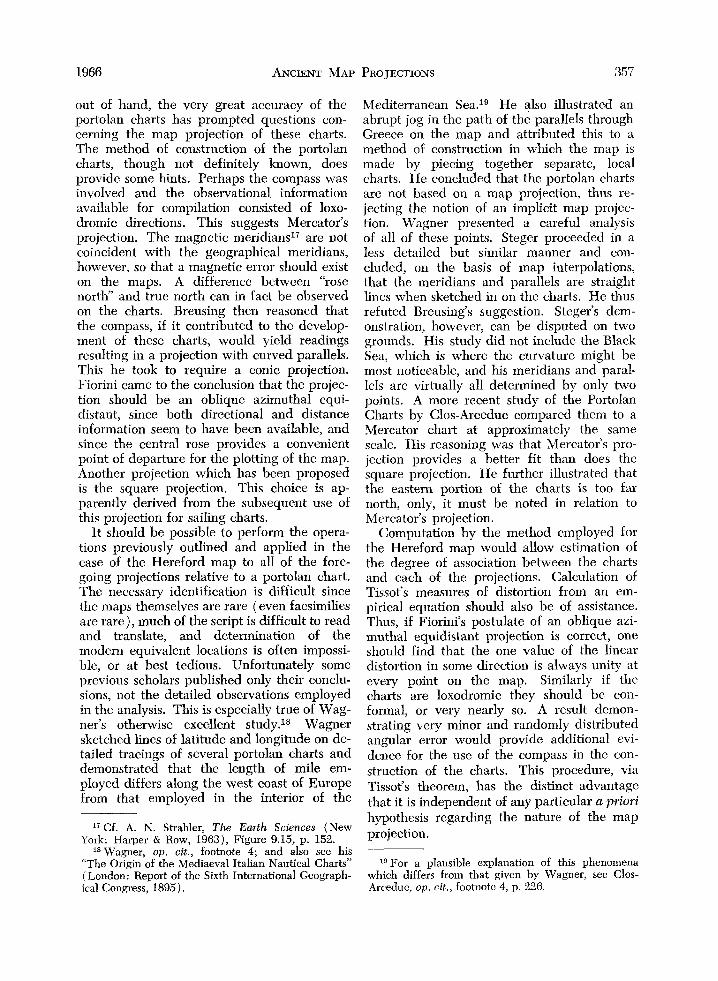
/ R = 0.8611
* . W c . . . ... ..... “ I - = ; ...
00 N.70; . . . . . . . . .
. . . . . . . . . . . . . . . . . . . . . . . . . . . . a . . . . . ........ w
. . . . . . . . . ......... ... .... u . . . .
-0.30 ! ...................,.......................................................... +6O +36.5’ +67O
L A T I T U D E
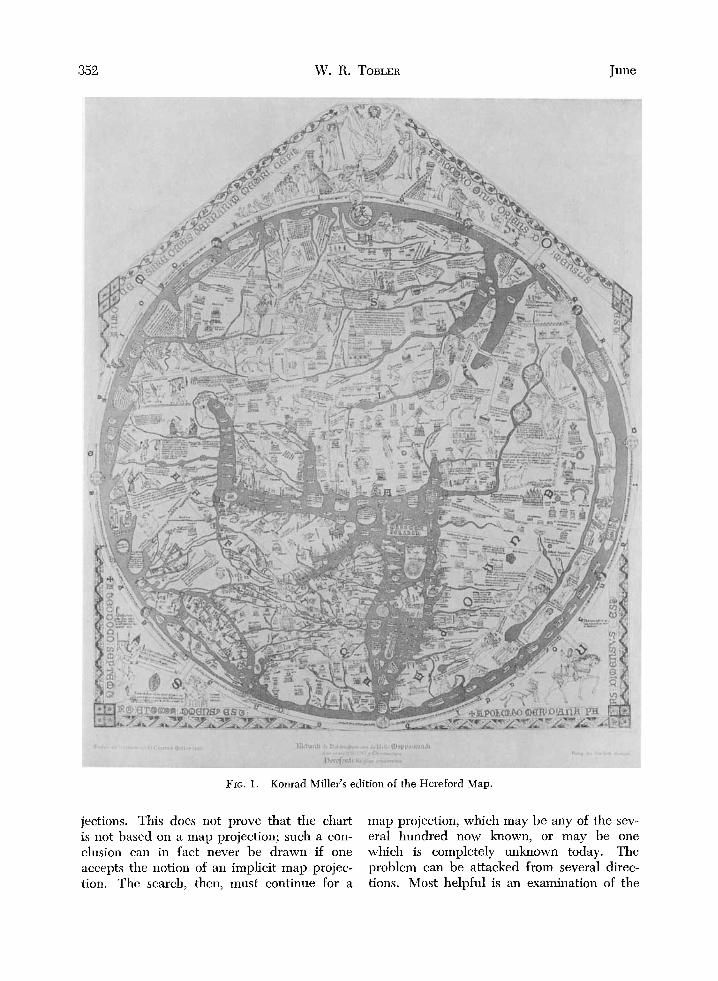
FIG. 2. Scatter diagrams illustrating the correlation ordinates (after rotation and scaling) on the Hereford
difficult to obtain a perfect fit and one is generally content with an equation which re- produces the observations with a high degree of reliability. This is reasonable since it is not desired to reproduce minor errors, such as might be caused by the shrinkage which has occurred on a 500-year-old map. The mathematical fitting procedure generally em- ployed is the mcthod of least squares poly- nomial or Fourier series curve fitting.G The equations obtained in this manner enable one to calculate, and draw, the latitude and longi- tude graticule at any desired interval. Equally importantly, they allow calculation of Tissot’s measures of map projection di~tortion.~ For- mulation of the problem in terms of the distor- tion is independent of any hypothesis regard- ing the specific map projection, but can be employed to infer whether or not the projec- tion has specific properties. This in turn may be of assistance in determining the projection. A word of caution is necessary here since the necessary differentiation of the empirical
For a discussion of curve fitting see any elemen- tary work on numerical analysis or an intermediate work on statistical methods. If there are some loca- tions which can be identified with a greater degree of reliability than others, a weighting procedure may be employed.
hl. A. Tissot, hfemoire sur la Representation des Surfaces (Paris: Gautier-Villars, 1881).
+1.40
W c Q Z - n
0 10.45 0 V
w
1
X
-0.50
.........~...........................,.........*................... I.. ........
R = 0.9435
. . .. .. . . . . . . . . . . ..... . . . . . . . . . . ..... ...... ..... ...... . . I . . .... ....
................................................................... t-- ........ -60’ +3.50 +130°
L O N G I T U D E
between latitude and longitude and rectangular co- Map.
equations may be subject to large errors.R The same comment holds true if a graphic deter- mination of Tissot’s measures is applied to visually sketched lines of latitude and longi- t ~ d e . ~
THE HEREFORD MAP
The Hereford maplo is one of the most famous of the surviving medieval mappae- mundi (Fig. 1). Certainly it is one of the largest (53 x 65 inches). It is a product of the later Middle Ages, circa 1283, and is still in the cathedral at Hereford, England. In many respects the map represents a culmination of 1,OOO years of mapping efforts, having prece- dents from Roman times. The map has been the subject of at least one book, and several monographs and articles.ll At least three large 8Cf., B. Arden, An lntroduction to Digital Com-
puting (New York: Addison-Wesley, 1963). G. A. Ginzburg, “A Practical Method of Deter-
mining Distortion on Maps,” Geodezist ( Moscow ), 10 (1935), pp. 49-57.
lo The materials in this section are summarized from: S. Jones, “The Hereford Map Projection,” M.A. thesis, Department of Geography, University of Michigan, Ann Arbor, 1964, 39 pp., and are used with the kind permission of Miss Jones.
l1 W. L. Bevan and H. W. Phillott, Medieval Geog- raphy; A n Essay in Illustration of the Herdord Mapf~(i Mundi (London: 1873); K. Miller, Die Herefordkartc (Stuttgart, 1903); G. R. Crone, The World M a p b y Richard of Haldingham (London: Royal Geographical Society, 1954) (with an extensive set of references).
1966 ANCIENT MAP PROJECTIONS 355
reproductions of the map have been pub- lished. A detailed description of the map, therefore, is not necessary. The form of the map follows the typical circular T-in-0 style, with Jerusalem in the center and Asia (para- dise) at the top. In many respects the map is more a representation of religious reality than geographical reality. On the other hand, the map preserves most of the topological properties12 of a map projection; if this were not the case the drawing would not be recog- nizable as a map.
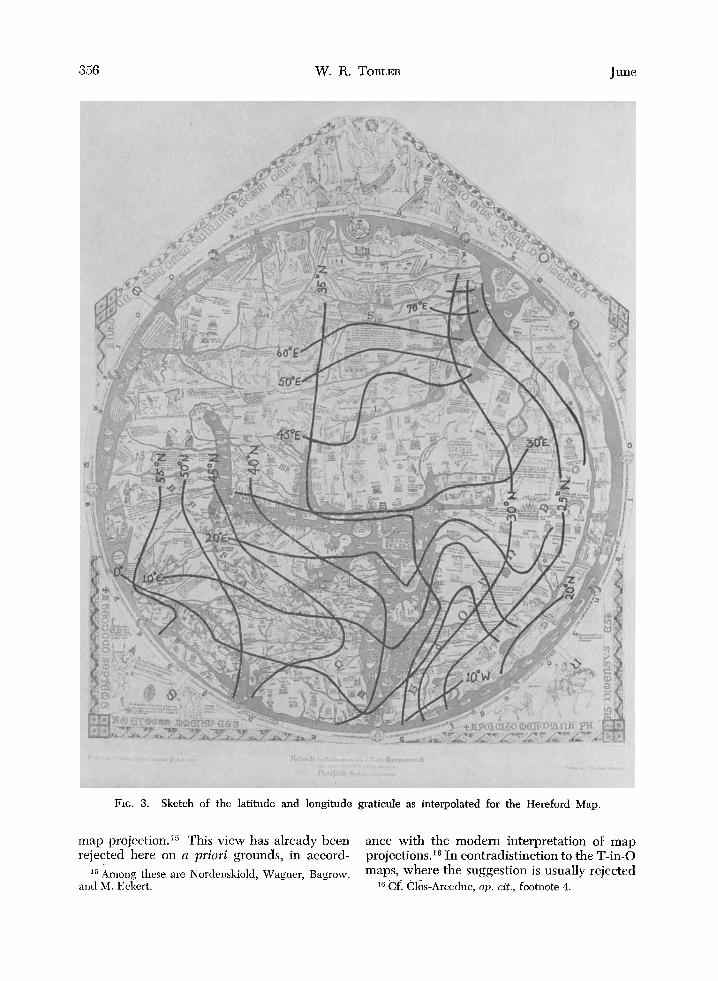
The Hereford map is believed to have been prepared by copying some other ancient map, with supplementary information obtained from itineraries. This does not provide much assistance in an initial guess at a map pro- jection. The many authors who have dis- cussed the Hereford map have ignored, or rejected, the question of a map projection and no assistance can be gained here, though these authors are extremely valuable in pro- viding identification of names. The form of the map, however, suggests an azimuthal projection, perhaps with a larger scale at the center of the map. The orthographic projec- tion is one (of many) which has these proper- ties. The empirical observations suggest that this is not a poor guess.
Konrad Miller’s 5% size edition of the Here- ford map was employed to identify 155 loca- tions. This is a tedious operation and subject to error. Each identification consisted of map coordinates, and modern latitude and longi- tude.13 The dispersion of the observations is rather uneven since it proved impossible to identify anything in some parts of the map, particularly the margins. Misidentifications may have occurred, in which event the con- sequent analysis will be slightly distorted.
Direct correlations between the latitude and the y coordinate, and between the longitude and the x coordinate are high (Fig. 2). This is to be expected since the Hereford map pre- serves most of the topological properties of any map projection. The results of further computations indicate that the square projec- tion provides a seventy-three percent match to the Hereford map, and that an oblique ortho- graphic projection centered at Jerusalem pro-
12R. H. Bing, “Elementary Point Set Topology” American Mathematical Monthly, 67, 7, part I1 ( Aug./Sept., 1960).
l3 See Table 2.
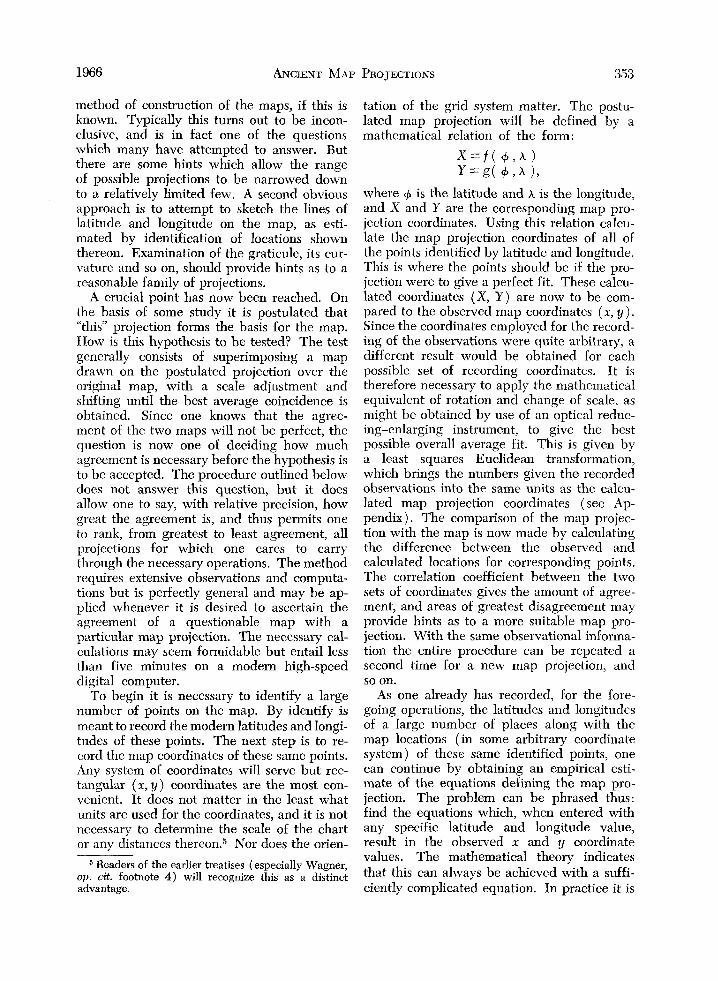
vides an eighty-four percent match. Using a polynomial approximation the locus of lines of latitude and longitude for the Hereford map can be reproduced with a fidelity of ninety- five percent. A computer print of these calcu- lated lines in fact agrees quite well with a manually interpolated graticule. The details of these results are given in the Appendix.
Comparison of the Hereford map with only two known map projections cannot be said to provide an exhaustive study. Nor can it be said that the map is drawn on the orthographic projection, though this provides a better fit than does the square projection. Examination of the interpolated lines of latitude and longi- tude does, however, reinforce the hypothesis of European antecedents for the map, on the grounds that the larger scale will be in the vicinity of areas with which the cartographer is most familiar. The only apparent exception is the Jerusalem region.
PORTOLAN CHARTS
One of the most interesting classes of maps in the venerable history of cartography are the early sailing charts depicting the vicinity of the Mediterranean Sea. The oldest existent map is estimated to have been drawn in the latter portion of the thirteenth century. The fame of these representations rests in part on their accuracy relative to other European maps of the same period. When contrasted with the contemporaneous T-in-0 maps, for example, the charts appear outstandingly more correct. The earliest of these sailing charts do not contain any indication of the terrestrial grid but carry an extensive set of symmetrical, criss-crossing lines. A volumi- nous though somewhat controversial, literature is available concerning the antecedents, method of compilation, construction, and em- ployment of these charts.14
Several authors have come to the conclusion that the portolan charts are not based on a
l4 K. Kretschmer, Die italienischen Portolane des Mitteklters, Heft 13 of the Veroffentlichungen des Institutes fur Meereskunde und des Geographischen Institutes an der Universitat Berlin, 1909, 687 pp; A. Cortesao, Cartografia e Cartografos portugueses dos seculos XV e XVI (Lisboa: 1935); Y. Kamal, Hallu- cinations scientifiques (Leiden: E. J. Brill, l937), 95 pp; for additional references see: W. W. Ristow, and C. E. LeGear, A Guide to Historical Cartography, 2nd ed. (Washington: Library of Congress, 1980).
356 W. R. TOBLER June
FIG. 3. Sketch of the latitude and longitude graticule as interpolated for the Hereford Map.
map projection.I5 This view has already been rejected here on a priori grounds, in accord-
l5 Among these are Nordenskiold, Wagner, Bagrow,
ance with the modern interpretation of map projections.lB In contradistinction to the T-in-0 maps, where the suggestion is usually rejected
and M. Eckert. l6 Cf. Clos-Arceduc, o p . cit., footnote 4.
1966 ANCIENT MAP PROJECTIONS 357
out of hand, the very great accuracy of the portolan charts has prompted questions con- cerning the map projection of these charts. The method of construction of the portolan charts, though not definitely known, does provide some hints. Perhaps the compass was involved and the observational information available for compilation consisted of loxo- dromic directions. ‘This suggests Mercator’s projection. The magnetic meridians1? are not coincident with the geographical meridians, however, so that a magnetic error should exist on the maps. A difference between “rose north” and true north can in fact be observed on the charts. Breusing then reasoned that the compass, if it contributed to the develop- ment of these charts, would yield readings resulting in a projection with curved parallels. This he took to require a conic projection. Fiorini came to the conclusion that the projec- tion should be an oblique azimuthal equi- distant, since both directional and distance information seem to have been available, and since the central rose provides a convenient point of departure for the plotting of the map. Another projection which has been proposed is the square projection. This choice is ap- parently derived from the subsequent use of this projection for sailing charts.
It should be possible to perform the opera- tions previously outlined and applied in the case of the Hereford map to all of the fore- going projections relative to a portolan chart. The necessary identification is difficult since the maps themselves are rare (even facsimilies are rare), much of the script is difficult to read and translate, and determination of the modern equivalent locations is often impossi- ble, or at best tedious. Unfortunately some previous scholars published only their conclu- sions, not the detailed observations employed in the analysis. This is especially true of Wag- ner’s otherwise excellent study.ls Wagner sketched lines of latitude and longitude on de- tailed tracings of several portolan charts and demonstrated that the length of mile em- ployed differs along the west coast of Europe from that employed in the interior of the
17 Cf. A. N. Strahler, The Earth Sciences (New York: Harper & Row, 1963), Figure 9.15, p. 152.
1s Wagner, o p . cit., footnote 4; and also see his “The Origin of the Mediaeval Italian Nautical Charts” (London: Report of the Sixth International Geograph- ical Congress, 1895).
Mediterranean Sea.lg He also illustrated an abrupt jog in the path of the parallels through Greece on the map and attributed this to a method of construction in which the map is made by piecing together separate, local charts. He concluded that the portolan charts are not based on a map projection, thus re- jecting the notion of an implicit map projec- tion. Wagner presented a careful analysis of all of these points. Steger proceeded in a less detailed but similar manner and con- cluded, on the basis of map interpolations, that the meridians and parallels are straight lines when sketched in on the charts. He thus refuted Breusing’s suggestion. Steger’s dem- onstration, however, can be disputed on two grounds. His study did not include the Black Sea, which is where the curvature might be most noticeable, and his meridians and paral- lels are virtually all determined by only two points. A more recent study of the Portolan Charts by Clos-Arceduc compared them to a Mercator chart at approximately the same scale. His reasoning was that Mercator’s pro- jection provides a better fit than does the square projection. He further illustrated that the eastern portion of the charts is too far north, only, it must be noted in relation to Mercator’s projection.
Computation by the method employed for the Hereford map would allow estimation of the degree of association between the charts and each of the projections. Calculation of Tissot’s measures of distortion from an em- pirical equation should also be of assistance. Thus, if Fiorini’s postulate of an oblique azi- muthal equidistant projection is correct, one should find that the one value of the linear distortion in some direction is always unity at every point on the map, Similarly if the charts are loxodromic they should be con- formal, or very nearly so. A result demon- strating very minor and randomly distributed angular error would provide additional evi- dence for the use of the compass in the con- struction of the charts. This procedure, via Tissot’s theorem, has the distinct advantage that it is independent of any particular a priori hypothesis regarding the nature of the map projection.
l9For a plausible explanation of this phenomena which differs from that given by Wagner, see Clos- Arceduc, op. cit., footnote 4, p. 226.
358 W. R. TOBLER June
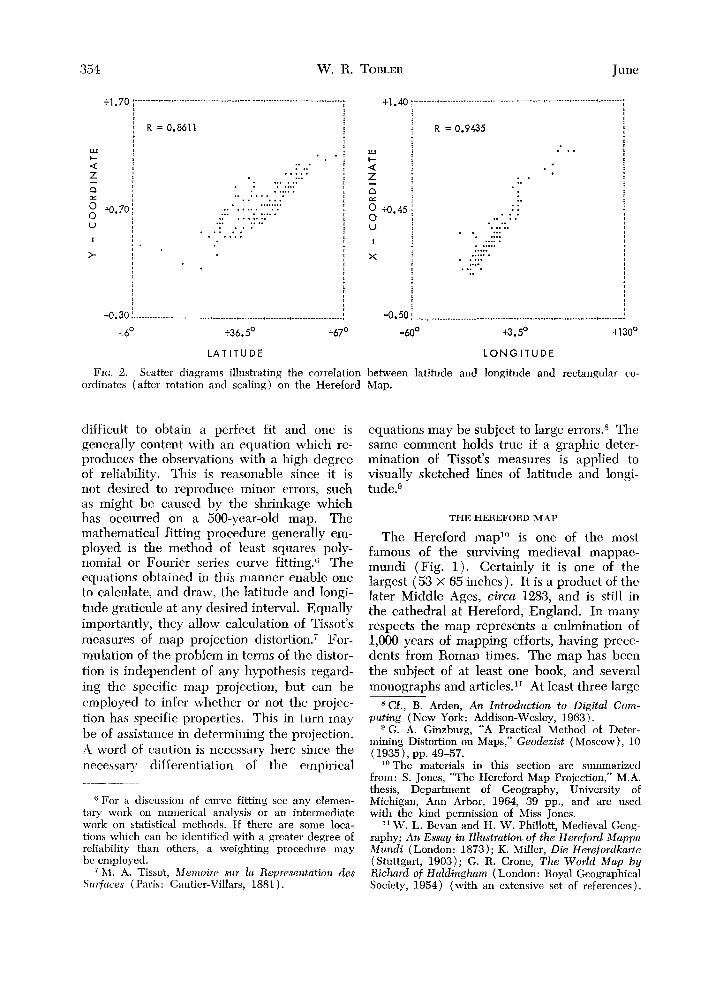
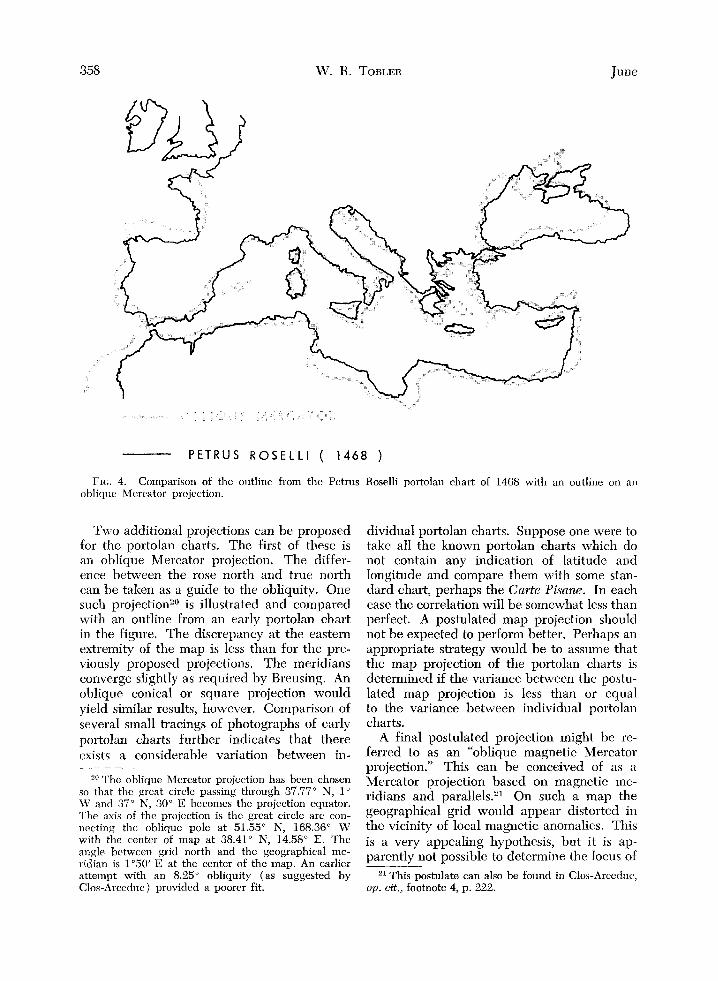
P E T R U S R O S E L L I ( 1468 )
FIG. 4. Comparison of the outline from the Petrus ohliqne Mercator projection.
Two additional projections can be proposed for the portolan charts. The first of these is an oblique Mercator projection. The differ- ence between the rose north and true north can be taken as a guide to the obliquity. One such projection20 is illustrated and compared with an outline from an early portolan chart in the figure. The discrepancy at the eastern extremity of the map is less than for the pre- viously proposed projections. The meridians converge slightly as required by Brewing. An oblique conical or square projection would yield similar results, however. Comparison of several small tracings of photographs of early portolan charts further indicates that there exists a considerable variation between in-
2o The oblique Mercator projection has been chosen so that the great circle passing through 37.77" N, 1" W and 37" N, 30" E becomes the projection equator. The axis of the projection is the great circle arc con- necting the oblique pole at 51.55" N, 168.36" W with the center of map at 38.41" N, 14.58' E. The angle between grid north and the geographical me- ridian is l"50' E at the center of the map. An earlier attempt with an 8.25" obliquity (as suggested by Clos-Arceduc ) provided a poorer fit.
Roselli portolan chart of 1468 with an outline on an
dividual portolan charts. Suppose one were to take all the known portolan charts which do not contain any indication of latitude and longitude and compare them with some stan- dard chart, perhaps the Carte Pisane. In each case the correlation will be somewhat less than perfect. A postulated map projection should not be expected to perfom better. Perhaps an appropriate strategy would be to assume that the map projection of the portolan charts is determined if the variance between the postu- lated map projection is less than or equal to the variance between individual portolan charts.
A final postulated projection might be re- ferred to as an "oblique magnetic Mercator projection." This can be conceived of as a Mercator projection based on magnetic me- ridians and parallels.21 On such a map the geographical grid would appear distorted in the vicinity of local magnetic anomalies. This is a very appealing hypothesis, but it is ap- parently not possible to determine the locus of
21 This postulate can also be found in Clos-Arceduc, op . cit., footnote 4, p. 222.
1966 ANCIENT MAP PROJECTIONS 359
0
" x
Q
n 0. 0.
P
0 +
* Q m a r. In
0
N x Q m - I
x P
Q P " 0.
" Q x m N a " 0 + x
N
Q
? In 0
N
+ x N
Q
b 9
- 0 + x P
N '8.
r;
Q
h
In d XJ
+ N - - I
x In Q - 0 N -r 0
0
+ x
9
N
d Q d N " (?
x a 9 0 N
N I
N
Q
0: Q Lg
N
+ 0.
! 0
1
>
360 W. R. TOBLER June
the magnetic meridians in the ycars 1200 to 1300 A.D. so that the empirical curve fitting procedure appears appropriate. Such a mag- netic Mercator should be approximately con- formal and investigation of the angular distor- tion is suggested.
Without performing the actual analysis, it is not possible to draw further conclusions concerning the portolan charts. Any such analysis would need to be quite carefully done, since the charts will probably fit several map projections very closely.
CONCLUSIONS
It has been possible to answer only a few of the substantive questions concerning the possible methods of preparation of medieval maps. The strategy developed in this prelim- inary analysis, however, seems to offer some improvement over procedures employed in previous studies. For the student of the history of geography the techniques also allow estimates of the rate of cartographic progress. Imhof, for example, has recently published small illustrations of two old maps of the Canton of Zurich.22 On the basis of these rather small illustrations, the simple calcula- tions imply an improvement of twenty-eight percent in the mapping of Zurich between 1566 and 1667, and an improvement of only two percent between 1667 and 1965. This result in turn suggests the hypothesis of an S-shaped growth curve for the history of positional ac- curacy on maps. The same approach as out- lined here can be applied, with obvious modi- fications, to maps which do contain the lati- tude and longitude graticule, either to deter- mine the perhaps unknown map projection, or to make estimates of the accuracy of the maps if the projection is known.
Appendix The procedure employed in estimating the
amount of correlation between the observed map locations and a specific map projection is given here. Let the complex number
22 E. Imhof, “Beitrage zur Geschichte der topograph- ischen Kartographie” International Yearbook of Car- tography, 4 (1964), pp. 129-53.
Wj = x, + iy,,
2, = x, + iY,
( i 2 = -1) be the map location of the jth point of identi- fied latitude and longitude. Let
be the location of this same point on some map projection. Transform the arbitrary map recording coordinates to a new system,
I$, = S, + iij, , by applying a translation, rotation, and change of scale. This is no more than an assignment of new numbers to the recording coordinates and in no way changes the interrelations of the points. The transformation is of the form
<v = A + BW , where A and I3 are complex numbers deter- mined by application of the least squares cri- terion in a manner such that the residual
is a minimum. The amount of correlation between the
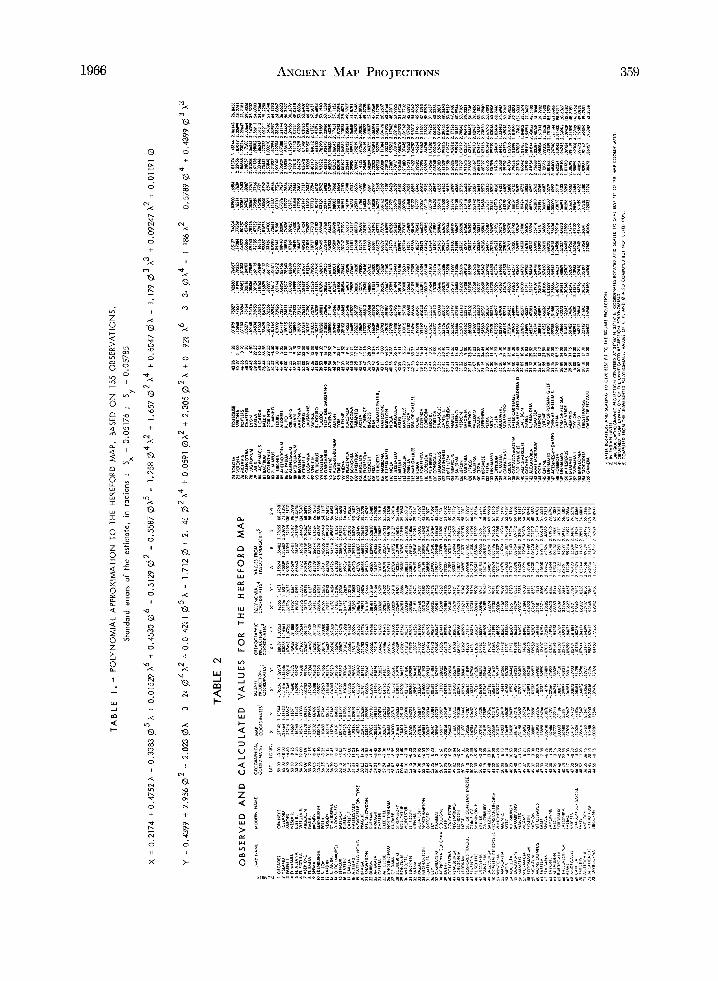
transformed observational locations and the locations on the postulated map projection ( calculated from the estimated latitudes and longitudes) is then given as the ratio of the regression variance to the total variance, as in ordinary correlation methods. The square of this complex correlation times 100 provides a measure of the percentage agreement between the two maps. This entire procedure is re- peated for each postulated map projection. In the case of the Hereford map there were three comparisons; the square projection, the oblique orthographic projection, and the poly- nomial approximation. The map projection computations were all performed for a sphere of unit radius.
The coefficients of the unweighted poly- nomial approximation ( RL = 0.9450) to the Hereford map are given in Tables 1 and 2. It is cautioned that terms cannot be dropped from this equation without changing the coef- ficients. The latitude (4 ) and longitude ( A ) values are to be entered in radian units. The computations were performed with the as- sistance of the University of Michigan com- puting center.