medicine price survey - whoapps.who.int/medicinedocs/documents/s18615en/s18615en.pdfacknowledgements...
TRANSCRIPT

SURVEY OFMEDICINE PRICES, AVAILABILITY,
AFFORDABILITY AND PRICE COMPONENTSIN MONGOLIA
Ms Ch. Munkhdelger,Head, Pharmaceutical and Health Devices Department,
Ministry of Health, Mongolia
November 2004
Survey funded: WHO/HAI

Table of Contents Page
ACKNOWLEDGEMENTS 3ABBREVIATIONS 4EXECUTIVE SUMMARY 5Summary of Recommendations 51. INTRODUCTION AND BACKGROUND 5
Country information 5The health situation 6The pharmaceutical sector 7
2. METHODOLOGY 9Which sectors were surveyed 9Selecting geographic areas 9Sampling facilities 10List of medicines 10
3. DATA COLLECTION 124. RESULTS 12
Important notes 124.1 Public sector patient prices and availability 134.2 Private sector patient prices and availability 154.3 Community Revolving Drug Funds’ patient prices and availability 174.4 Public sector procurement 184.5. Inter-sector patient prices and availability comparisons 194.6 Affordability to patients 224.7 Price components and cumulative mark-ups 234.8 National prices in international perspective 25
5. DISCUSSION 256. CONCLUSIONS AND RECOMMENDATIONS 26Annexes
Annex 1: List of medicines surveyed (Product Table) 27Annex 2: List of essential medicines 30Annex 3: Timetable of survey 31Annex 4: Analysis summary sheets 32Annex 5: Medicines data collection form used in survey 39Annex 6: National Pharmaceutical Sector Form, Mongolia 44
2

ACKNOWLEDGEMENTS
This medicine price survey was conducted with financial and technical support of the WHO and Health Action International (Europe) Permission to undertake this survey was given by the Ministry of Health, Mongolia.
Special gratitude is extended to Ms Margaret Ewen, Co-Director (Projects), Health Action International (Europe), Ms Kirsten Myhr, Head, RELIS Ost Drug Information Centre, Ulleval University Hospital for their invaluable guidance and involvement during the preparations, commissioning and completion of the survey.
We wish to thank all the people who gave their precious time to provide data and area supervisors and data collectors. We also wish to express our thanks to the Advisory Group:
Dr. Dungerdorj, the Main Specialist for Pharmaceuticals, MOH,
D. Uranchimeg, Officer in charge for drug supply, Pharmacy Department, Directorate of Medical Services,
O. Damba, the representative of Mongolian Pharmaceutical Association,
D. Chuluuntsetseg, the Head of Department of Essential Medicine, “Mongol emimpex” concern.
Ms Ch. Munkhdelger,Head, Pharmaceutical and Health Devices Department, Ministry of Health, MongoliaGovernment building, Olympic Str - 2,Ulaanbaatar - 210648Mongolia
e-mail: [email protected]: 976-11-261682
3

ABBREVIATIONS
EML Essential Medicines List GDP Gross Domestic ProductHAI Health Action International HIF Health insurance fundINN International non-proprietary nameLPG Lowest Priced GenericMax MaximiumMin MinimiumMNT Mongolian Tugrug (currency)MOH Ministry of Health MPR Median Price RatioMSG Most sold genericMSH Management Sciences for HealthNA Not availableNGO Non Government OrganisationRDF Revolving Drug Funds UNICEF United Nations Children's FundWHO World Health Organization US$ United States DollarVAT Value Added Tax
The terms "medicines" and "drugs" are used interchangeably in this report.
EXECUTIVE SUMMARY
The medicine price project has carried out a field study to measure the prices and availability of medicines in Mongolia using an international standardized methodology.
4

The results showed that in Mongolia, there is a limited market, particularly for innovator brand products, as well as poor affordability of medicines by customers. The innovator brand medicine, one key indicator of comparative medicine survey, was only found for one medicine.
Among the 3 sectors, the most sold generic equivalent is more available in the private sector and lowest price generic equivalent is more available in the public sector. The prices obtained by public procurement are greater than the international standard. The prices charged for the most sold generic medicines in the private sector were almost two times the prices in the public sector, while the prices of the lowest price generic eqivalents were less than double the public sector patient price. Prices in the public sector and private sector are considerably higher if compared to international reference price.
The prices of generic medicines also vary (one generic is different from another) and the cheapest product is not always the most sold in all sectors.
For one month course of the lowest priced generic Ranitidine to treat peptic ulcer, a patient would need to pay the equivalent 1.8 days’ wages in public sector facilities and 3.1 days’ wages in private sector. Part of the problem is relatively high duties, tariffs and mark-ups.
Summary of Recommendations
1. In all sectors medicine availability and the price regulation must be improved.
2. Appropriate regulations are needed to increase drug supply and lower the price.
3. Review and reduction of burden of duties, taxes and mark-ups on medicines is needed.
5
1. INTRODUCTION AND BACKGROUND
The objectives of our study were:1. To measure prices of selected medicines in different sectors, geographical
areas, health facilities and pharmacies2. To identify differences in the prices of innovator brand products and generic
equivalents3. To identify components of medicines prices4. To assess affordability of the medicines
Country information
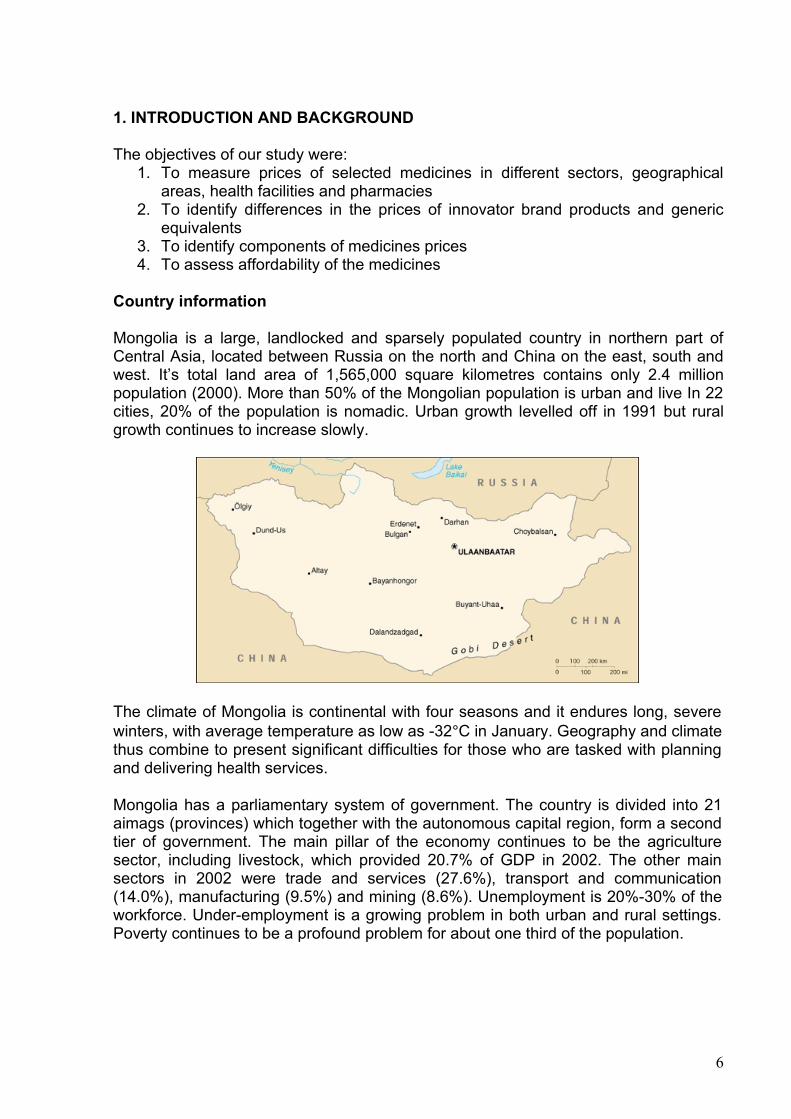
Mongolia is a large, landlocked and sparsely populated country in northern part of Central Asia, located between Russia on the north and China on the east, south and west. It’s total land area of 1,565,000 square kilometres contains only 2.4 million population (2000). More than 50% of the Mongolian population is urban and live In 22 cities, 20% of the population is nomadic. Urban growth levelled off in 1991 but rural growth continues to increase slowly.
The climate of Mongolia is continental with four seasons and it endures long, severe winters, with average temperature as low as -32°C in January. Geography and climate thus combine to present significant difficulties for those who are tasked with planning and delivering health services.
Mongolia has a parliamentary system of government. The country is divided into 21 aimags (provinces) which together with the autonomous capital region, form a second tier of government. The main pillar of the economy continues to be the agriculture sector, including livestock, which provided 20.7% of GDP in 2002. The other main sectors in 2002 were trade and services (27.6%), transport and communication (14.0%), manufacturing (9.5%) and mining (8.6%). Unemployment is 20%-30% of the workforce. Under-employment is a growing problem in both urban and rural settings. Poverty continues to be a profound problem for about one third of the population.
6

The Health situation
Ensuring adequate health services throughout a sparsely populated (1.5 inhabitants per sq. km) terrain with extremes in climate is a challenging task in the health system.
Until 1990, the Mongolian Health Care system was supported by the former Soviet Union. The system that was developed was effective in reducing the rapid spread and high burden of infectious diseases that was threatening to wipe out the Mongolian population.
Mongolia is experiencing health problems associated with both third world and first world countries with constrained economic base. There are health problems related to high maternal and infant mortality, very high levels of sexually transmitted diseases and some communicable diseases. Many non-communicable diseases including cancer, cardiovascular diseases, and mental health issues are also common. The ability of the Government to provide social services and compensatory support is quite limited. Government spending on health has been about 4% of GDP and about 10% of the government budget in the most recent years.
The Mongolian health care system consists of three levels. These are served by a variety of facilities. The relationship of the type of care and type of facilities and referral level are shown below:
Table 1 Relationship of the Type of Care and Type of Facilities and Referral Level
Level Type of careType of facility
UB City Rest of the country Referral level
Primary General professional care
FGP, Village hospital
Bagh feldsher post, FGP, Soum / Intersoum hospital
---
Secondary Specialized professional care
Ambulatory and branches, District Hospital
Inter-soum hospitals, Aimag ambulatory Aimag hospital,
First referral level
Tertiary Advanced specialized professional care
Specialized hospitals, centres RDTC Second referral level
Source: Minister’s order #A/361, 2000.
The constitutional and health policies objectives are equitable access to health care for every citizen and the allocation of resources for health in relation to needs of the population in geographically different parts of the country.
The pharmaceutical sector
About 85% of medicines that Mongolia needs are imported. There is one state owned drug supplying company besides 50 privately owned small drug suppliers. The state drug wholesaler “Mongolemimpex” is a joint stock company with 51% of shares owned by state. With the advent of free market economy in the 1990s, Mongolia saw rapid growth in the private pharmaceutical sector. In 2004, there are 29 local manufacturers,
7
90 wholesalers and 807 pharmacies in the country (including pharmacy branches). Most pharmacies are private, except for state hospital pharmacies and soums1 pharmacies.
Currently, 65% (221 soums) of all the soum pharmacies are supported by a Community and Health Project. The Community and Health Project was started in 1994 by the Ministry of Health in cooperation with UNICEF and supported by a grant from the Nippon Foundation. The project aimed to address the problem of the lack of essential drugs in rural areas by establishing Revolving Drug Funds (RDF) and to sustain primary health care services through the active participation of communities. This support has been the major international project in the pharmacy sector. The programme was quite successfully and will be established in the remaining soums in 2005.
The MOH drug budget in 2004 was 78,631,231.9 MNT2 and it has been increasing substantially from previous years. (Exchange rate 1$=1207MNT)
Table 2 Drug allocation in the health budget
Year Drug budget (mln MNT)
Total health expenditure (mln MNT)
1999 6,835.5 36,926.12000 7,960.4 46,860.62001 9,538.2 54,281.12002 9.379.7 57,662.22003 8,871.3 62,299.72004 10,362.3 78,631.2
Drugs for cancer, kidney dialysis, some psychiatric illnesses etc (total number of 55 medicines for 15 kinds of disease) are provided free of charge, through tertiary and secondary hospitals.
There is also a reimbursement scheme for medicine costs. The items of reimbursable drugs as well as their prices were reviewed according to the existing list and prices. There are 127 medicines whose prices could be reimbursed by the health insurance fund based on prescriptions issued by family doctors (general practitioners). The pharmacist charges a designated percent of the retail cost at the pharmacy to the customer, and also applies for reimbursement of the retail cost of the medicines through the HIF.
A new procedure to apply competitive bidding in procurement of medicines needed by state-run hospitals was introduced in 2002 to improve efficiency of the fund allocated for medicines.
Key indicators to measure the availability and rational use of essential medicines, based on WHO indicators, are shown in Table 2.
1 A soum is a country’s administrative unit equivalent to district.2 National currency
8
Table 3 The key indicators (2004)
Indicators 2004Availability of key medicines 77.9-96.0% Average number of medicines per patient 2.9Average consultancy time on drug information 119 sec Percentage of medicines from the EML dispensed, out of total number of dispensed
59.4%
Percentage of injections dispensed 12.1% Percentage of antibiotics dispensed 15.0% Percentage of vitamins dispensed 16.1% Percentage of generic medicines dispensed 50% Percentage of medicines adequately labelled 46%
Most communities do not have enough money to buy necessary medicines, and low quality drugs are sold and irrational drug use is widespread. At the time of centralized economic practices in Mongolia, the Government used to fix the price for each of medicines and a single tariff was applied throughout the country. However, after the 1997 price liberalization, there was no more regulation from the Government and the price of medicines has gone up.
2. METHODOLOGY
During the month of November 2004, a survey on measuring prices of medicines was undertaken. The survey was conducted as a cross-sectional survey based on a methodology developed by World Health Organization (WHO) and Health Action International (HAI), comparing the prices of medicines in different health sectors.
Sectors surveyed
The survey examined three sectors as follows:• Public sector• Private sector• Other sector (Drug Revolving Fund)
We also looked at two prices in the public sector, i.e. procurement prices and prices charged to patients.
The table below describes which sectors were surveyed and what was measured in each sector.
9
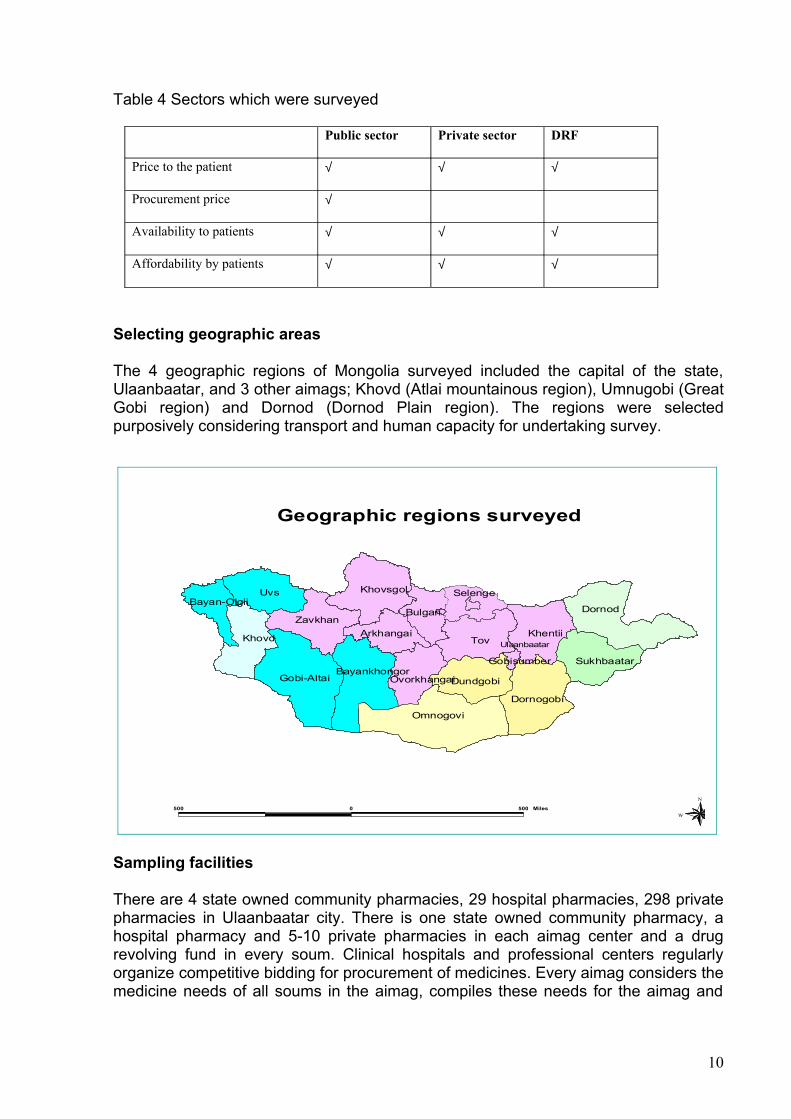
Table 4 Sectors which were surveyed
Public sector Private sector DRF
Price to the patient √ √ √
Procurement price √
Availability to patients √ √ √
Affordability by patients √ √ √
Selecting geographic areas
The 4 geographic regions of Mongolia surveyed included the capital of the state, Ulaanbaatar, and 3 other aimags; Khovd (Atlai mountainous region), Umnugobi (Great Gobi region) and Dornod (Dornod Plain region). The regions were selected purposively considering transport and human capacity for undertaking survey.
Tov
Uvs
Dornod
Omnogovi
Gobi-Altai
Khovd Khentii
Khovsgol
Dornogobi
Zavkhan
DundgobiBayankhongor
Sukhbaatar
Bulgan
Arkhangai
Selenge
Ovorkhangai
Bayan-Olgii
Gobisumber
Ulaanbaatar
500 0 500 Miles
N
EW
S
Geographic regions surveyed
Sampling facilities
There are 4 state owned community pharmacies, 29 hospital pharmacies, 298 private pharmacies in Ulaanbaatar city. There is one state owned community pharmacy, a hospital pharmacy and 5-10 private pharmacies in each aimag center and a drug revolving fund in every soum. Clinical hospitals and professional centers regularly organize competitive bidding for procurement of medicines. Every aimag considers the medicine needs of all soums in the aimag, compiles these needs for the aimag and
10

organizes tenders. Clinical hospitals and the Health Department of aimags have their own tender committees.
In view of the design of this study, the samples were selected according to the WHO/HAI manual in Ulaanbaatar city and aimag center. The public health facilities were selected, then the pharmacy that is closest to each facility was selected locally in the field by the supervisor. Public health facilities and RDF pharmacies were selected by the survey manager. A total of 52 pharmacies were surveyed: Ulaanbaatar:
1 State owned community pharmacy 5 hospital pharmacies (procurement prices only)10 Private retail pharmacies
Each aimag:1 State owned community pharmacy 1 hospital pharmacies (procurement prices only)5 Private retail pharmacies5 Drug revolving fund pharmacies
Treatment affordability was calculated for ten conditions using local price information and the daily wage rate of the lowest paid unskilled government worker.
List of medicines
The WHO/HAI methodology uses a selected number of medicines for which specific dosage forms and strengths are pre-determined; only prices and availability of these exact medicines, forms and strengths are collected. The selected medicines are made up of a core list of 30 medicines determined as part of the methodology for all countries and a supplementary list of up to 20 medicines which is determined by each individual country.
A total of 33 medicines were included in the survey. Of these 18 medicines were core medicines and 15 were added by us as a supplementary list.
Supplementary medicines were selected to reflect local disease patterns and important medicines for the country.
The tables below lists the core medicines removed with the reason, and lists the supplementary medicines selected. A full list of all the medicines surveyed can be found in annex 2.
Table 5 Core medicines removed
Medicine Dosage form, strength Reason for removal1 Artesunate 100 mg cap/tab Not marketed2 Ceftriaxone injection 1 g/vial gram Different strength3 Fluconazole 200 mg cap/tab Different strength4 Fluoxetine 20 mg cap /tab Not marketed5 Indinavir 400 mg cap/tab Not marketed 6 Losartan 50 mg cap/tab Not marketed7 Lovastatin 20 mg cap/tab Not marketed
11

8 Nevirapine 200 mg cap/tab Not marketed9 Phenytoin 100 mg cap/tab Not marketed10 Zidovudine 100 mg cap/tab Not marketed11 Nifedipine Retard 20mg tab Not marketed12 Pyrimethamine+Sulfadoxine 25mg+500mg tab Not marketed
Table 6 Supplementary medicines added
Medicine Dosage form, strength Reason for addition1 Ampicillin 500 mg tab Commonly used2 Ceftriaxone injection 250 mg/vial Included core list with different
strength3 Chloramphenicol 500 mg cap/tab Commonly used4 Clotrimazole 100 mg pessary Commonly used5 Cephalexin 250 cap Commonly used6 Fluconazole 150 mg cap/tab Included core list with different
strength7 Erythromycin 250 mg tab Commonly used8 Furosemide 40 mg tab Commonly used9 Gentamicin injection 40mg/ml Commonly used10 Ibuprofen 400 mg tab Commonly used11 Indomethacin 25 mg tab Commonly used12 Mebendazole 100 mg tab Commonly used13 Metronidazole 250 mg tab Commonly used14 Propranolol 40 mg tab Commonly used15 Reserpine 250 mcg tab Commonly used
For each substance, the following three products were surveyed:• Innovator brand (identified centrally)• Most sold generic equivalent (identified centrally) We undertook an initial
survey by telephone to identify the MSG product.• Lowest price generic equivalent (identified at the facility)
Note: data on the MSG products of beclometasone inhaler and ceftriaxone injection was not included in the analysis as the products were incorrectly identified. Data was also not included for nifedipine retard 10mg tablets as there was no MSH price for this medicine.
In all sectors we also measured the availability of the medicines at the time of data collection. All prices were converted to US dollars using the exchange rate on 5 November 2004, the first day of the survey.
We also identified the components of medicine prices in order to better understand the different selling prices.
3. DATA COLLECTION
All personnel involved in data collection and data entry were trained to ensure the reliable and accurate completion of the data collection forms and entry of the data. A pilot test was conducted during the training of data collectors.
12

Data were collected by asking the medicine price in pharmacies. Public procurement prices were collected from hospitals. Data on price components and their costs were collected centrally from wholelalers and pharmacies.
Data entry and analysis took place at central level once each data collection form was reviewed for clarity and completeness. A computerized workbook developed by WHO/HAI, which is a special application of Microsoft Excel, was used to enter the data collected in the field, consolidate and summarize results. The data was double entered to ensure accuracy, and the automated autochecker was used to minimise any errors.
Summary measures of the medicine prices found during the survey were expressed as ratios relative to a standard set of reference prices. The Management Sciences for Health prices (2003) were selected as the standard. The MSH reference prices are the medians of recent supplier procurement prices offered by not-for-profit (and sometimes for-profit) suppliers to developing countries for multi-source generically equivalent products. Where supplier prices were not available, agency prices were used as the reference.
4. RESULTS
Our survey of 33 medicines in Mongolia revealed that the innovator brand medicine, one key indicator of comparative medicine surveys, was only found for one medicine (ceftriaxone in the private sector). This is related to Mongolia’s limited market and foreign trade scope as well as poor affordability of medicines by cus tomers.
Important notes
What is a median price ratio? (MPR)Results on medicine prices gathered by the WHO/HAI survey are usually expressed as “median price ratios” or MPRs. The MPR is a ratio of the local price divided by an international reference price (converted into the same currency). The reference price serves as an external standard for evaluating local prices. All studies are expected to use the same reference prices so that they will be comparable. The MPR results in this survey are based on reference prices taken from the 2003 Management Sciences for Health (MSH) International Drug Price Indicator Guide (http://erc.msh.org/). The MSH Guide pulls together information from recent price lists of large, non-profit generic medicine suppliers. These suppliers typically do not sell to individual private pharmacies. Rather, they sell in large quantities to governments and NGOs, and accordingly, prices in the MSH Guide tend to be low. But they offer a very useful standard against which locally available products can be compared in any country.
Use of medians and averagesAs averages can be skewed by outlying values, median values are generally used (unless otherwise stated) throughout the presentation of results and discussion as a better representation of the midpoint value.
13

Reporting of quartiles/percentilesA quartile is a percentile rank that divides distribution into 4 equal parts. The range of values containing the central half of the observations: that is, the range between the 25th and 75th percentiles (the range including the values that are up to 25% higher or down to 25% lower than the median) is called the interquartile range. In this finding section, where medians and interquartile ranges are not presented in tables, the following format will be used to report the number of occurrences and the interquartile range.
AffordabilityAffordability is the cost of treatment in relation to people’s income. In this survey, the daily wage of the lowest paid unskilled government worker is used for the comparison. Medicines which are unaffordable to this worker will be much less affordable for the significant proportion of the population that have an income less than this worker.
Basket of medicinesThe basket of core and supplementary medicines should provide a reasonable representation of medicines in the country and price conditions on the market.
Minimum data points for analysisFour data points for patient prices and one data point for procurement prices are the minimum number of data points that are necessary for the analysis to be performed by the workbook. If there are less data points are less than this, then no calculation of MPR is performed. Availability is however calculated for all medicines irrespective of the number of outlets stocking each medicine.
4.1 Public sector patient prices and availability (Annex 4B)
Mongolia had a centralized medicine supply system and decentralization was started in mid -1990s. “Mongolemimpex” company was a monopoly state medicine wholesaler and distributor and it was privatized in 2003. Now the state drug wholesaler “Mongolemimpex” is a joint stock company with 51% of shares owned by the state. All public sector pharmacies belong to this company in Mongolia. The variation in results in the public sector was limited because the state company has a countrywide supply system and all public pharmacies are supplied with the same medicines. For instance, the nationally identified most sold generic products could rarely be found. No innovator brands were found.
The lowest priced generic medicines were found to have a median MPR for the basket of 2.6 (n=19); however within the basket this varied from 0.79 for cephalexin to 55.06 for mebendazole. The most sold generic was rarely found in these pharmacies (median MPR was 2.31, n=2)
The median availability of those medicines on the essential medicines list was found to be 72.7 %. The table below shows those medicines on the essential medicines list and their availability in the four state-owned community pharmacies.
14

Table 7 Availability of any generic in the public sector (n=4 facilities)
Availability MedicineNot found Beclometasone inhaler, Co-trimoxazole suspension, Fluphenazine injection
< 50% Ampicillin, Ibuprofen, Metformin50-75% Chloramphenicol, Diazepam, Glibenclamide, Hydrochlorothiazide, Reserpine
75-100% Aciclovir, Amitriptyline, Amoxicillin, Atenolol, Captopril, Carbamazepine, Diclofenac, Erythromycin, Furosemide,Gentamicin injection, Indomethacin, Mebendazole, Metronidazole, Omeprazole, Propranolol, Ranitidine, Salbutamol inhaler
4.2 Private sector patient prices and availability (Annex 4c)
The median availability of medicines in private sector was quite good, 42% for most sold generic medicines and 80% for any generic eqivalent. The reason for the low availability of most sold generics is that the urban and rural areas have different supply sources in Mongolia. Some companies supply only in the big cities and some wholesalers distribute to rural areas. Therefore national identification of “most sold” generic product was extremely difficult. For the patient this is not a problem as long as there is at least one generic available. Some individual medicines had low availability in the private sector, namely, ceftriaxone, cephalexin, co-trimoxazole susp, diazepam, fluconazole, and metformin.
We found only one item of innovator brand within all sectors during the survey. This was ceftriaxone injection and it was priced at 6.4 times the international reference price.
For generically equivalent products, the difference in price between the most sold and the lowest price was not so large. The median of the median price ratios of the lowest price generic products was 4.17 times the international reference price. However within the basket this varied from 0.75 for reserpine and 120.13 for fluconazole. Table 8 lists median price ratios for individual generic medicines found to be greater than the median MPR for all the medicines surveyed in the private sector
Table 8 Lowest priced generic medicines whose MPR is greater than the median MPR
Medicine Strength MPR1 Amitriptyline 25 mg 7.63
15

2 Atenolol 50 mg 7.573 Ceftriaxone injection 250 mg/vial 5.274 Ciprofloxacin 500 mg 6.515 Clotrimazole 100 mg 4.176 Co-trimoxazole suspension 8+40 mg/ml 8.637 Diazepam 5 mg 11.848 Diclofenac 25 mg 11.789 Fluconazole 150 mg 120.13
10 Glibenclamide 50 mg 7.5811 Hydrochlorothiazide 25 mg 30.7712 Ibuprofen 400 mg 7.8013 Indomethacin 25 mg 4.7614 Mebendazole 100 mg 26.9415 Metronidazole 250 mg 6.7216 Propranolol 40 mg 6.50
Figure 1 Variability of lowest priced generic medicines in the private sector – showing ratios for 25th percentile, 75th percentile and median (diamond shape)
0
5
10
15
20
25
30
35
Amitripty
line
Atenolo
l
Ciproflox
acin
Co-trim
oxazo
le su
sp
Diazepam
Diclofe
nac
Gentam
icin i
nj
Hydroc
hlorot
hiazid
e
Meben
dazo
le
Propran
olol
Ranitid
ine
Pric
e R
atio
's -
25th
& 7
5th
perc
entil
e an
d m
edia
n
As this graph shows, the interquartile ranges (i.e. 50% of the prices collected for that medicine) showed little variability for many lowest priced generics (except cotrimoxazole susp, diclofenac, hydrochlorothiazide and mebendazole)
The following lowest priced generic medicines had very little price variation across the pharmacies sampled: amoxicillin, ampicillin, chloramphenicol, erythromycin, omeprazole, reserpine and salbutamol inhaler.For amoxicillin and chloramphenicol there were no difference between MPR for the most sold and lowest price generic equivalent product and 50% of the pharmacies had
16
the same price. One explanation for the same price for different products is that these two products are produced by local manufacturers and supply is stable.
Figure 2 Median price ratios, private sector
17

0 20 40 60 80 100 120 140
Aciclovir
Amitriptyline
Amoxicillin
Ampicillin
Atenolol
Captopril
Carbamazepine
Ceftriaxone injection
Chloramphenicol
Ciprofloxacin
Clotrimazole
Co-trimoxazole suspension
Diazepam
Diclofenac
Erythromycin
Fluconazole
Furosemide
Gentamicin
Glibenclamide
Hydrochlorothiazide
Ibuprofen
Indomethacin
Mebendazole
Metformin
Metronidazole
Omeprazole
Propranolol
Ranitidine
Reserpine
Salbutamol inhaler
Median price ratio
Low est price generic
Most sold generic
Innovator brand
The range between the Min and Max MPR for most sold and lowest price generic equivalent products are identical and very large 0.75 - 120.13. It means that a product could be cheaper than the international reference price (reserpine tabs), but could also be as high as 120 times that price (fluconazole 150mg tabs). The reasons for the high prices for some drugs (mebendazole, hydrochlorothiazide and fluconazole) are because they are supplied by only one distributer and the generics are branded.
18

4.3 Community Revolving Drug Funds’ patient prices and availability (Annex4)
Revolving Drug Funds were created with assistance from UNICEF and functions in about 70% of soums and will be established in remaining soums in 2005. The properties of the RDFs are owned by the community and the fund is used for supplying medicines for the local area.
The median availability of MSG is not very high but was 73% for LPG in the soums. The range between 25th and 75th percentiles and between the Minimium and Maximium shows wide variation in availability in soum RDF.
No innovator brand was found in the outlets. The median of the median price ratios of the most sold generic equivalents was 4 times the international reference price, with half of medicines being sold in the range of 2.0 to 7.3. The median of the median price ratios of the lowest price generic equivalents was 4 times the reference price, with 50% of the medicines in the range of 2.2 to 7.1.
4.4 Public sector procurement (Annex 4a)
A new procedure to apply competitive bidding in procurement of drugs needed by state-run hospitals was introduced in 2002 to improve efficiency of the fund allocated for medicines. Clinical hospitals and professional centers regularly organize themselves for competitive bidding for procurement of medicines. Each aimag considers medicine needs of all soums of the aimag, compiles a list for aimag needs and organizes a tender. Clinical hospitals and Health Department of aimags have their own tender committees.
We collected 8 medicine orders to study procurement price data. There was no innovator brand in the orders. The Mongolian procurement price is not close to international standard, with typical ratios between 2.2 and 2.4. These prices obtained are quite high by international standards. The difference in price between the most sold and the cheapest was small. The median of the median price ratios of the lowest price generic equivalents was 2.3 times the international reference price. It shows that the fluctation of price is high and stabilization of the medicine market is very low.
Figure 3 Median price ratios for procurement prices (lowest priced generic)
19

0 5 10 15 20 25 30 35 40 45
Aciclovir
Amitriptyline
Amoxicillin
Ampicillin
Atenolol
Captopril
Carbamazepine
Ceftriaxone injection
Chloramphenicol
Ciprofloxacin
Clotrimazole
Diazepam
Diclofenac
Erythromycin
Furosemide
Gentamicin
Glibenclamide
Hydrochlorothiazide
Ibuprofen
Indomethacin
Mebendazole
Metformin
Metronidazole
Omeprazole
Propranolol
Ranitidine
Reserpine
Salbutamol inhaler
Med
icin
es
Median price ratio
4.5 Inter-sector patient prices and availability comparisons (Annex 4e)
The survey shows that procurement prices in the public sector were lower than the patient prices in all four sectors studied.
Figure 4 Inter sector patient prices
20
2.39 2.52.31
2.6
6.4
4.12 4.173.99 3.99
0
1
2
3
4
5
6
7
Innovator Brand
(One item)
Most sold generic
equivalent
Lowest price generic
equivalent
Products
Med
ian
MP
R Procurement (n=8 orders)
Public (n=4 outlets)
Private (n=25 outlets)
RDF (n=15 outlets)
Sectors
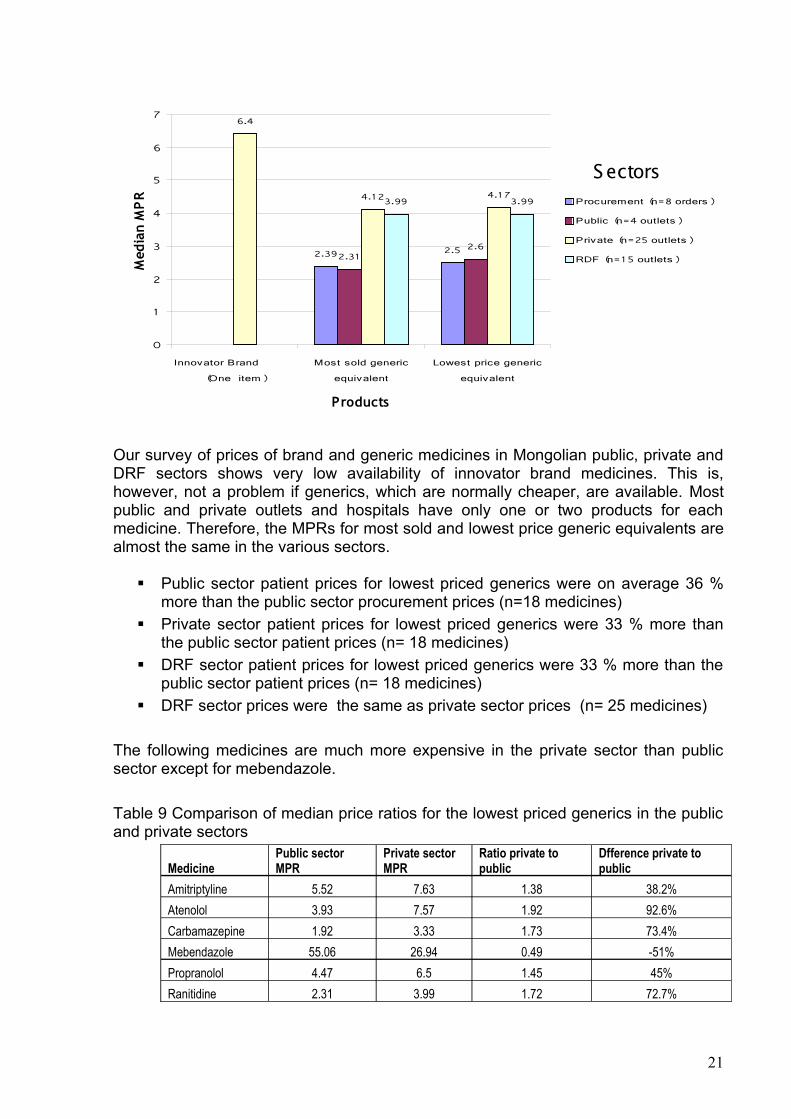
Our survey of prices of brand and generic medicines in Mongolian public, private and DRF sectors shows very low availability of innovator brand medicines. This is, however, not a problem if generics, which are normally cheaper, are available. Most public and private outlets and hospitals have only one or two products for each medicine. Therefore, the MPRs for most sold and lowest price generic equivalents are almost the same in the various sectors.
Public sector patient prices for lowest priced generics were on average 36 % more than the public sector procurement prices (n=18 medicines)
Private sector patient prices for lowest priced generics were 33 % more than the public sector patient prices (n= 18 medicines)
DRF sector patient prices for lowest priced generics were 33 % more than the public sector patient prices (n= 18 medicines)
DRF sector prices were the same as private sector prices (n= 25 medicines)
The following medicines are much more expensive in the private sector than public sector except for mebendazole.
Table 9 Comparison of median price ratios for the lowest priced generics in the public and private sectors
MedicinePublic sector MPR
Private sector MPR
Ratio private to public
Dfference private to public
Amitriptyline 5.52 7.63 1.38 38.2%Atenolol 3.93 7.57 1.92 92.6%Carbamazepine 1.92 3.33 1.73 73.4%Mebendazole 55.06 26.94 0.49 -51%Propranolol 4.47 6.5 1.45 45%Ranitidine 2.31 3.99 1.72 72.7%
21

Some medicines have high retail prices in the public sector when compared to their procurement price. Table 10 Comparison of median price ratios for the lowest priced generic - procurement price and public sector patient price
Public Procurement price (MPR)
Public Sector patient price (MPR)
Ratio public sector patient price to procurement price
Difference public sector patient price to procurement price
Captopril 1.58 2.89 1.82 82.9%Clotrimazole 2.5 3.82 1.52 52.8%Diclofenac 8.93 10.56 1.18 18.2%Furosemide 1.73 2.07 1.19 19.6%Indomethacin 3.33 4.98 1.49 49.5%Mebendazole 40.41 55.06 1.36 36.2%Metrionidazole 3.69 5.93 1.60 60.7%Propranolol 3.57 4.47 1.25 25.2%
Some medicines are almost the same price in the private sector as the public sector – amoxicillin, captopril, clotrimizole, erythromycin, furosemide, indomethacin, salbutamol inhaler and omeprazole
Figure 5 Cross sector medicine availability by product type includes both core and supplementary Medicines (n=33 on list)
25
44
26.7
100
8073.3
0
20
40
60
80
100
120
Public (n=4
outlets)
Private (n=25
outlets)
RDF (n=15
outlets)
Med
ian
% a
vaila
bilit
y
Most sold generic equivalent
Lowest price generic equivalent
Our survey of prices of innovator brand and generic medicines in Mongolian public, private and other sectors shows very low availability of innovator brand medicines.
Among the 3 sectors, the most sold generic equivalent (MSG) is more available in the private sector and lowest price generic equivalent (LPG) is more available in the public sector. The reason for higher MSG availability in private sector, is that for this survey,
22
the product was identified in this sector. Normally, the public sector carries a different range of products as they are purchased by tender and these have been entered as LPGs in the study.
Regional variations of prices and availability
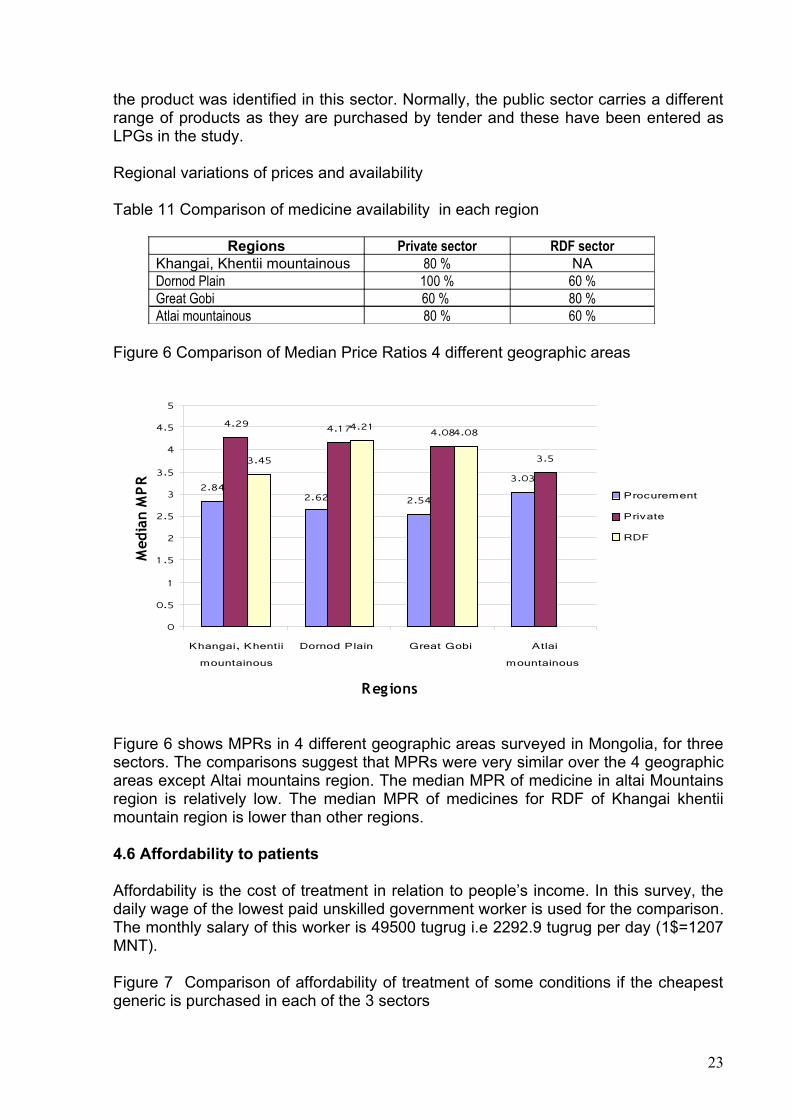
Table 11 Comparison of medicine availability in each region
Regions Private sector RDF sectorKhangai, Khentii mountainous 80 % NADornod Plain 100 % 60 %Great Gobi 60 % 80 %Atlai mountainous 80 % 60 %
Figure 6 Comparison of Median Price Ratios 4 different geographic areas
2.842.62 2.54
3.03
4.29 4.17 4.08
3.53.45
4.21 4.08
0
0.5
1
1 .5
2
2.5
3
3.5
4
4.5
5
Khangai, Khentii
mountainous
Dornod Plain Great Gobi Atlai
mountainous
Regions
Med
ian
MP
R
Procurement
Private
RDF
Figure 6 shows MPRs in 4 different geographic areas surveyed in Mongolia, for three sectors. The comparisons suggest that MPRs were very similar over the 4 geographic areas except Altai mountains region. The median MPR of medicine in altai Mountains region is relatively low. The median MPR of medicines for RDF of Khangai khentii mountain region is lower than other regions.
4.6 Affordability to patients
Affordability is the cost of treatment in relation to people’s income. In this survey, the daily wage of the lowest paid unskilled government worker is used for the comparison. The monthly salary of this worker is 49500 tugrug i.e 2292.9 tugrug per day (1$=1207 MNT).
Figure 7 Comparison of affordability of treatment of some conditions if the cheapest generic is purchased in each of the 3 sectors
23

0
0.5
1
1 .5
2
2.5
3
3.5
D ep re ssion
(Am itrip ty line)
H ype rte ns io n
(A teno lo l)
A rth ritis
(D ic lo fe na c)
Pep tic u lce r
(R an itid in e)
Num
ber
of d
ays'
wag
es
Pub lic
P riva te
RDF
Table 12 Cost of treatment for pneumonia and hypertension
Treatment TypePublic sector Private
pharmaciesMedian price
Days’ wages
Median price
Days’ wages
Pneumonia:Amoxicillin250 mg x 3 for 7 days
Innovator brand NA NA NA NAMost sold generic equivalent
NA NA 1260 0.5
Lowest price generic equivalent
1134 0.5 1260 0.5
Peptic ulcer:Ranitidine150 mg x 2 for 30 days
Innovator brand NA NA NA NAMost sold generic equivalent
NA NA 7350 3.2
Lowest price generic equivalent
4170 1.8 7200 3.1
Table 12 illustrates the affordability in the public and the private sectors for one acute and one chronic condition. The 7 days’ treatment course with amoxicillin for pneumonia requires the equivalent of 0.5 days’ wages to be treated by lowest price generic equivalent in public sector health facilities. It is same in private sector, requiring 0.5 days’ wages.
For a one month course of most sold generic ranitidine to treat peptic ulcer, a patient would need to pay the equivalent of 3.2 days’ wages, in the private sector. Buying the lowest price generic equivalent is slightly cheaper with 1.8 days’ wages in public sector facilities and 3.1 days’ wages in private pharmacies
24

Table 13 The effect of choice of therapeutic group to treat the same diagnosis
Condition Choice of medicine Number of days’ wages
Ratio of cost in comparison with the most affordable
Hypertension Atenolol 1.1 1:1Hydrochlorothiazide 1.7 1:1.5Captopril 2.4 2.1
Diabetes Metformin 1.0 1:1Glibenclamide 1.0 1:1
4.7 Price components and cumulative mark-ups (Annex 7)
Table 14 Price components and cumulative mark-ups
Component Imported product private sector
Locally produced generic equivalent, public sector tender
% Value % Value
Import price 100.0 100Customs duty 5% 105.0Stamp duty 1% 106.05Whole sale mark -up 25% 132.56 15% 115.00Retail mark-up 30% 172.33Value Added Tax (VAT) 15% 198.41 15% 132.25Sales price 198.41 132.25Total add-ons (cumulative mark-up)
98.41% 32.25%
Table 14 shows the price components of an imported product in the private sector and a locally produced generic equivalent purchased on the public sector. The results are given both as percentage add-on and cumulatively. It shows how a base price including ex-factory cost, insurance, and freight rises incrementally as it makes its way through the standard distribution channels. Annex 7 shows the price components of three medicines. The price components on all imported medicines are the same. First two charges (customs duty 5% and stamp duty 1%) would not be included in the locally produced generic medicines. The mark-ups are lower in the public sector but add-ons constitute 32% of the final price. If customs, stamps, duty and VAT were removed the additional cost would be reduced from 98.4% to 62.5%.
Table 15 Cumulative mark-up – local manufactured product, private sector
Type of chargeCharge Basis
Amount of Charge
Price of Dispensed Quantity
Cumulative % Mark-Up
Difference in cumulative
mark-up
Amount in currency
% of final price
Manufactured selling price NA NA 80 0.00% 80.00 53.5%Wholesaler mark-up percent 25.00% 100 25.00% 25.00 20.00 13.4%Retail mark-up percent 30.00% 130 62.50% 37.50 30.00 20.1%
25

VAT percent 15.00% 149.5 86.90% 24.40 19.50 13.0%86.90 149.50 100.0%
Figure 8 Component costs for imported products in the private sector as a percentage of the CIF price
26,51% 39,77% 25,85%
5,00%
1,05%
0% 20% 40% 60% 80% 100%
1
Customs tax Stamp duty Wholesaler mark-upRetailer mark-up Value Added Tax
Figure 9 Difference in cumulative mark-up
25.00 37.50 24.40
0 20 40 60 80 100
1
wholesale margin retail margin VAT
Figure 10 Percentage of final price
26

Cost
insurance
freight (CIF)
price, 53.5%wholesale
margin, 13.4%
retail margin,
20.1%
VAT, 13.0%
4.8 National prices in international perspective
Table 16 Price ratio for ranitidine in private sector in Mongolia compared to comparable developing countries
RanitidineMedian price ratio
India Ghana Armenia Peru Mongolia
Innovator brand 0.2 44.2 19.62 12.14Most sold generic equivalent
0.2 16.35 1.99 4.08
Note: the above data was taken from HAI’s web site. The surveys were undertaken in different years (2001-2003) and the MSH price for ranitidine varied across these years.
Only the most sold generic equivalent is on the market in Mongolia. Relatively competitive prices were found for India. The price of ranitidine is generally high. There is a notably sharp brand premium in Peru. Mongolia’s price for the generic is relatively high compared to Peru and India.
5. DISCUSSION
Our survey of prices of brand and generic medicines in Mongolian public, private and drug revolving fund sectors shows very low availability of innovator brand medicines. Mainly generic medicines of various manufacturers from developed countries are being imported, so most of the data collected is for these medicines. The innovator brand medicine could not be found in pharmacies that were sampled in our survey and therefore, we had to compare the prices of the most sold and the lowest price generic equivalents in the different sectors. It was quite common to have the same price for the two since most of the pharmacies sold one item of a medicine from one manufacturer only so the most sold generic may also be the lowest priced.
We also noticed that in each geographical region, mostly products of a single manufacturer were found. For example: products of a particular manufacturer that were available in pharmacies in Ulaanbaatar were not available in aimags This is related to the fact that there is no nationwide drug supplier except for the State Drug Supplying Company, Mongolemimpex.
27

The comparative study of the national and international reference price and the availability shows that the types of locally produced products have relatively stable prices in the market.. There was little price difference between the drugs sold in public sector, private sector and drug revolving fund’s pharmacies.
The procurement prices in the public sector was much lower than the patient prices in all three sectors studied. There was wide variation (26.1%) between public sector procurement and patient prices. However, the public sector procurement is not always efficient, as shown by the fairly high MPRs compared to the international reference prices for some items.
If we look at the prices and availability of medicines in public sector, private sector and drug revolving fund pharmacies, it is easy to understand the need for some kind of price regulation and policy coordination. We have noticed that this need has direct impact on the outcomes of hospital treatments and on both the in-patient and out-patient services.
A worker pay 0.5 days’ wages to treat an infection using amoxicillin but would pay 24.4 days’ wages using ceftriaxone injection (48.8 times –or an extra 24 days work). During the survey, it was difficult to find some of the indicators, which were supposed to constitute the basis for price comparisons. For example: manufacturer price of the imported medicines, the wholesale price and any extras added by the pharmacies varied greatly and made calculations difficult. The comparisons made include all the duties, including the VAT, customs duty, and transportation cost and registration fee, imposed by Mongolia’s currently effective legal acts. For imported generic medicines, the add-ons to the import price almost double the price. Many other countries do not charge taxes or duties on medicines and if the government of Mongolia chose to exempt medicines from taxes and duties this would reduce prices in the private sector by about 30%.
6. CONCLUSIONS AND RECOMMENDATIONS
The principal conclusions of the study are as follows:• The almost non-existence of innovative brand medicines in the market is
related to the import scope and the national purchasing power. • The prices of generic medicines vary and the cheapest generic equivalent is
not always the most sold.• Public sector is not very efficient in procurement and charges reasonably high
prices to patients compared to international prices.• The availability of medicines in all sectors is relatively low.• Prices show that medicines are relatively expensive compared to other
countries prices.• The government policy and intervention is absolutely essential for the price of
medicines, their mark-ups, VAT and the number of pharmacies. • Appropriate regulations are needed to increase drug supply and control prices.
28

On the basis of the findings of the study, the following recommendations are made to the policy makers.
1. Activities should be undertaken for proper enforcement of the State Drug Policy provisions on price and supply of medicines.
2. The public sector’s drug availability and the price regulation must be improved.
3. An in-depth study should be initiated to investigate the private sector that is booming at random under market conditions.
• Increased number of private pharmacies in rural areas.• Study and conclusion on greater differences of prices on generic
medicines in the private sector procured from varying manufacturers. • Consolidated receipt of statistical data from the private sector and
establishment of standards for pharmacies4. Steps should be taken to stabilize the price following the price reduction of
medicines and promote the foreign trade. Policy options include:• Review and reduce or eliminate the burden of duties and taxes• Reduce mark-ups on medicines • Promotion of the medicines import with tax concessions and improved,
budget efficiency• Break into two exempt taxes and duties reduce markups.
5. Increased supply and affordability of National essential drugs must become the main policy.
• Reduction of price variations through the price policy on insurance and free medicines as well as prescribed medicines
29

Annex 1: List of medicines surveyed (Product Table)
No. Medicine Name Medicine Strength
Dosage Form
Target Pack Size
Core List
"Innovator" Product Most Sold Generic Version (Nat'l)
Country
Name Manufacturer Country
Name Manufacturer
1 Aciclovir 200 mg cap/tab 25 yes Zovirax GSK Acilovira Ferein
2 Amitriptyline 25 mg cap/tab 100 yes Tryptizol MSDAmittriptylino
25Enddokrinini
ai
3 Amoxicillin 250 mg cap/tab 21 yes Amoxil GSKPhilcoamoxy
Philco Pharma
4 Ampicillin 500 mg tab 10 no Pentrexyl BMSPiloco ampi Philco
Pharma
5 Atenolol 50 mg cap/tab 60 yes TenorminAstra
ZenecaAtenolol Akri Akrikhin
6Beclometasone inhaler
0.05 mg/dose dose 200 yes Becotide GSK
7 Captopril 25 mg cap/tab 60 yes Capoten BMSLemcapril 25 Hans E
Lembcke
8 Carbamazepine 200 mg cap/tab 100 yes Tegretol NovartisConvulem-200 Hans E
Lembcke
9Ceftriaxone injection
250 mg/vial vial 1 no Rocephin Roche
10 Cephalexin 250 mg cap 10 no Keflex Eli Lilly Ospexin Biochemie
11 Chloramphenicol 500 mg cap/tab 10 no Chloromycetin PD/PfizerChloramphenic
olMonos Pharm
12 Ciprofloxacin 500 mg cap/tab 1 yes Ciproxin BayerPhilco cipro Philco
Pharma
13 Clotrimazole 100 mg pessary 21 no Canestan BayerLemnesten 100 Hans E
Lembcke
14Co-trimoxazole suspension
8+40 mg/ml millilitre 70 yes Bactrim Roche
Letrim-2880 Hans E Lembcke
15 Diazepam 5 mg cap/tab 100 yes Valium Roche Diazepam Laboratorio Farmacologico Milanes25
16 Diclofenac 25 mg cap/tab 28 yes Voltaren Novartis Diclodenk Denkpharm

17 Erythromycin 250 mg tab 10 no Erythrocin Abbott Erythromycin Syntex18 Fluconazole 150 mg cap/tab 30 no Diflucan Pfizer Diflazon KRKA
19Fluphenazine injection 25 mg/ml millilitre 1 yes Modecate
Sanofi-With/BMS
Fluphenazine dec.
Rotex Medica
20 Furosemide 40 mg tab 10 no Lasix HoechstFurosemide Monos
Pharm
21Gentamicin injection 40mg/ml millilitre 1 no Garamycin Schering
Philco genta80 Philco Pharma
22 Glibenclamide 5 mg cap/tab 60 yes Daonil HMR Mannil-5 Berlinkhemie
23Hydrochlorothiazide 25 mg cap/tab 30 yes Dichlotride MSD
Hypothiazide Sanofi-Synthelab
24 Ibuprofen 400 mg tab 20 no Brufen KnollLemprofen
400Hans E
Lembcke
25 Indomethacin 25 mg tab 10 no Indocid MSDIndomon Monos
Pharm
26 Mebendazole 100 mg tab 6 no Vermox JanssenMebendazole Hans E
Lembcke
27 Metformin 500 mg cap/tab 100 yes Glucophage MerckMetformin Denk500
Denk Pharma
28 Metronidazole 250 mg tab 20 no FlagylRhone
PoulencPhilco
metro250Philco
Pharma
29 Omeprazole 20 mg cap/tab 30 yes Losec Astra Zeneca Lemloc-20Hans E
Lembcke
30 Propranolol 40 mg tab 20 no Inderal Astra Zeneca PropranololBalkanpharma
31 Ranitidine 150 mg cap/tab 60 yes Zantac GSK KalamtacHans E
Lembcke
32 Reserpine 250 mcg tab 100 no SerpasilBiochemie/
Ciba Reserpine Oterop
33Salbutamol inhaler
0.1 mg/dose dose 200 yes Ventoline GSK Salbutamol
Moskhimpharm repatai
31

Annex 2: List of essential medicines
Note: 29 of the 33 core and supplementary medicines surveyed are currently on the essential medicines list (2001 edition)
Medicine nameHealth care level
Primary Secondary Tertiary1 Aciclovir Yes Yes Yes2 Amitriptyline Yes Yes Yes3 Amoxicillin Yes Yes Yes4 Ampicillin Yes Yes Yes5 Atenolol Yes Yes Yes6 Beclometasone Yes Yes Yes7 Captopril Yes Yes Yes8 Carbamazepine No Yes Yes9 Ceftriaxone No No No
10 Cephalexin No No No11 Chloramphenicol Yes Yes Yes12 Ciprofloxacin No No No13 Clotrimazole No No No14 Co-trimoxazole Yes Yes Yes15 Diazepam Yes Yes Yes16 Diclofenac No Yes Yes17 Erythromycin Yes Yes Yes18 Fluconazole No No No19 Fluphenazine decanoate No Yes Yes20 Furosemide Yes Yes Yes21 Gentamycin No Yes Yes22 Glibenclamide Yes Yes Yes23 Hydrochlorothiazide Yes Yes Yes24 Ibuprofen Yes Yes Yes25 Indomethacin Yes Yes Yes26 Mebendazole Yes Yes Yes27 Metformin Yes Yes Yes28 Metronidazole Yes Yes Yes29 Omeprazole Yes Yes Yes30 Propranolol Yes Yes Yes31 Ranitidine No Yes Yes32 Reserpine Yes Yes Yes33 Salbutamol Yes Yes Yes
32

Annex 3: Timetable of survey
DateAppoint advisory group and survey planning and preparations from 5 July 2004
to 10 August, 2004
Training of data collectors 30 October, 2004Data collection period from 05 Nov, 2004
to 12 Nov, 2004Data analysis from 1 Dec. 2004
to 31 Dec, 2004Preparation of draft reports from 31 Dec 2004
to 15 Jan, 2005Stakeholder meeting from 1 February 2005
to 15 March, 2004Final report publishedImplementation of advocacy and dissemination plan
33
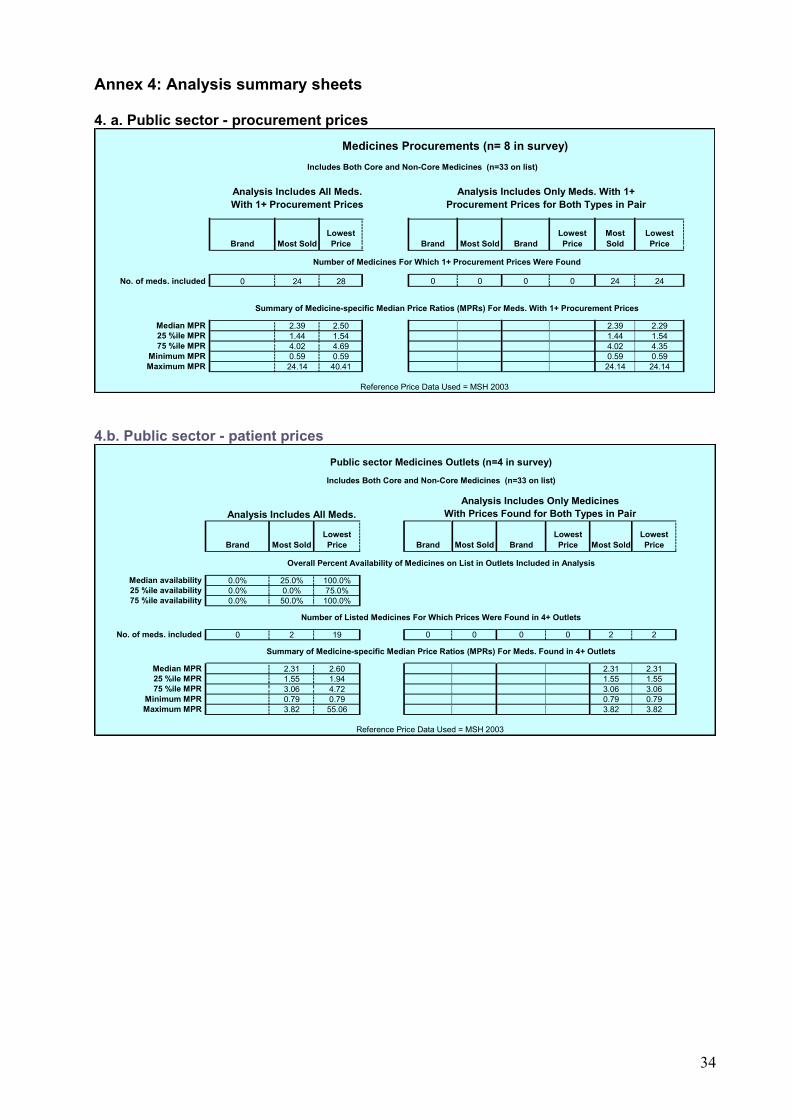
Annex 4: Analysis summary sheets
4. a. Public sector - procurement prices
Analysis Includes All Meds.With 1+ Procurement Prices
Brand Most SoldLowest Price Brand Most Sold Brand
Lowest Price
Most Sold
Lowest Price
No. of meds. included 0 24 28 0 0 0 0 24 24
Median MPR 2.39 2.50 2.39 2.2925 %ile MPR 1.44 1.54 1.44 1.5475 %ile MPR 4.02 4.69 4.02 4.35
Minimum MPR 0.59 0.59 0.59 0.59Maximum MPR 24.14 40.41 24.14 24.14
Procurement Prices for Both Types in Pair
Number of Medicines For Which 1+ Procurement Prices Were Found
Summary of Medicine-specific Median Price Ratios (MPRs) For Meds. With 1+ Procurement Prices
Analysis Includes Only Meds. With 1+
Reference Price Data Used = MSH 2003
Medicines Procurements (n= 8 in survey)Includes Both Core and Non-Core Medicines (n=33 on list)
4.b. Public sector - patient prices
Analysis Includes All Meds.
Brand Most SoldLowest Price Brand Most Sold Brand
Lowest Price Most Sold
Lowest Price
Median availability 0.0% 25.0% 100.0%25 %ile availability 0.0% 0.0% 75.0%75 %ile availability 0.0% 50.0% 100.0%
No. of meds. included 0 2 19 0 0 0 0 2 2
Median MPR 2.31 2.60 2.31 2.3125 %ile MPR 1.55 1.94 1.55 1.5575 %ile MPR 3.06 4.72 3.06 3.06
Minimum MPR 0.79 0.79 0.79 0.79Maximum MPR 3.82 55.06 3.82 3.82
Overall Percent Availability of Medicines on List in Outlets Included in Analysis
Analysis Includes Only MedicinesWith Prices Found for Both Types in Pair
Number of Listed Medicines For Which Prices Were Found in 4+ Outlets
Summary of Medicine-specific Median Price Ratios (MPRs) For Meds. Found in 4+ Outlets
Reference Price Data Used = MSH 2003
Includes Both Core and Non-Core Medicines (n=33 on list)
Public sector Medicines Outlets (n=4 in survey)
34

4.c. Private sector pharmacies – patient prices
Analysis Includes All Meds.
Brand Most SoldLowest Price Brand Most Sold Brand
Lowest Price
Most Sold
Lowest Price
Median availability 0.0% 44.0% 80.0%25 %ile availability 0.0% 24.0% 32.0%75 %ile availability 0.0% 68.0% 96.0%
No. of meds. included 1 28 29 0 0 0 0 28 28
Median MPR 6.40 4.12 4.17 4.12 4.0825 %ile MPR 6.40 2.52 2.54 2.52 2.5375 %ile MPR 6.40 7.89 7.63 7.89 7.59
Minimum MPR 6.40 0.75 0.75 0.75 0.75Maximum MPR 6.40 120.13 120.13 120.13 120.13
Analysis Includes Only MedicinesWith Prices Found for Both Types in Pair
Overall Percent Availability of Medicines on List in Outlets Included in Analysis
Private sector Medicines Outlets (n=25 in survey)
Number of Listed Medicines For Which Prices Were Found in 4+ Outlets
Summary of Medicine-specific Median Price Ratios (MPRs) For Meds. Found in 4+ Outlets
Reference Price Data Used = MSH 2003
Includes Both Core and Non-Core Medicines (n=33 on list)
4.d. RDF pharmacies (‘Other’ sector) – patient prices
Analysis Includes All Meds.
BrandMost Sold
Lowest Price Brand
Most Sold Brand
Lowest Price Most Sold
Lowest Price
Median availability 0.0% 26.7% 73.3%25 %ile availability 0.0% 6.7% 40.0%75 %ile availability 0.0% 40.0% 93.3%
No. of meds. included 0 19 25 0 0 0 0 19 19
Median MPR 3.99 3.99 3.99 3.9925 %ile MPR 1.99 2.24 1.99 2.3075 %ile MPR 7.26 7.13 7.26 7.11
Minimum MPR 0.79 0.75 0.79 0.75Maximum MPR 23.67 40.41 23.67 18.94
Analysis Includes Only MedicinesWith Prices Found for Both Types in Pair
Overall Percent Availability of Medicines on List in Outlets Included in Analysis
Other sector Medicines Outlets (n=15 in survey)
Number of Listed Medicines For Which Prices Were Found in 4+ Outlets
Summary of Medicine-specific Median Price Ratios (MPRs) For Meds. Found in 4+ Outlets
Reference Price Data Used = MSH 2003
Includes Both Core and Non-Core Medicines (n=33 on list)
35
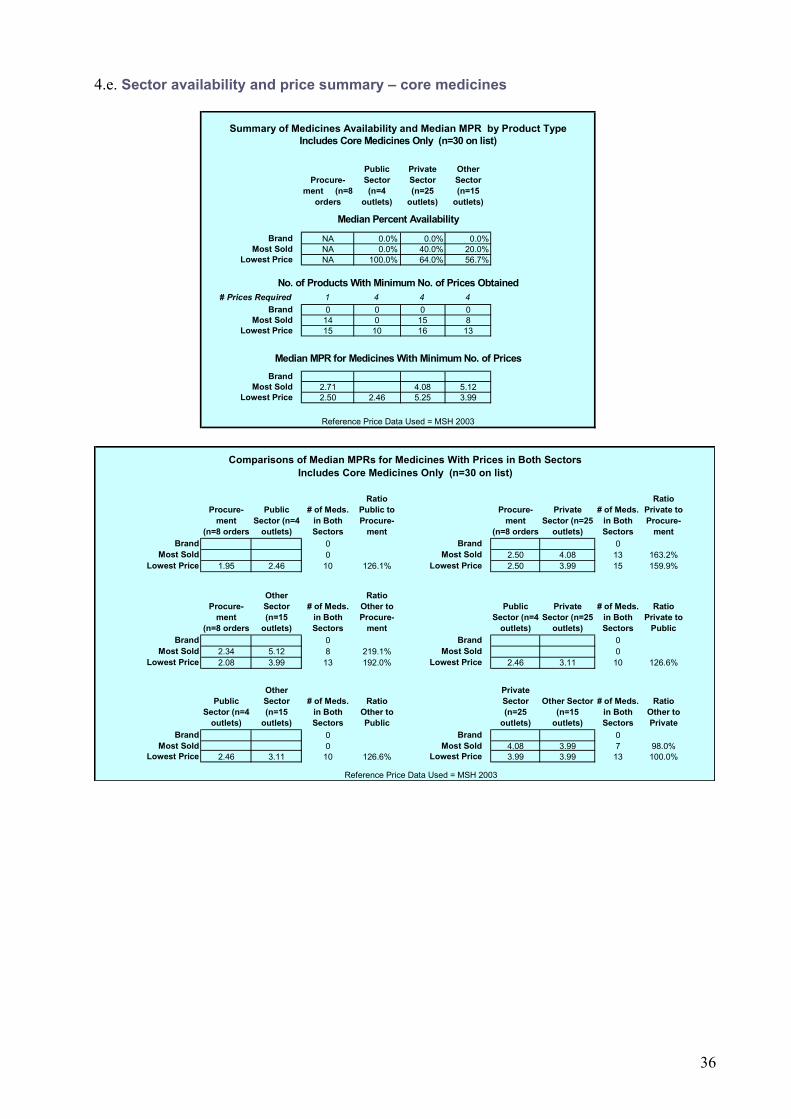
4.e. Sector availability and price summary – core medicines
Procure-ment (n=8
orders
Public Sector (n=4
outlets)
Private Sector (n=25
outlets)
Other Sector (n=15
outlets)
Brand NA 0.0% 0.0% 0.0%Most Sold NA 0.0% 40.0% 20.0%
Lowest Price NA 100.0% 64.0% 56.7%
# Prices Required 1 4 4 4Brand 0 0 0 0
Most Sold 14 0 15 8Lowest Price 15 10 16 13
BrandMost Sold 2.71 4.08 5.12
Lowest Price 2.50 2.46 5.25 3.99
Procure-ment
(n=8 orders
Public Sector (n=4
outlets)
# of Meds. in Both Sectors
Ratio Public to Procure-
ment
Procure-ment
(n=8 orders
Private Sector (n=25
outlets)
# of Meds. in Both Sectors
Ratio Private to Procure-
mentBrand 0 Brand 0
Most Sold 0 Most Sold 2.50 4.08 13 163.2%Lowest Price 1.95 2.46 10 126.1% Lowest Price 2.50 3.99 15 159.9%
Procure-ment
(n=8 orders
Other Sector (n=15
outlets)
# of Meds. in Both Sectors
Ratio Other to Procure-
ment
Public Sector (n=4
outlets)
Private Sector (n=25
outlets)
# of Meds. in Both Sectors
Ratio Private to
PublicBrand 0 Brand 0
Most Sold 2.34 5.12 8 219.1% Most Sold 0Lowest Price 2.08 3.99 13 192.0% Lowest Price 2.46 3.11 10 126.6%
Public Sector (n=4
outlets)
Other Sector (n=15
outlets)
# of Meds. in Both Sectors
Ratio Other to Public
Private Sector (n=25
outlets)
Other Sector (n=15
outlets)
# of Meds. in Both Sectors
Ratio Other to Private
Brand 0 Brand 0Most Sold 0 Most Sold 4.08 3.99 7 98.0%
Lowest Price 2.46 3.11 10 126.6% Lowest Price 3.99 3.99 13 100.0%
Median MPR for Medicines With Minimum No. of Prices
Comparisons of Median MPRs for Medicines With Prices in Both Sectors
Reference Price Data Used = MSH 2003
Summary of Medicines Availability and Median MPR by Product TypeIncludes Core Medicines Only (n=30 on list)
Includes Core Medicines Only (n=30 on list)
Reference Price Data Used = MSH 2003
Median Percent Availability
No. of Products With Minimum No. of Prices Obtained
36

4.f. Medicines availability and price summary
Medicine NameCore List (yes/no)
Public (n=4)
Private (n=25)
Other (n=15)
Public (n=4)
Private (n=25)
Other (n=15)
Public (n=4)
Private (n=25)
Other (n=15)
Aciclovir yes 0.0% 0.0% 0.0% 50.0% 32.0% 6.7% 100.0% 68.0% 46.7%Amitriptyline yes 0.0% 0.0% 0.0% 50.0% 24.0% 6.7% 100.0% 36.0% 53.3%Amoxicillin 250 yes 0.0% 0.0% 0.0% 0.0% 68.0% 40.0% 100.0% 100.0% 93.3%Ampicillin no 0.0% 0.0% 0.0% 0.0% 40.0% 26.7% 50.0% 80.0% 40.0%Atenolol yes 0.0% 0.0% 0.0% 0.0% 40.0% 20.0% 100.0% 80.0% 73.3%Beclometasone inhaler yes 0.0% 0.0% 0.0% 0.0% 0.0% 0.0% 0.0% 4.0% 13.3%Captopril yes 0.0% 0.0% 0.0% 25.0% 76.0% 33.3% 100.0% 100.0% 93.3%Carbamazepine yes 0.0% 0.0% 0.0% 0.0% 48.0% 20.0% 100.0% 80.0% 86.7%Ceftriaxone injection 250mg no 0.0% 16.0% 0.0% 0.0% 0.0% 0.0% 0.0% 4.0% 0.0%Cephalexin 250 no 0.0% 0.0% 0.0% 100.0% 12.0% 13.3% 100.0% 12.0% 13.3%Chloramphenicol no 0.0% 0.0% 0.0% 25.0% 76.0% 66.7% 75.0% 100.0% 100.0%Ciprofloxacin yes 0.0% 0.0% 0.0% 50.0% 68.0% 26.7% 75.0% 80.0% 40.0%Clotrimazole pessary no 0.0% 0.0% 0.0% 100.0% 84.0% 86.7% 100.0% 100.0% 100.0%Co-trimoxazole suspension yes 0.0% 0.0% 0.0% 0.0% 32.0% 0.0% 0.0% 32.0% 0.0%Diazepam yes 0.0% 0.0% 0.0% 50.0% 8.0% 33.3% 75.0% 20.0% 80.0%Diclofenac 25 yes 0.0% 0.0% 0.0% 25.0% 36.0% 33.3% 100.0% 72.0% 73.3%Erythromycin 250 no 0.0% 0.0% 0.0% 25.0% 48.0% 26.7% 100.0% 96.0% 93.3%Fluconazole 150 no 0.0% 0.0% 0.0% 0.0% 24.0% 0.0% 0.0% 24.0% 0.0%Fluphenazine injection yes 0.0% 0.0% 0.0% 0.0% 0.0% 0.0% 0.0% 0.0% 0.0%Furosemide no 0.0% 0.0% 0.0% 0.0% 96.0% 73.3% 100.0% 100.0% 100.0%Gentamicin injection no 0.0% 0.0% 0.0% 25.0% 64.0% 53.3% 100.0% 96.0% 86.7%Glibenclamide yes 0.0% 0.0% 0.0% 50.0% 44.0% 0.0% 75.0% 44.0% 0.0%Hydrochlorothiazide yes 0.0% 0.0% 0.0% 0.0% 52.0% 33.3% 75.0% 52.0% 60.0%Ibuprofen no 0.0% 0.0% 0.0% 25.0% 68.0% 26.7% 50.0% 84.0% 60.0%Indomethacin no 0.0% 0.0% 0.0% 50.0% 80.0% 73.3% 100.0% 100.0% 93.3%Mebendazole no 0.0% 0.0% 0.0% 0.0% 32.0% 6.7% 100.0% 92.0% 93.3%Metformin yes 0.0% 0.0% 0.0% 25.0% 20.0% 6.7% 50.0% 20.0% 6.7%Metronidazole 250 no 0.0% 0.0% 0.0% 0.0% 60.0% 46.7% 100.0% 100.0% 100.0%Omeprazole yes 0.0% 0.0% 0.0% 0.0% 52.0% 26.7% 100.0% 80.0% 80.0%Propranolol no 0.0% 0.0% 0.0% 50.0% 88.0% 66.7% 100.0% 96.0% 93.3%Ranitidine yes 0.0% 0.0% 0.0% 0.0% 48.0% 40.0% 100.0% 88.0% 86.7%Reserpine no 0.0% 0.0% 0.0% 75.0% 24.0% 46.7% 75.0% 24.0% 46.7%Salbutamol inhaler yes 0.0% 4.0% 0.0% 0.0% 40.0% 20.0% 100.0% 60.0% 46.7%
Brand Lowest PriceMost Sold
Medicines Availability in Outlets
37

Medicine NameCore List (yes/no)
Procurement (n=8)
Public (n=4)
Private (n=25)
Other (n=15)
Procurement (n=8)
Public (n=4)
Private (n=25)
Other (n=15)
Procurement (n=8)
Public (n=4)
Private (n=25)
Other (n=15)
Aciclovir yes 1.92 1.30 1.38 2.35 1.50Amitriptyline yes 5.24 8.18 5.24 5.52 7.63 5.81Amoxicillin 250 yes 2.03 2.89 2.41 1.95 2.60 2.89 2.89Ampicillin no 1.45 1.93 1.83 1.26 1.93 1.93Atenolol yes 3.07 8.17 4.29 3.93 7.57 7.13Beclometasone inhaler yesCaptopril yes 1.41 2.82 1.63 1.58 2.89 2.82 2.35Carbamazepine yes 2.29 3.54 1.94 1.92 3.33 3.33Ceftriaxone injection 250mg no 6.40 5.08Cephalexin 250 no 0.79 0.79Chloramphenicol no 0.65 1.02 1.02 0.61 1.02 1.02Ciprofloxacin yes 2.50 6.51 6.25 2.50 6.51 6.51Clotrimazole pessary no 3.82 4.17 4.17 2.50 3.82 4.17 4.17Co-trimoxazole suspension yes 8.63 8.63Diazepam yes 8.88 9.47 8.58 11.84 9.47Diclofenac 25 yes 8.93 13.00 16.25 8.93 10.56 11.78 13.00Erythromycin 250 no 2.12 2.67 2.31 1.90 2.03 2.54 2.44Fluconazole 150 no 120.13 120.13Fluphenazine injection yesFurosemide no 1.73 2.59 2.76 1.73 2.07 2.59 2.76Gentamicin injection no 1.23 2.30 2.15 1.44 1.97 2.49 2.24Glibenclamide yes 5.05 7.58 5.15 7.58Hydrochlorothiazide yes 24.14 30.77 23.67 24.14 30.77 18.94Ibuprofen no 4.39 7.80 7.80 4.56 7.80 7.80Indomethacin no 3.33 4.76 4.76 3.33 4.98 4.76 4.76Mebendazole no 33.68 40.41 55.06 26.94 40.41Metformin yes 2.93 3.72 2.93 3.72Metronidazole 250 no 3.69 6.72 6.72 3.69 5.13 6.72 6.27Omeprazole yes 0.59 0.99 0.95 0.64 0.85 0.99 0.75Propranolol no 3.90 7.31 8.12 3.57 4.47 6.50 7.72Ranitidine yes 2.18 4.08 3.99 2.08 2.31 3.99 3.99Reserpine no 0.59 0.75 0.79 0.59 0.75 0.79Salbutamol inhaler yes 1.08 1.28 1.08 1.13 1.20 0.94
Most Sold
Medicines Median Price Ratios (MPRs) in Procurements and Outlets
Brand Lowest Price(Reference Price Data Used = MSH 2003)
38
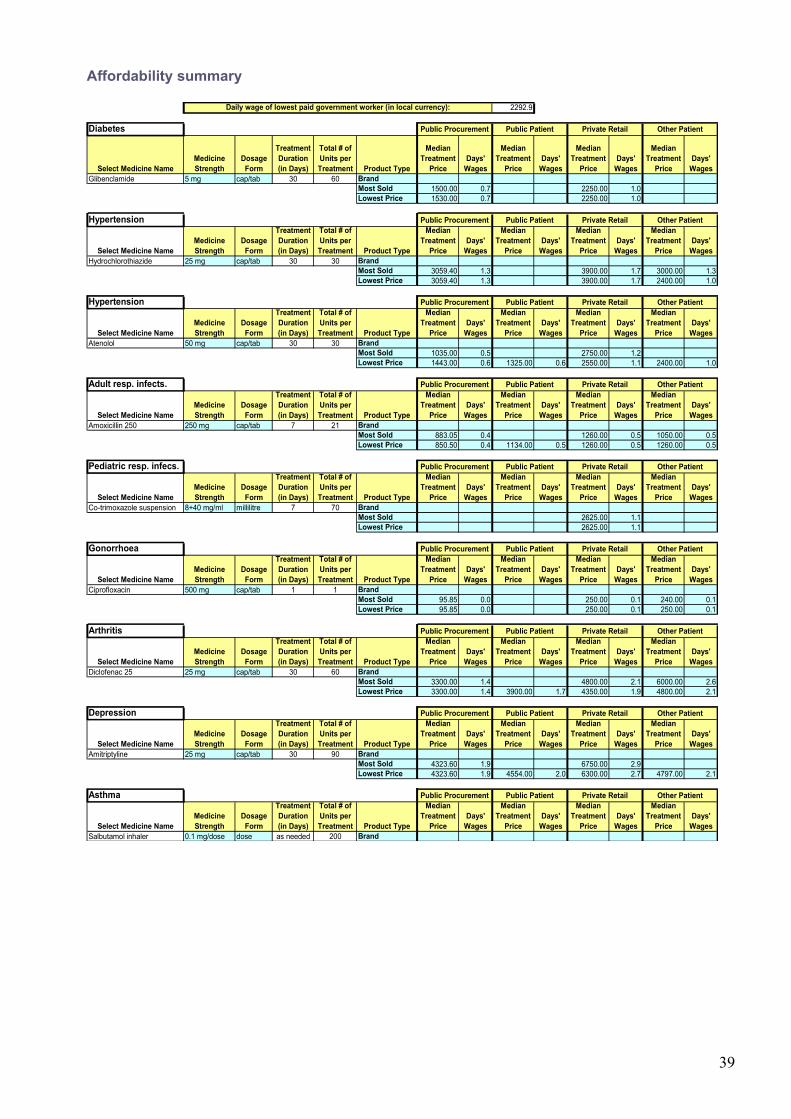
Affordability summary
2292.9
Diabetes
Select Medicine NameMedicine Strength
Dosage Form
Treatment Duration (in Days)
Total # of Units per Treatment Product Type
Median Treatment
PriceDays'
Wages
Median Treatment
PriceDays'
Wages
Median Treatment
PriceDays'
Wages
Median Treatment
PriceDays'
WagesGlibenclamide 5 mg cap/tab 30 60 Brand
Most Sold 1500.00 0.7 2250.00 1.0Lowest Price 1530.00 0.7 2250.00 1.0
Hypertension
Select Medicine NameMedicine Strength
Dosage Form
Treatment Duration (in Days)
Total # of Units per Treatment Product Type
Median Treatment
PriceDays'
Wages
Median Treatment
PriceDays'
Wages
Median Treatment
PriceDays'
Wages
Median Treatment
PriceDays'
WagesHydrochlorothiazide 25 mg cap/tab 30 30 Brand
Most Sold 3059.40 1.3 3900.00 1.7 3000.00 1.3Lowest Price 3059.40 1.3 3900.00 1.7 2400.00 1.0
Hypertension
Select Medicine NameMedicine Strength
Dosage Form
Treatment Duration (in Days)
Total # of Units per Treatment Product Type
Median Treatment
PriceDays'
Wages
Median Treatment
PriceDays'
Wages
Median Treatment
PriceDays'
Wages
Median Treatment
PriceDays'
WagesAtenolol 50 mg cap/tab 30 30 Brand
Most Sold 1035.00 0.5 2750.00 1.2Lowest Price 1443.00 0.6 1325.00 0.6 2550.00 1.1 2400.00 1.0
Adult resp. infects.
Select Medicine NameMedicine Strength
Dosage Form
Treatment Duration (in Days)
Total # of Units per Treatment Product Type
Median Treatment
PriceDays'
Wages
Median Treatment
PriceDays'
Wages
Median Treatment
PriceDays'
Wages
Median Treatment
PriceDays'
WagesAmoxicillin 250 250 mg cap/tab 7 21 Brand
Most Sold 883.05 0.4 1260.00 0.5 1050.00 0.5Lowest Price 850.50 0.4 1134.00 0.5 1260.00 0.5 1260.00 0.5
Pediatric resp. infecs.
Select Medicine NameMedicine Strength
Dosage Form
Treatment Duration (in Days)
Total # of Units per Treatment Product Type
Median Treatment
PriceDays'
Wages
Median Treatment
PriceDays'
Wages
Median Treatment
PriceDays'
Wages
Median Treatment
PriceDays'
WagesCo-trimoxazole suspension 8+40 mg/ml millilitre 7 70 Brand
Most Sold 2625.00 1.1Lowest Price 2625.00 1.1
Gonorrhoea
Select Medicine NameMedicine Strength
Dosage Form
Treatment Duration (in Days)
Total # of Units per Treatment Product Type
Median Treatment
PriceDays'
Wages
Median Treatment
PriceDays'
Wages
Median Treatment
PriceDays'
Wages
Median Treatment
PriceDays'
WagesCiprofloxacin 500 mg cap/tab 1 1 Brand
Most Sold 95.85 0.0 250.00 0.1 240.00 0.1Lowest Price 95.85 0.0 250.00 0.1 250.00 0.1
Arthritis
Select Medicine NameMedicine Strength
Dosage Form
Treatment Duration (in Days)
Total # of Units per Treatment Product Type
Median Treatment
PriceDays'
Wages
Median Treatment
PriceDays'
Wages
Median Treatment
PriceDays'
Wages
Median Treatment
PriceDays'
WagesDiclofenac 25 25 mg cap/tab 30 60 Brand
Most Sold 3300.00 1.4 4800.00 2.1 6000.00 2.6Lowest Price 3300.00 1.4 3900.00 1.7 4350.00 1.9 4800.00 2.1
Depression
Select Medicine NameMedicine Strength
Dosage Form
Treatment Duration (in Days)
Total # of Units per Treatment Product Type
Median Treatment
PriceDays'
Wages
Median Treatment
PriceDays'
Wages
Median Treatment
PriceDays'
Wages
Median Treatment
PriceDays'
WagesAmitriptyline 25 mg cap/tab 30 90 Brand
Most Sold 4323.60 1.9 6750.00 2.9Lowest Price 4323.60 1.9 4554.00 2.0 6300.00 2.7 4797.00 2.1
Asthma
Select Medicine NameMedicine Strength
Dosage Form
Treatment Duration (in Days)
Total # of Units per Treatment Product Type
Median Treatment
PriceDays'
Wages
Median Treatment
PriceDays'
Wages
Median Treatment
PriceDays'
Wages
Median Treatment
PriceDays'
WagesSalbutamol inhaler 0.1 mg/dose dose as needed 200 Brand
Private Retail Other Patient
Public Procurement
Daily wage of lowest paid government worker (in local currency):
Public Procurement
Public Procurement
Public Procurement
Other PatientPublic Patient Private Retail
Public Patient Private Retail Other Patient
Public Patient
Public Procurement Public Patient Private Retail Other Patient
Public Patient Private Retail Other Patient
Public Procurement Public Patient Private Retail Other Patient
Public Procurement Public Patient Private Retail Other Patient
Public Procurement Public Patient Private Retail Other Patient
Public Procurement Public Patient Private Retail Other Patient
39
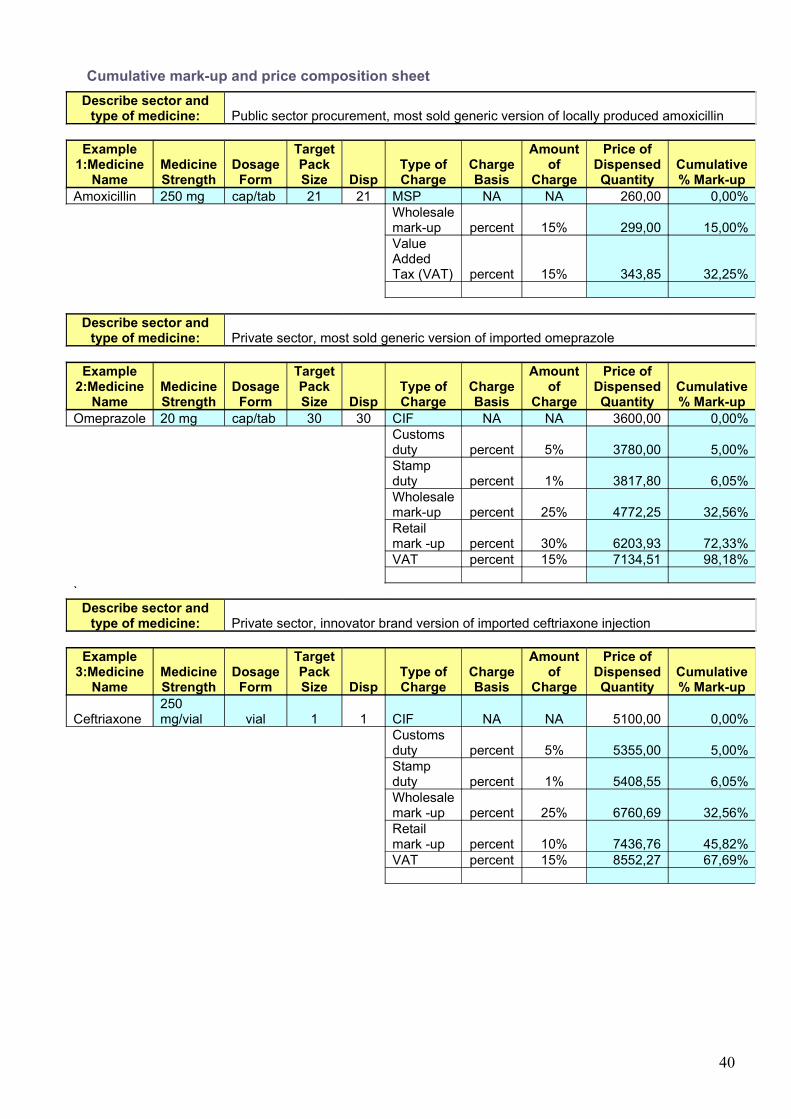
Cumulative mark-up and price composition sheetDescribe sector and
type of medicine: Public sector procurement, most sold generic version of locally produced amoxicillin
Example 1:Medicine
NameMedicine Strength
Dosage Form
Target Pack Size Disp
Type of Charge
Charge Basis
Amount of
Charge
Price of Dispensed Quantity
Cumulative % Mark-up
Amoxicillin 250 mg cap/tab 21 21 MSP NA NA 260,00 0,00%Wholesale mark-up percent 15% 299,00 15,00%Value Added Tax (VAT) percent 15% 343,85 32,25%
Describe sector and type of medicine: Private sector, most sold generic version of imported omeprazole
Example 2:Medicine
NameMedicine Strength
Dosage Form
Target Pack Size Disp
Type of Charge
Charge Basis
Amount of
Charge
Price of Dispensed Quantity
Cumulative % Mark-up
Omeprazole 20 mg cap/tab 30 30 CIF NA NA 3600,00 0,00%Customs duty percent 5% 3780,00 5,00%Stamp duty percent 1% 3817,80 6,05%Wholesale mark-up percent 25% 4772,25 32,56%Retail mark -up percent 30% 6203,93 72,33%VAT percent 15% 7134,51 98,18%
`Describe sector and
type of medicine: Private sector, innovator brand version of imported ceftriaxone injection
Example 3:Medicine
NameMedicine Strength
Dosage Form
Target Pack Size Disp
Type of Charge
Charge Basis
Amount of
Charge
Price of Dispensed Quantity
Cumulative % Mark-up
Ceftriaxone 250 mg/vial vial 1 1 CIF NA NA 5100,00 0,00%
Customs duty percent 5% 5355,00 5,00%Stamp duty percent 1% 5408,55 6,05%Wholesale mark -up percent 25% 6760,69 32,56%Retail mark -up percent 10% 7436,76 45,82%VAT percent 15% 8552,27 67,69%
40

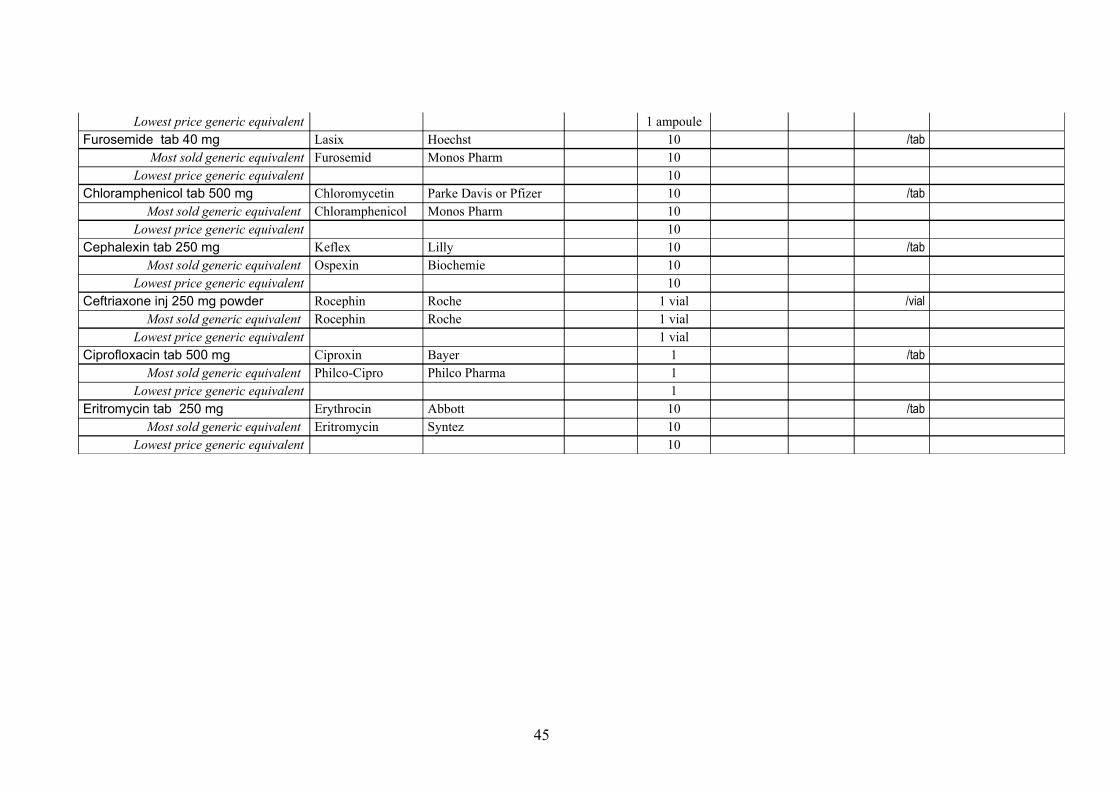
Annex 5: Medicines data collection form used for survey
Medicine Price Data Collection formUse one form for each health facility and pharmacyDate: Area number:
Name of town/village/district:
Name of health facility/pharmacy (optional):
Health facility/pharmacy ID (mandatory):
Distance in km from nearest town (population >50 000):
Type of health facility:
Public Private retail pharmacy Other (please specify):
Type of price in public and private not-for-profit sector:
Procurement price Price the patient pays
Name of manager of the facility:
Name of person(s) who provided information on medicine prices and availability (if different):
Data collectors:
VerificationTo be completed by the area supervisor at the end of the day
Signed:
Date:
41

MEDICINE PRICE DATA COLLECTION FORM
Most sold: determined nationally Lowest price: determined at facility
A B C D E F G H IGeneric name, dosage form, strength Brand name(s) Manufacturer Available
tick for yes
Pack size recom-mended
Pack size found
Price of pack found
Unit price (4 digits)
Comments
Aciclovir tab 200 mg Zovirax GSK 25 /òàáMost sold generic equivalent Acilovira Ferein 25
Lowest price generic equivalent 25Amitriptyline tab 25 mg Tryptizol MSD 100 /tab
Most sold generic equivalent Amitriptylino 25 Enddokrininiai 100Lowest price generic equivalent 100
Amoxicillin caps/tab 250 mg Amoxil SKB (GSK) 21 /tabMost sold generic equivalent Philco amoxy Phylco Pharma 21
Lowest price generic equivalent 21Ampicillin tab 500 mg Pentrexyl BMS 10 /tab
Most sold generic equivalent Philcoampi Philco Pharma 10Lowest price generic equivalent 10
Atenolol tab 50 mg Tenormin AstraZeneca 60 /tabMost sold generic equivalent Atenolol Akri Akrikhin 60
Lowest price generic equivalent 60Beclometasone inhaler 50 mcg/ dose Becotide GSK 1 inhaler:
200 doses/dose
Most sold generic equivalent Becotide GSK 1 inhaler: 200 doses
Lowest price generic equivalent 1 inhaler: 200 doses
Gentamycin inj. 40 mg/ml Garamycin Schering corp 2 ml /mlMost sold generic equivalent Philco genta80 Philco Pharma 2ml
Lowest price generic equivalent 2mlHydrochlorothiazide tab 25 mg Dichlotride MSD 20 /tab
Most sold generic equivalent Hypothiazid Sanofi-Synthelabo 20Lowest price generic equivalent 20
42

Glibenclamide tab 5 mg Daonil HMR 60 /tabMost sold generic equivalent Mannil -5 Berlinkhemie 60
Lowest price generic equivalent 60Diazepam tab 5 mg Valium Roche 100 /tab
Most sold generic equivalent Diazepam Laboratorio Farmacologico Milanes25
100
Lowest price generic equivalent 100Diclofenac tab 25 mg Voltaren Novartis 28 /tab
Most sold generic equivalent Diclodenk Denkpharm 28Lowest price generic equivalent 28
Ibuprofen tab 400 mg Brufen Knoll 20 /tabMost sold generic equivalent Lemprofen 400 Hans E Lembcke 20
Lowest price generic equivalent 20Indometacin tab 25 mg Indocid MSD 10 /tab
Most sold generic equivalent Indomon Monos Pharm 10Lowest price generic equivalent 10
Captopril tab 25 mg Capoten BMS 60 /tabMost sold generic equivalent Lemcapril 25 Hans E Lembcke 60
Lowest price generic equivalent 60Carbamazepine tab 200 mg Tegretol Novartis 100 /tab
Most sold generic equivalent Convulem-200 Hans E Lembcke 100Lowest price generic equivalent
Clotrimazol supp.(vag) 100 mg Canesten Bayer 21 /tabMost sold generic equivalent Lemnesten 100 Hans E Lembcke 21
Lowest price generic equivalent 21Co-trimoxazole paed suspension (8+40) mg/ml
Bactrim Roche 100 ml /ml
Most sold generic equivalent Letrim-2880 Hans E Lembcke 100 mlLowest price generic equivalent 100 ml
Mebendazol tab 100 mg Vermox Janssen 6 /tabMost sold generic equivalent Mebendazol Hans E Lembcke 6
Lowest price generic equivalent 6Metronidazole tab 250 mg Flagyl Phone Poulenc 20 /tab
43

Most sold generic equivalent Philco-Metro 250 Philco Pharma 20Lowest price generic equivalent 20
Metformin tab 500 mg Glucophage Merck 100 /tabMost sold generic equivalent Metformin Denk
500Denk pharma 100
Lowest price generic equivalent 100Nifedipine Retard tab 10 mg Adalat Retard Bayer 10 /tab
Most sold generic equivalent Nifedipine Denk 10 retard
Denk pharma 10
Lowest price generic equivalent 10Omeprazole caps 20 mg Losec AstraZeneca 30 /caps
Most sold generic equivalent Lemloc-20 Hans E Lembcke 30Lowest price generic equivalent 30
Propranolol tab 40 mg Inderal Astra Zeneca 20 /tabMost sold generic equivalent Propranolol Balkanpharma 20
Lowest price generic equivalent 20Ranitidine tab 150 mg Zantac GSK 60 /tab
Most sold generic equivalent Kalamtac Hans E Lembcke 60Lowest price generic equivalent 60
Reserpine tab 250 mcg Serpasil Biochemie (former Ciba)
100 /tab
Most sold generic equivalent Reserpine Oterop 100Lowest price generic equivalent 100
Salbutamol inhaler 0.1 mg per dose Ventoline GSK 1 inhaler: 200 doses
/dose
Most sold generic equivalent Salbutamol Moskhimpharm prepatai 1 inhaler: 200 doses
Lowest price generic equivalent 1 inhaler: 200 doses
Fluconazole caps/tab 150 mg Diflucan Pfizer 30 /tabMost sold generic equivalent Diflazon KRKA 30
Lowest price generic equivalent 30Fluphenazine decanoate inj 25 mg/ml Modecate Sanofi-Winthrop/ BMS 1 ampoule /ml
Most sold generic equivalent Fluphenazine decanoate
Rotex Medica 1 ampoule
44
Lowest price generic equivalent 1 ampouleFurosemide tab 40 mg Lasix Hoechst 10 /tab
Most sold generic equivalent Furosemid Monos Pharm 10Lowest price generic equivalent 10
Chloramphenicol tab 500 mg Chloromycetin Parke Davis or Pfizer 10 /tabMost sold generic equivalent Chloramphenicol Monos Pharm 10
Lowest price generic equivalent 10Cephalexin tab 250 mg Keflex Lilly 10 /tab
Most sold generic equivalent Ospexin Biochemie 10Lowest price generic equivalent 10
Ceftriaxone inj 250 mg powder Rocephin Roche 1 vial /vialMost sold generic equivalent Rocephin Roche 1 vial
Lowest price generic equivalent 1 vialCiprofloxacin tab 500 mg Ciproxin Bayer 1 /tab
Most sold generic equivalent Philco-Cipro Philco Pharma 1Lowest price generic equivalent 1
Eritromycin tab 250 mg Erythrocin Abbott 10 /tabMost sold generic equivalent Eritromycin Syntez 10
Lowest price generic equivalent 10
45
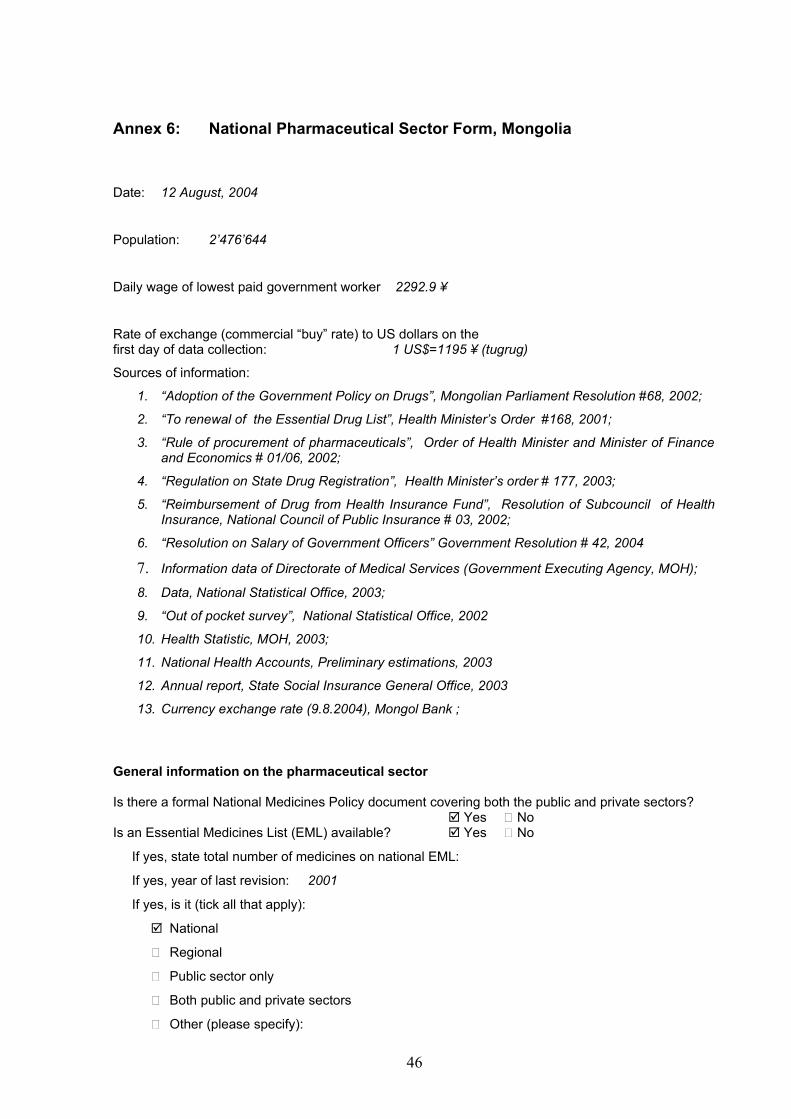
Annex 6: National Pharmaceutical Sector Form, Mongolia
Date: 12 August, 2004
Population: 2’476’644
Daily wage of lowest paid government worker 2292.9 ¥
Rate of exchange (commercial “buy” rate) to US dollars on the first day of data collection: 1 US$=1195 ¥ (tugrug)
Sources of information:
1. “Adoption of the Government Policy on Drugs”, Mongolian Parliament Resolution #68, 2002;
2. “To renewal of the Essential Drug List”, Health Minister’s Order #168, 2001;
3. “Rule of procurement of pharmaceuticals”, Order of Health Minister and Minister of Finance and Economics # 01/06, 2002;
4. “Regulation on State Drug Registration”, Health Minister’s order # 177, 2003;
5. “Reimbursement of Drug from Health Insurance Fund”, Resolution of Subcouncil of Health Insurance, National Council of Public Insurance # 03, 2002;
6. “Resolution on Salary of Government Officers” Government Resolution # 42, 2004
7. Information data of Directorate of Medical Services (Government Executing Agency, MOH);
8. Data, National Statistical Office, 2003;
9. “Out of pocket survey”, National Statistical Office, 2002
10. Health Statistic, MOH, 2003;
11. National Health Accounts, Preliminary estimations, 2003
12. Annual report, State Social Insurance General Office, 2003
13. Currency exchange rate (9.8.2004), Mongol Bank ;
General information on the pharmaceutical sector
Is there a formal National Medicines Policy document covering both the public and private sectors? Yes No
Is an Essential Medicines List (EML) available? Yes No
If yes, state total number of medicines on national EML:
If yes, year of last revision: 2001
If yes, is it (tick all that apply):
National
Regional
Public sector only
Both public and private sectors
Other (please specify):
46
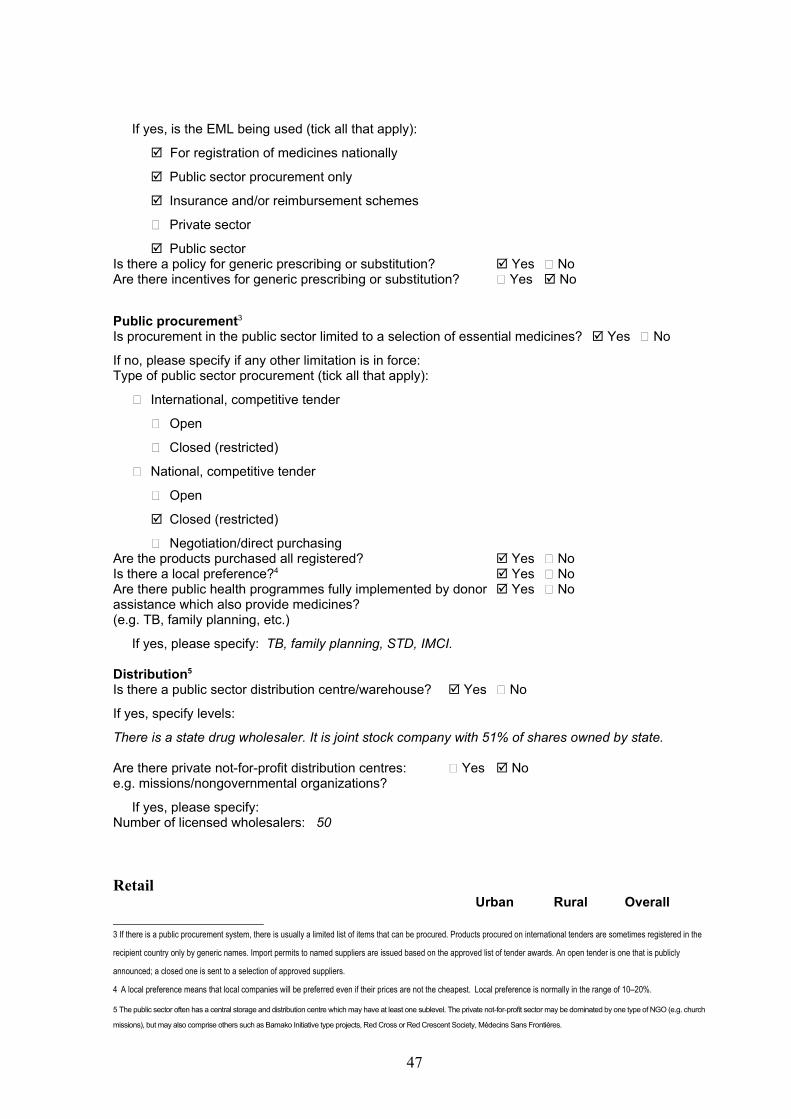
If yes, is the EML being used (tick all that apply):
For registration of medicines nationally
Public sector procurement only
Insurance and/or reimbursement schemes
Private sector
Public sectorIs there a policy for generic prescribing or substitution? Yes NoAre there incentives for generic prescribing or substitution? Yes No
Public procurement3
Is procurement in the public sector limited to a selection of essential medicines? Yes No
If no, please specify if any other limitation is in force:Type of public sector procurement (tick all that apply):
International, competitive tender
Open
Closed (restricted)
National, competitive tender
Open
Closed (restricted)
Negotiation/direct purchasingAre the products purchased all registered? Yes NoIs there a local preference?4 Yes NoAre there public health programmes fully implemented by donor Yes Noassistance which also provide medicines?(e.g. TB, family planning, etc.)
If yes, please specify: TB, family planning, STD, IMCI.
Distribution5
Is there a public sector distribution centre/warehouse? Yes No
If yes, specify levels:
There is a state drug wholesaler. It is joint stock company with 51% of shares owned by state.
Are there private not-for-profit distribution centres: Yes Noe.g. missions/nongovernmental organizations?
If yes, please specify:Number of licensed wholesalers: 50
RetailUrban Rural Overall
3 If there is a public procurement system, there is usually a limited list of items that can be procured. Products procured on international tenders are sometimes registered in the
recipient country only by generic names. Import permits to named suppliers are issued based on the approved list of tender awards. An open tender is one that is publicly
announced; a closed one is sent to a selection of approved suppliers.
4 A local preference means that local companies will be preferred even if their prices are not the cheapest. Local preference is normally in the range of 10–20%.
5 The public sector often has a central storage and distribution centre which may have at least one sublevel. The private not-for-profit sector may be dominated by one type of NGO (e.g. church
missions), but may also comprise others such as Bamako Initiative type projects, Red Cross or Red Crescent Society, Médecins Sans Frontières.
47

Number of inhabitants per pharmacy (approx.) 4776.8 2472.2 3420.8
Number of inhabitants per qualified pharmacist (approx.) 2690.9 42125.7 4470.5
Number of pharmacies with qualified pharmacists 403 25 428
Number of medicine outlets with pharmacy technician 293 431 724
Number of other licensed medicine outlets - - -
Private sector6
Are there independent pharmacies? Yes No Number: no dataAre there chain pharmacies? Yes No Number: no dataDo doctors dispense medicines?7 Yes No
If yes, approximate coverage or % of doctors who dispense:Are there pharmacies or medicine outlets in health facilities? Yes No
Financing(Give approximate figures, converted to US dollars at current exchange rate: commercial “buy” rate on the first day of data collection)
Type of expenditure Approximate annual budget(US dollars)
National public expenditure on medicines including government insurance, military, local purchases in past
year
8,445.29 million
Estimated total private medicine expenditure in past year (out of pocket, private insurance, NGO/mission) 8,648.53 million
Total value of international medicine aid or donations in past year 920 thousand
What percentage of medicines by value are imported? 0.97 %
Government price policyIs there a medicines regulatory authority? Yes NoIs pricing regulated? Yes NoIs setting prices part of market authorization/registration? Yes No Do registration fees differ between:
Innovator brand and generic equivalents Yes No
Imported and locally produced medicines Yes No
Public sectorAre there margins (mark-ups) in the distribution chain? Yes No
Central medical stores 10 %
Regional store 15 %
Other store (specify) 0 %
Public medicine outlet 10 %Are there any other fees or levies? Yes No
If yes, please describe:
6 Retail outlets may be called pharmacies, medicine outlets, drug stores, chemists, etc. They may be run/owned by a qualified pharmacist (with diploma) or
another category: e.g. pharmacy technician, or a lay person with short training.
7 Many countries allow doctors to dispense and sell medicines.
48

Private retail sectorAre there maximum profit margins? Yes No If yes (if they vary, give maximum and minimum):
Wholesale %
Retail %
Is there a maximum retail price (sales price)? Yes No(If it varies, give maximum and minimum)
Maximum:
Minimum:Do patients pay professional fees (e.g. dispensing fee)? Yes No
If yes, please describe:
“Other” sectorAre there maximum profit margins? Yes No
If yes (if they vary, give maximum and minimum):
Wholesale %
Retail %Is there a maximum sales price? Yes No
Insurance, risk-sharing or prepayment schemesAre there any health insurance, risk-sharing or Yes Noprepayment schemes or revolving medicine funds?
If yes, please describe: Social Health Insurance Skim-Compulsory for all.
Are all medicines covered? Yes No
If no, state which medicines are covered (e.g. EML, public health programmes):
Health insurance covers 105 items of essential medicines.
Are some patients / groups of patients exempted, regardless of insurance coverage? (e.g. children < X yrs, war veterans) Yes No
If yes, please specify:
Estimated percentage of population covered 76.6 % (by the end of 2003)
Is it official policy to supply all medicines free at primary health care level? Yes No
If no, are some free? Yes No
If yes, tick all that apply:
Tuberculosis
Malaria
Oral rehydration salts
Family planning
Others, please specify:
Are there official user charges/patient co-payments/fees? Yes No
Are all medicines supplied free at hospitals? Yes No
49

If no, are some free? Yes No
If yes, please specify: Inpatient cases and some outpatients.
RetailUrban Rural Overall
Number of inhabitants per pharmacy (approx.) 1423501/298=4776
.8
1053143/426=2472
.2
2476644/724=3420
.8
Number of inhabitants per qualified pharmacist (approx.) 1423501/529=2690
.9
1053143/25=42125
.7
2476644/554=4470
.5
Number of pharmacies with qualified pharmacists 403 25 428
Number of medicine outlets with pharmacy technician 688 243 931
Number of other licensed medicine outlets no no no
50