medicaid in rural missouri april 7, 2006 amy lake community policy analysis center university of...
TRANSCRIPT

Medicaid in Rural MissouriApril 7, 2006
Amy LakeCommunity Policy Analysis Center
University of Missouri-Columbia230 Middlebush HallColumbia MO 65202
[email protected] or 573-882-5412http://www.cpac.missouri.edu/

2©2005 Medicaid Work Group, University of Missouri--Columbia
Missouri Medicaid Chartbook
Missouri Medicaid Chart Book
The Missouri Medicaid Program:The Missouri Medicaid Program: A Graphical Profile A Graphical Profile
Medicaid Work Group, University of Missouri--Columbia
August 2005
http://oseda.missouri.edu/medicaid/

3©2005 Medicaid Work Group, University of Missouri--Columbia
Missouri Medicaid ChartbookTotal Medicaid Enrollment, FY2001
More than a million people were enrolled in Missouri Medicaid in 2001
NATIONAL MAPS

4©2005 Medicaid Work Group, University of Missouri--Columbia
Missouri Medicaid ChartbookPercent of the Population Enrolled in Medicaid, 2001
Almost one-fifth of Missourians were enrolled in Medicaid in 2001
NATIONAL MAPS

Federal and State Medicaid Expenditures 2004
• $5.7 billion = Total Medicaid Expenditures in Missouri (SFY 2004)
• $3.7 billion in Federal Funds
• $2.0 billion in Missouri funds (GR and other)
Source: Kaiser Foundation

6©2005 Medicaid Work Group, University of Missouri--Columbia
Missouri Medicaid ChartbookMissouri Medicaid Expenditures by Enrollment Group, FY2005
Source: MoDSS Summary Table 5, FY2005.
Children accounted for 55% of enrollees, but only 20% of expenditures
MISSOURI CHARTS
Total Enrollees992,622
Total Expenditures$5,557,804,149
Note: Other includes Medicaid Assistance to Pregnant Women and the Breast or Cervical Cancer Program.

7©2005 Medicaid Work Group, University of Missouri--Columbia
Missouri Medicaid Chartbook
Source: MoDSS Summary Table 5, FY2005.
Missouri Medicaid Expenditures by Type of Service, FY2005
Pharmacy is the largest category of costs to Missouri Medicaid
Note: All other includes rehabilitation & specialty care, EPSDT, buy-in premiums, and dental services.
(in billions of $)
MISSOURI CHARTS

9©2005 Medicaid Work Group, University of Missouri--Columbia
Missouri Medicaid ChartbookPercentage of Missouri Population in Poverty, 2002
Poverty is concentrated in the southeast, south central, northeast regions of the state and in St. Louis City
MISSOURI MAPS

Source: Dept of Health and Senior Services, Missouri Information for Community Assessment (MICA), USDC Bureau of the Census, Federal Office of Rural Health Policy
0.0%
10.0%
20.0%
30.0%
40.0%
50.0%
Metro and Non Metro Missouri Counties Medicaid Enrollees as Percentage of Total Population January 2006
06 Non Metro County 40.6% 12.7% 16.0% 13.5% 20.9%
06 Metro County 30.2% 8.6% 11.4% 9.1% 15.2%
Under 20
20-6465 and older
20 and older
All ages

Source: Dept of Health and Senior Services, Missouri Information for Community Assessment (MICA), USDC Bureau of the Census, Federal Office of Rural Health Policy
28%-40% of the populations in 12 NON-METRO counties are enrolled in Medicaid
The 2 METRO areas with the highest Medicaid enrollment are Washington Co and St. Louis City with 28% of overall population enrolled

Source: Dept of Health and Senior Services, Missouri Information for Community Assessment (MICA), USDC Bureau of the Census, Federal Office of Rural Health Policy
For 17 NON-METRO counties, 50%-78% of children enrolled in Medicaid
For METRO areas, only St. Louis City has over 50% of children enrolled in Medicaid

Source: Dept of Health and Senior Services, Missouri Information for Community Assessment (MICA), USDC Bureau of the Census, Federal Office of Rural Health Policy
55 NON-METRO counties had over 10% of population aged 20-64 enrolled in Medicaid. 11 rural counties had over 19% of adults enrolled.
8 METRO areas had over 10% of adults enrolled, with a high of 19%.

Source: Dept of Health and Senior Services, Missouri Information for Community Assessment (MICA), USDC Bureau of the Census, Federal Office of Rural Health Policy
15 NON-METRO counties had over 20% of elderly enrolled in Medicaid, and 56 had over 12.8%
Only 1 METRO area (Washington Co.) had over 20% of elderly population enrolled in Medicaid. 8 METRO counties over 12.8 %
Source: Dept of Health and Senior Services, Missouri Information for Community Assessment (MICA), USDC Bureau of the Census, Federal Office of Rural Health Policy
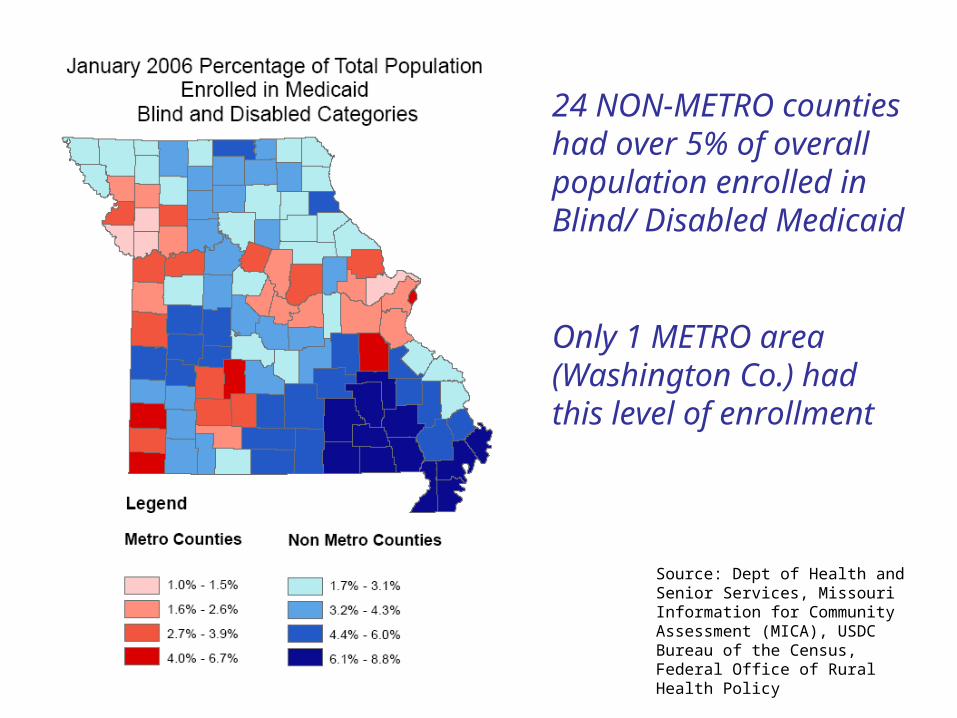
24 NON-METRO counties had over 5% of overall population enrolled in Blind/ Disabled Medicaid
Only 1 METRO area (Washington Co.) had this level of enrollment

18©2005 Medicaid Work Group, University of Missouri--Columbia
Missouri Medicaid Chartbook
Total Medicaid Expenditures by County, FY2004
Total expenditures were $4.8 billion in 2004
MISSOURI MAPS

20©2005 Medicaid Work Group, University of Missouri--Columbia
Missouri Medicaid ChartbookMedicaid Expenditures per Capita by County, FY2004
Per capita expenditures ranged from $326 to $2,425, reflecting the relative need of the population
MISSOURI MAPS

MO Medicaid Changes
• Estimated 120,000 people affected by changes since July 1, 2005 (and Sept. 1, 2005)
• Medicaid eligibility changes/ reductions:– People with disabilities (working, transitional,
Permanently and Totally Disabled) and Old Age– Low income parents (eligibility reduced from 75%
Federal Poverty Level to 22% FPL)– Medical services and equipment reduced– Increased cost sharing for recipients = increased
monthly premiums and increased “spend downs”

23©2005 Medicaid Work Group, University of Missouri--Columbia
Missouri Medicaid Chartbook
Percent of County Population Affected by Changes in Medicaid
Provisions, FY2006 Missouri’s poorest regions will have the highest percent of population impacted by the recent changes in Medicaid provisions
MISSOURI MAPS
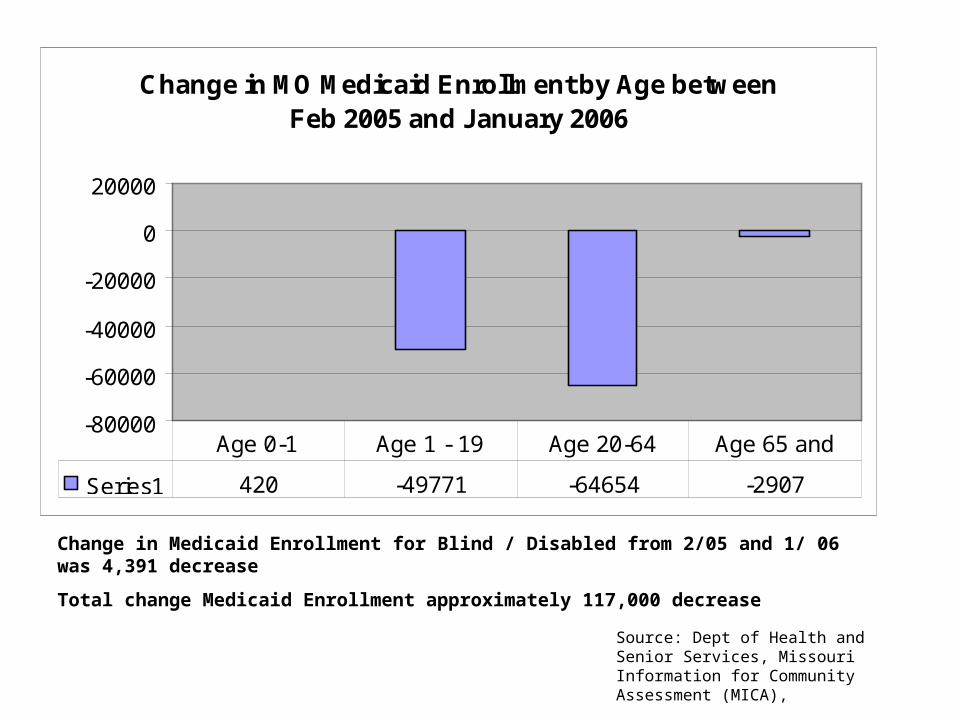
Change in Medicaid Enrollment for Blind / Disabled from 2/05 and 1/ 06 was 4,391 decrease
Total change Medicaid Enrollment approximately 117,000 decrease
Change in MO Medicaid Enrollment by Age between Feb 2005 and January 2006
-80000
-60000
-40000
-20000
0
20000
Series1 420 -49771 -64654 -2907
Age 0-1 Age 1 - 19 Age 20-64 Age 65 and
Source: Dept of Health and Senior Services, Missouri Information for Community Assessment (MICA),

The concentration of health and social services firms that employ less than 10 people is highest in Missouri’s rural counties
72% of health and social services firms in rural counties and 70% in urban counties have less than 10 employees
Source: 2003 County Business Patterns and Federal Office of Rural Health Policy

Firms with less than 20 employees made up 90-100% of all health and social services employers in 15 rural Missouri counties
84% of health and social services firms in both rural and urban counties have less than 20 employees
Source: 2003 County Business Patterns and Federal Office of Rural Health Policy

Things to consider…
• Rural areas tend to have fewer options for employer-based health insurance
• Health insurance companies tend to levy high premiums, deductibles, exclusions on farmers and small businesses
• Rural health care providers tend to be small businesses themselves. They may be paying high costs for health insurance and/or sharing the high cost with employees

Things to consider…
• Significant program changes are happening both in Medicaid in MO and in Medicare Part D (prescription drug program) nationally– Rural populations tend to be older and sicker than
urban counter parts– Health care providers are spending time and
resources helping individuals find ways to pay– Pharmacies in rural areas are more often
independently owned than in urban areas – Medicaid and Medicare Part D have been challenging for all pharmacies

Things to consider…
• Rural providers are currently being called on to provide more free / un-reimbursed /discounted care
• Rural providers may depend heavily on Medicare and Medicaid
• Rural providers may have smaller total profit margins so they may have less ability to absorb significant financial losses

Source: DHSS Primary and Rural Health
Health Professional Shortage Areas HPSAs

Other Resources
• Medicaid Reform Commission http://www.senate.mo.gov/medicaidreform/
• Missouri Hospital Association– http://web.mhanet.com/asp/Governmental_Relations/Medicaid.asp
• Dept of Social Services Reading Room Statistics http://www.dss.mo.gov/rr_stats.htm
• Dept of Social Services http://www.dss.mo.gov/pr_health.htm• MU Center for Health Policy
http://healthpolicy.missouri.edu/publications.htm• MO Information For Community Assessment (MICA) DHSS
http://www.dhss.mo.gov/MICA/nojava.html• Missouri Foundation For Health
http://www.mffh.org/policy_medbasics.html• Centers for Medicare and Medicaid Services
– http://www.cms.hhs.gov/