prologisir.prologis.com/~/media/files/p/prologis-ir-v4/events-pdfs/prolog... · 7 significant...
TRANSCRIPT

03.06.2017
Prologis
Citi Global Property
CEO Conference
Hollywood, FL

2
Forward-Looking Statements / Non Solicitation
This presentation includes certain terms and non-GAAP financial measures that are not specifically defined herein. Theseterms and financial measures are defined and, in the case of the non-GAAP financial measures, reconciled to the most directlycomparable GAAP measure, in our fourth quarter Earnings Release and Supplemental Information that is available on ourinvestor relations website at www.ir.prologis.com and on the SEC’s website at www.sec.gov.
The statements in this document that are not historical facts are forward-looking statements within the meaning of Section 27A of theSecurities Act of 1933, as amended, and Section 21E of the Securities Exchange Act of 1934, as amended. These forward-lookingstatements are based on current expectations, estimates and projections about the industry and markets in which we operate as wellas management’s beliefs and assumptions. Such statements involve uncertainties that could significantly impact our financial results.Words such as “expects,” “anticipates,” “intends,” “plans,” “believes,” “seeks,” “estimates” and variations of such words and similarexpressions are intended to identify such forward-looking statements, which generally are not historical in nature. All statements thataddress operating performance, events or developments that we expect or anticipate will occur in the future — including statementsrelating to rent and occupancy growth, development activity and changes in sales or contribution volume of properties, dispositionactivity, general conditions in the geographic areas where we operate, our debt, capital structure and financial position, our ability toform new co-investment ventures and the availability of capital in existing or new co-investment ventures — are forward-lookingstatements. These statements are not guarantees of future performance and involve certain risks, uncertainties and assumptions thatare difficult to predict. Although we believe the expectations reflected in any forward-looking statements are based on reasonableassumptions, we can give no assurance that our expectations will be attained and therefore, actual outcomes and results may differmaterially from what is expressed or forecasted in such forward-looking statements. Some of the factors that may affect outcomesand results include, but are not limited to: (i) national, international, regional and local economic climates, (ii) changes in financialmarkets, interest rates and foreign currency exchange rates, (iii) increased or unanticipated competition for our properties, (iv) risksassociated with acquisitions, dispositions and development of properties, (v) maintenance of real estate investment trust status, taxstructuring and income tax rates (vi) availability of financing and capital, the levels of debt that we maintain and our credit ratings, (vii)risks related to our investments in our co-investment ventures, including our ability to establish new co-investment ventures andfunds, (viii) risks of doing business internationally, including currency risks, (ix) environmental uncertainties, including risks of naturaldisasters, and (x) those additional factors discussed in reports filed with the Securities and Exchange Commission by us under theheading “Risk Factors.” We undertake no duty to update any forward-looking statements appearing in this document.

Contents
Prologis at a Glance 4
Logistics is a Growth Industry 5
Market Selection Matters 15
Unmatched Customer Network 21
Unique Business Model 23
Performance & Growth Potential 32
Compelling Valuation 35
Prologis Park Marston Gate, Midlands, United Kingdom

Click to edit Master text stylesPrologis at a Glance
1983FOUNDED IN
$66B
ON FOUR CONTINENTS
MSF
NYSE: PLDS&P 500 MEMBER
100MOST SUSTAINABLE CORPORATIONS
GLOBAL
CREDIT RATING OF
A3/A-
676
ASSETS UNDER MANAGEMENT
Note: A securities rating is not a recommendation to buy, sell or hold securities and may be subject to revision or withdrawal at any time

5
Logistics Real Estate Delivers Consistent Returns
1996-2016(%)
Total Returns Forecast, 2017E(%, unleveraged pre-fee and before tax)
10.110.7
9.5 9.6
6
7
8
9
10
11
12
Logistics Retail Office Apartment
Source: NCREIF
7.8
7.1
6.76.5
3
4
5
6
7
8
9
Logistics Retail Apartment Office
Appreciation
Income
Source: PREA Consensus Forecast Survey as of Q4 2016
Logistics is projected to be the
highest-performing asset class in 2017
Historically, logistics consistently
delivered one of the highest returns
and had one of the lowest standard
deviations

6
Logistics Real Estate is a Growth Industry
Source: Oxford Economics, World Bank, IMF, CBRE, JLL, Gerald Eve, Cushman & Wakefield, Colliers, Prologis Research
Note: “Demand growth” represented by the annual reversion growth rate. Modern stock represented as a share of consumer
households (those earning at least $20,000 USD annually (PPP and inflation-adjusted)). Size of bubble reflects total modern stock.
Consumption, GlobalTrillions, Inflation Adjusted 2015 Dollars
0
10
20
30
40
50
60
70
1980
1985
1990
1995
2000
2005
2010
2015
2020F
0
2
4
6
8
10
12
14
16
18
0 25 50 75 100
U.S.
Europe
Japan
Mexico
Brazil
China
Supply Chain ReconfigurationDemand Growth % vs. Modern Stock per Consumer
HouseholdConsumption is the
largest share of
economic activity and
outperforms across
economic cycles
Supply chains are
becoming mission
critical, driving an
increase in the demand
for logistics space

7
Significant Opportunity
Source: CBRE, JLL, Gerald Eve, Cushman & Wakefield, Colliers, Prologis Research
Note: Stock is for the principal markets in their respective regions
Opportunity to increase
modern stock by
3 Billion SF and
$325 Billion of new potential
investment
0
1,000
2,000
3,000
4,000
5,000
6,000
U.S. Europe China Japan Other PLD
Regions
Current Modern Stock Additional Modern Stock Required Today
Modern Logistics SpaceSquare Feet, Millions
8
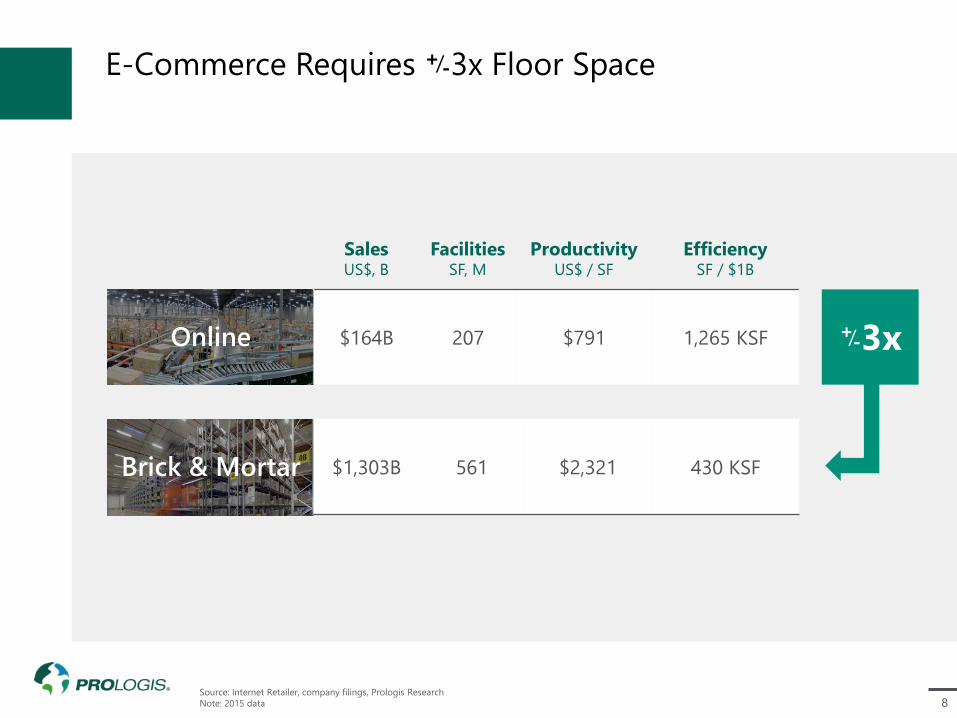
E-Commerce Requires 3x Floor Space
Source: Internet Retailer, company filings, Prologis Research
Note: 2015 data
+-/
SalesUS$, B
FacilitiesSF, M
ProductivityUS$ / SF
EfficiencySF / $1B
$164B 207 $791 1,265 KSFOnline
Brick & Mortar $1,303B 561 $2,321 430 KSF
3x+-/

9
Significant Shift As Adoption Rate Increases
Source: e-Marketer, Prologis Research
Note: Includes products and services ordered using the internet via any device, regardless of the method of payment or fulfillment, excludes travel and event tickets
162%projected growth of
e-commerce sales from
2015-2020
130% shift to
e-commerce
16% inflation
16% real growth
in sales
E-Commerce Sales, GlobalDollars, Trillions %
0
2
4
6
8
10
12
14
16
0.0
0.5
1.0
1.5
2.0
2.5
3.0
3.5
4.0
4.5
5.0
2010
2011
2012
2013
2014
2015
2016E
2017F
2018F
2019F
2020F
E-Commerce Sales ( L ) E-Commerce as a % of Total Retail Sales ( R )

10
Shifting Demographics Affecting Consumption
Source: Prologis Research
1. Non-Logistics includes investing, education, personal service, housing and utilities
Expenditures for goods
that flow through
logistics facilities are
40% higher during peak
spending years (35 to 55)
as compared to other
age cohorts
Millennials, who tend to
be tech-savvy and
purchase a larger share
of goods online, are
beginning
to enter their peak
spending years
Logistics-Intensive Consumer Expenditures, U.S.(1)
Thousands of Dollars, Average Annual Spending per Household, 2015
0
10
20
30
40
50
60
70
80
<25
25-3
4
35-4
4
45-5
4
55-6
4
65-7
4
>75
Auto Home Goods & Furnishing Food & Personal Goods Non-Logistics
Age in Years
Average of logistics-intensive spending
Average of total spending

11
Not All E-Commerce Facilities Are New or Large
Source: Prologis Research
140,000 SFaverage unit size for
e-commerce customers
17 yearsaverage building age for
e-commerce customers
0
5
10
15
20
25
10
25
50
100
200
350
500
750
1,0
00
1,2
50
1,5
00
Distribution of Leases by Unit Size%, Share of Prologis Portfolio,
Global by Size Category in Thousands SF
Distribution of Leases by Building Age%, Share of Prologis Portfolio, Global
E-Commerce Non E-Commerce
0
2
4
6
8
10
12
0 5 10 15 20 25 30 35

12
Other Segments of the Economy Outperforming
Source: U.S. Census, U.S. Bureau of Economic Analysis. Forecasts and estimate of normal come from Consensus Economics and Oxford Economics, respectively
Consumption vs. GDP, U.S.%, y/y, Inflation Adjusted
Housing Starts, U.S.Thousands, New Privately Owned Housing Units Started, Monthly, SAAR
0
500
1,000
1,500
2,000
2,500
2000
2001
2002
2003
2004
2005
2006
2007
2008
2009
2010
2011
2012
2013
2014
2015
2016
2017
2017E
-4
-2
0
2
4
6
2000
2001
2002
2003
2004
2005
2006
2007
2008
2009
2010
2011
2012
2013
2014
2015
2016E
2017F
2018F
Personal Consumption Expenditures GDP
Estimate of Normal
13
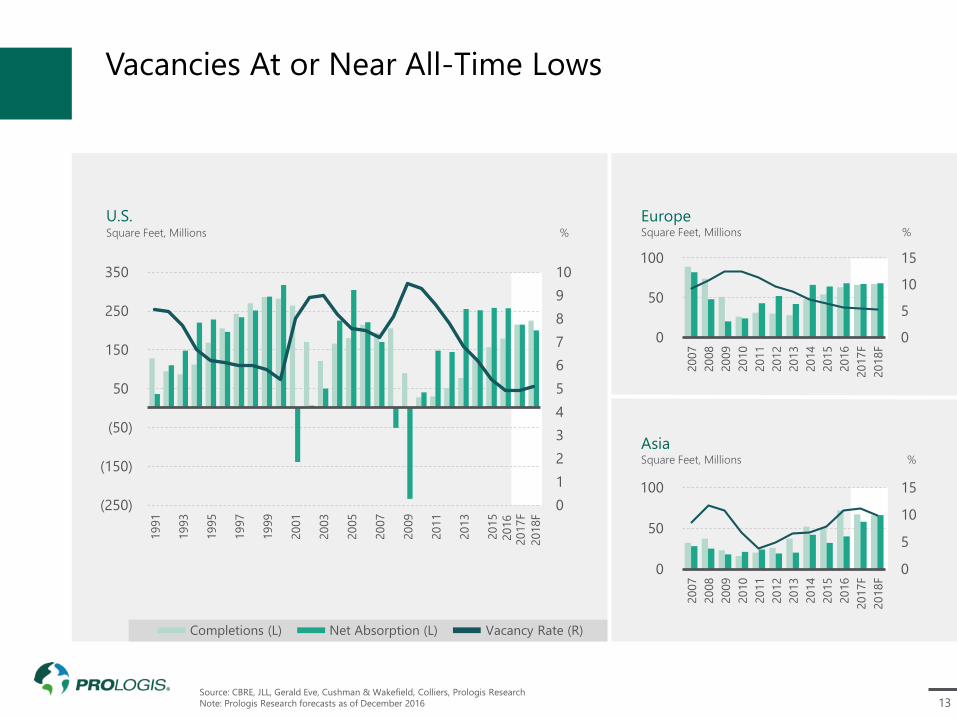
Vacancies At or Near All-Time Lows
Source: CBRE, JLL, Gerald Eve, Cushman & Wakefield, Colliers, Prologis Research
Note: Prologis Research forecasts as of December 2016
U.S.Square Feet, Millions %
EuropeSquare Feet, Millions %
0
5
10
15
0
50
100
2007
2008
2009
2010
2011
2012
2013
2014
2015
2016
2017F
2018F
0
1
2
3
4
5
6
7
8
9
10
(250)
(150)
(50)
50
150
250
350
1991
1993
1995
1997
1999
2001
2003
2005
2007
2009
2011
2013
2015
2017F
AsiaSquare Feet, Millions %
0
5
10
15
0
50
100
2007
2008
2009
2010
2011
2012
2013
2014
2015
2016
2017F
2018F
Completions (L) Net Absorption (L) Vacancy Rate (R)
2016
2018F
14
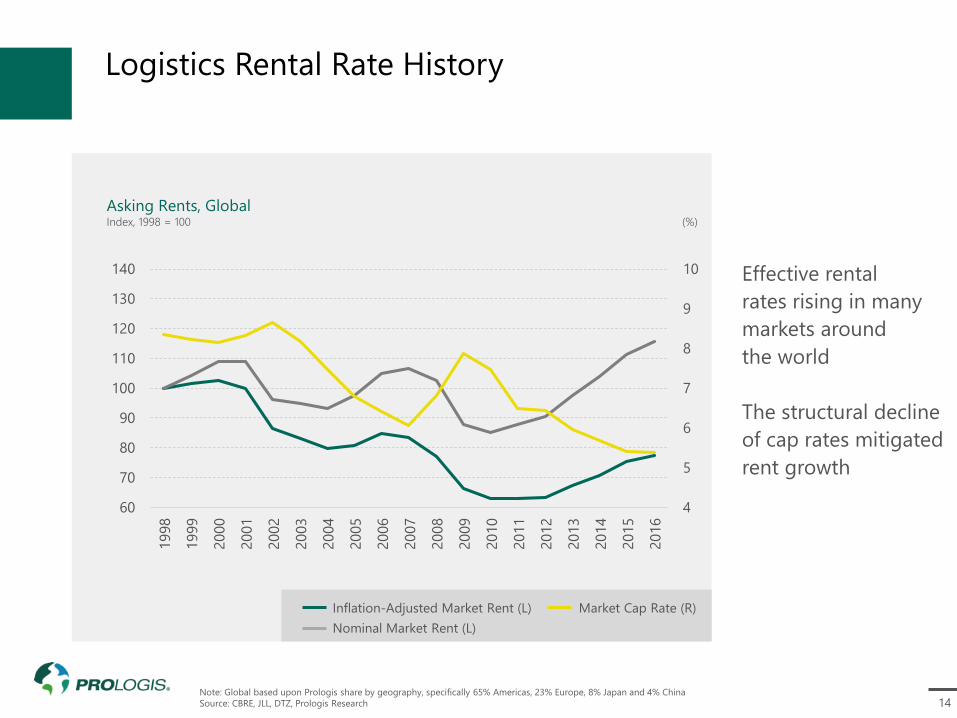
Logistics Rental Rate History
Note: Global based upon Prologis share by geography, specifically 65% Americas, 23% Europe, 8% Japan and 4% China
Source: CBRE, JLL, DTZ, Prologis Research
Effective rental
rates rising in many
markets around
the world
The structural decline
of cap rates mitigated
rent growth
4
5
6
7
8
9
10
60
70
80
90
100
110
120
130
140
1998
1999
2000
2001
2002
2003
2004
2005
2006
2007
2008
2009
2010
2011
2012
2013
2014
2015
2016
Inflation-Adjusted Market Rent (L)
Nominal Market Rent (L)
Market Cap Rate (R)
Asking Rents, GlobalIndex, 1998 = 100 (%)

15
Prologis Portfolio Located Near Consumers
Source: 2010 U.S. Census, company filings, Prologis Research
Note: Owned & Managed NRA of Prologis relative to the combined total Owned & Managed NRA for DCT, DRE, EGP, FR, LPT, and REXR.
Shading reflects income weighted population
Portfolio Size by NRA, Prologis vs Sum of Logistics REITsMajor Coastal Markets
Market Share of U.S. Operating Portfolio% of NRA
PLD Other Logistics REITs
0
10
20
30
40
50
Major Coastal
Markets
Major Interior
Markets
All Other
PLD Logistics REIT Avg

16Source: CoStar and Prologis Research
1. Other logistics REITs include DCT, DRE, EGP, FR, LPT and REXR
Benefits of A Focused StrategyCoStar Market Data
RENT GROWTH
+85 bps Annual Difference
2012 -2016E. Average annual market rental
growth for Prologis U.S. markets vs. average
of other logistics REITs(1)
CAP RATE
-27 bps Current Difference
CoStar logistics market cap rate. Differential
between Prologis market exposure vs. average
of other logistics REITs(1)
Prologis LAX Cargo Center, Los Angeles, California

17
Focused Submarket Strategy, Southern California
Source: Company filings, CoStar, Prologis Research
Note: For all companies, properties in San Diego not shown on map

18
Focused Submarket Strategy, New York / New Jersey
Source: Company filings, CoStar, Prologis Research
19
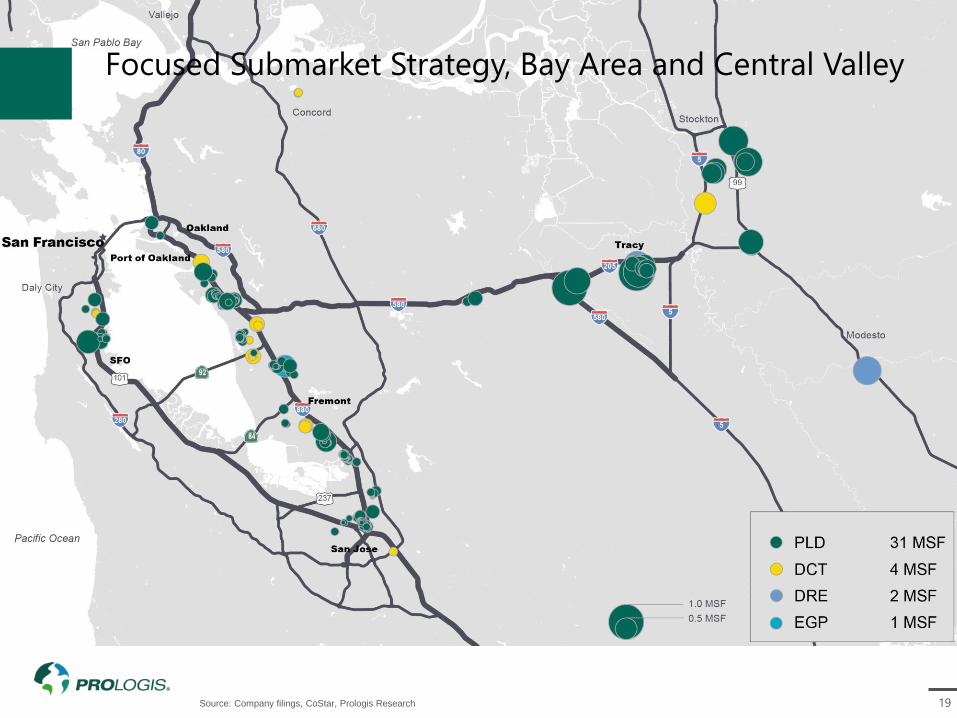
Focused Submarket Strategy, Bay Area and Central Valley
Source: Company filings, CoStar, Prologis Research
20
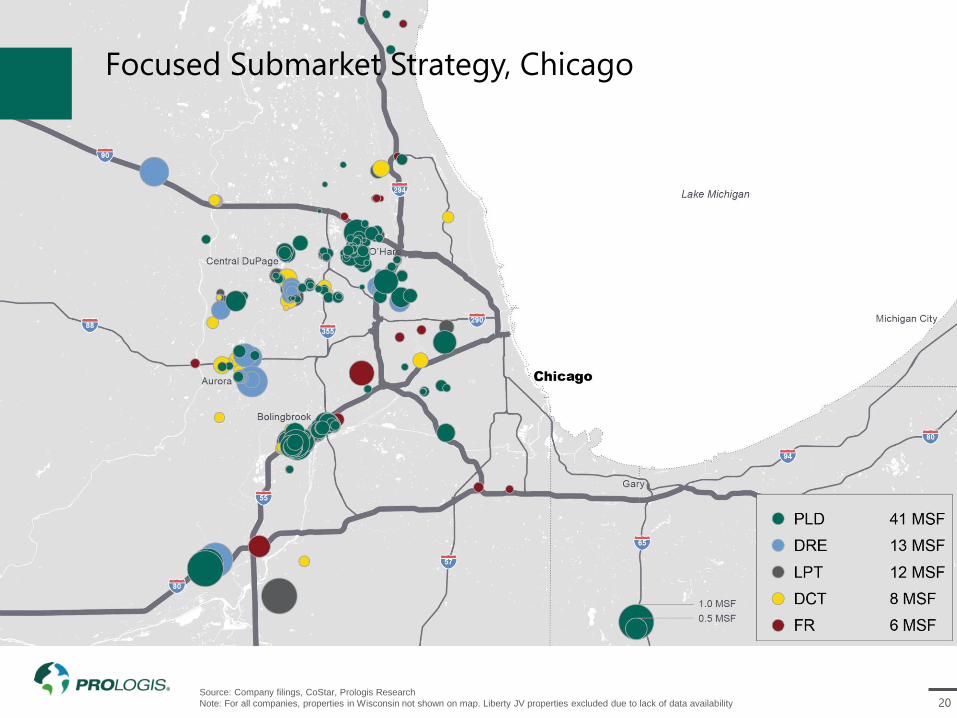
Focused Submarket Strategy, Chicago
Source: Company filings, CoStar, Prologis Research
Note: For all companies, properties in Wisconsin not shown on map. Liberty JV properties excluded due to lack of data availability

21
Serving the World’s Best Brands
95%Of our top 25
customers operate
globally
75%lease from us on
multiple continents

22
Durable Demand From Our Diverse Customer Base
Other
Transportation/Freight
Manufacturer
Retailer
Wholesaler
3PL
0 10 20 30 40
Manufacturing
Transport
E-Commerce
Distribution, B2B
Distribution, Retail
0 10 20 30 40
Data Center / Office
Healthcare / Pharma
Industrial Materials
Home Furnishings
Transport & Distribution
Packaging / Paper
Construction / Housing
Consumer Products
Auto & Parts
Apparel/Specialty Goods
Diversified Retailer
Electronics & Appliances
Food & Beverage
0 2 4 6 8 10
Customer ActivityShare of Portfolio, %, NRA
Customer IndustryShare of Portfolio, %, NRA
Customer TypeShare of Portfolio, %, NRA
Source: Prologis Research
Note: Industry classifications do not sum to 100%. The balance, 13%, is ascribable to units where 3PL customers have more than one industry type present
23
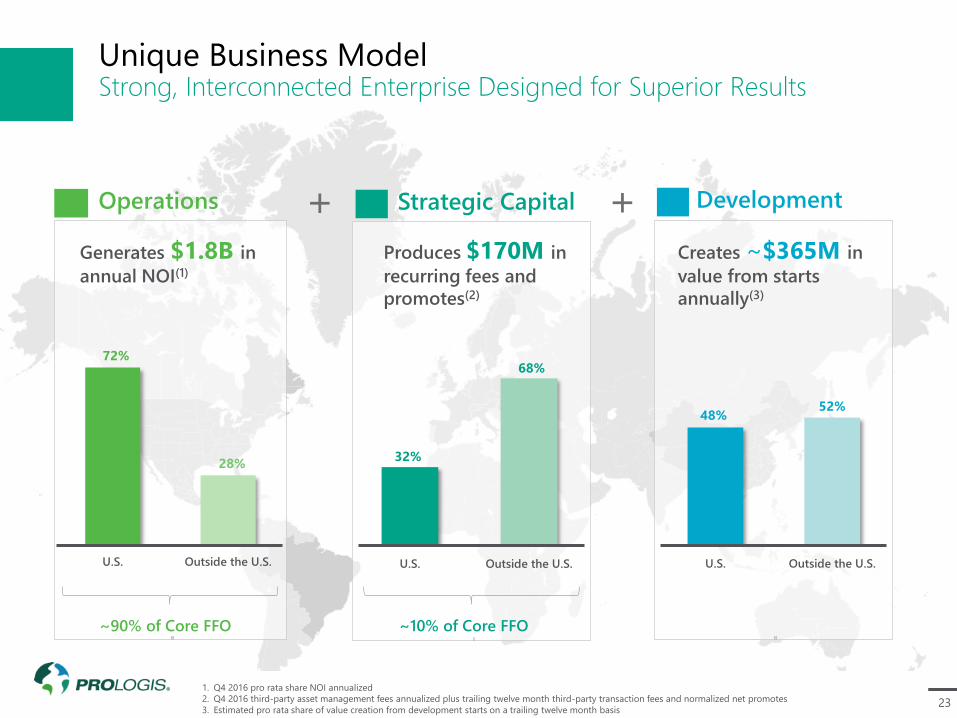
Unique Business ModelStrong, Interconnected Enterprise Designed for Superior Results
Development
48%52%
U.S. Outside the U.S.
Creates ~$365M in
value from starts
annually(3)
Operations
72%
28%
U.S. Outside the U.S.
~90% of Core FFO
Generates $1.8B in
annual NOI(1)
Strategic Capital
32%
68%
U.S. Outside the U.S.
Produces $170M in
recurring fees and
promotes(2)
++
~10% of Core FFO
1. Q4 2016 pro rata share NOI annualized
2. Q4 2016 third-party asset management fees annualized plus trailing twelve month third-party transaction fees and normalized net promotes
3. Estimated pro rata share of value creation from development starts on a trailing twelve month basis
24
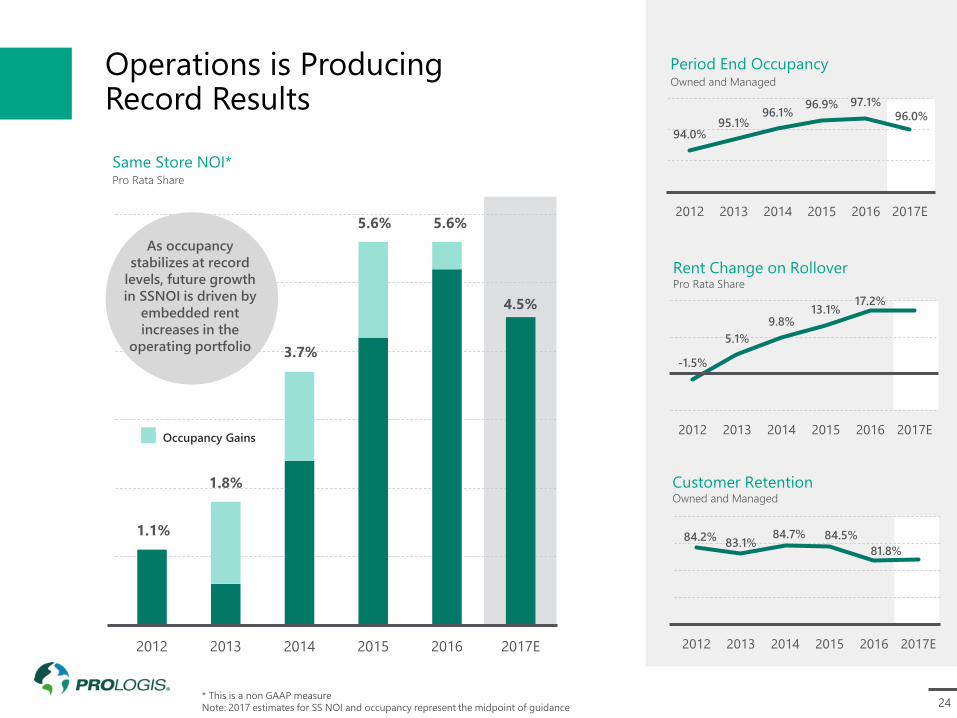
Operations is ProducingRecord Results
-1.5%
5.1%
9.8%13.1%
17.2%
2012 2013 2014 2015 2016 2017E
Rent Change on RolloverPro Rata Share
Customer RetentionOwned and Managed
Period End OccupancyOwned and Managed
94.0%95.1%
96.1%96.9% 97.1%
96.0%
2012 2013 2014 2015 2016 2017E
84.2%83.1%
84.7% 84.5%
81.8%
2012 2013 2014 2015 2016 2017E
Same Store NOI*Pro Rata Share
2012 2013 2014 2015 2016 2017E
As occupancy
stabilizes at record
levels, future growth
in SSNOI is driven by
embedded rent
increases in the
operating portfolio
1.8%
1.1%
3.7%
5.6% 5.6%
Occupancy Gains
* This is a non GAAP measure
Note: 2017 estimates for SS NOI and occupancy represent the midpoint of guidance
4.5%

25
Harvesting the Gap Between In-Place-To-Market Rent
* This is a non-GAAP financial measure
~$225millionof annual NOI
at YE19
Incremental
Projected ending
mark-to-market
will be the driver
of future growth
0%
5%
10%
15%
20%
25%
2016 2017F 2018F 2019F
PLD portfolio
still ~3%
under-rented
PLD portfolio
~12% under-rented
PLD portfolio
~7% under-rented
~3% Annual
Market Rent
Growth
Scenario
No Annual
Market Rent
Growth
Scenario
Same Store NOI* Growth Scenarios%, Cumulative SSNOI Growth
Cash SSNOI is
expected to be
higher

26
StartsPro Rata Share, Millions of Dollars
StabilizationsPro Rata Share, Millions of Dollars
2017 Development Starts:
~90 discrete projects
~$20M average investment
40% build-to-suit projects
97% occupancy in markets
we expect to start
construction
Geographic Mix:
40% U.S.
10% Other Americas
25% Europe
20% Japan
5% China
0
500
1,000
1,500
2,000
2012 2013 2014 2015 2016 2017E
0
750
1,500
2,250
2012 2013 2014 2015 2016 2017E
NOI (Retained) $15 $30 $55 $75
Value Creation $225 $275 $350 $380
Prudent Development Activity
Development
accounts for
8.5%of our real estate assets
$365
$100

27
Recurring Value Creation Through Development15-Year Track Record
Note: Data based on development activity from 2001 through June 30, 2016
$19.5BOutside the U.S.
$6.2BIn the U.S.
18.2%Margin in the U.S.
20.1%Margin outside
the U.S.
$25.7BTotal Investment
$5.1BValue Creation
460Properties in
the U.S.
840Properties outside
the U.S.
1,300Total Properties
335MSquare Feet
115MSquare Feet in
the U.S.
220MSquare Feet
outside the U.S.
We have built:
47% of our portfolio
Minimized property
improvements through
LEED certified building
specifications and the
investment of sustainable
materials
Development needed in
markets where:
Product does not exist
Supply chain undergoing
reconfiguration
Customers have
requirements
We develop to:
Meet customers’ needs
Deepen our market
presence
Refresh portfolio quality
Generate profits across the
cycle

28
Growth in Third-Party Fees & PromotesCAGR = 18.7%
Growth in Third-Party AUMCAGR = 14.6%
Strategic Capital Produces Stable, Long-Term Cash Flow
Very durable fee stream
with over 90% from
perpetual or long-life
ventures
Third-party capital:
Boosts return on equity
by at least 350 bps
Minimizes Prologis’ equity
exposure to non-USD
investments
Mitigates development
risk in emerging markets
Provides “four-quadrant”
access to capital
2012 2013 2014 2015 2016 2017
$25B
$23B
$19B
$18B
$14B
$27B
# of Ventures Start of Period
20 15 12 11 11
$0.7B $1.2B $1.6B $2.1B $2.3B
Average Size per Venture
11
$2.5B
2012 2013 2014 2015 2016 2017
$130M
$150M
$220M
$130M
$80M
$185M
% Perpetual Life
60% 85% 90% 95% 95% 90%
29
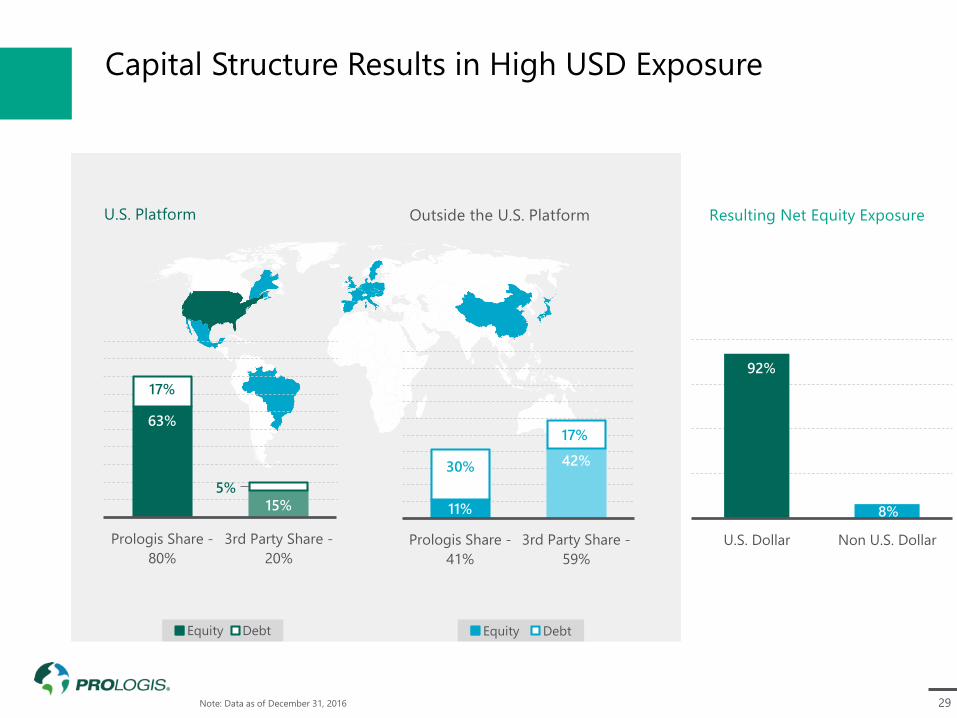
Capital Structure Results in High USD Exposure
Note: Data as of December 31, 2016
Resulting Net Equity Exposure
8%
U.S. Dollar Non U.S. Dollar
92%
U.S. Platform
63%
15%
17%
5%
Prologis Share -
80%
3rd Party Share -
20%
Equity Debt
Outside the U.S. Platform
11%
42%
Prologis Share -
41%
3rd Party Share -
59%
Equity Debt
30%
17%

30
Japan Illustration
Development and Strategic Capital Create a Virtuous Cycle
Net Result
Capital recycling results
in $0 Net Investment…
…that generates $6.5M
in annual fees and
dividends going forward
Cash Flow from Prologis’
$90M retained ownership:
Dividend (assume 3.3% yield)
Fees (assume 70 bps on FMV)
Total
$3.0M
$3.5M
$6.5M
Cash Flow
Contribute asset to
Nippon Prologis REIT
(NPR)
STRATEGIC CAPITAL
3rd Party (85%) $500M
Prologis (15%) $90M
$90M
Value Creation
~18% Margin
+
$500M
Prologis Investment
=
$590M
Asset Value
Recycle $500M
in proceeds back
into development
DEVELOPMENT

31
YE 2016
Debt as % of Gross Real Estate Assets 34.6%
Debt-to-Adjusted-EBITDA
with gains4.7x
Fixed Charge Coverage
with gains5.8x
USD Net Equity Exposure 92%
Liquidity ~4.0B
$0.0
$1.0
$2.0
$3.0
2016
Fixed Charges Surplus EBITDA
$1.5B
$390M
PLD EBITDA(1) and Fixed Charges
(Excludes ~$335M of realized gains)Dollars, Billions
1. PLD Q4 2016 annualized EBITDA
Top-Rated Financial PositionUpgraded to A3/A- by Moody’s / S&P in 2016
Prologis has one of
the strongest surplus
EBITDAs among REITs

32
Unmatched Earnings Growth
Prologis has the
best Core
FFO CAGR for
all time periods
FFO PER SHARE CAGR 1-Year 3-Year 5-Year
PLD 15% 16% 10%
Other Logistics REITs(1) 2% 4% 4%
Blue Chips(2) 7% 8% 9%
REIT Average(3) 8% 9% 8%
S&P 500 Average(4) 6% 2% 3%
Source: Factset, data as of February 28, 2017; based on earnings through 2016
1. Includes DCT, DRE, EGP, FR, LPT and STAG
2. Includes AVB, BXP, EQR, FRT, HST, PSA, and SPG
3. Includes REITs in the RMZ as of 12/31/2016 with 5 years’ worth of data
4. Earnings per share for all companies in the S&P as of 12/31/2016 with 5 years’ worth of data

33
Superior Dividend Growth
The top
dividendCAGRs for one and
three-year time
periods
Source: Factset, data as of February 28, 2017; based on earnings through 2016
1. Includes DCT, DRE, EGP, FR, LPT and STAG
2. Includes AVB, BXP, EQR, FRT, HST, PSA, and SPG
3. Includes REITs in the RMZ as of 12/31/2016 with 5 years’ worth of data
4. Include all companies in the S&P as of 12/31/2016 with 5 years’ worth of data
Dividend CAGR 1-Year 3-Year 5-Year
PLD 11% 14% 8%
Other Logistics REITs(1) 5% 3% 3%
Blue Chips(2) 8% 10% 12%
REIT Average(3) 7% 8% 9%
S&P 500 Average(4) 9% 10% 12%

34
Illustrative Three-year Growth Potential
* This is a non-GAAP financial measure
1. Expect Cash SSNOI to be higher
Prologis Park Redlands, Redlands, California
3.0%
Dividend
Yield
Total
Return
10.0%-11.0%
SSNOI*(1)
4.0%-
5.0%
Operating &
Financial
Leverage
1.5%
Yield on Value Creation
1.5%
Core FFO* Growth
7.0%-8.0%

35
Attractive Valuation
Source: Factset. Prices, TSR and dividend yields calculated as of December 31, 2016
1. Annualized TSR 1/1/2014-2/28/17; 2014-2016 FFO actuals as reported by companies and Factset Consensus 2017 FFO
2. Includes AVB, BXP, EQR, FRT, HST, PSA, and SPG. Price to FFO divided by sum of 2017 over 2016 FFO growth rate per Factset consensus plus dividend yield as of
2/28/2017
3. Includes DCT, DRE, EGP, FR, LPT and STAG. Same methodology as footnote 2
4. Same methodology as footnote 2 except 2016 and 2017 were adjusted for normalized promotes
5. Includes REITs in the RMZ as of 2/28/2017. Same methodology used in footnote 2 but excludes companies with PEG ratio less than -10 or larger than +10
6. Includes companies in the S&P 500 as of 2/28/17. Same methodology as footnote 4 but earnings per share used instead of FFO for non-REITs
0%
5%
10%
15%
20%
25%
-5% 0% 5% 10% 15%
PSAAVB
DCT
FR
PLD
LPT
DRE
EGP
BXP
FRT
SPG
HST
STAGEQR
Adjusted
PEG Ratio
Blue Chips(2) 2.79
Other Logistics
REITs(3) 2.40
PLD(4) 1.95
REIT Average(5) 1.85
S&P 500
Average(6) 0.99
PEG Ratios
Attractive Valuation
Total Stock Return and FFO Growth(1) (2014-2017)%, Annualized TSR, Annualized FFO Growth

36
1.5x
Valuation Premium ComparisonPrice to FFO
Prologis trades in
line (adjusted basis)
to Sector Peers and
would need
1.5x or
$4/shjust to catch up with
Blue Chip peers
Blue Chip
Sector
Peers
Premium
Universe
19.1x
17.5x
1.6x
Logistics
Logistics Land/CIP
Adjustment(1)
Logistics Adjusted
Price to FFO
19.2x (1.7x)Prologis
17.5x
18.5x (1.0x)Other Logistics REITs
17.4x
0.7x – 0.1x
Source: Factset, data as of February 28, 2016
1. Company filings at December 31, 2016
2. Blue Chip companies include AVB, BXP, EQR, FRT, HST, PSA and SPG
3. Sector peers are the next six largest REITs by market cap in each of the blue chips’ sub-sectors (excluding storage sub-sector, for which there are only 3 other peers).
Logistics peers include: DCT, DRE, EGP, FR, LPT, STAG

37
Location and Quality Matters
Going forward it’s all about Same Store
NOI growth and value creation
Prologis has superior organic and
external growth potential

Click to edit Master title style
38