mediabase ready and first analysis report
DESCRIPTION
European Commission Seventh Framework Project (IST-257822)Mediabase Ready and First Analysis ReportDeliverable D4.3Editor: Michael Derntl (RWTH Aachen University)Contributors: Adam Cooper, Manh Cuong Pham, Ralf Klamma, Dominik RenzelDissemination level: PublicDelivery date: 2011-09-30TRANSCRIPT

Coordination and Support Action
European Commission Seventh Framework Project (IST-257822)
Mediabase Ready and First Analysis Report
Deliverable D4.3
Editor: Michael Derntl (RWTH Aachen University)
Contributors: Adam Cooper, Manh Cuong Pham, Ralf Klamma, Dominik Renzel
Dissemination level: Public
Delivery date: 2011-09-30
Work Package
WP4: Weak Signals Analysis – Emerging Reality
Dissemination Level Public
Status Version 1.0 — Final
Date September 30, 2011

Amendment History
Version Date Editor Description/Comments
1.0 30 Sept. 2011 Michael Derntl Final version
Contributors
Name Institution Role
Michael Derntl RWTH Aachen University Editor/Author
Adam Cooper University of Bolton (CETIS) Author
Ralf Klamma RWTH Aachen University Author
Manh Cuong Pham RWTH Aachen University Author
Dominik Renzel RWTH Aachen University Author
Paul Lefrere The Open University (OU) Reviewer
Lampros Stergioulas Brunel University Reviewer
Christian Voigt Zentrum für Soziale Innovation (ZSI) Reviewer
Deliverable description in the DoW:
The deliverable will describe the continuation of the established PROLEARN Mediabase
equipped with new tools combining the existing social network analysis with topic mining.
This will realize a structural-semantic analysis of signals from the Web 2.0 strongly related
to technology enhanced learning. Results from the analysis will be reported here but can be
obtained continuously from the Web interfaces of the Mediabase afterwards.

Contents
1 Introduction .......................................................................................................... 1
2 The TEL-Map Mediabase ........................................................................................ 2
2.1 Conceptual Model of the TEL-Map Mediabase ........................................................................... 3
2.2 Components Overview .................................................................................................................. 4
2.3 Analysis Approach ......................................................................................................................... 7
2.4 Potential Questions ..................................................................................................................... 10
3 Analysis of the European TEL Project Landscape .................................................. 12
3.1 Data Set ........................................................................................................................................ 12
3.2 TEL Projects as Social Networks ................................................................................................ 14
3.3 Project Consortium Progression ................................................................................................. 15
3.3.1 FP7 Projects ....................................................................................................................... 15
3.3.2 All TEL Projects – FP6, FP7, and eContentplus .............................................................. 16
3.3.3 Identifying Project Clusters .............................................................................................. 17
3.4 Organizational Collaborations .................................................................................................... 19
3.4.1 Collaborations in FP7 projects ......................................................................................... 19
3.4.2 Collaborations in all TEL Projects: FP6, FP7, and eContentplus ................................... 21
3.4.3 Dynamic SNA of the TEL Project Landscape .................................................................. 25
3.5 Geo-Mapping TEL Projects ......................................................................................................... 28
4 Analysis of TEL Publication Outlets ...................................................................... 29
4.1 Data Set ........................................................................................................................................ 29
4.2 Social Network Analysis of TEL Venues and Papers ................................................................. 31
4.3 Co-Authorship Network Analysis ............................................................................................... 32
4.3.1 Formal Foundations .......................................................................................................... 32
4.3.2 Overview ............................................................................................................................ 32
4.3.3 Dynamic SNA .................................................................................................................... 34
4.3.4 Most Prolific Authors and Their Topics ........................................................................... 35
4.3.5 Overall TEL Co-authorship Network ............................................................................... 37
4.3.6 Central Authors in the Co-Authorship Network.............................................................. 38
4.4 Structural-Semantic Analysis: SNA and Topic Mining Combined ........................................... 39
4.5 Citation Network Analysis .......................................................................................................... 43
5 Analysis of the TEL Social Web ............................................................................. 44
5.1 Social Web Data Set .................................................................................................................... 45
5.2 Formal Foundations .................................................................................................................... 46
5.3 Results .......................................................................................................................................... 47
5.3.1 TEL Blog Network and Most Central Blogs ..................................................................... 47
5.3.2 TEL Blog Clusters .............................................................................................................. 49
5.3.3 Bursts ................................................................................................................................. 51
6 Embeddable Interactive Visualizations and Queries ............................................. 52
7 Key Findings for Weak Signals ............................................................................. 55
7.1 TEL Projects................................................................................................................................. 55
7.2 TEL Papers ................................................................................................................................... 56
7.3 TEL Social Web............................................................................................................................ 57
8 Conclusion ........................................................................................................... 57
References ................................................................................................................. 58
Appendix A: TEL Projects — Timeline ........................................................................ 60
Appendix B: TEL Projects — SNA Metrics .................................................................... 61

Figures
Figure 1: Concept map underlying of the TEL-Map Mediabase metamodel. ............................................. 4
Figure 2: TEL-Map Mediabase components overview model. .................................................................... 5
Figure 3: Data model of TEL projects. ........................................................................................................ 12
Figure 4: Word clouds of project descriptions. .......................................................................................... 14
Figure 5: FP7 TEL projects graph visualization. ........................................................................................ 15
Figure 6: Project consortium progression between FP6, FP7, and eContentplus projects. .................... 17
Figure 7: Visualization of the FP7 collaboration graph.............................................................................. 19
Figure 8: Center region cut-out of the FP7 collaboration graph. ..............................................................20
Figure 9: Word cloud of the 20 word stems with highest frequency in the FP7 project descriptions .... 21
Figure 10: Partner collaborations spanning FP6, FP7, and eContentplus projects. ................................ 22
Figure 11: Local clustering of organizations plotted against (a) PageRank and (b) degree. .................... 24
Figure 12: Overall development of collaboration network since 2004. .................................................... 26
Figure 13: Impact of newly launched projects the collaboration network. ............................................... 26
Figure 14: Impact of organizations on collaboration. ................................................................................ 27
Figure 15: Development of the ratio of projects coordinated by novice organizations ............................ 27
Figure 16: Google Map overlay with organizations involved in TEL projects. ......................................... 28
Figure 17: Data model for TEL papers and events. ....................................................................................30
Figure 18: Word cloud of most frequent terms in TEL conference paper titles. ...................................... 31
Figure 19: Development model for conference communities. ................................................................... 32
Figure 20: Cumulative annual (co-)author figures of selected TEL conferences over the last 10 years. 33
Figure 21: Co-authorship network visualization for the TEL conferences. .............................................. 33
Figure 22: Co-authorship network measures of five conferences in TEL. ................................................ 35
Figure 23: Most frequent terms in papers of top TEL authors in 2010. ................................................... 37
Figure 24: Complete co-authorship network in the core TEL venues. ..................................................... 37
Figure 25: Co-authorship network of the “inner circle” of authors in the core TEL venues. .................. 38
Figure 26: Citation network measures of five conferences in TEL. .......................................................... 44
Figure 27: Relational model of the TEL blogosphere. ............................................................................... 45
Figure 28: Number of blogs added to and blog entries indexed in the TEL-Map Mediabase. ................ 46
Figure 29: TEL blogs link network visualization, excluding self-references. ........................................... 47
Figure 30: Top 100 word stems appearing in 2011 blog entries of the top 20 blogs................................ 49
Figure 31: Colored TEL blog clusters. ......................................................................................................... 50
Figure 32: Bursty terms appearing only in 2011. ....................................................................................... 51
Figure 33: Bursty terms with rising frequency over the last three years. ................................................. 52
Figure 34: Visualization of the same SQL query as a table (left) and as a graph (right). ........................ 53
Figure 35: SQL query visualization as an annotated timeline. .................................................................. 54
Tables
Table 1: Uses of social network analysis and topic mining in the TEL-Map Mediabase. ........................ 10
Table 2: Overview of the 77 TEL Projects in the TEL-Map Mediabase..................................................... 13
Table 3: TEL project clusters in FP6, FP7, and eContentplus (ECP) and the word clouds of their project
descriptions. ................................................................................................................................................. 18
Table 4: Top 30 organizations involved in TEL projects by PageRank. The numbers in square brackets
next to the values represent the rank of that value among all 604 organizations. ................................... 23
Table 5: Strongest partnership bonds over all TEL projects in FP6, FP7 and eContentplus. ................. 25
Table 6: Selection of conferences relevant to the TEL community. .......................................................... 31
Table 7: Fifteen most prolific authors at conferences and journals with a broad TEL scope. Names
marked with an asterisk (*) indicate authors currently based in Europe. ................................................ 36
Table 8: Top 15 TEL authors by betweenness centrality. .......................................................................... 39
Table 9: Top ten co-author pairs in core TEL venues. ............................................................................... 39
Table 10: Betweenness centrality of authors of papers identified in D4.1. ...............................................40
Table 11: Summary of structural-semantic analysis: themes and matching papers. ............................... 41
Table 12: Top twenty blog sources by PageRank. The number in square bracket indicates the blog’s
overall rank for the respective metric. ....................................................................................................... 48
Table 13: Clusters of TEL blogs indexed in Mediabase. ............................................................................. 49
– 1 –
1 Introduction The European Framework Programmes (FP) for Research and Technological Development are a key
pillar of the European research area and act as the primary vehicle for the European Union to create
and sustain growth, employment and global competitiveness [3]. FPs are complex frameworks
defining the specific research programmes and challenges to be tackled over a seven-year period with a
multi-billion Euro budget. In FP7, the Cooperation programme, which also hosts the Technology
Enhanced Learning (TEL) thematic area, received the largest share of the total FP7 funds. For the
twenty-six partly completed and partly running TEL projects in FP7 the European Commission has
provided or will provide a total funding of more than one hundred million Euro. People and
organizations with a stake in TEL research and development are likely to be interested in knowing
where this enormous amount of money went and what impact it has generated and is generating on
the TEL landscape. First and foremost, the European Commission itself is interested in what impact
the spending has generated over the years. In addition, there are many organizations and individuals
in Europe that have a stake in TEL, e.g. technology providers, technology adopters, and higher
education institutes, to name a few (see [16] for a more comprehensive list of TEL-Map stakeholders).
To address the issue of generating such information based on strong and weak signals in a variety of
(web) sources, one core threads pursued in TEL-Map includes the application of social network
analysis and visualization as well as topic mining.
This deliverable reports on social network analysis and topic mining work performed in WP4, “Weak
Signal Analysis—Emerging Reality,” to support weak signal analysis and the mapping of the current
TEL landscape. To achieve this, the deliverable outlines the conceptual foundations of the TEL-Map
Mediabase, where all underlying data sources were stored, and presents first results of the analyses.
The main task underlying the work reported in this deliverable is Task 3 in WP4, which comprises the
following objectives:
• TEL-Map Mediabase: Based on the PROLEARN Mediabase the aim was to develop a TEL-
Map Mediabase, which shall contain social media artifacts and related resources to support
the mapping of the TEL landscape and complement the Delphi-based weak signal analysis
approach reported in D4.1 [23]. The focus in the TEL-Map Mediabase shall be on issues,
topics, and structures of relevance to TEL. This required a filtering of existing Mediabase
content, an extension of the sources fed into Mediabase with TEL-related content and
development of new tools to support analyses of these extended sources. The TEL-Map
Mediabase is presented in Section 2.
• Social Network Analysis: One of the pillars of the analysis methodology in WP4 is social
network analysis (SNA) of actors involved in TEL and their relationships. “Actor” is meant as
an abstract concept in this context, which can refer to various kinds of entities like people,
conferences, projects, publications, and so forth. SNA offers highly effective methods for
obtaining interactive visualizations and network metrics for these social networks, allowing
the identification of the most important actors from a wide range of perspectives. In this
deliverable the focus is on analysis of TEL projects and organizations involved in those
projects (Section 3); TEL papers, authors and publication outlets (Section 4); and TEL social
media sources (Section 5).
• Topic Mining: In addition to the network-metrics and structural analysis approach taken in
SNA, the analysis methodology shall be complemented with a topic mining approach. The
objective is to identify bursty topics, shifts in topics, emerging/declining topics from a variety
of sources in TEL, achieving a structural-semantic analysis of signals. This is tackled in
combination with SNA in Sections 3 through 5.

– 2 –
• Continuous analysis: As indicated in the title, this deliverable was conceived to present a
first analysis report, while TEL stakeholders shall be supported in continuously obtaining up-
to-date analysis results from the Mediabase web interfaces. This requires web-based tools for
continuous analysis of TEL sources (dealt with in Section 6) and an online resource page
where data sets and data processing components can be accessed and/or downloaded. For the
latter goal, a resource page was set up on the TEL-Map homepage. This D4.3 resource page is
available at http://telmap.org/?q=content/d4.3 and will be continuously updated with
pointers to results obtained, tools developed, and analyses performed in WP4—Task 3, which
will continue to run until the end of the project.
In regard to the embedding of this work into TEL-Map’s overall WP structure, the WP4’s mission—i.e.
the identification of weak signals that can inform the overall road-mapping process—also requires us
to propel the convergence of different analytical methods. For instance, this can be achieved in WP4 by
feeding results from one analytical method into another one in order to cross-validate and enrich
existing findings, but it also needs to happen between WPs, e.g. by informing WP5’s gap analysis and
WP3’s scenario building. Gap analysis aims to explore why some technologies seem to be much more
prominent in TEL research than in TEL practice (e.g. consider the uptake of 3D worlds) and other
technologies are slowly becoming mainstream with no matching amount of research available (e.g.
laptops in schools or social media at the workplace). Here, weak signals can inform an in-depth
analysis of specific technologies by considering the spread of awareness of that technology across
various communities as well as the use of synonyms referring to the same set of issues but under
different labels. Likewise, scenario building events (WP3) can be informed through weak signals as
they are early indicators of change that have the potential to alter the future of TEL adopters and TEL
providers. In this context, scenarios that consciously consider weak signals increase their robustness,
leading to better strategic planning processes.
This deliverable is structured as follows. In Section 2 we introduce the TEL-Map Mediabase,
containing data relevant to TEL in terms of projects, publications, and social media. Each of the
subsequent sections presents first analyses performed and results obtained in the TEL-Map Mediabase
sources, i.e. TEL projects in Section 3, TEL publications in Section 4, and TEL blogosphere in
Section 5. An embeddable, widget-based toolkit for enabling stakeholders to query and visually
interact with the data contained in the TEL-Map Mediabase is presented in Section 6. Section 7 draws
key findings from the analysis for weak signals collection from the core analysis sections, and Section 8
wraps up the deliverable with a discussion of limitations and an outlook on upcoming work in WP4.
2 The TEL-Map Mediabase TEL-Map Mediabase is an evolution of the established PROLEARN Mediabase. In this section we first
describe the original idea and concept of Mediabase and continue with detailing the structure, content,
and meta-model of the enhanced TEL-Map Mediabase.
In the PROLEARN project1, a TEL project funded by the European Commission under FP6, one core
effort was the creation and maintenance of a media base for TEL in Europe, providing different target
audiences like scientists, policy makers, and communities of practice with digital information obtained
from mailing lists, newsletters, blogs, RSS/Atom feeds, websites, and so forth [10]. In addition to
collecting large amounts of data, one key objective was the provision of easy-to-use end-user tools for
extracting and presenting relevant information contained in the Mediabase, e.g. for cross-media social
network analysis, self-observation and self-modeling of communities [18], collaborative
administration and retrieval of media artifacts, etc. The key concepts in the metamodel of the
PROLEARN Mediabase are (cf. [10], p. 248-9):
1 http://www.prolearn-project.org

– 3 –
• Community as a sub-network of the whole network, representing trustful relations among its
members;
• Process as a value-adding set of activities performed by community members, e.g. acquisition,
retrieval, monitoring;
• Actor as humans, users or groups of humans/users performing and being affected by
processes;
• Medium as an artifact produced or consumed by processes.
For the development of the TEL-Map Mediabase, particular emphasis was put on the TEL
blogosphere, which is being observed and continuously retrieved using special-purpose crawlers (cf.
[9]); the blogosphere sources in the Mediabase were extended by the TEL-Map members. In addition,
the artifacts stored and indexed in the Mediabase were extended with digital information on European
TEL projects as well as publications in TEL-related conferences and journals.
2.1 Conceptual Model of the TEL-Map Mediabase
TEL-Map aims to empower stakeholders to find relevant projects and useful outputs as well as new
collaborators for TEL projects; it also aims at giving a rich overview of different types of actors
involved in the TEL domain (see DoW, p. 17-18). WP4 in particular focuses on analyses and
visualizations from social media items gathered and automatically crawled from relevant sources. To
realize these ambitious objectives, we have enhanced and extended the metamodel and the content of
the existing PROLEARN Mediabase. This enhanced TEL-Map Mediabase additionally includes
information on TEL projects and participants funded by the European Commission, as well as authors
and their papers published in TEL-related conferences and journals.
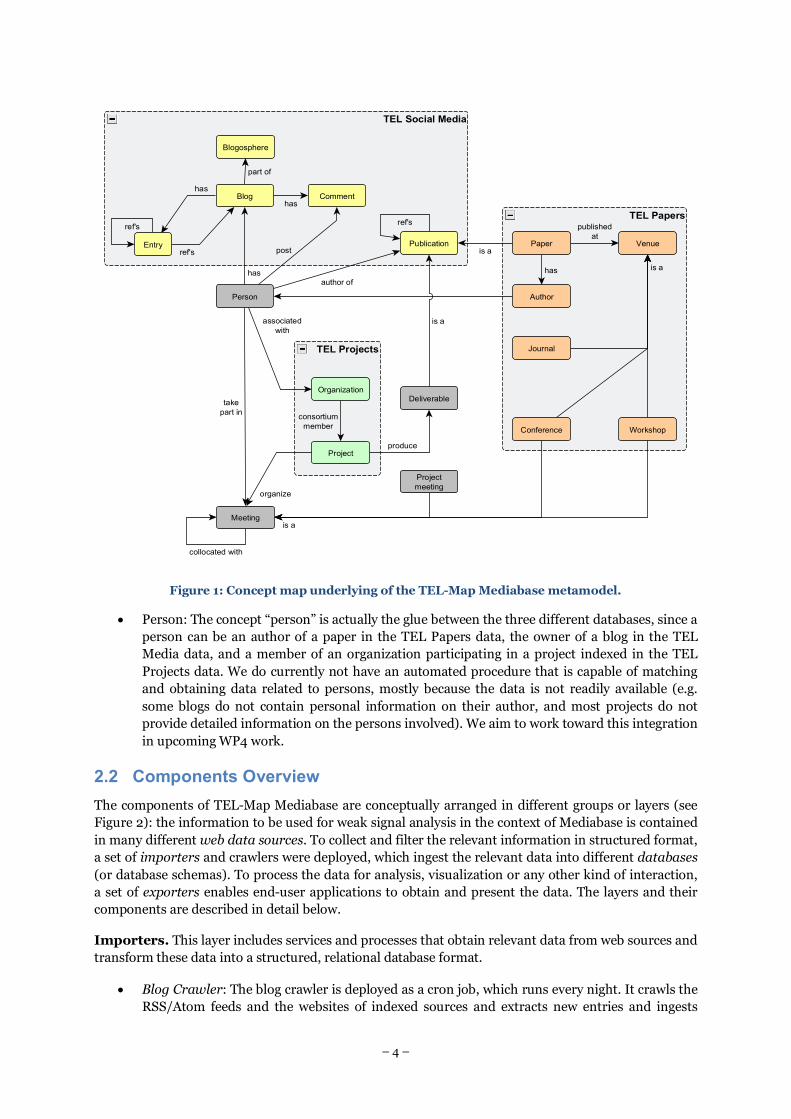
The conceptual model of TEL-Map Mediabase is displayed in Figure 1. It exposes three main areas:
• TEL Social Media: blogs, feeds, and blog entries; currently focusing on the blogosphere that
includes TEL-related blog sources.
• TEL Projects: information on projects funded by the European Commission under FP6, FP7,
and eContentplus, including information on participating organizations.
• TEL Papers: information on papers published in TEL-related journals, conferences, and
workshops.
For each of these three areas there is a dedicated database schema. These schemas are described in
detail in the relevant sections. There are several components (crawlers, importers, exporters, and end-
user tools) which were developed to obtain the relevant data, to feed the data into the database, as well
as to extract and interact with the data. These are described in Section 2.2.
Limitations. While the TEL-Map Mediabase databases contain an enormous amount of data, there
are several concepts and their links in Figure 1 which are currently not or only partly represented in
the data. These include:
• Meeting and Project Meeting: While we have data on conference and workshop events in the
TEL Papers database, we do not yet have data on project meetings (some of which are
collocated with other events). This information is missing since there we do not yet have
mechanisms of automatically obtaining these data.
• Deliverable: Project deliverables are also not yet included. This can be done in the future by
crawling the web pages of the projects stored in our TEL Projects database. However, we
expect that manual editing will be required, since the deliverable pages are not uniform across
different projects. For some projects, the deliverables cannot be found at all on the project
website.
– 4 –
• Person: The concept “person” is actually the glue between the three different databases, since a
person can be an author of a paper in the TEL Papers data, the owner of a blog in the TEL
Media data, and a member of an organization participating in a project indexed in the TEL
Projects data. We do currently not have an automated procedure that is capable of matching
and obtaining data related to persons, mostly because the data is not readily available (e.g.
some blogs do not contain personal information on their author, and most projects do not
provide detailed information on the persons involved). We aim to work toward this integration
in upcoming WP4 work.
2.2 Components Overview
The components of TEL-Map Mediabase are conceptually arranged in different groups or layers (see
Figure 2): the information to be used for weak signal analysis in the context of Mediabase is contained
in many different web data sources. To collect and filter the relevant information in structured format,
a set of importers and crawlers were deployed, which ingest the relevant data into different databases
(or database schemas). To process the data for analysis, visualization or any other kind of interaction,
a set of exporters enables end-user applications to obtain and present the data. The layers and their
components are described in detail below.
Importers. This layer includes services and processes that obtain relevant data from web sources and
transform these data into a structured, relational database format.
• Blog Crawler: The blog crawler is deployed as a cron job, which runs every night. It crawls the
RSS/Atom feeds and the websites of indexed sources and extracts new entries and ingests
Figure 1: Concept map underlying of the TEL-Map Mediabase metamodel.
take
part in
collocated with
TEL Papers
is a
published
at
is ahas
Conference
Paper
Workshop
Venue
Journal
Author
TEL Projects
consortium
member
organize
produce
associated
with
Project
Organization
TEL Social Media
author of
is a
is a
ref's
has
ref's
part of
ref's
has
post
has
Publication
Blog
Blogosphere
Entry
Comment
Project
meeting
Deliverable
Meeting
Person

– 5 –
those into the database. Upon ingestion it not only stores the raw HTML of the entries; it also
extracts a plain-text, non-markup version of the content, the comments associated with each
blog entry, the URLs it references, and it computes burstiness of terms occurring in blog
entries. The blogs scheduled for indexing are entered in two ways: (1) directly through the
Mediabase Commander on the Learning Frontiers portal, or (2) indirectly through the Feed
Aggregator, which is installed on the Learning Frontiers portal to collect links to relevant RSS
or Atom feeds. These feeds are automatically ingested into the TEL Media database by the
Feed Importer.
• Abstracts Crawler: The TEL Papers database contains data like title, authors and citations on
TEL-related papers. Since DBLP, the data source of the TEL papers database, does not contain
abstracts and keywords, the goal of this crawler is to enhance the basic paper information with
abstracts and keywords. The following conferences were crawled: ECTEL, ICWL, ICALT, ITS,
DIGITEL and WMTE. Since the crawler supports the abstract pages of springerlink.com
(Springer Verlag), computer.org and IEEExplore, the crawler can be used to crawl many more
conferences. The crawler is written in Ruby using the Mechanize Library for extracting the
information from the HTML pages. The crawler does not directly interact with the TEL papers
database. Instead, desired information from the database has to be exported and imported as
CSV data.
• Feed Importer: One objective of TEL-Map is to analyze the voices in TEL to detect weak
signals. This required enriching the Mediabase with TEL-related social media artifacts2. On
the Learning Frontiers portal, we installed the aggregator module, which allows registered
2 See task 3 in the description of WP4 in the DoW, p. 39: “We will integrate current RSS aggregators to
enhance the contents of the Mediabase.”
Figure 2: TEL-Map Mediabase components overview model.
Legend
Data Flow
Service /
Process
Database
End-User
Application
Query Widgets
Query
Visualizer
Query
Explorer
Data Processing Apps
R Excel
Matlab ...
Graph Visualization
and Analysis Apps
yEd
Gephi ...
Graphviz
LearningFrontiers
Portal
Feed
Aggregator
Mediabase
Commander
Exporters
CSV Data
Exporter
GraphML
Exporter
Visualization
Widget Creator
Web Data Sources
European Community
Information PagesDBLP
Bibliography
Publisher
PagesBlogosphere
Importers
Projects
Crawler
DBLP
Importer
Abstracts
Crawler
Feed
Importer
Blog
Crawler
Databases
TEL Projects TEL Papers TEL Media
– 6 –
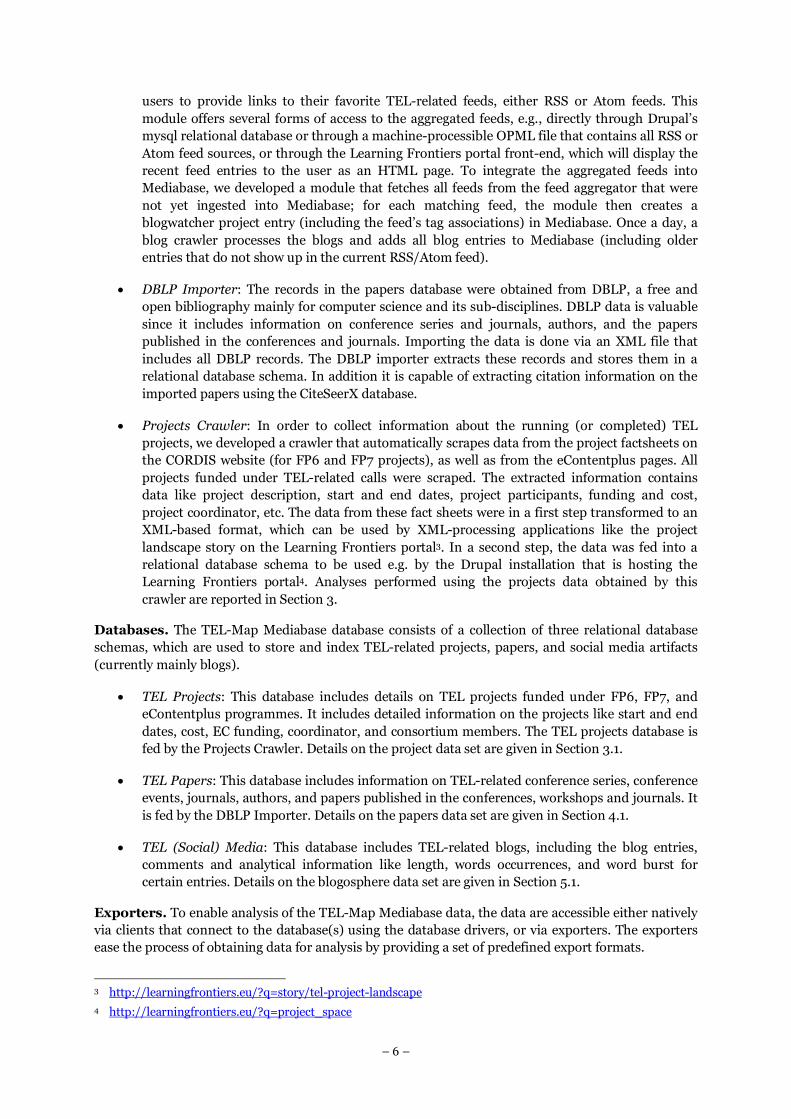
users to provide links to their favorite TEL-related feeds, either RSS or Atom feeds. This
module offers several forms of access to the aggregated feeds, e.g., directly through Drupal’s
mysql relational database or through a machine-processible OPML file that contains all RSS or
Atom feed sources, or through the Learning Frontiers portal front-end, which will display the
recent feed entries to the user as an HTML page. To integrate the aggregated feeds into
Mediabase, we developed a module that fetches all feeds from the feed aggregator that were
not yet ingested into Mediabase; for each matching feed, the module then creates a
blogwatcher project entry (including the feed’s tag associations) in Mediabase. Once a day, a
blog crawler processes the blogs and adds all blog entries to Mediabase (including older
entries that do not show up in the current RSS/Atom feed).
• DBLP Importer: The records in the papers database were obtained from DBLP, a free and
open bibliography mainly for computer science and its sub-disciplines. DBLP data is valuable
since it includes information on conference series and journals, authors, and the papers
published in the conferences and journals. Importing the data is done via an XML file that
includes all DBLP records. The DBLP importer extracts these records and stores them in a
relational database schema. In addition it is capable of extracting citation information on the
imported papers using the CiteSeerX database.
• Projects Crawler: In order to collect information about the running (or completed) TEL
projects, we developed a crawler that automatically scrapes data from the project factsheets on
the CORDIS website (for FP6 and FP7 projects), as well as from the eContentplus pages. All
projects funded under TEL-related calls were scraped. The extracted information contains
data like project description, start and end dates, project participants, funding and cost,
project coordinator, etc. The data from these fact sheets were in a first step transformed to an
XML-based format, which can be used by XML-processing applications like the project
landscape story on the Learning Frontiers portal3. In a second step, the data was fed into a
relational database schema to be used e.g. by the Drupal installation that is hosting the
Learning Frontiers portal4. Analyses performed using the projects data obtained by this
crawler are reported in Section 3.
Databases. The TEL-Map Mediabase database consists of a collection of three relational database
schemas, which are used to store and index TEL-related projects, papers, and social media artifacts
(currently mainly blogs).
• TEL Projects: This database includes details on TEL projects funded under FP6, FP7, and
eContentplus programmes. It includes detailed information on the projects like start and end
dates, cost, EC funding, coordinator, and consortium members. The TEL projects database is
fed by the Projects Crawler. Details on the project data set are given in Section 3.1.
• TEL Papers: This database includes information on TEL-related conference series, conference
events, journals, authors, and papers published in the conferences, workshops and journals. It
is fed by the DBLP Importer. Details on the papers data set are given in Section 4.1.
• TEL (Social) Media: This database includes TEL-related blogs, including the blog entries,
comments and analytical information like length, words occurrences, and word burst for
certain entries. Details on the blogosphere data set are given in Section 5.1.
Exporters. To enable analysis of the TEL-Map Mediabase data, the data are accessible either natively
via clients that connect to the database(s) using the database drivers, or via exporters. The exporters
ease the process of obtaining data for analysis by providing a set of predefined export formats.
3 http://learningfrontiers.eu/?q=story/tel-project-landscape
4 http://learningfrontiers.eu/?q=project_space

– 7 –
• CSV Data Exporter: Includes a set of scripts that export data contained in the databases into
CSV format (CSV = comma separated values). These CSV files are supported by most data
processing applications like Excel, R, SPSS, and so forth.
• GraphML Exporter: Data can also be exported as graphs for social network analysis. The data
is exported in the most common graph exchange format, i.e. the XML-based GraphML
language. These GraphML files can be imported, visualized, and analyzed in graph
visualization and analysis applications like yEd, Gephi, or the igraph library for R. For many
other graph visualization and analysis software packages, there are conversion tools from and
to GraphML.
• Query Visualizer and Query Explorer: interacting with social network visualizations reaches
its limits when it comes to specific queries that focus on selected aspects of the data set or the
network graphs. To enable efficient end-user interaction with the data, we implemented a set
of query visualization widgets. These widgets can be embedded on any web page (e.g. in
iGoogle) and allow direct querying of the databases using SQL. The unique feature of these
widgets is that they can be used to visualize the query results in different formats (e.g. table,
pie chart, timeline, or graph) and that they can export the visualization of any given query as a
widget. Additionally, CSV and GraphML export (see above) of query results is supported by
the explorer widget. More details in Section 6.
Applications. End-users will mostly interact with the data through applications like Excel, R, and the
Learning Frontiers portal. While Figure 2 includes many example applications, the following list only
focuses on those that were developed for TEL-Map:
• Learning Frontiers Portal: The Learning Frontiers portal is the single-access-point portal to
results generated in the TEL-Map project. It includes two apps that can be used to contribute
to content generation in the TEL Media database: The Mediabase Commander enables adding
blogs directly to the database, and the Feed Aggregator is a Drupal module that we installed to
allow users to collect relevant feeds. The feeds are ingested into the database at regular
intervals by the Feed Importer. Note that Mediabase Commander (MBC) is also available as a
Firefox add-on.
• Query Widgets: We developed a set of widgets that can be used to (a) query the TEL-Map
Mediabase databases using SQL, (b) to automatically visualize the query results in different
formats, (c) export the query result in different formats, and (d) to export a query visualization
as a self-contained widget that can be embedded into any web site.
2.3 Analysis Approach
This deliverable reports on first results of using social network analysis (SNA) and topic mining on the
data stored in the TEL-Map Mediabase. SNA contributes to the structural analysis of actors and their
relationships and topic mining contributes to the semantic analysis of actors and relationships
between actors. The combination of SNA and topic mining thus enables the structural-semantic
analysis of TEL sources.
Social Network Analysis (SNA) is one of the work threads pursued in WP4 of TEL-Map to detect
weak signals [23, 6] indicating future directions and insight into collaboration and communication
networks in different types of media and settings. SNA constitutes a rather new field of research and
its application to digital libraries is very promising in terms of knowledge discovery [19, 20]. SNA
defines techniques used to compute metrics of different actors in a social network. These metrics
typically represent the importance of actors within their network or neighborhood, e.g. their centrality,
connectedness, etc.

– 8 –
To enable the calculation of SNA metrics for the data in TEL-Map Mediabase, the entities stored in the
Mediabase need to be modeled as a social network. A social network is modeled as a graph � = ��, �� with � being the set of vertices (or nodes) and � being the set of edges connecting the vertices with one
another [2]. Any “actor” entity in the Mediabase can be modeled as a vertex, if it is connected to other
actors through any relationship of interest (modeled as edges) that can be obtained from the
Mediabase data. For instance, consider the following social network graphs:
• TEL projects can be modeled as nodes and overlaps in the consortia of any two projects can be
modeled as edges;
• Organizations can be modeled as nodes, while projects in which organizations collaborated
can be modeled as edges;
• Persons can be modeled as nodes, while co-authorships on papers relevant to TEL can be
modeled as edges;
• Papers can be modeled as nodes, while citations between papers can be modeled as edges;
• Blogs can be modeled as nodes, while links between the blogs’ entries can be modeled as
edges.
There are several different, yet complementary methods of gaining insight into the modeled social
network graphs:
(1) Visual interaction: The graph can be visualized using graph visualization software (like yEd,
Graphviz, or Gephi). Similar to maps software like Google Maps, graph visualization software typically
allows the user to zoom (vertical filter) into the visualization and to pan the visualized graph
(horizontal filter). In addition these tools often offer graph layout algorithms, which can be used to
align the vertices in a predefined shape (e.g. circular, organic, hierarchical, etc.). Graph visualization
generally provides a holistic, condensed view on the overall network.
(2) Data querying: Interacting with graph visualizations will typically spawn more specific questions
and exploratory tasks [5]. Some of these explorations cannot be performed using the visualization
alone, e.g. the number of shortest paths through the network that lead through a particular node. Such
results can be obtained by enabling querying into the graph data. We developed a web-based toolkit for
enabling this (see Section 6).
(3) SNA Metrics: SNA allows the computation of different metrics for the graph, its nodes and its
edges. In the SNA reported in this deliverable, we mainly focus on the following metrics:
• Avg. shortest path length: this is a graph metric that represents the average length of all
shortest paths through the network. Over time this metric will grow quickly initially, but slows
down or may even shrink in “mature” graphs.
• Diameter: This represents the length of the longest shortest path through the network. In
isolation this value will not be very informative; it is useful however for comparing network
development over time (see e.g. Section 3.4.3).
• Largest connected component: This measure represents the number (or the share) of nodes
that are connected with each other in the largest sub-network of the graph. The lower this
value, the higher the fragmentation in the network.
• Density: This metric represents the ratio between the number of existing connections in the
graph and the number of possible connections. The higher this value, the higher the
connectedness of the nodes. One observation of interest is the development of density over

– 9 –
time, when new nodes join the graph, to see whether these new nodes inter-connect tightly
with the existing ones.
• Betweenness centrality: The betweenness centrality of a node represents the share of shortest
paths through the network that pass through that node. The betweenness centrality is typically
higher for nodes that connect (“bridge”) two or more sub-networks (also called “connected
components”) in the network. For instance, an author who works in the intersection of
artificial intelligence and technology-enhanced learning is likely to have a higher betweenness
centrality in a co-authorship network than a person in the same network who only publishes
with members of the core artificial intelligence community.
• Degree centrality: The degree of a node is represented by the number of its direct ties with
other nodes, i.e. edges coming in and leading out of that node. Typically this value is
normalized into a value between 0 and 1 by dividing the degree of a node by the number of
other nodes in the graph. This is the simplest centrality measure for network analysis
• Closeness centrality: This measure is used to determine how close a node is to all other nodes
that are reachable via edges. The closeness centrality is obtained by computing the mean
length of these (shortest) paths. Nodes with a favorable closeness centrality are important
nodes in the sense that they can easily reach other nodes for collaboration, information, or
influence.
• PageRank: This measure became widely known through Google’s use of it for ranking web
sites by importance [17]. The PageRank of a node depends on the PageRank of nodes
connected to it. So a node being connected to another node that is important makes the source
node more important, too. With increasing distance between nodes this “diffusion” of
importance to other nodes is gradually reduced by a damping factor.
• Clustering coefficient: The clustering of a node (local clustering) measures how strongly the
neighborhood of the node tends towards forming a clique, where every two nodes are
connected by an edge. The clustering coefficient of the whole network is obtained by
computing the average local clustering coefficient of its nodes.
• Authorities and Hubs: authorities refer to nodes that represent authoritative sources of
information in the network that are being pointed to by good hubs; a good hub is a node that
point to many good authorities [12]. Thus there is a circular dependency between these two
metrics.
Topic Mining is an approach for discovering knowledge from text sources. Typically topics are
described by word distributions and sometimes also time distributions (cf. [24]). In the context of this
deliverable we use a simplified approach to topic mining that mainly focuses on term stems and their
frequency of appearance in the content entities stored in the Mediabase (e.g. blog text, paper abstracts,
project descriptions) at a particular point in time or in a particular time window. For the first
structural-semantic analyses reported in this deliverable, we focused on a “big picture” approach to
complementing social network metrics with content analysis for different sources and actors in the
TEL-Map Mediabase. This includes:
• For illustrating topic distribution in large sources we filtered the sources by identifying sources
that are linked to key actors in the community (e.g. central organizations in projects, entries of
central blogs). Following this, we present the core topics represented in these sources either
through word clouds or through analysis of rising and falling frequency of topic occurrence in
the sources.

– 10 –
• Building on the topic mining approach of selected TEL conferences in D4.1, we filtered the
results for sources that were contributed by key authors in these conferences’ co-authorship
networks and extracted weak signals there.
2.4 Potential Questions
The combined results of SNA and topic mining can give rich insight into the available data and be used
to detect and explore potential signals (both strong and weak ones) in the data. The matrix in Table 1
gives a brief overview of questions addressed by using SNA and topic mining on the different data
sources in the TEL-Map Mediabase.
Table 1: Uses of social network analysis and topic mining in the TEL-Map Mediabase.
Social Network Analysis Topic Mining
TEL Papers • Most central authors in TEL
• Most frequent collaborations on TEL
papers
• Most important TEL conferences and
journals
• Development characteristics of
authorship networks in TEL conferences.
• Rising and falling terms in TEL paper
abstracts and keywords
• Topics addressed by most important
TEL authors/papers
TEL Projects • Consortium progression between
projects
• Partner collaborations across TEL
projects
• Most central organizations in TEL
projects
• Most central TEL projects
• Development of SNA metrics in project
collaboration network over time
• Topic distribution and shifts in TEL
project foci over time
• Funding and partners related to topics
in TEL projects
TEL Media • Citation network in TEL blogs
• Most central web sources referenced in
TEL blogs
• Authorities and hubs in the TEL
blogosphere
• Co-occurrence of words/bursts in blog
entries
• Topic bursts in TEL blogs over time
• Recently appearing topics
• Topics with a rising frequency over the
last years
In the following, we elaborate more on the objectives and potential signals that can be identified by
tackling the questions outlined in Table 1.
TEL Papers Social Network Analysis and Topic Mining:
• Most central authors in (European) TEL: identifies authors that have a central position in the
co-authorship and citation network of TEL papers; these authors are likely to have authority
regarding the focus of current TEL research and directions for future TEL research, which can
be analyzed using topic mining.
• Most frequent collaborations in TEL: Since TEL research is collaborative work, the
identification of most important authors is complemented with collaboration frequency to
identify strong ties between authors and communities.

– 11 –
• Most important TEL conferences and journals: identifying the most important outlets for
publishing TEL research results will indicate venues where TEL key people meet for exchange
and collaboration. Knowing the core TEL conferences will facilitate researchers in finding
relevant collaborators.
• Development characteristics of TEL conferences: identifies patterns of development of
authorship networks, which will reveal several insightful network characteristics, e.g. whether
the TEL community is a fragmented community, whether TEL conferences develop like
conferences in other disciplines, etc.
• Rising and falling terms in TEL papers: analysis of these terms will reveal topics and topic
shifts in published TEL research. Of course, published TEL research is only a fraction of the
research actually performed, and typically conference papers are up to one year behind the
actual research work. For journal papers this lag is even worse, since journal papers often
appear only 2-3 years after submission of the manuscript.
• Topics addressed by prolific authors: Prolific or otherwise central authors identified in the co-
authorship networks of different (sets of) publication outlets can be used for revealing topics
that likely have impact on current and future work.
TEL Projects Social Network Analysis and Topic Mining:
• Consortium progression between projects and partner collaborations across TEL projects: this
will identify organizational collaboration between different (consecutive and concurrent)
projects that sustain beyond the lifetime of one project’s consortium. Strong partnership ties
between organizations on the one hand, and new project funding for participants of a project
may indicate fruitful and successful collaboration in that project and can thus be considered as
an indicator of project success.
• Most central TEL projects: analysis of consortium progression will also identify the most
central projects in terms of having the largest consortium overlap with other projects,
connecting different succeeding and preceding projects, and similar centrality measures.
• Most central organizations in TEL projects: SNA can be used to identify the most central
organizations in the TEL collaboration network in terms of number of connections, closeness
to other organizations in the network, and connections between different organizational
clusters or sub-networks.
• Development of SNA metrics in project collaboration network over time: dynamic analysis of
the collaboration network in projects over different funding calls or years will identify several
characteristics of development patterns in the European TEL “market”, including development
of collaboration network characteristics over time, impact of new projects on the collaboration
network (e.g. introduction new organizations introduced by new projects) over time, and
impact of new organizations on the creation of new collaboration ties between organizations.
• Topic distribution in projects can be analyzed using the descriptions of projects or project
clusters which were previously identified by SNA.
TEL Media Social Network Analysis and Topic Mining:
• Citation network in TEL blogs: identifies the most central blogs and blog entries in the TEL
blogosphere and can be used in combination with topic mining on those blogs to identify
trending, upcoming, and declining topics.

– 12 –
• Most authoritative web sources referenced in TEL blogs: in addition to citing sources in the
blogosphere, bloggers reference all sorts of sources on the web; analyzing these can help to
identify the most authoritative (type of) sources on the web for TEL bloggers (this will be
tackled in upcoming WP4 work)
• Topic bursts in TEL blogs over time: based on frequently occurring words in social media
sources we are able to identify newly emerging terms and topics as well as topics with rising or
falling frequency. This analysis is enhanced by filtering for those blogs that have a central
position in the blogosphere.
3 Analysis of the European TEL Project Landscape There currently exists no readily available, structured data set on TEL projects funded in recent
programmes, with the exception of HTML factsheets offered on the web by the European Commission
as well as a load of project websites and deliverables produced by the project consortia. Turning
information overload into an opportunity is the driving vision of visual analytics [7], and this section
aims to achieve this vision in the context of TEL projects funded under FP6, FP7 and eContentplus
programmes by applying SNA and information visualization methods on projects and collaborations
within project consortia.
3.1 Data Set
Data Model. The database used for the analyses in this paper was scraped from publicly available
project information pages on CORDIS [4], i.e. the Community Research and Development Information
Service offered by the European Commission, and other European Community project information
pages. The scraped data was captured according to the data model presented in Figure 3 and fed into a
relational database. The data scraping was focused on TEL-related projects funded under FP6, FP7
and eContentplus.
Figure 3: Data model of TEL projects.
N
N 1
1
participateROLE
ACRONYM
DATE_START
COST FUNDING
TYPEDATE_ENDDESCRIPTION
CALLPROGRAMME
FACTSHEET_URLWEBSITE_URL RCN
Project
ID
Organization
COUNTRY
NAME
ID
TITLECONTRACT_NO
Geolocation
LONGITUDE
LATITUDE
ID
PRECISION
has_location
– 13 –
Information that was not available in CORDIS includes the geographical coordinates of project
members. These locations were semi-automatically obtained by invoking the Google Maps API and
Yahoo Maps API using the partner names and countries provided in the factsheets. Since some of the
partner names produced ambiguous geographical results, the geographical coordinates will not be
correct for some institutions. Also, the spelling of organization names and country names was
inconsistent in the project fact sheets in many cases; this was corrected manually (which still does not
guarantee correctness). Additionally, organizational name changes are not accounted for. For instance,
Giunti Labs S.R.L. was rebranded to eXact Learning Solutions in 2010. In the data set, these—and all
organizations with similar rebrandings—are represented as separate entities. Likewise, organizational
mergers are not accounted for, e.g. ATOS Origin and Siemens Learning, which merged in 2011.
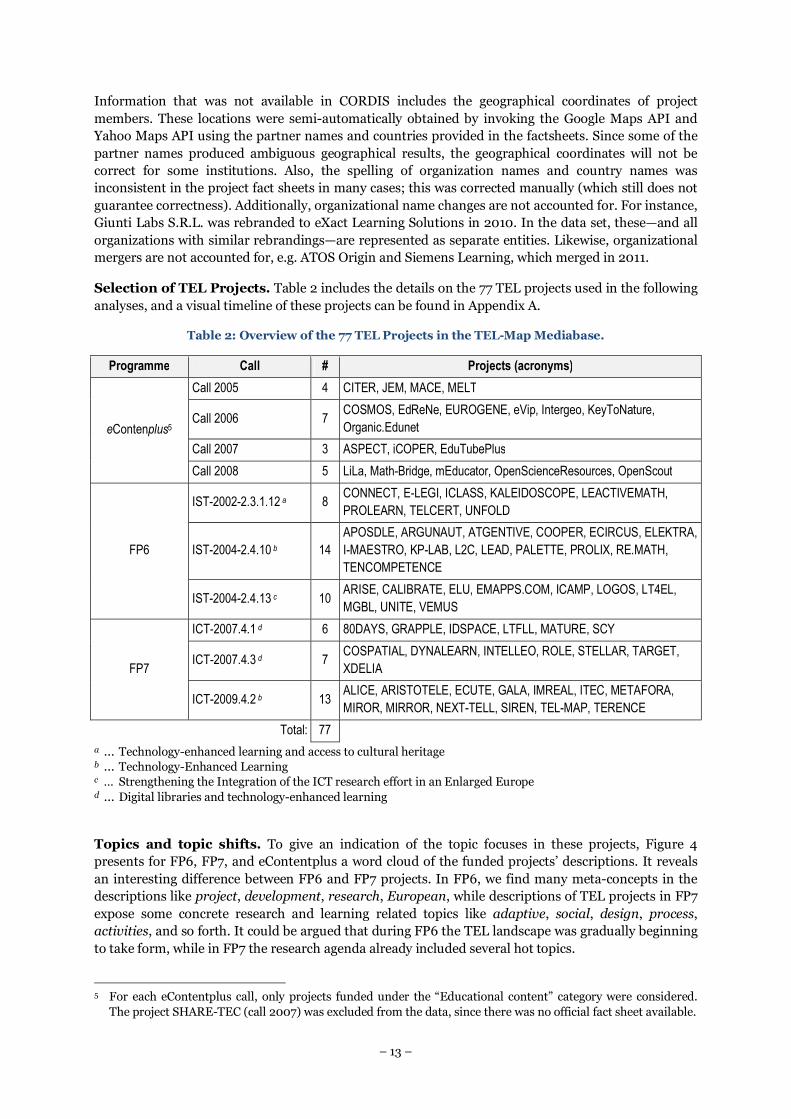
Selection of TEL Projects. Table 2 includes the details on the 77 TEL projects used in the following
analyses, and a visual timeline of these projects can be found in Appendix A.
Table 2: Overview of the 77 TEL Projects in the TEL-Map Mediabase.
Programme Call # Projects (acronyms)
eContenplus5
Call 2005 4 CITER, JEM, MACE, MELT
Call 2006 7 COSMOS, EdReNe, EUROGENE, eVip, Intergeo, KeyToNature,
Organic.Edunet
Call 2007 3 ASPECT, iCOPER, EduTubePlus
Call 2008 5 LiLa, Math-Bridge, mEducator, OpenScienceResources, OpenScout
FP6
IST-2002-2.3.1.12 a 8 CONNECT, E-LEGI, ICLASS, KALEIDOSCOPE, LEACTIVEMATH,
PROLEARN, TELCERT, UNFOLD
IST-2004-2.4.10 b 14
APOSDLE, ARGUNAUT, ATGENTIVE, COOPER, ECIRCUS, ELEKTRA,
I-MAESTRO, KP-LAB, L2C, LEAD, PALETTE, PROLIX, RE.MATH,
TENCOMPETENCE
IST-2004-2.4.13 c 10 ARISE, CALIBRATE, ELU, EMAPPS.COM, ICAMP, LOGOS, LT4EL,
MGBL, UNITE, VEMUS
FP7
ICT-2007.4.1 d 6 80DAYS, GRAPPLE, IDSPACE, LTFLL, MATURE, SCY
ICT-2007.4.3 d 7 COSPATIAL, DYNALEARN, INTELLEO, ROLE, STELLAR, TARGET,
XDELIA
ICT-2009.4.2 b 13 ALICE, ARISTOTELE, ECUTE, GALA, IMREAL, ITEC, METAFORA,
MIROR, MIRROR, NEXT-TELL, SIREN, TEL-MAP, TERENCE
Total: 77
a … Technology-enhanced learning and access to cultural heritage b … Technology-Enhanced Learning c … Strengthening the Integration of the ICT research effort in an Enlarged Europe d … Digital libraries and technology-enhanced learning
Topics and topic shifts. To give an indication of the topic focuses in these projects, Figure 4
presents for FP6, FP7, and eContentplus a word cloud of the funded projects’ descriptions. It reveals
an interesting difference between FP6 and FP7 projects. In FP6, we find many meta-concepts in the
descriptions like project, development, research, European, while descriptions of TEL projects in FP7
expose some concrete research and learning related topics like adaptive, social, design, process,
activities, and so forth. It could be argued that during FP6 the TEL landscape was gradually beginning
to take form, while in FP7 the research agenda already included several hot topics.
5 For each eContentplus call, only projects funded under the “Educational content” category were considered.
The project SHARE-TEC (call 2007) was excluded from the data, since there was no official fact sheet available.

– 14 –
Looking at eContentplus in comparison to FP6 and FP7, there is a strong emphasis on content and
metadata, while still including heavy use of educational and learning as terms. Content is a term
found also in FP6 with some frequency, but it is missing in the top term list of FP7, probably showing
that the eContentplus participants and the European Commission were targeting different foci.
3.2 TEL Projects as Social Networks
A TEL project—like any other collaborative type of project—can be modeled as a social network where
a number of partner organizations collaborate under coordination of a coordinating organization. A
social network is modeled as a graph � = ��, �� with � being the set of vertices (or nodes) and � being
the set of edges connecting the vertices with one another [2].
Let � be the set of projects, and let be the set of organizations involved in these projects. Function
represents the membership of any organization � ∈ in the consortium of any project ∈ � and is
defined as follows:
∶ � � → � ����,if� ∈ participated or particiaptes in ∈ ������,otherwise . The data model and these formal foundations enable powerful analyses and visualizations including
the project network, the organizational partnership network, temporal relationships between project
consortia, and the geographical mapping of organizations involved in projects. A selection of these
analyses is presented in the following sub-sections, focusing on these objectives:
• Visualizing and analyzing project consortium progression. By progression we mean
partnerships within project consortia that sustain beyond one single project. Investigating
these dynamics can be used to identify successful and strongly connected organizations
between consortia of different projects. This objective is tackled in Section 3.3.
• Visualizing and analyzing organizational collaborations within projects. Repeated
collaboration in projects will create strong ties between organizations. Computing social
network metrics for those connections will reveal the most important organizations currently
involved in TEL research. This objective is dealt with in Section 3.4.
FP6 FP7
eContentplus All TEL projects
Figure 4: Word clouds of project descriptions.
– 15 –
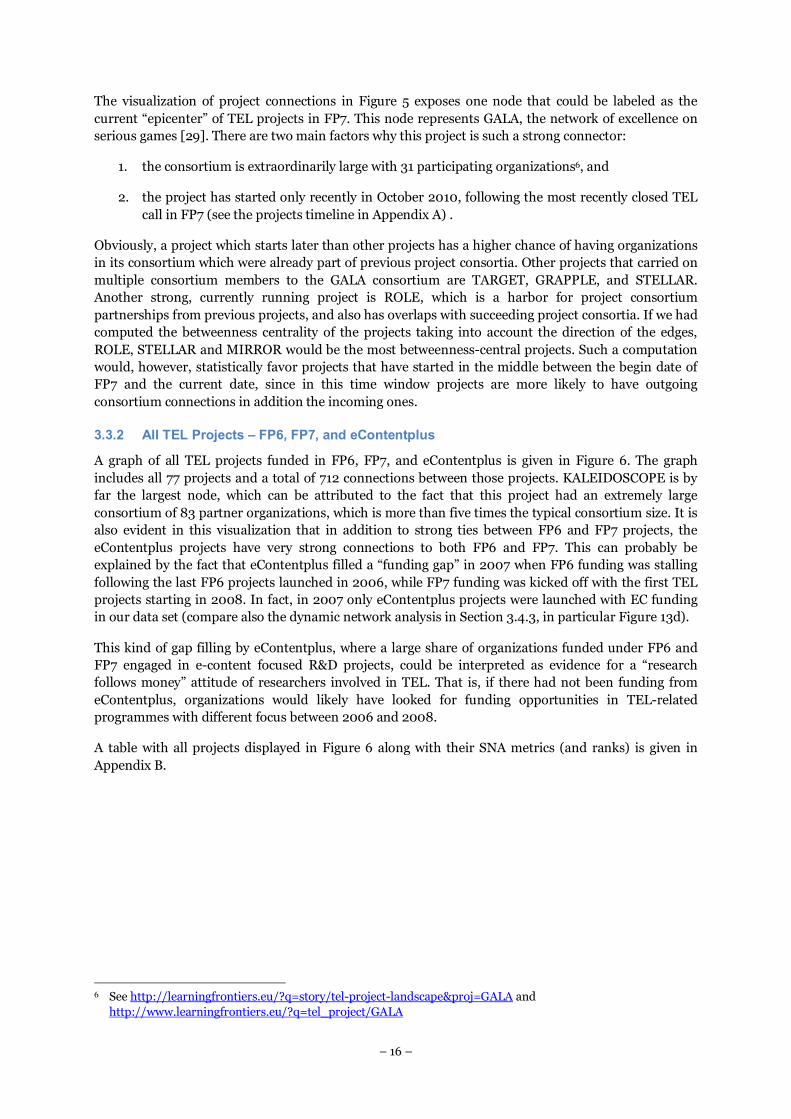
• Interactive visualization of geographical distribution of project consortia to complement the
social network metric-based approaches with geographical map overlays, identifying hotspots
in the European TEL landscape. This objective is dealt with in Section 3.5.
3.3 Project Consortium Progression
The project consortium progression graph �� = (�� , ��� contains projects and their relationships with
each other based on overlapping consortia. The graph will show projects as nodes and an edge between
two nodes if there is any organization that has participated in both projects, i.e. �� = �, and
�� = ���, �� ∶ �, � ∈ �� ∧ � ≠ � ∧ ∃� ∈ ∶ ��, �� ∧ ��, ��". �� can be modeled as a directed graph, which exposes the temporal progression of project consortia.
Each edge in this graph represents a temporal relationship between two connected projects: the edge
points from the project which started earlier to the project which started later.
3.3.1 FP7 Projects
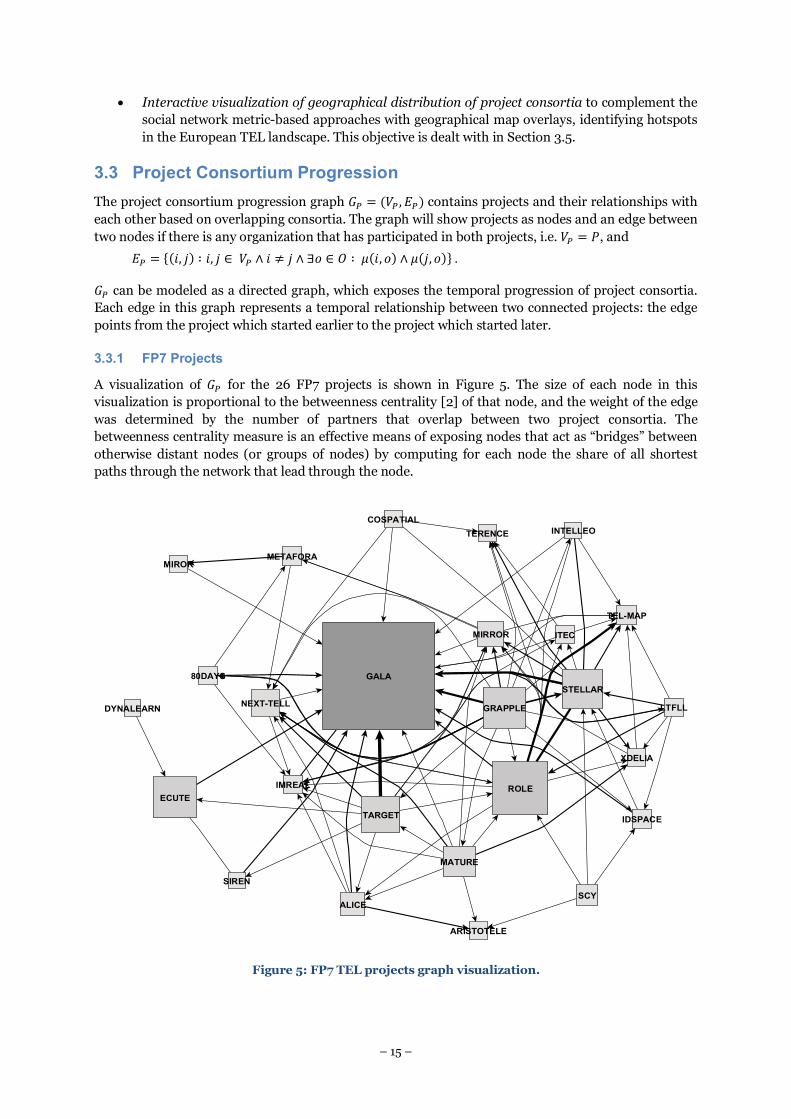
A visualization of �� for the 26 FP7 projects is shown in Figure 5. The size of each node in this
visualization is proportional to the betweenness centrality [2] of that node, and the weight of the edge
was determined by the number of partners that overlap between two project consortia. The
betweenness centrality measure is an effective means of exposing nodes that act as “bridges” between
otherwise distant nodes (or groups of nodes) by computing for each node the share of all shortest
paths through the network that lead through the node.
Figure 5: FP7 TEL projects graph visualization.
GRAPPLE LTFLL
SCY
TARGET
ARISTOTELE
ALICE
IMREAL
MATURE
MIROR
MIRROR
NEXT-TELL
GALA
ITEC
TERENCE
TEL-MAP
ECUTE
80DAYS
SIREN
INTELLEO
METAFORA
XDELIA
STELLAR
DYNALEARN
ROLE
COSPATIAL
IDSPACE
– 16 –
The visualization of project connections in Figure 5 exposes one node that could be labeled as the
current “epicenter” of TEL projects in FP7. This node represents GALA, the network of excellence on
serious games [29]. There are two main factors why this project is such a strong connector:
1. the consortium is extraordinarily large with 31 participating organizations6, and
2. the project has started only recently in October 2010, following the most recently closed TEL
call in FP7 (see the projects timeline in Appendix A) .
Obviously, a project which starts later than other projects has a higher chance of having organizations
in its consortium which were already part of previous project consortia. Other projects that carried on
multiple consortium members to the GALA consortium are TARGET, GRAPPLE, and STELLAR.
Another strong, currently running project is ROLE, which is a harbor for project consortium
partnerships from previous projects, and also has overlaps with succeeding project consortia. If we had
computed the betweenness centrality of the projects taking into account the direction of the edges,
ROLE, STELLAR and MIRROR would be the most betweenness-central projects. Such a computation
would, however, statistically favor projects that have started in the middle between the begin date of
FP7 and the current date, since in this time window projects are more likely to have outgoing
consortium connections in addition the incoming ones.
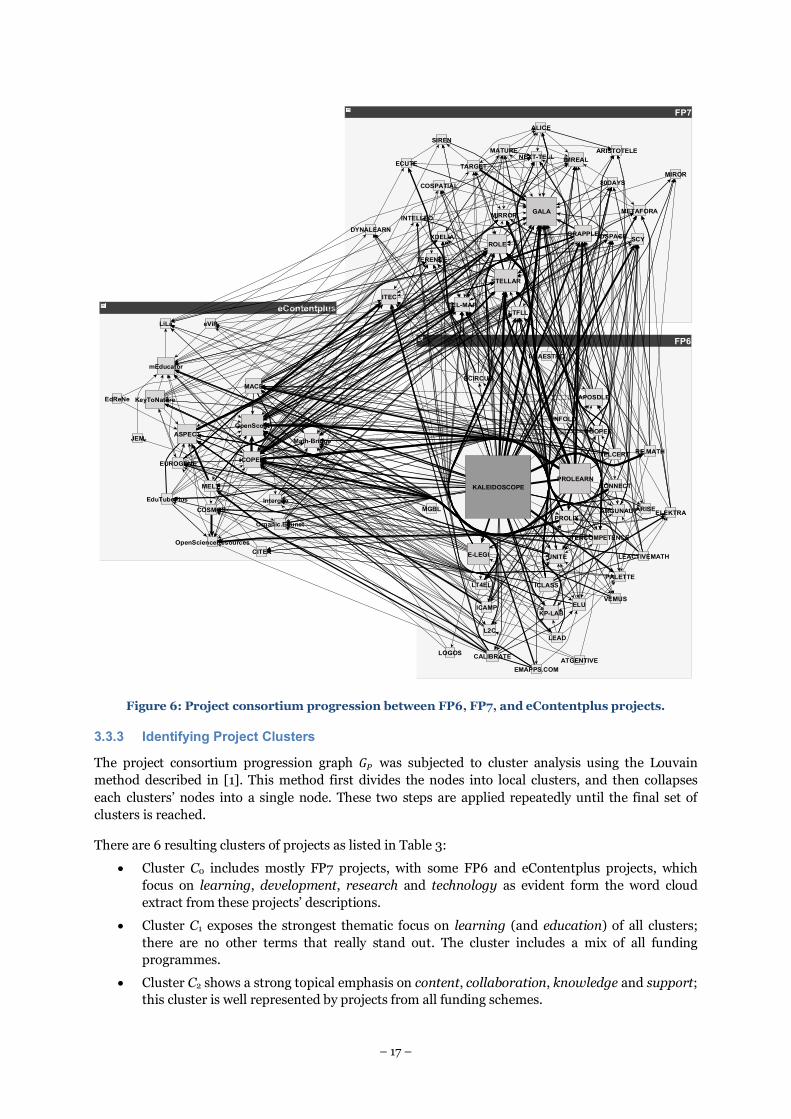
3.3.2 All TEL Projects – FP6, FP7, and eContentplus
A graph of all TEL projects funded in FP6, FP7, and eContentplus is given in Figure 6. The graph
includes all 77 projects and a total of 712 connections between those projects. KALEIDOSCOPE is by
far the largest node, which can be attributed to the fact that this project had an extremely large
consortium of 83 partner organizations, which is more than five times the typical consortium size. It is
also evident in this visualization that in addition to strong ties between FP6 and FP7 projects, the
eContentplus projects have very strong connections to both FP6 and FP7. This can probably be
explained by the fact that eContentplus filled a “funding gap” in 2007 when FP6 funding was stalling
following the last FP6 projects launched in 2006, while FP7 funding was kicked off with the first TEL
projects starting in 2008. In fact, in 2007 only eContentplus projects were launched with EC funding
in our data set (compare also the dynamic network analysis in Section 3.4.3, in particular Figure 13d).
This kind of gap filling by eContentplus, where a large share of organizations funded under FP6 and
FP7 engaged in e-content focused R&D projects, could be interpreted as evidence for a “research
follows money” attitude of researchers involved in TEL. That is, if there had not been funding from
eContentplus, organizations would likely have looked for funding opportunities in TEL-related
programmes with different focus between 2006 and 2008.
A table with all projects displayed in Figure 6 along with their SNA metrics (and ranks) is given in
Appendix B.
6 See http://learningfrontiers.eu/?q=story/tel-project-landscape&proj=GALA and
http://www.learningfrontiers.eu/?q=tel_project/GALA
– 17 –
3.3.3 Identifying Project Clusters
The project consortium progression graph �� was subjected to cluster analysis using the Louvain
method described in [1]. This method first divides the nodes into local clusters, and then collapses
each clusters’ nodes into a single node. These two steps are applied repeatedly until the final set of
clusters is reached.
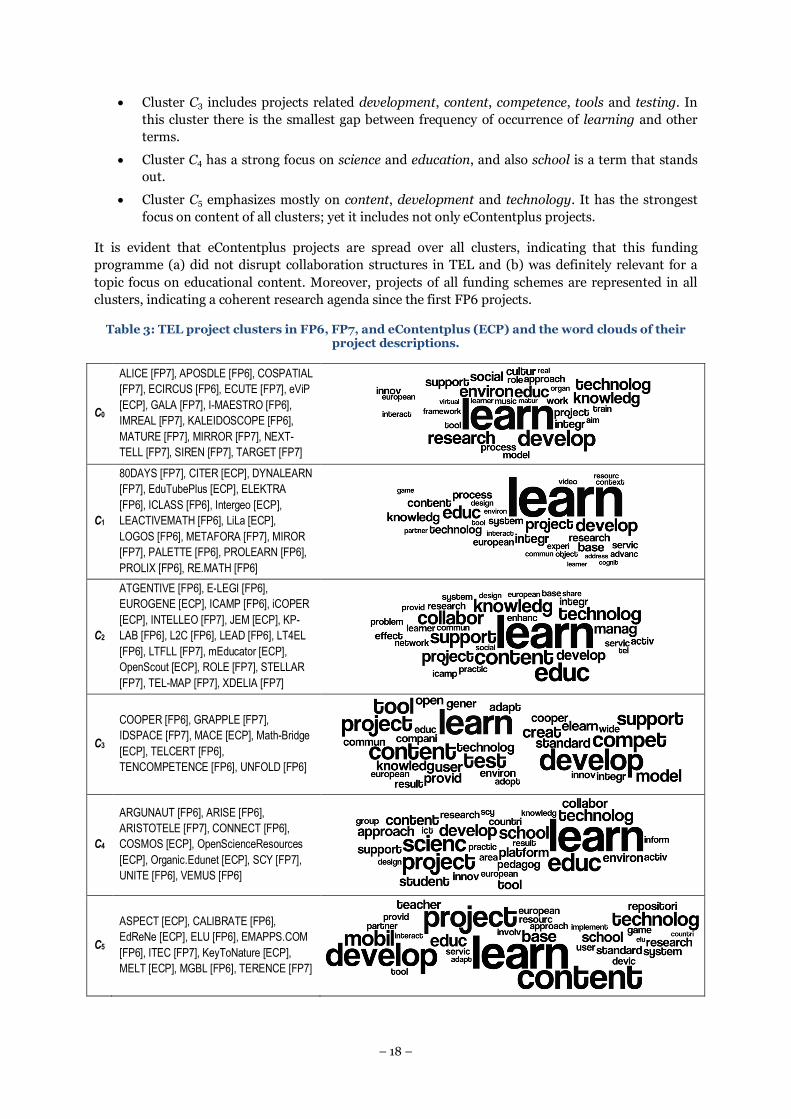
There are 6 resulting clusters of projects as listed in Table 3:
• Cluster C0 includes mostly FP7 projects, with some FP6 and eContentplus projects, which
focus on learning, development, research and technology as evident form the word cloud
extract from these projects’ descriptions.
• Cluster C1 exposes the strongest thematic focus on learning (and education) of all clusters;
there are no other terms that really stand out. The cluster includes a mix of all funding
programmes.
• Cluster C2 shows a strong topical emphasis on content, collaboration, knowledge and support;
this cluster is well represented by projects from all funding schemes.
Figure 6: Project consortium progression between FP6, FP7, and eContentplus projects.
eContentplus
mEducator
OpenScout
LiLa
OpenScienceResources
Math-Bridge
EduTubePlus
iCOPER
ASPECT
Organic.Edunet
Intergeo
EUROGENE
COSMOS
eViP
EdReNe
MACE
MELT
JEM
CITER
KeyToNature
FP6
APOSDLE
ARGUNAUTARISE
ATGENTIVE
CONNECT
COOPER
ECIRCUS
ELEKTRA
ELU
EMAPPS.COM
ICAMP
I-MAESTRO
KALEIDOSCOPE
KP-LAB
LEAD
LT4EL
MGBL
PALETTE
PROLEARN
PROLIX
TENCOMPETENCE
TELCERT
ICLASS
L2C
RE.MATH
UNFOLD
UNITE
VEMUS
CALIBRATE
E-LEGI LEACTIVEMATH
LOGOS
FP7
GRAPPLE
LTFLL
SCY
TARGET
ARISTOTELE
ALICE
IMREAL
MATURE
MIROR
MIRROR
NEXT-TELL
GALA
ITEC
TERENCE
TEL-MAP
ECUTE
80DAYS
SIREN
INTELLEOMETAFORA
XDELIA
STELLAR
DYNALEARN
ROLE
COSPATIAL
IDSPACE
– 18 –
• Cluster C3 includes projects related development, content, competence, tools and testing. In
this cluster there is the smallest gap between frequency of occurrence of learning and other
terms.
• Cluster C4 has a strong focus on science and education, and also school is a term that stands
out.
• Cluster C5 emphasizes mostly on content, development and technology. It has the strongest
focus on content of all clusters; yet it includes not only eContentplus projects.
It is evident that eContentplus projects are spread over all clusters, indicating that this funding
programme (a) did not disrupt collaboration structures in TEL and (b) was definitely relevant for a
topic focus on educational content. Moreover, projects of all funding schemes are represented in all
clusters, indicating a coherent research agenda since the first FP6 projects.
Table 3: TEL project clusters in FP6, FP7, and eContentplus (ECP) and the word clouds of their project descriptions.
C0
ALICE [FP7], APOSDLE [FP6], COSPATIAL
[FP7], ECIRCUS [FP6], ECUTE [FP7], eViP
[ECP], GALA [FP7], I-MAESTRO [FP6],
IMREAL [FP7], KALEIDOSCOPE [FP6],
MATURE [FP7], MIRROR [FP7], NEXT-
TELL [FP7], SIREN [FP7], TARGET [FP7]
C1
80DAYS [FP7], CITER [ECP], DYNALEARN
[FP7], EduTubePlus [ECP], ELEKTRA
[FP6], ICLASS [FP6], Intergeo [ECP],
LEACTIVEMATH [FP6], LiLa [ECP],
LOGOS [FP6], METAFORA [FP7], MIROR
[FP7], PALETTE [FP6], PROLEARN [FP6],
PROLIX [FP6], RE.MATH [FP6]
C2
ATGENTIVE [FP6], E-LEGI [FP6],
EUROGENE [ECP], ICAMP [FP6], iCOPER
[ECP], INTELLEO [FP7], JEM [ECP], KP-
LAB [FP6], L2C [FP6], LEAD [FP6], LT4EL
[FP6], LTFLL [FP7], mEducator [ECP],
OpenScout [ECP], ROLE [FP7], STELLAR
[FP7], TEL-MAP [FP7], XDELIA [FP7]
C3
COOPER [FP6], GRAPPLE [FP7],
IDSPACE [FP7], MACE [ECP], Math-Bridge
[ECP], TELCERT [FP6],
TENCOMPETENCE [FP6], UNFOLD [FP6]
C4
ARGUNAUT [FP6], ARISE [FP6],
ARISTOTELE [FP7], CONNECT [FP6],
COSMOS [ECP], OpenScienceResources
[ECP], Organic.Edunet [ECP], SCY [FP7],
UNITE [FP6], VEMUS [FP6]
C5
ASPECT [ECP], CALIBRATE [FP6],
EdReNe [ECP], ELU [FP6], EMAPPS.COM
[FP6], ITEC [FP7], KeyToNature [ECP],
MELT [ECP], MGBL [FP6], TERENCE [FP7]

– 19 –
3.4 Organizational Collaborations
In addition to the project consortium progression network presented in the previous section, TEL
projects can be viewed from another angle: the organizational collaboration graph �$ = (�$ , �$� contains organizations and their collaborations in the project consortia. This graph shows
organizations as nodes and an edge between two nodes if there is any project where both organizations
have participated in, i.e. �$ = and
�$ = ���, �� ∶ �, � ∈ �$ ∧ � ≠ � ∧ ∃ ∈ � ∶ � , �� ∧ � , ��".
3.4.1 Collaborations in FP7 projects
In the collaboration graph for FP7 TEL projects, �$%�&, the number of participating organizations |�$%�&| is 211, and the number of collaborations |�$%�&| between those organizations amount to 1,983. The
visualization of �$%�& is depicted in Figure 7. The size of each node was determined by the betweenness
centrality of the node, while edge weight was determined by the number of projects in which two
organizations collaborate or had collaborated. The node arrangement was computed using the yEd
graph editor’s [28] organic layout algorithm, which tends toward a symmetric and clustered
distribution of nodes [27].
Figure 7: Visualization of the FP7 collaboration graph.
GOTTFRIED WILHELM LEIBNIZ UNIVERSITAET HANNOVER
DEUTSCHES FORSCHUNGSZENTRUM FUER KUENSTLICHE INTELLIGENZ GMBH
UNIVERSITE CATHOLIQUE DE LOUVAIN
UNIVERSITAET GRAZ
THE UNIVERSITY OF WARWICK
TECHNISCHE UNIVERSITEIT DELFT
OPEN UNIVERSITEIT NEDERLAND
UNIVERSITA DELLA SVIZZERA ITALIANA
EXACT LEARNING SOLUTIONS SPA
IMC INFORMATION MULTIMEDIA COMMUNICATION AG
VRIJE UNIVERSITEIT BRUSSEL
ATOS ORIGIN SOCIEDAD ANONIMA ESPANOLA
THE CHANCELLOR, MASTERS AND SCHOLARS OF THE UNIVERSITY OF CAMBRIDGE
TECHNISCHE UNIVERSITEIT EINDHOVEN
THE PROVOST FELLOWS AND SCHOLARS OF THE COLLEGE OF THE HOLY AND UNDIVIDED TRINITY OF QUEEN ELIZABETH NEAR DUBLIN
EBERHARD KARLS UNIVERSITAET TUEBINGEN UNIVERSITEIT UTRECHT
AURUS KENNIS- EN TRAININGSSYSTEMEN B.V.
UNIVERSITATEA POLITEHNICA DIN BUCURESTI
UNIVERSITE PIERRE MENDES FRANCE
INSTITUTE FOR PARALLEL PROCESSING OF THE BULGARIAN ACADEMY OF SCIENCES
BIT MEDIA E-LEARNING SOLUTION GMBH AND CO KG
THE UNIVERSITY OF MANCHESTER
THE OPEN UNIVERSITY
WIRTSCHAFTSUNIVERSITAET WIEN
UNIVERSITAET DUISBURG-ESSEN
THE GOVERNING COUNCIL OF THE UNIVERSITY OF TORONTO
DE PRAKTIJK, NATUURWETENSCHAPPELIJK ONDERWIJS V.O.F.
TARTU ULIKOOL
UNIVERSITETET I BERGEN
ENOVATE AS
UNIVERSITETET I OSLO
STICHTING TECHNASIUM
UNIVERSITE JOSEPH FOURIER GRENOBLE 1
UNIVERSITY OF CYPRUS
FRAUNHOFER-GESELLSCHAFT ZUR FOERDERUNG DER ANGEWANDTEN FORSCHUNG E.V
UNIVERSITEIT TWENTE
STIFTELSEN SINTEF TECHNOLOGY & SOCIETY
SIEMENS AKTIENGESELLSCHAFT OESTERREICH
CLEAR COMMUNICATION ASSOCIATES LIMITED - CCA
LEAN ENTERPRISE INSTITUTE POLSKA SPOLKA Z OGRANICZONA ODPOWIEDZIALNOSC IA
NORGES TEKNISK-NATURVITENSKAPELIGE UNIVERSITET NTNU
POLITECNICO DI MILANO
AALTO-KORKEAKOULUSAATIO
VIRTECH LTD
TECHNISCHE UNIVERSITAET GRAZ
BIBA - BREMER INSTITUT FUER PRODUKTION UND LOGISTIK GMBH
INOVACIJSKO-RAZVOJNI INSTITUT UNIVERZE V LJUBLJANI
INESC ID - INSTITUTO DE ENGENHARIA DE SISTEMAS E COMPUTADORES, INVESTIGACAO E DESENVOLVIMENTO EM LISBOA
CYNTELIX CORPORATION LIMITED
NOKIA OYJUNIVERSITY COLLEGE LONDON
MOMA SPA
HEALTHWARE SPA - PHI
UNIVERSITAET INNSBRUCKENGINEERING - INGEGNERIA INFORMATICA SPA
UNIVERSITA DEGLI STUDI DI MILANO
AMIS DRUZBA ZA TELEKOMUNIKACIJE D.O.O.
CENTRO DI RICERCA IN MATEMATICA PURA ED APPLICATA - CONSORZIO
FUNDACIO PER A LA UNIVERSITAT OBERTA DE CATALUNYA
COVENTRY UNIVERSITY
IMAGINARY SRL
EMPOWERTHEUSER LTDUNIVERSITY OF LEEDS
FRIEDRICH-ALEXANDER UNIVERSITAET ERLANGEN - NUERNBERG
UNIVERSITAET PADERBORN
BOC ASSET MANAGEMENT GMBH
LONDON METROPOLITAN UNIVERSITY
FACHHOCHSCHULE NORDWESTSCHWEIZ
SOLUCIONES INTEGRALES DE FORMACION Y GESTION STRUCTURALIA, S.A
FORSCHUNGSZENTRUM INFORMATIK AN DER UNIVERSITAET KARLSRUHE
PONTYDYSGU LTD
SAP AG
CENTRE INTERNACIONAL DE METODES NUMERICS EN ENGINYERIA
NATIONAL AND KAPODISTRIAN UNIVERSITY OF ATHENS
ALMA MATER STUDIORUM-UNIVERSITA DI BOLOGNA
COMPEDIA SOFTWARE & HARDWARE DEVELOPMENT LTD
GOETEBORGS UNIVERSITET
UNIVERSITA DEGLI STUDI DI GENOVA
THE UNIVERSITY OF EXETER
SONY FRANCE S.A.
REGISTERED NURSING HOME ASSOCIATION LIMITED
THE CITY UNIVERSITYTRACOIN QUALITY BV
REGOLA SRL
INFOMAN AG
NEUROLOGISCHE KLINIK GMBH BAD NEUSTADT
RUHR-UNIVERSITAET BOCHUM
BRITISH TELECOMMUNICATIONS PUBLIC LIMITED COMPANY*
MEDIEN IN DER BILDUNG
KOMPETENZZENTRUM FUER WISSENSBASIERTE ANWENDUNGEN UND SYSTEME FORSCHUNGS - UND ENTWICKLUNGS GMBH
VEREIN OFFENES LERNEN
THE UNIVERSITY OF BIRMINGHAM
BOC INFORMATION TECHNOLOGIES CONSULTING SP. Z.O.O.
UNI RESEARCH AS
MTO PSYCHOLOGISCHE FORSCHUNG UND BERATUNG GMBH
COPENHAGEN BUSINESS SCHOOLINSTITUTE OF EDUCATION, UNIVERSITY OF LONDON
JOANNEUM RESEARCH FORSCHUNGSGESELLSCHAFT MBH
CONSIGLIO NAZIONALE DELLE RICERCHE
THE UNIVERSITY OF NOTTINGHAM
PLAYGEN LTDUNIVERSITY OF THE WEST OF SCOTLAND
FUNDACION ESADE
MINISTERUL APARARII NATIONALE
NATO UNDERSEA RESEARCH CENTRE
CENTRE EUROPEEN D'EDUCATION PERMANENTE
UNIVERSITE PAUL SABATIER TOULOUSE III
TTY-SAATIO
SERIOUS GAMES INTERACTIVE
AALBORG UNIVERSITET
CYNTELIX CORPORATION BV
HERIOT-WATT UNIVERSITY
RHEINISCH-WESTFAELISCHE TECHNISCHE HOCHSCHULE AACHENUNIVERSIDAD COMPLUTENSE DE MADRID
ORT FRANCE
EIDGENOESSISCHE TECHNISCHE HOCHSCHULE ZUERICH
KATHOLIEKE UNIVERSITEIT LEUVEN
BUNDESMINISTERIUM FÜR UNTERRICHT, KUNST UND KULTUR
MINISTERIO DA EDUCACAO
SENTER FOR IKT I UTDANNINGEN
INDIRE ISTITUTO NAZIONALE DI DOCUMENTAZIONE PER L'INNOVAZIONE E LA RICERCA EDUCATIVA
MAKASH - ADVANCING CMC APPLICATIONS IN EDUCATION, CULTURE AND SCIENCE
EDUCATIO PUBLIC SERVICES NON-PROFIT LLC
SMART TECHNOLOGIES (GERMANY) GMBH
FUTURELAB EDUCATION
PROMETHEAN LIMITED
THE UNIVERSITY OF BOLTON
ICODEON LIMITED
NATIONAL MINISTRY OF EDUCATION
EDUCA.CH INSTITUT SUISSSE DES MEDIAS POUR LA FORMATION ET LA CULTURE
UNIVERSIDAD DE VIGO
ELFA S.R.O.
INSTITUTO DE EDUCAÇÃO DA UNIVERSIDADE DE LISBOA
EDUBIT VZW
KNOWLEDGE MARKETS CONSULTING GMBH
THE MANCHESTER METROPOLITAN UNIVERSITYTIIGRIHUPPE SIHTASUTUS
EUN PARTNERSHIP AISBL
UNI-C, DANMARKS EDB-CENTER FOR FORSKNING OG UDDANNELSE
CENTRE NATIONAL DE DOCUMENTATION PEDAGOGIQUE
SVIETIMO INFORMACINIU TECHNOLOGIJU CENTRAS
FACULTES UNIVERSITAIRES NOTRE-DAME DE LA PAIX ASBL
UNIVERSITA DEGLI STUDI DELL'AQUILA
UNIVERSITA DEGLI STUDI DI PADOVA
UNIVERSIDAD DE SALAMANCA
AMNIN D.O.O CENTR ZA ZNANSTVENO VIZUALIZACIJO
LIBERA UNIVERSITA DI BOLZANO
UNIVERSITA DEGLI STUDI DI VERONA
FONDAZIONE BRUNO KESSLER
MOHOLY-NAGY MUVESZETI EGYETEM
SIVECO ROMANIA SA
UNIVERSITY OF SUSSEX
GIUNTI LABS S.R.L.
HOGSKOLEN I OSLO
JYVASKYLAN YLIOPISTO
ZENTRUM FUER SOZIALE INNOVATION
KUNGLIGA TEKNISKA HOEGSKOLAN
BRUNEL UNIVERSITY
NATIONAL UNIVERSITY CORPORATION, KYOTO UNIVERSITY
UNIVERSITAET AUGSBURG
WAGENINGEN UNIVERSITEIT
GAKO HOJIN SEIKEI GAKUEN
UNIVERSITY OF SUNDERLAND
JACOBS UNIVERSITY BREMEN GGMBH
TAKOMAT JOHNE, SCHNATMANN, SCHWARZ GBR
TESTALUNA SRL
UNIVERSITY OF LEICESTER
ZENTRUM FUER GRAPHISCHE DATENVERARBEITUNG E.V.
IT UNIVERSITY OF COPENHAGEN
UNIVERSITY OF BATH
THE REGENTS OF THE UNIVERSITY OF CALIFORNIA
NATIONAL TECHNICAL UNIVERSITY OF ATHENS
INSTITUT FÜR ANGEWANDTE SYSTEMTECHNIK BREMEN GMBH
EESTI OPETAJATE LIITINI DOO
FACULTY OF ORGANIZATIONAL SCIENCES, UNIVERSITY OF BELGRADE
TALLINNA ULIKOOL
ATHABASCA UNIVERSITY
VOLKSWAGEN AG
THE HEBREW UNIVERSITY OF JERUSALEM
KATHOLISCHE UNIVERSITAT EICHSTATT-INGOLSTADT
SAXO BANK AS
ERASMUS UNIVERSITEIT ROTTERDAM
BLEKINGE TEKNISKA HOEGSKOLA
UNIVERSITY OF BRISTOL
SCIENTER SCRL
ECOLE POLYTECHNIQUE FEDERALE DE LAUSANNE
LUDWIG-MAXIMILIANS-UNIVERSITAET MUENCHENALBERT-LUDWIGS-UNIVERSITAET FREIBURG
FUNDAÇÃO UNIVERSIDADE DE BRASILIA
CENTRAL LABORATORY OF GENERAL ECOLOGY - ZENTRALNA LABORATORIYA PO OBSCHTA EKOLOGIYA
UNIVERSIDAD POLITECNICA DE MADRID
TEL AVIV UNIVERSITY
UNIVERSITAET FUER BODENKULTUR WIEN
UNIVERSITY OF HULLUNIVERSITEIT VAN AMSTERDAM
THE BRITISH INSTITUTE FOR LEARNINGAND DEVELOPMENT LBG
U&I LEARNING NV
FESTO LERNZENTRUM SAAR GMBH
SHANGHAI JIAO TONG UNIVERSITY
UNIVERSITAET KOBLENZ-LANDAU
UPPSALA UNIVERSITET
UNIVERSITY OF HAIFA
BAR ILAN UNIVERSITY
MORPHEUS SOFTWARE VOF
LANDESINITIATIVE NEUE KOMMUNIKATIONSWEGE MECKLENBURG-VORPOMMERN E.V.
EXTRIM MINTIA SOLOUSIONS ETAIREIA PLIROFORIKIS KAI TILEPIKOINONION ETAIREIA PERIORISMENIS EFTHINIS
UNIVERSITY OF PIRAEUS RESEARCH CENTER
STIFTUNG UNIVERSITAT HILDESHEIM
SPACE APPLICATIONS SERVICES NV

– 20 –
A cut-out of the center region of the FP7 collaboration graph �$%�& with legible node labels is shown in
Figure 8.
The visualizations show one core sub-network in the center, featuring organizations that have strong
ties due to several shared projects. It also shows a strong sub-network towards the top-right of the
center. The other sub-networks in the periphery of the visualization tend to expose consortia of
projects whose members are not involved in multiple projects. The bonds between those sub-networks
are established by organizations that are involved in collaboration clusters in both the periphery and
the center of the network. These nodes represent connectors in the network. The strongest ties, of
course, are built between organizations that collaborate in many different projects and/or that
collaborate in projects with large consortia. The five top-ranked among those in FP7 are:
1. Technische Universität Graz, Austria (82 distinct connections in 7 projects)
Figure 8: Center region cut-out of the FP7 collaboration graph.
GOTTFRIED WILHELM LEIBNIZ UNIVERSITAET HANNOVER
UNIVERSITAET GRAZ
TECHNISCHE UNIVERSITEIT DELFT
OPEN UNIVERSITEIT NEDERLAND
IMC INFORMATION MULTIMEDIA COMMUNICATION AG
VRIJE UNIVERSITEIT BRUSSEL
ATOS ORIGIN SOCIEDAD ANONIMA ESPANOLA
THE CHANCELLOR, MASTERS AND SCHOLARS OF THE UNIVERSITY OF CAMBRIDGE
TECHNISCHE UNIVERSITEIT EINDHOVEN
UNIVERSITEIT UTRECHT
AURUS KENNIS- EN TRAININGSSYSTEMEN B.V.
THE OPEN UNIVERSITY
WIRTSCHAFTSUNIVERSITAET WIEN
STIFTELSEN SINTEF TECHNOLOGY & SOCIETY
SIEMENS AKTIENGESELLSCHAFT OESTERREICH
CLEAR COMMUNICATION ASSOCIATES LIMITED - CCA
NORGES TEKNISK-NATURVITENSKAPELIGE UNIVERSITET NTNU
POLITECNICO DI MILANO
AALTO-KORKEAKOULUSAATIO
VIRTECH LTD
TECHNISCHE UNIVERSITAET GRAZ
BIBA - BREMER INSTITUT FUER PRODUKTION UND LOGISTIK GMBH
INESC ID - INSTITUTO DE ENGENHARIA DE SISTEMAS E COMPUTADORES, INVESTIGACAO E DESENVOLVIMENTO EM LISBOA
CYNTELIX CORPORATION LIMITED
NOKIA OYJUNIVERSITY COLLEGE LONDON
COVENTRY UNIVERSITY
UNIVERSITA DEGLI STUDI DI GENOVA
CONSIGLIO NAZIONALE DELLE RICERCHE
THE UNIVERSITY OF NOTTINGHAM
PLAYGEN LTDUNIVERSITY OF THE WEST OF SCOTLAND
FUNDACION ESADE
MINISTERUL APARARII NATIONALE
NATO UNDERSEA RESEARCH CENTRE
CENTRE EUROPEEN D'EDUCATION PERMANENTE
UNIVERSITE PAUL SABATIER TOULOUSE III
TTY-SAATIOAALBORG UNIVERSITET
CYNTELIX CORPORATION BV
HERIOT-WATT UNIVERSITY
RHEINISCH-WESTFAELISCHE TECHNISCHE HOCHSCHULE AACHENUNIVERSIDAD COMPLUTENSE DE MADRID
ORT FRANCE
EIDGENOESSISCHE TECHNISCHE HOCHSCHULE ZUERICH
THE UNIVERSITY OF BOLTON
KNOWLEDGE MARKETS CONSULTING GMBH
TIIGRIHUPPE SIHTASUTUS
ZENTRUM FUER SOZIALE INNOVATION
UNIVERSITY OF LEICESTER
UNIVERSITY OF BRISTOL
SCIENTER SCRL
ECOLE POLYTECHNIQUE FEDERALE DE LAUSANNE
THE BRITISH INSTITUTE FOR LEARNINGAND DEVELOPMENT LBG
U&I LEARNING NV
FESTO LERNZENTRUM SAAR GMBH
SHANGHAI JIAO TONG UNIVERSITY
UNIVERSITAET KOBLENZ-LANDAU
UPPSALA UNIVERSITET
KATHOLIEKE UNIVERSITEIT LEUVEN

– 21 –
2. Open Universiteit Nederland, Netherlands (67 / 5)
3. Aalto-Korkeakoulusaatio, Finland (66 / 3)
4. Katholieke Universiteit Leuven, Belgium (63 / 4).
5. ATOS Origin Sociedad Anonima Espanola, Spain (59 / 4)
This is actually a “multi-cultural” top-five list since the top-ranked organization is represented by a
psychology department at a university of technology, the second-ranked is an open university, the
third-ranked is a multidisciplinary research unit, the fourth-ranked is a hypermedia and databases
department at a Catholic university, and the fifth-ranked is a research and IT services company. This is
a confirmative signal that TEL is an interdisciplinary research area which needs strong partners from
different ends of the spectrum, both in terms of research area and organizational background.
A visualization like this can, among other purposes, be used to identify the most prolific collaborators
as an entry point to more detailed investigation. For instance, Technische Universität Graz, although
being a university of technology, is primarily involved as a provider of the psychological expertise in
the projects. The word cloud of all 26 project descriptions in Figure 9—which displays the 20 word
stems with the highest frequency in the descriptions—clearly shows that TEL projects have a strong
focus on the human(istic) aspects of TEL, e.g. learn, knowledg[e], design, adapt[ation],
collabor[ation], and so forth. A strong and well-connected department of psychology, like that of
Technische Universität Graz, has an excellent standing in such a landscape; this indicates that partners
providing expertise in non-technological, “cross-cutting” themes have great opportunities in getting a
piece of the TEL funding cake.
Figure 9: Word cloud of the 20 word stems with highest frequency in the FP7 project descriptions
3.4.2 Collaborations in all TEL Projects: FP6, FP7, and eContentplus
A collaboration graph for all TEL projects in FP6, FP7, and eContentplus programmes, �$, is given in
Figure 10. It includes |�$| = 604 partner organizations and |�$| = 9,330 distinct pairs of partner
collaboration. Apart from the core network, there are no strongly connected sub-networks, which
means that in every project there exists one partner who is involved in at least one other project.

– 22 –
We calculated SNA metrics and funding statistics for each participant in �$; the resulting table of the
top 30 organizations is given in Table 4. The table is ordered by PageRank, a metric that not only takes
into account the number of edges of each node, but also the “importance” of the neighboring adjacent
nodes. This means, an organization’s importance depends on the number of collaborations with other
organizations and on the importance of the organization’s collaborators.
The ranking clearly shows that there is a strong relationship between the most “profane” ranking (i.e.
funding) and most of the other network metrics. One notable exception is the local clustering
coefficient, which has an apparent negative correlation with all other metrics. We recall that clustering
of a node in a network refers to the connectedness of the node’s neighborhood. A organizational
collaboration network like �$ has some noteworthy properties in this respect: an organization which is
involved in only one project will have a high clustering coefficient, since the neighborhood of that
organization is strongly connected through the project. So this node will have low scores in centrality
metrics and a higher score on clustering. On the other hand, an organization that is involved in several
projects will likely connect several sub-networks made up of organizations involved in fewer projects.
The organization will thus have a lower clustering coefficient, but likely higher values for the centrality
metrics, like betweenness centrality. To illustrate this effect, Figure 13a plots the local clustering
coefficient against the PageRank for each organization. The plot reveals and interesting characteristic
of the collaboration network, namely that there are two quite clearly separated sets of organizations in
the plot. One set of organizations manages to have a significantly higher PageRank than the other set
Figure 10: Partner collaborations spanning FP6, FP7, and eContentplus projects.

– 23 –
at a similar level of local clustering. This separation is even more evident when plotting the degree
(number of connections) against the local clustering coefficient (see Figure 13b).
Table 4: Top 30 organizations involved in TEL projects by PageRank. The numbers in square brackets next to the values represent the rank of that value among all 604 organizations.
Organization PR ▼ BC LC DC CC Funding*
THE OPEN UNIVERSITY, UNITED KINGDOM .0125 [1] .1185 [1] .2151 [601] 219 [1] .6012 [1] 3.55 [3]
KATHOLIEKE UNIVERSITEIT LEUVEN, BELGIUM .0090 [2] .0752 [2] .1716 [604] 148 [3] .5462 [5] 2.56 [6]
OPEN UNIVERSITEIT NEDERLAND, NETHERLANDS .0086 [3] .0414 [6] .2161 [600] 133 [7] .5442 [6] 3.45 [4]
JYVASKYLAN YLIOPISTO, FINLAND .0080 [4] .0667 [3] .3170 [588] 170 [2] .5657 [2] 1.26 [39]
FRAUNHOFER-GESELLSCHAFT ZUR FOERDERUNG DER ANGEWANDTEN FORSCHUNG E.V, GERMANY
.0068 [5] .0529 [4] .1833 [603] 111 [22] .5294 [18] 3.40 [5]
DEUTSCHES FORSCHUNGSZENTRUM FUER KUENSTLICHE INTELLIGENZ GMBH, GERMANY
.0066 [6] .0390 [7] .1916 [602] 106 [27] .5280 [21] 3.68 [1]
ATOS ORIGIN SOCIEDAD ANONIMA ESPANOLA, SPAIN .0064 [7] .0236 [15] .4316 [565] 142 [5] .5482 [4] 1.33 [33]
UNIVERSITAET GRAZ, AUSTRIA .0064 [8] .0230 [18] .4016 [573] 148 [3] .5552 [3] 2.03 [10]
UNIVERSITEIT UTRECHT, NETHERLANDS .0061 [9] .0203 [23] .4323 [564] 139 [6] .5336 [11] 1.62 [19]
INESC ID - INSTITUTO DE ENGENHARIA DE SISTEMAS E COMPUTADORES, INVESTIGACAO E DESENVOLVIMENTO EM LISBOA, PORTUGAL
.0061 [10] .0368 [8] .4741 [552] 130 [8] .5280 [21] 1.68 [16]
THE UNIVERSITY OF WARWICK, UNITED KINGDOM .0058 [11] .0333 [9] .4754 [551] 129 [10] .5374 [10] 1.68 [17]
UNIVERSITY OF CYPRUS, CYPRUS .0057 [12] .0176 [26] .4668 [554] 130 [8] .5394 [7] 1.48 [25]
THE UNIVERSITY OF NOTTINGHAM, UNITED KINGDOM .0057 [13] .0198 [24] .4902 [542] 129 [10] .5327 [13] 1.52 [22]
IMC INFORMATION MULTIMEDIA COMMUNICATION AG, GERMANY
.0056 [14] .0102 [46] .3124 [590] 86 [57] .5071 [47] 2.35 [8]
UNIVERSITAET DUISBURG-ESSEN, GERMANY .0056 [15] .0258 [12] .4773 [547] 125 [12] .5285 [20] 1.82 [14]
GOTTFRIED WILHELM LEIBNIZ UNIVERSITAET HANNOVER, GERMANY
.0054 [16] .0186 [25] .2860 [592] 87 [54] .5115 [44] 2.41 [7]
ECOLE POLYTECHNIQUE FEDERALE DE LAUSANNE, SWITZERLAND
.0053 [17] .0111 [41] .5647 [506] 118 [18] .5322 [15] 1.66 [18]
EUN PARTNERSHIP AISBL, BELGIUM .0052 [18] .0231 [16] .2617 [595] 87 [54] .4863 [97] 1.83 [13]
KUNGLIGA TEKNISKA HOEGSKOLAN, SWEDEN .0052 [19] .0242 [14] .5335 [527] 121 [14] .5336 [11] .98 [69]
THE PROVOST FELLOWS AND SCHOLARS OF THE COLLEGE OF THE HOLY AND UNDIVIDED TRINITY OF QUEEN ELIZABETH NEAR DUBLIN, IRELAND
.0051 [20] .0211 [20] .5344 [526] 119 [16] .5379 [9] 2.31 [9]
TECHNISCHE UNIVERSITAET GRAZ, AUSTRIA .0051 [21] .0257 [13] .2577 [598] 90 [50] .4971 [60] 3.56 [2]
GIUNTI LABS S.R.L., ITALY .0051 [22] .0207 [21] .2644 [594] 82 [62] .5054 [49] 1.95 [12]
CONSIGLIO NAZIONALE DELLE RICERCHE, ITALY .0050 [23] .0074 [58] .5687 [505] 119 [16] .5303 [17] 1.08 [60]
RESEARCH ACADEMIC COMPUTER TECHNOLOGY INSTITUTE, GREECE
.0050 [24] .0263 [11] .5512 [517] 114 [20] .5132 [43] 1.26 [40]
EOTVOS LORAND TUDOMANYEGYETEM, HUNGARY .0049 [25] .0230 [17] .4986 [538] 124 [13] .5394 [7] .98 [68]
UNIVERSITETET I OSLO, NORWAY .0049 [26] .0175 [27] .5171 [533] 121 [14] .5294 [18] 1.32 [34]
UNIVERZA V LJUBLJANI, SLOVENIA .0046 [27] .0212 [19] .2468 [599] 78 [93] .4778 [102] 1.16 [50]
ELLINOGERMANIKI AGOGI SCHOLI PANAGEA SAVVA AE, GREECE
.0046 [28] .0118 [39] .2587 [597] 69 [96] .4483 [130] 1.11 [54]
MEDIEN IN DER BILDUNG, GERMANY .0045 [29] .0122 [36] .6132 [494] 110 [23] .5262 [23] 1.39 [27]
CENTRE NATIONAL DE LA RECHERCHE SCIENTIFIQUE, FRANCE
.0045 [30] .0117 [40] .6033 [498] 110 [23] .5239 [24] 1.37 [30]
PR = PageRank | BC = Betweenness centrality | LC = Local clustering coefficient | DC = Degree centrality | CC = Closeness centrality (all metrics were calculated using unweighted edges)
* … Funding is stated in million Euro (EC contribution to the project cost). Note that CORDIS states the total funding for each project. The funding per consortium member for each project was computed by dividing the total EC contribution to that project by the number of consortium members. This should give a good estimate.

– 24 –
Clearly, it is favorable to belong to the set of organizations that achieve a higher PageRank or degree at
a given clustering value. This “bump” in PageRank seems to happen when an organization reaches a
PageRank value range above .003. For degree, the bump seems to happen when an organization has
connections to at least ~80 other organizations. To achieve these values, an organization needs to
either connect to new organizations in new projects and/or by connecting to other organizations with a
high PageRank.
A degree threshold of at least 80 was achieved by 92 organizations in the data set. Those projects in
FP6, FP7 and eContentplus where at least half of the consortium is made up by these organizations
are: KALEIDOSCOPE (100%), RE.MATH (88%), STELLAR (81%), LEAD (67%), GRAPPLE, ALICE
(60% each), SCY (58%), PROLEARN (54%), and TEL-Map (50%). This short list includes three of the
four TEL networks of excellence. GALA; the fourth TEL network of excellence is found at rank 25 with
29%. This can be interpreted as evidence that participation in a network of excellence is highly
beneficial to the centrality of an organization in the collaboration network.
The top partnership bonds across all TEL projects are displayed in Table 5. The table shows the 22
pairs of organizations that have collaborated in at least 4 TEL projects. Assuming partnership is only
continued from successful projects, we can conjecture that those projects where the listed
organizations were involved can be flagged as having lasting impact, at least in terms of continuity in
research collaborations. The most important of these projects, ordered by frequency of partnership in
Table 5, are: PROLEARN (FP6; 16 pairs), ICOPER (eContentplus; 10 pairs), OpenScout (eContentplus;
9 pairs), GRAPPLE (FP7; 8 pairs), STELLAR, ROLE (FP7; 5 pairs), and PROLIX (FP6, 5 pairs). It is
evident that the PROLEARN network of excellence that co-kicked off FP6 succeeded in creating and
sustaining strong partnerships, while the KALEIDOSCOPE network of excellence, which started at the
same time as PROLEARN, failed to achieve this despite having a much larger consortium.
(a) (b)
Figure 11: Local clustering of organizations plotted against (a) PageRank and (b) degree.
.000
.002
.004
.006
.008
.010
.012
.014
0.0 0.2 0.4 0.6 0.8 1.0
Pa
ge
Ra
nk
Local clustering cofficient
0
50
100
150
200
250
0.0 0.2 0.4 0.6 0.8 1.0
De
gre
e
Local clustering coefficient

– 25 –
Table 5: Strongest partnership bonds over all TEL projects in FP6, FP7 and eContentplus.
Rank Partnership #
1. OPEN UNIVERSITEIT NEDERLAND with GOTTFRIED WILHELM LEIBNIZ UNIVERSITAET HANNOVER
6
- THE OPEN UNIVERSITY with KATHOLIEKE UNIVERSITEIT LEUVEN 6
3. THE OPEN UNIVERSITY with OPEN UNIVERSITEIT NEDERLAND 5
- THE OPEN UNIVERSITY with IMC INFORMATION MULTIMEDIA COMMUNICATION AG
5
- JYVASKYLAN YLIOPISTO with THE OPEN UNIVERSITY 5
6. OPEN UNIVERSITEIT NEDERLAND with KATHOLIEKE UNIVERSITEIT LEUVEN 4
- OPEN UNIVERSITEIT NEDERLAND with DEUTSCHES FORSCHUNGSZENTRUM FUER KUENSTLICHE INTELLIGENZ GMBH
4
- IMC INFORMATION MULTIMEDIA COMMUNICATION
AG with
GOTTFRIED WILHELM LEIBNIZ UNIVERSITAET HANNOVER
4
- IMC INFORMATION MULTIMEDIA COMMUNICATION
AG with
DEUTSCHES FORSCHUNGSZENTRUM FUER KUENSTLICHE INTELLIGENZ GMBH
4
- IMC INFORMATION MULTIMEDIA COMMUNICATION
AG with OPEN UNIVERSITEIT NEDERLAND 4
- ATOS ORIGIN SOCIEDAD ANONIMA ESPANOLA with UNIVERSITAET GRAZ 4
- FRAUNHOFER-GESELLSCHAFT ZUR FOERDERUNG
DER ANGEWANDTEN FORSCHUNG E.V with OPEN UNIVERSITEIT NEDERLAND 4
- POLITECNICO DI MILANO with OPEN UNIVERSITEIT NEDERLAND 4
- GIUNTI LABS S.R.L. with IMC INFORMATION MULTIMEDIA COMMUNICATION AG
4
- ECOLE POLYTECHNIQUE FEDERALE DE LAUSANNE with THE OPEN UNIVERSITY 4
- WIRTSCHAFTSUNIVERSITAET WIEN with IMC INFORMATION MULTIMEDIA COMMUNICATION AG
4
- WIRTSCHAFTSUNIVERSITAET WIEN with THE OPEN UNIVERSITY 4
- NATIONAL CENTRE FOR SCIENTIFIC RESEARCH
DEMOKRITOS with
IMC INFORMATION MULTIMEDIA COMMUNICATION AG
4
- TECHNISCHE UNIVERSITEIT EINDHOVEN with DEUTSCHES FORSCHUNGSZENTRUM FUER KUENSTLICHE INTELLIGENZ GMBH
4
- EUN PARTNERSHIP AISBL with UNIVERZA V LJUBLJANI 4
- EUN PARTNERSHIP AISBL with TIIGRIHUPPE SIHTASUTUS 4
- THE PROVOST FELLOWS AND SCHOLARS OF THE COLLEGE OF THE HOLY AND UNDIVIDED TRINITY
OF QUEEN ELIZABETH NEAR DUBLIN with UNIVERSITAET GRAZ 4
3.4.3 Dynamic SNA of the TEL Project Landscape
The previous figures all took the current status of collaborations and projects as a basis for calculating
SNA metrics and graph characteristics. To understand the dynamics of the projects and their
consortium collaborations we now take a look at the development of SNA metrics of the collaboration
network on a yearly basis, starting from 2004 when the first FP6 projects were launched, up to the
year 2010 (inclusive). Year 2011 was omitted from the analyses since the year is not yet over, and no
new TEL projects were launched thus far.
Figure 12 shows that in FP6 the first set of (eight) projects launched in 2004 introduced 4,199 distinct
collaboration connections among 157 organizations in the TEL landscape (Figure 12a). This massive
entry number is mainly due to the KALEIDOSCOPE network of excellence, which was launched in that
year with an extremely large consortium of 83 partners (the average consortium size in FP6 was 14.5
partners). In Figure 12b we see that the diameter of the network—i.e. the longest shortest path through
the network—has reached its peak in 2006, after only 2 years; in 2010, the diameter shrunk to a value
of 4, which means that one or more projects have introduced direct connections between previously

– 26 –
distant partners. It also shows that the average path length has been stable at a value of around 2.5
since 2006. This means that each organization is on average connected to each other organization by
only two intermediate organizations. This indicates that the collaboration network is extremely tightly
knit. One correlate of being tightly knit is that such a network tends to be hard for outsiders to join;
this can inhibit the diffusion of information and innovation across a network boundary.
Until the end of 2010, the number of organizations involved in TEL projects almost quadrupled (3.9-
fold), while the number of project-based collaboration ties between those organizations slightly more
than doubled (2.2-fold) during the same time window (cf. Figure 12a). This gap can partly be explained
by Figure 13a, which shows that although there has been a steady flow of new projects, these projects
have added fewer and fewer new organizations to the picture, exposing a drop from 8.1 new
organizations per new project in 2006 to 4.8 new organizations per new project in 2010.
Figure 13c demonstrates that the average size of the consortia of newly launched projects has been
relatively stable since 2005, ranging between 10.9 and 14.1. In contrast, the average share of newly
introduced organizations per launched project has dropped from 66% in 2005 to 40% in 2010. The
(a) (b)
Figure 12: Overall development of collaboration network since 2004.
(a) (b)
(c) (d)
Figure 13: Impact of newly launched projects the collaboration network.
157
257
371423
476542
6044,199
4,987
6,0476,607
7,409
8,234
9,330
0
2,000
4,000
6,000
8,000
10,000
0
200
400
600
800
1,000
2004 2005 2006 2007 2008 2009 2010
Organizations
Collaborations
3
4
5 5 5 5
4
1.74
2.182.46 2.52 2.51 2.50 2.50
0
1
2
3
4
5
6
2004 2005 2006 2007 2008 2009 2010
Diameter
Avg. Path Length
8
14 14
7 9
1213
19.6
7.18.1 7.4
5.9 5.5 4.8
0
5
10
15
20
25
2004 2005 2006 2007 2008 2009 2010
New Projects
New Organizations per New Project
8
14 14
7
9
1213
525
56 76 80 8969 84
0
100
200
300
400
500
600
0
5
10
15
20
2004 2005 2006 2007 2008 2009 2010
New Projects
New Collaborations per New Project
85%
66% 67%62%
42% 44%40%
23.0
10.9 12.1 12.014.1 12.6 11.9
0
5
10
15
20
25
30
35
40
45
50
0%
10%
20%
30%
40%
50%
60%
70%
80%
90%
100%
2004 2005 2006 2007 2008 2009 2010
Ratio of New Organizations in Consortia of New Projects
Avg. Consortium Size of New Projects
47
35
8
14
10
6
7
13
0123456789
101112131415
2004 2005 2006 2007 2008 2009 2010
New projects per programme per year
FP7
FP6
eContentplus

– 27 –
sharpest drop is evident for projects that started in the year 2008 (from 62% to 42%); this is the year
when the first 6 FP7 projects plus 3 new eContentplus projects were launched. So it appears that at the
transition from FP6 to FP7 and eContentplus, the project consortia resorted to building on an
established core of members.
In Figure 14 we see that the average number of new collaboration ties created by each organization
making its debut in TEL projects has, after an initial fall between 2004 and 2005, increased from 7.9
in 2005 to 17.7 in 2010. Hence, starting to participate in TEL projects has an increasingly positive
effect in terms of new collaborations with other organizations involved in TEL.
The project participation data shows that of the 34 TEL projects launched between 2008 and 2010,
20% were coordinated by organizations which had not participated in any previous (or at that time
running) TEL project. The development of this percentage over time is plotted in Figure 15. The sharp
increase in 2007 is likely due to eContentplus, where the focus shifted to e-content and metadata, and
thus new organizations were introduced. The data shows that even for complete “newbie
organizations” in TEL it is absolutely feasible to write a successful project proposal in the coordinator
role.
However, the tendency evident in most of the figures in this section points in another direction; it
appears that there is less and less demand for new organizations on the TEL market. One the one
hand, this is understandable: if an organization launches a new project it is likely to resort to partners
it has already successfully collaborated with, particularly as more organizations are entering the
“market” every year. On the other hand, it shows that project consortia and collaboration ties between
organizations behave like an inertial mass, which impedes the involvement of new and fresh
organizations, and likely also new ideas and research foci.
Figure 14: Impact of organizations on collaboration.
Figure 15: Development of the ratio of projects coordinated by novice organizations
26.7
7.99.3
10.8
15.1
12.5
17.7
0
5
10
15
20
25
30
2004 2005 2006 2007 2008 2009 2010
New Collaborations perNew Organization
88%
50%
43%
86%
11%
25% 23%
0%
10%
20%
30%
40%
50%
60%
70%
80%
90%
100%
2004 2005 2006 2007 2008 2009 2010
Ratio of Projects with NoviceParticipants as Coordinator

– 28 –
3.5 Geo-Mapping TEL Projects
Another interactive visualization we developed based on the geographically enhanced CORDIS data
shows the TEL hotspots in Europe (see Figure 16). It allows selection of (multiple) FP7 TEL projects,
which will result in the display of
(a) the partners involved in those projects on a Google Map overlay, and
(b) a word cloud of the descriptions of all selected projects.
Clicking on a marker in the map will show a popup window with the name of the organization, the list
of projects in which the organization is or was involved, and a link “Show partners”, which, upon being
clicked will display all the consortium members of all projects where this organization is or was
involved. An interactive online version of this is available at http://learningfrontiers.eu/?q=story/tel-
project-landscape .
Figure 16: Google Map overlay with organizations involved in TEL projects.

– 29 –
In combination with the centrality and degree metrics obtained from the analysis of �$ this
visualization enables in-depth understanding of collaboration structures and geographical
agglomeration of TEL organizations across Europe. The map exposes a strong north-south axis
starting in Scotland, via England, the Netherlands, Belgium, and West Germany, to northern Italy with
strong “outposts” in Switzerland and Austria.
4 Analysis of TEL Publication Outlets In general, peer reviewed publications are one major scientific indicator of the impact of research and
development work. The same holds true for TEL, which is an emerging research area in several
established disciplines like psychology or computer science. Particularly in computer science,
conferences have a dominant role in communication of research, with many conference venues having
the same or even higher impact than well-ranked journals.
The major gathering of European TEL researchers is the EC-TEL conference, an international refereed
conference that was launched in the scope of the FP6 network of excellence PROLEARN. According to
Microsoft Academic Search, there are 57 conferences, compared to 19 journals in the computer
education category. Such domination raises questions about understanding the communities of
conferences and their development pattern in order to have an overview on the current research work
of the TEL area. For researchers, understanding the community means getting to know the research
environment, which leads to self-adaptation and (hopefully) improvement in the field. For conference
organizers and other stakeholders, an overview of their communities is important for maintaining,
cultivating and promoting the conferences and their communities.
The structure of scientific collaboration can be researched in great detail by SNA of two distinct data
sets: the co-authorship graph and the citation graph. The co-authorship graph reveals the contribution
structures of a scientific community by disclosing who has collaborated with whom in terms of co-
authoring of papers. The citation graph discloses the influencing areas, conferences, and journals of a
conference in terms of cited papers. Together, the two graphs allow a detailed analysis of the
knowledge structure and flows within the scientific community but also the knowledge flows between
adjacent scientific communities. SNA of TEL communities is only available on the level of single
conferences [8, 15, 21] or from the perspective of a project [26]. A systematic comparison of key
features of scientific community shows that, depending on the duration of existence, different
conferences expose different development patterns.
4.1 Data Set
The data set used in our study is the combination of DBLP and CiteSeerX digital libraries. We choose
these two because they cover most of the relevant sub-disciplines. We retrieved the publication list of
conferences from DBLP and used CiteSeerX to fill the citation list of publications in DBLP. This was
achieved by using the canopy clustering technique [13]. Overall, the matching algorithm gave us
864,097 pairs of matched publications, of which only a subset is relevant to TEL, of course.
The data was stored in the TEL-Map Mediabase in a relational database schema. The schema includes
several dozen tables. The most important of those are displayed at a conceptual level in Figure 17. The
central entity is paper. Each paper has relationships with its authors, the keywords, abstract, and the
proceedings in which it appeared. Proceedings are published for an event (e.g. EC-TEL 2011) and each
event belongs to an event series (e.g. EC-TEL 2011 is the 6th event in the EC-TEL event series). To
simplify storage and querying, the same concepts are used to represent journal publications. A journal
is represented as an event series, each volume of the journal as an event, and each issue as a
proceeding. Events can be related to other events, e.g. a workshop event held in conjunction with a
conference event.

– 30 –
From these data sets we extracted the co-authorship and the citation networks for conferences and
journals with a primary focus on TEL. The set of most relevant conferences was obtained by the
following procedure:
• Starting with definitely relevant TEL journals indexed in DBLP like Educational Technology &
Society (ETS), IEEE Transactions on Learning Technology (TLT), and Computers & Education
(CE), we computed for authors who have published in these journals a list of conferences
where those authors have published the most papers since 2005. A total of 1,135 conference
series (repeat: not single conferences, but series) are in the candidate set, which shows that
TEL researchers are active in a wide range of sub-disciplines.
• From this result, ordered by papers per event, we filtered the top five conferences whose
primary focus is on TEL related topics. Conferences that did not meet the filter were CHI
(Computer Human Interaction), HCI (Human Computer Interaction), ICCE (International
Conference on Computers in Education), HICSS (Hawaii International Conference on System
Sciences) and CRIWG (International Workshop on Groupware). Some of those, while
somehow relevant to European TEL, were removed because (a) their main focus is not in TEL,
e.g. HICSS, which is a multi-track systems science conference; or (b) because they have a
strong regional focus, e.g. ICCE focuses mainly on the Asia-Pacific region.
The resulting set of our top five TEL conference series is listed in Table 6. The table clearly shows that
the most relevant international conference is ICALT, which has published 768 papers by ET&S, CE and
TLT authors since 2005. The most relevant European conference is ECTEL with 215 papers published
by ET&S, CS and TLT authors since 2005. AIED and ITS are venues of primary relevance to work by
the artificial intelligence community as related to TEL. That is, the three core TEL conferences on
DBLP appear to be ICALT, ECTEL and ICWL, since these have their primary focus in the TEL area.
Figure 17: Data model for TEL papers and events.
N
N
N
N
1
NN
N
1
N
1
N
N
N
1
N
1N
1N
Paper Authorauthorship
Proceeding
Event
Event Series
Keyword
AbstractClassification
cite
appear_in
publish
belong_to
has_abstract
has_keyword
has_classification
belongs_to related_to

– 31 –
Table 6: Selection of conferences relevant to the TEL community.
Conference Series Acronym Series Events Relevancy*
IEEE International Conference on Advanced Learning
Technologies ICALT
Annually 2001-2010
(except 2002) 768
Artificial Intelligence in Education AIED Bi-annually 2005-2009 216
European Conference on Technology Enhanced Learning ECTEL Annually 2006-2010 215
International Conference on Intelligent Tutoring Systems ITS Bi-annually 1992-2010
(except 1994) 168
International Conference on Web-Based Learning ICWL Annually 2002-2010 90
* … Total number of papers in the conference series since 2005, which were written by authors who have also
published in ET&S, CE, or TLT. Note that we considered all proceedings associated on DBLP with the
respective event series; this means e.g. that workshop proceedings associated with a particular conference
event are included as part of the event series.
The five conferences have published a total 3,291 papers between 2005 and 2010. The word cloud of
those word stems that are mentioned at least 100 times in the titles is displayed in Figure 18. It is
evident that the core word stem is learn, with system, support, design, model, collabor, web, educ,
tutor, adapt in the vicinity.
4.2 Social Network Analysis of TEL Venues and Papers
We applied time series analysis on the networks to reveal the following SNA parameters from the
networks over time: Densification law, clustering coefficient, maximum betweenness, largest
connected component, diameter, and average path length [25]. These parameters enable us to explain
the community building process that we proposed in [20], as depicted with adaptations in Figure 19.
To interpret the shape of the community, one needs to use a combination of all of those parameters.
We note that this is not the only model that explains the development pattern of every conference. We
present it here because, as we found in our previous study [20], it is a typical model that describes the
community building process of many conferences in different areas in computer science: Initially,
there are few connections between authors. After some events, author groups become apparent in the
network (“Bonding” in Figure 19), which are—in the best case—gradually integrated through
publications that involve authors from more than one group (“Emergence” in Figure 19). Over time, a
conference a conference then typically reaches a state of development that either represents an
interdisciplinary, hierarchical or focused authorship network, the latter including a strongly connected
core group of authors that is connected to other smaller groups.
Figure 18: Word cloud of most frequent terms in TEL conference paper titles.

– 32 –
Figure 19: Development model for conference communities.
4.3 Co-Authorship Network Analysis
4.3.1 Formal Foundations
Co-authorships on papers can be modeled as a social network. Let � be the set of papers, let be the
set of outlets relevant to TEL (conferences, journals, books, etc.), and let ( be the set of authors.
Function ) represents the authorship of papers ∈ � by author(s) � ∈ ( and is defined as follows:
) ∶ � � ( → � ����,if� ∈ (is author of ∈ ������,otherwise . Function * represents the appearance of papers ∈ � in outlets � ∈ and is defined as follows:
* ∶ � � → � ����,if ∈ �appeared in� ∈ �����,otherwise .
Assuming that ( and only contain relevant authors and outlets, respectively, we can define the co-
authorship graph �+ = (�+ , �+� with �+ = ( and
�+ = �(�, �� ∶ �, � ∈ �+ ∧ � � ∧ ∃( , �� ∈ � � ∶ *( , �� ∧ )( , �� ∧ )( , ��". 4.3.2 Overview
All five conference co-authorship networks are complex networks. In the years since 2003, these five
conferences combined have published papers written by a relatively stable number of 1,350 (co-
)authors each year. This is shown in Figure 20.
For illustration, Figure 21 displays the current co-author network for each of the five conferences in
thumbnail form. Each thumbnail represents the state of the co-authorship network as of end of year
2010.

– 33 –
Figure 20: Cumulative annual (co-)author figures of selected TEL conferences over the last 10 years.
(a) ICALT
(b) ECTEL
(c) AIED
(d) ITS
(e) ICWL
Figure 21: Co-authorship network visualization for the TEL conferences.
0
200
400
600
800
1000
1200
1400
1600
2000 2001 2002 2003 2004 2005 2006 2007 2008 2009 2010
ICWL
AIED
IST
ECTEL
ICALT

– 34 –
4.3.3 Dynamic SNA
In the light of a typical development pattern as introduced in Figure 19, these conferences expose a
mixed picture. ICALT (a) and ECTEL (b) have well connected authors. For ECTEL, which is only half
as old as ICALT, this is a remarkable achievement that is likely based in the origins of ECTEL: the
conference was started as an initiative out of the PROLEARN project in 2006, and to this day remains
a strongly EU TEL project focused presentation outlet and meeting venue. As we see from Figure 22d,
ECTEL gathers about 30% of all authors in the largest connected sub-network, with several clearly
distinguishable sub-networks in the periphery. ICWL (e) on the other hand is as old as ICALT and
seems to struggle with managing the transition from stage b to stage c in the development pattern in
Figure 19. Less than 15% of all ICWL authors form the core circle of this conference. The remaining
two conferences AIED (c) and ITS (d) expose very mature author communities, which is likely due to
the fact that these two conferences attract a strong core of artificial intelligence (AI) researchers. In
that sense, they are probably difficult to compare with the other TEL conferences, since their core topic
is AI rather than TEL.
The density, i.e. the ratio between the number of edges and the number of nodes increases over time
with a coefficient larger than 1 and lower than 2 (Figure 22a). The clustering coefficient of all co-
authorship networks is quite high and falling over the years (Figure 22b) but Figure 22d shows that
AIED and ECTEL have quickly growing largest connecting components (i.e. the core sub-network of
authors) indicating a faster scientific community building process than for ICALT and ICWL.
ITS has the largest core author group of all five conferences, but it needed longer to develop. Also the
maximum betweenness of ITS is the biggest indicating that there are many active key members (i.e.
those authors that connect different author communities through co-authoring of papers) contributing
to the conference and the community development. ICALT and ICWL have not such a clear pattern,
while AIED and ECTEL are developing very fast. Fast development of the community typically
indicates that the conference has a tighter focus and/or the authors publishing at those conferences
already had strong ties among each other. ECTEL, for example, is a European conference, so the
community is by definition smaller than that of ICALT or ICWL, which address TEL communities
worldwide.
For interdisciplinary conferences, it is common that there are several strongly connected clusters
representing the different disciplines, while there are connecting authors between those. Some TEL
conferences under analysis here expose characteristics of interdisciplinary networks (evident in the
ICWL network), while there are also cases of apparently focused authorship networks e.g. for ICALT
and ECTEL. Still, the largest connected components (the core author group) for TEL conferences tend
to include about one third of the authors. For strongly focused and “grown-up” conferences, e.g.
SIGMOD or VLDB in computer science (which are beyond their 30th anniversary), the largest
component includes roughly two thirds of all authors who have published there.
All diameters of the co-authorship networks are still growing; this indicates that the development of
the communities of these conferences is not finished yet (Figure 22e). The diameter represents the
length of the longest shortest path through the network, so a peak in diameter growth would indicate
lack of integrating new author communities into the conference community. Also the average path
length is still growing indicating again that the overall TEL author network is still growing.

– 35 –
4.3.4 Most Prolific Authors and Their Topics
The 15 most prolific authors in terms of published papers at the conferences and journals are displayed
in Table 7. The ranking considers papers published at venues with a core TEL scope—that is, papers at
ICALT, ECTEL and ICWL conferences, as well as ET&S, TLT, and CE journals. To remove bias
introduced by conferences and journals with a longer publishing record only papers published since
the year 2000 were considered.
The table shows that by far the most prolific author has been Kinshuk, who is with Athabasca
University, Canada. The most prolific European author is Demetrios G. Sampson from University of
Piraeus, Greece. The ranking clearly shows that, although the conferences have visited all continents
and the journals are independent of author and venue location, TEL research (in terms of published
outcomes) seems mainly based in Europe and Asia. Only one author accounts for North America, i.e.
Kinshuk. However, until 2006 Kinshuk was with Massey University in New Zealand, making the
ranking an almost exclusively “Eurasian” list.
Figure 22: Co-authorship network measures of five conferences in TEL.
101
102
103
104
101
102
103
104
Nu
mber
of
edges
Number of nodes
(a) Densification law
ICALT: 0.34889*x1.1976
ICWL: 1.1149*x1.0544
ECTEL: 0.40338*x1.2415
ITS: 0.15818*x1.3817
AIED: 1.0128*x1.1197
1 2 3 4 5 6 7 8 90.75
0.8
0.85
0.9
0.95
1
Clu
ste
ring
coeff
icie
nt
Age
(b) Clustering Coefficient
ICALT
ICWL
ECTEL
ITS
AIED
1 2 3 4 5 6 7 8 90
0.02
0.04
0.06
0.08
Maxim
um
betw
ee
nness
Age
(c) Maximum Betweenness
ICALT
ICWL
ECTEL
ITS
AIED
1 2 3 4 5 6 7 8 90
0.1
0.2
0.3
0.4
0.5
0.6
0.7
La
rgest
conn
ecte
d c
om
ponent
Age
(d) Largest connected component
ICALT
ICWL
ECTEL
ITS
AIED
1 2 3 4 5 6 7 8 90
5
10
15
20
Dia
mete
r
Age
(e) Diameter
ICALT
ICWL
ECTEL
ITS
AIED
1 2 3 4 5 6 7 8 90
2
4
6
8A
vera
ge p
ath
length
Age
(f) Average Path Length
ICALT
ICWL
ECTEL
ITS
AIED

– 36 –
Table 7: Fifteen most prolific authors at conferences and journals with a broad TEL scope. Names marked with an asterisk (*) indicate authors currently based in Europe.
Rank Author Name # Papers
1. Kinshuk 59
2. Toshio Okamoto 38
Demetrios G. Sampson* 38
4. Rob Koper* 34
5. Alexandra I. Cristea* 33
6. Nian-Shing Chen 31
7. Maria Grigoriadou* 25
Dragan Gasevic 25
Erkki Sutinen* 25
Ralf Klamma* 25
Chin-Chung Tsai 25
12. Erik Duval* 23
Tak-Wai Chan 23
Gwo-Dong Chen 23
Wolfgang Nejdl* 23
Top topics in top authors’ papers. Assuming that the most important TEL authors according to
this list also have an influence in the current focus and future direction of TEL topics, it is worthwhile
to analyze the topics of the papers these authors have published. There are 21 paper title term stems7
that have had a rising frequency between 2008 and 20108 (with no intermediate fall). The top-10 of
those by ordered by absolute frequency in 2010 are mobil, comput, hypermedia, virtual, learners,
engin, cognit, multimedia, study, style, and project. The ten most frequent term stems between 2007
and 2010 without taking into account the frequency tendency are learn, adapt, web, model, educ,
system, support, semant, design, and collabor.
The most frequent term stems in 2010 that have not dropped in frequency compared to 2009 are
adapt, semant, design, mobil, author, awar, manag, person, and knowledg (compare Figure 23). This
word cloud represents the most recent upcoming work of the top authors published in 2010, and
should therefore be a good indicator of the current direction. It clearly indicates a way towards
adaptive, personalized and mobile learning, with an emphasis on semantics, management, authoring,
and awareness.
7 Word stemming was performed using Jon Abernathy’s PHP implementation of the Porter Stemming
Algorithm, which can be found at http://www.chuggnutt.com/stemmer-source.php. Prior to that, a stop-word
list was applied. A few overlapping word stems resulting from this algorithm were then merged manually.
8 The paper data was last updated in October 2010, so the 2010 frequencies were multiplied by 4/3 to account
for the missing three months in 2010. This will tend towards values that underestimate the real frequency,
since the DBLP data is usually updated some time (sometimes days, sometimes weeks, sometimes months)
after the publication date.

– 37 –
4.3.5 Overall TEL Co-authorship Network
Looking at the combined co-authorship graph of the core TEL venues (ECTEL, ICALT, ICWL, TLT,
ETS and CE), we obtained 14,689 distinct co-authorship relationships among 7,802 authors. Some
noteworthy facts about this graph are:
• The largest connected component—i.e. the inner circle of co-authors—consists of 2,249
authors (6,251 co-authorship relations), which corresponds to 28.8% of all authors. Having
almost one third of all authors in the inner co-authorship circle indicates that this core TEL
author community (displayed in Figure 25) is tightly knit. However, as evident in Figure 24
there are 1,401 connected components in total in the graph, which means that there are a huge
number of disconnected co-authorship circles that do not “integrate” with the core.
Figure 23: Most frequent terms in papers of top TEL authors in 2010.
Figure 24: Complete co-authorship network in the core TEL venues.

– 38 –
• The average degree centrality of the authors is 3.765, which means that each author has been
writing papers with almost 4 different colleagues.
• The clustering coefficient of the graph has a value of .718, which indicates a mature co-
authorship network.
• The average shortest path length is at 7.6, which is typical for a small-world network, in which
most nodes can be reached from every other by a small number of steps, although the network
may be very large (cf. Milgram’s small world experiment [14]). The diameter, i.e. the most
distant connection between any two authors spans 28 nodes, which is quite a large extent.
4.3.6 Central Authors in the Co-Authorship Network
The top 15 authors in the TEL co-authorship network are listed in Table 8. The table is ordered by
betweenness centrality, since this measure is a very good indicator whether an author has integrated
different communities. In addition, the table lists the PageRank value as well as clustering coefficient
and degree centrality for each author. According to this list the top author is Kinshuk, who weighs in
with 72 different co-authors and who is part of more than 3% of all shortest paths through the
network. He has by far the highest betweenness and PageRank values, indicating his central position
in the network. The most important European authors in this list are R. Koper, who is with Open
Universiteit Nederland (a central organization in the European TEL project landscape; see Table 4 in
Figure 25: Co-authorship network of the “inner circle” of authors in the core TEL venues.

– 39 –
Section 3.4.2) and A. Cristea who has an affiliation history with University of Warwick and TU
Eindhoven, which are also both frequent collaborators in TEL projects.
Table 8: Top 15 TEL authors by betweenness centrality9.
Rank Author Betweenness
Centrality PageRank
×10-2 Clustering Coefficient
Degree Centrality
1. Kinshuk .0315 .2011 .0411 72
2. Rob Koper* .0235 .1191 .0968 63
3. Alexandra I. Cristea* .0164 .0869 .1028 32
4. Toshio Okamoto .0116 .1092 .0796 39
5. Yongwu Miao* .0113 .0221 .2051 13
6. Heinz Ulrich Hoppe* .0112 .0765 .1351 32
7. Hugh C. Davis* .0109 .0854 .1336 37
8. Daniel Burgos* .0092 .0260 .2053 20
9. Stephen J. H. Yang .0088 .0439 .1810 15
10. Shian-Shyong Tseng .0074 .0401 .2762 15
11. Chin-Chung Tsai .0073 .0868 .0746 32
12. Davinia Hernández Leo* .0073 .0597 .2080 27
13. Ralf Klamma* .0069 .0870 .1817 41
14. Nian-Shing Chen .0064 .1108 .0692 40
15. Jin-Tan Yang .0061 .0535 .1527 29
The top-10 co-authorship pairs in the core TEL venues are listed in Table 9. Nine of those involve
European authors, demonstrating the strong collaboration ties within and with European TEL.
Table 9: Top ten co-author pairs in core TEL venues.
Rank Author Pair Papers
1. Jelena Jovanovic* with Dragan Gasevic 16
2. Juan I. Asensio-Pérez* with Yannis A. Dimitriadis* 14
Jon A. Elorriaga* with Ana Arruarte Lasa* 14
4. Kinshuk with Nian-Shing Chen 13
Ralf Steinmetz* with Christoph Rensing* 13
6. Manuel Caeiro* with Luis E. Anido-Rifón* 12
Pablo Moreno-Ger* with Baltasar Fernández-Manjón* 12
José Luis Sierra* with Baltasar Fernández-Manjón* 12
Yao-Ting Sung with Kuo-En Chang 12
10. Ignacio Aedo* with Paloma Díaz* 11
Ralf Klamma* with Marc Spaniol* 11
4.4 Structural-Semantic Analysis: SNA and Topic Mining Combined
Methodology. In D4.1, “Report on Weak Signals Collection” [23], a simple approach to mining
conference abstracts for candidate weak signals was described along with the findings and initial
interpretation of the possible meaning of those findings. By combining this—i.e. the “semantic
9 The metrics were computed using the igraph package in R. The betweenness centrality was calculated using
unweighted co-authorship connections. An asterisk (*) next to an author’s name indicates that this author’s
currently main affiliation is with a European organization.

– 40 –
analysis”—with social network analysis of the co-authorship network—i.e. the “structural analysis”—
we believe it is possible to gain a better understanding of the significance of candidate weak signals.
Author betweenness centrality was used to identify abstracts from the set of papers found to have
unexpected increases in topic prominence as judged by the increase in single-term occurrence (or
newly appearing terms) in D4.1. This centrality measure is expected to be a useful indicator of weak
signal significance since it shows the author’s importance in chains of communication between
otherwise separate (or more-separated) groups of researchers. This can be viewed in two (reciprocal)
ways:
1. An author with high betweenness centrality is likely to have more influence over the spread of
the idea that appears in a conference paper.
2. An author with high betweenness centrality can be expected to be exposed to more diverse
ideas and to identify their significance through a conference paper.
For the purposes of the structural-semantic analysis, the same set of conferences considered in D4.1
was used; betweenness centrality measures were therefore calculated for ICALT, ICWL and ECTEL
only, in contrast to previous sections. About two thirds of the top 15 authors ranked by betweenness
centrality occur in both sets. The most central author was found to be Chen-Chung Liu (betweenness
.00441). The ranked list of authors was inspected down to a betweenness of .00044, i.e. a centrality of
1/10th relative to the top-ranked author.
Key Authorships. Table 10 shows the authors of papers identified in D4.1 as potentially containing
weak signals. It is remarkable that the most central author within this set of papers is at rank 36 and
with a betweenness of approximately 1/6th of the most central author (Kinshuk, with a betweenness
centrality of .026). While it would be premature to draw conclusions from this observation, it does
appear to call into question our approach of using betweenness centrality as a measure of weak signal
significance. Consequently, rather than understanding this measure to give us an absolute indicator of
weak signal significance, we only use it to indicate the relative significance among the set of candidate
weak signals.
Table 10: Betweenness centrality of authors of papers identified in D4.1.
Rank Author Betweenness
Centrality Relative
Centrality # Papers
(D4.1) Co-auth. Group
36. Chen-Chung Liu .00441 1.0 2 A
39. Marcus Specht .00398 0.9 1 B
79. Gary B. Wills .00214 0.5 2 C
95. Marco Kalz .00168 0.4 1 B
109. Marcelo Milrad .00134 0.3 1 -
127. Yvonne Margaret Howard .00122 0.3 1 -
130. Chin-Yeh Wang .00116 0.3 1 A
144. Gwo-Dong Chen .00103 0.2 1 A
176. Hui-Chun Chuang .00068 0.2 1 A
195. Lester Gilbert .00060 0.1 2 C
220. Baw-Jhiune Liu .00048 0.1 1 A
The table also shows co-authorship groups within the selected papers. Although it is clear from
inspection of the full data set that individuals in each of these co-authorship groups are part of
different networks, it would be unwise to assume that the paper “Design and Evaluation of an Affective
Interface of the E-learning Systems” by Hui-Chun Chuang (.0007), Chin-Yeh Wang (.0012), Gwo-

– 41 –
Dong Chen (.0010), Chen-Chung Liu (.0044), Baw-Jhiune Liu (.0005) published at ICALT 2010, has a
significance according to the sum of centrality measures.
On the basis of this data, and recognizing that this is a qualitative judgment, we might nominate the
following as “researchers to pay attention to”:
• Chen-Chung Liu
• Marcus Specht
• Gary B Wills
Key Weak Signals. Four principle themes were synthesized in D4.1 on the basis of around 8
prominent terms and for each, there is at least one related paper written by at least one of the authors
identified in the previous Table 10. The intersection between the themes and author centrality is
summarized in the following Table 11, in which underlining is used to highlight “researchers to pay
attention to”.
Table 11: Summary of structural-semantic analysis: themes and matching papers.
Theme and Comment Papers Matching Criteria
“Affect” is a relatively diffuse topic, which was represented through terms such as “girl”, “emotion”, “skin” and “negative”. Only one paper matches the SNA criterion although all of the authors match it.
“Design and Evaluation of an Affective Interface of the E-learning Systems” (Hui-Chun Chuang, Chin-Yeh Wang, Gwo-Dong Chen, Chen-Chung Liu, Baw-Jhiune Liu, ICALT 2010)
“e-Assessment” and its principle technical counterpart, “QTI” also has one paper matching the structural-semantic criteria, this time with two listed authors.
“A Formative eAssessment Co-Design Case Study” (David A. Bacigalupo, W. I. Warburton, E. A. Draffan, Pei Zhang, Lester Gilbert, Gary B. Wills, ICALT 2010)
“Risk” was highlighted in the context of evidence-based design of learning environments. Only two papers were identified in D4.1 and both also match the SNA criterion, which matched three out of the five authors (all three belong to the same department).
“Towards an Ergonomics of Knowledge Systems: Improving the Design of Technology Enhanced Learning” (David E. Millard and Yvonne Howard, ECTEL 2010 ) “Towards a Competence Based System for Recommending Study Materials (CBSR)” (Athitaya Nitchot, Lester Gilbert, Gary B. Wills, ICALT2010)
“Authentic learning” is manifested in different ways between the five papers identified in D4.1. Three of these also match the SNA criterion with four distinct authors from our list.
“An Audio Book Platform for Early EFL Oral Reading Fluency” (Kuo-Ping Liu, Cheng-Chung Liu, Chih-Hsin Huang, Kuo-Chun Hung, Chia-Jung Chang, ICALT 2010) “Ambient Displays and Game Design Patterns” (Sebastian Kelle, Dirk Börner, Marco Kalz and Marcus Specht, ECTEL 2010) “Exploring the Benefits of Open Standard Initiatives for Supporting Inquiry-Based Science Learning” (Bahtijar Vogel, Arianit Kurti, Daniel Spikol and Marcelo Milrad, ECTEL 2010)
From the point of view of a weak signals analysis, the weakest theme appears to be “e-Assessment”. In
D4.1 the rise of interest in this theme was ascribed to a main-streaming of e-assessment leading to
papers reflecting e-assessment in practice. This is somewhat in contrast to the areas of research that
are grouped under the other three themes, which are more aspirational.
On the basis of the structural-semantic analysis, there seems no clear reason to give particular
prominence to any of the other three themes; none of them has a markedly more influential set of
authors than the others. This leads us to synthesize a vision of the future, latent in the chosen abstracts
of the TEL research community, with aims such as:
• to increase the degree to which TEL practice uses tools with evidence-based and principled
design methodologies;

– 42 –
• to increase the support for authentic rather than overtly-educational activities through TEL;
• to increase the degree to which affect and emotion are taken account of in learner interactions
with TEL systems.
This represents a vision that is progressive rather than conservative and grounded in pedagogic
concerns rather than technical or managerial matters.
The specific weak signals falling within the three themes are best identified by reference to the subject
matter of the papers, here expressed through the abstracts:
• “Design and Evaluation of an Affective Interface of the E-learning Systems”
Students' affections in learning have a significant impact on engagement and learning outcomes.
When students have negative emotions, they usually do not learn well. But current e-learning systems
often lack many features of profound affection, and fail to provide suitable emotional interaction. In
this paper, we evaluate some studies of affective interaction e-learning systems. We also proposed our
approach to develop an emotionally interactive learning system.
• “Towards an Ergonomics of Knowledge Systems: Improving the Design of Technology
Enhanced Learning”
As Technology Enhanced Learning (TEL) systems become more essential to education there is an
increasing need for their creators to reduce risk and to design for success. We argue that by taking an
ergonomic perspective it is possible to better understand why TEL systems succeed or fail, as it
becomes possible to analyze how well they are aligned with their users and environment. We present
three TEL case studies that demonstrate these ideas, and show how an ergonomic analysis can help
frame the problems faced in a useful way. In particular we propose using a variant of ergonomics that
emphasizes the expression, communication and use of knowledge within the system, we call this
approach Knowledge System Ergonomics.
• “Towards a Competence Based System for Recommending Study Materials (CBSR)”
Most e-learning systems require intervention from a teacher. The development of adaptive hypermedia
systems, such as intelligent tutoring systems, aimed to reduce the teachers' task. However, such
systems are still at risk of inconsistently modelling the user when estimating a learner's knowledge
level. We propose a system called CBSR (Competence based System for Recommending Study
Materials) which recommends appropriate study materials from the Web without requiring teacher
intervention, based upon a competency model. This has the benefit of an improved pedagogical
approach to e-learning, and a more consistent profile of learners' competences which can persist
though their life.
• “An Audio Book Platform for Early EFL Oral Reading Fluency”
Oral reading fluency is essential to overall reading achievements and repeat reading has been found to
be an effective strategy for oral reading fluency. Choral reading is the most authentic use of repeated
readings in the EFL primary grades. However, teachers have neither sufficient time nor adequate
expertise to deal with non-fluent readers. Hence, challenges with oral reading fluency and motivation
have long been considered a common characteristic for teacher and students. Hence, this study
proposed a one-to-one Audio Book Platform ...
• “Ambient Displays and Game Design Patterns”
In this paper we describe a social learning game we implemented to evaluate various means of
ubiquitous learning support. Making use of game design patterns it was possible to implement
information channels in such a way that we could simulate ubiquitous learning support in an authentic
situation. The result is a prototype game in which one person is chosen randomly to become “Mister X”,
and the other players have to find clues and strategies to find out who is the wanted person. In our
scenario we used 3 different information channels to provide clues and compared them with respect to
user appreciation and effectiveness.

– 43 –
• “Exploring the Benefits of Open Standard Initiatives for Supporting Inquiry-Based Science
Learning”
Mobile devices combined with sensor technologies provide new possibilities for embedding inquiry-
based science learning activities in authentic settings. These technologies rely on various standards for
data exchange what makes the development of interoperable mobile and sensor-based applications a
challenging task. In this paper, we present our technical efforts related to how to leverage data
interoperability using open standards. To validate the potential benefits of this approach, we
developed a prototype implementation and conducted a trial with high school students in the field of
environmental science. The initial results indicate the potential benefits of using open standards for
data exchange in order to support the integration of various technological resources and applications.
The key weak signals of recently-recognized R&D needs and associated capacities emerging are:
• Emotionally interactive learning systems;
• An ergonomic perspective to understanding why TEL systems succeed or fail;
• Intelligent tutoring (broad sense) systems based on alternatives to cognitive models (e.g.
competence);
• Game design patterns for learning support using at-hand technologies;
• Exploitation of sensor technologies in mobile devices for authentic learning activities.
The European Commission demonstrated great sensibility for these weak signals, since they are well
represented in the target outcomes of the TEL objective in the upcoming ICT Call 8, which include TEL
systems endowed with capabilities of human tutors with an affective and personalized design, as well
as tools for fostering creativity and non-standard thinking10.
4.5 Citation Network Analysis
The citation networks of the TEL conferences ECTEL, ICALT, ICWL, ITS, and AIED—like the co-
authorship networks—are complex networks with a ratio between number of edges and number of
nodes still growing (greater 1 and less than 2 in Figure 26a). The clustering coefficients of all
conferences are similar, with ICWL exposing a higher coefficient than the other four conferences
(Figure 26b). But Figure 26d shows that the literature of ICWL and ICALT is much less connected than
that of ITS, AIED and ECTEL, which indicates that the two former have a broader, more
interdisciplinary scope than the three latter. This is supported by the maximum betweenness in Figure
26c showing the existence of more common core references in these scientific communities. The
diameters of ECTEL and AIED are beginning to shrink very early indicating that the body of literature
of these community is quite stable and the themes of the communities are found. Also the path length
development is supporting this indicator.
10 See http://ec.europa.eu/research/participants/portal/page/cooperation?callIdentifier=FP7-ICT-2011-8

– 44 –
5 Analysis of the TEL Social Web Starting in the PROLEARN project11, RWTH has been hosting the collection of social web artifacts
related to professional learning and technology enhanced learning from different sources, including
blogs, news lists, podcasts and websites. TEL-Map intends to use the content of these social web
artifacts for supporting weak signal analysis by identifying topics and topic shifts on the TEL social
web. Today, probably the most relevant channels for researchers, practitioners, consumers, and
commentators are blogs and micro-blogs (tweets). Since blogs are the richest data set in Mediabase,
we have extended the blog sources in the original PROLEARN Mediabase with additional blogs and
feeds relevant to TEL. These sources—blogs and feeds—were collected via community mobilization in
the Learning Frontiers portal feed aggregator (see Section 2.2). All sources provided in the feed
aggregator are periodically ingested into the TEL-Map Mediabase.
Sources in the TEL-Map Mediabase are visited each night by a web crawler process that visits all
sources and looks for new entries in these sources, e.g. new blog posts. One problem with RSS/Atom
feeds is that they usually contain only a limited number of recent entries, typically not more than 20.
In many blogs, particularly those kept by frequent bloggers or blogger communities, the feed reflects
11 http://www.learningfrontiers.eu/?q=tel_project/PROLEARN
Figure 26: Citation network measures of five conferences in TEL.
101
102
103
104
101
102
103
104
Nu
mb
er
of
ed
ge
s
Number of nodes
(a) Densification law
ICALT: 0.072098*x1.3285
ICWL: 0.024549*x1.612
ECTEL: 0.030923*x1.4728
ITS:0. 10363*x1.3992
AIED: 0.042131*x1.5493
1 2 3 4 5 6 7 8 90
0.1
0.2
0.3
0.4
0.5
Clu
ste
rin
g c
oe
ffic
ien
t
Age
(b) Clustering Coefficient
ICALT
ICWL
ECTEL
ITS
AIED
1 2 3 4 5 6 7 8 90
0.02
0.04
0.06
0.08
0.1
Ma
xim
um
be
twe
en
ne
ss
Age
(c) Maximum Betweenness
ICALT
ICWL
ECTEL
ITS
AIED
1 2 3 4 5 6 7 8 90
0.2
0.4
0.6
0.8
1
La
rge
st
co
nn
ecte
d c
om
po
ne
nt
Age
(d) Largest connected component
ICALT
ICWL
ECTEL
ITS
AIED
1 2 3 4 5 6 7 8 90
5
10
15
20
Dia
me
ter
Age
(e) Diameter
ICALT
ICWL
ECTEL
ITS
AIED
1 2 3 4 5 6 7 8 90
2
4
6
8
Av
era
ge
pa
th l
en
gth
Age
(f) Average Path Length
ICALT
ICWL
ECTEL
ITS
AIED

– 45 –
only a tiny fraction of the full body of entries posted by the blogger(s). To remedy this issue for newly
ingested sources, the crawler also parses the HTML sources of the blog web pages or blog post pages
for links to older entries that are not listed in the most recent feed. This is possible since most blog
hosting platforms display links to the blog or website archive in a side pane of the page. All new entries
found in the feed and the archived entries found via hyperlinks are retrieved from the web and stored
in the Mediabase both in original markup form and plain non-markup text. In addition a word set is
extracted from the text and stored in the database.
The word sets are immediately processed by a burst detector process, which identifies bursty words
(i.e. frequently occurring words) in the sources. Generally speaking, bursts refer to topics which
appear, gain popularity, and then fade [11]. For instance, if a blogger is writing blog posts about a
conference that she is attending, it is likely that during the conference the blogger’s entries expose
bursty words related to the topic of the conference. Each word burst is associated with a burst power
value that allows ranking and visualization of bursts, e.g. via a word cloud.
Another process extracts links (URLs) from the markup texts of the new entries found in the blogs and
feeds. All links are collected in the database and recorded with their original source. All other existing
sources are scanned whether their URL matches one of the links. All matches are recorded in the
database. This way, we are able to maintain a structured, inter-linked representation of the artifacts in
the TEL blogosphere and the TEL web as represented by TEL-related RSS/Atom feeds in the
Mediabase.
5.1 Social Web Data Set
Data Model. The data model of the indexed TEL blogosphere is presented in Figure 27. Its main
entities are described as follows. Blogs and websites are represented as sources that may contain
several entries (e.g. blog posts or news pages). Both sources and entries are a sub-concept of actor,
which is an abstract concept introduced in the Mediabase to facilitate network analysis by representing
social media artifacts. Actors, which may have community-provided tags, can be located via a URL.
These URLs may be referenced by other entries.
Data Set. At the time of writing this report, the TEL Media database of TEL-Map Mediabase contains
804 TEL-related sources, which contain a total of 341,649 entries. Those entries point to more than
1.08 million distinct URLs in their hypertext. 58,460 of these URLs (ca. 5%) represent sources and
Figure 27: Relational model of the TEL blogosphere.
1
1
N 1
1
N
1
1
N
1 N
N
N
N
1
Source
Entry
source_entries
Actor
Tag
actor_tag
is_a
is_a
Commenthas
Burst
URLentry_urls
actor_url

– 46 –
entries indexed in the Mediabase; the rest refers to sources outside of the collected TEL sources. The
1.08 million URLs are hyperlinked 1.86 million times in total from the different entries. That is, each
entry includes 5.5 hyperlinks on average.
Data Collection. Collection of blog sources started in 2006 in the context of the PROLEARN project.
The distribution of the number of blogs entered since then as well as the blog entries indexed by the
crawlers is displayed in Figure 28. Interestingly, the highest number of blog sources was added to the
Mediabase after the PROLEARN project ended (445 sources in 2008). In 2009 the activity almost
stalled, while after the launch of the TEL-Map project in 2010 the figures are rising again (71 sources
in 2010 and 82 sources in 2011). The development of the number of yearly blog entries indexed
developed similarly. The figure shows the entries indexed since the year 2000, although there are
many entries indexed that were published earlier. There is a discrepancy between blogs added in a year
and the entries in indexed in that year. The reason is that when a blog is added for instance in 2008,
the crawler also indexes archived entries that were published before 2008, adding blog entries to
previous years. So the current increase in added blog sources in the coming year will lead to a
“delayed” increase of indexed blog entries that were actually published in 2011, but not indexed yet.
The figure suggests a lag of 2-3 years when considering the sharp increase in indexed blog entries
starting in 2004, although the indexing only began two years later in 2006.
Although the number of indexed entries is very large and a useful body to analyze, there are certainly
more than 804 relevant sources out there on the web for TEL. One focus in future TEL-Map work
therefore will lie in continuously extending the body of indexed sources.
5.2 Formal Foundations
Reference networks between sources and entries on the TEL social web can be modeled as social
networks. Let , be the set of social web sources (e.g. blogs, web pages), let � be the set of distinct
entries (e.g. blog posts, news posts) contained within these sources, and let ( = , ∪ � be the set of
actors, representing a union of sources and their entries. Function . maps the entries � ∈ � to their
containing sources � ∈ , and is defined as follows:
. ∶ , × � → � ����,if� ∈ �iscontainedins ∈ ,�����,otherwise. Function <= represents the links from entries � ∈ � to actors � ∈ ( as follows:
<= ∶ � × ( → � ����,if� ∈ �links to� ∈ (�����,otherwise .
Figure 28: Number of blogs added to and blog entries indexed in the TEL-Map Mediabase.
0
50
100
150
200
250
300
350
400
450
500
0
10,000
20,000
30,000
40,000
50,000
60,000
70,000
80,000
2000 2001 2002 2003 2004 2005 2006 2007 2008 2009 2010 2011
Entries
Blogs
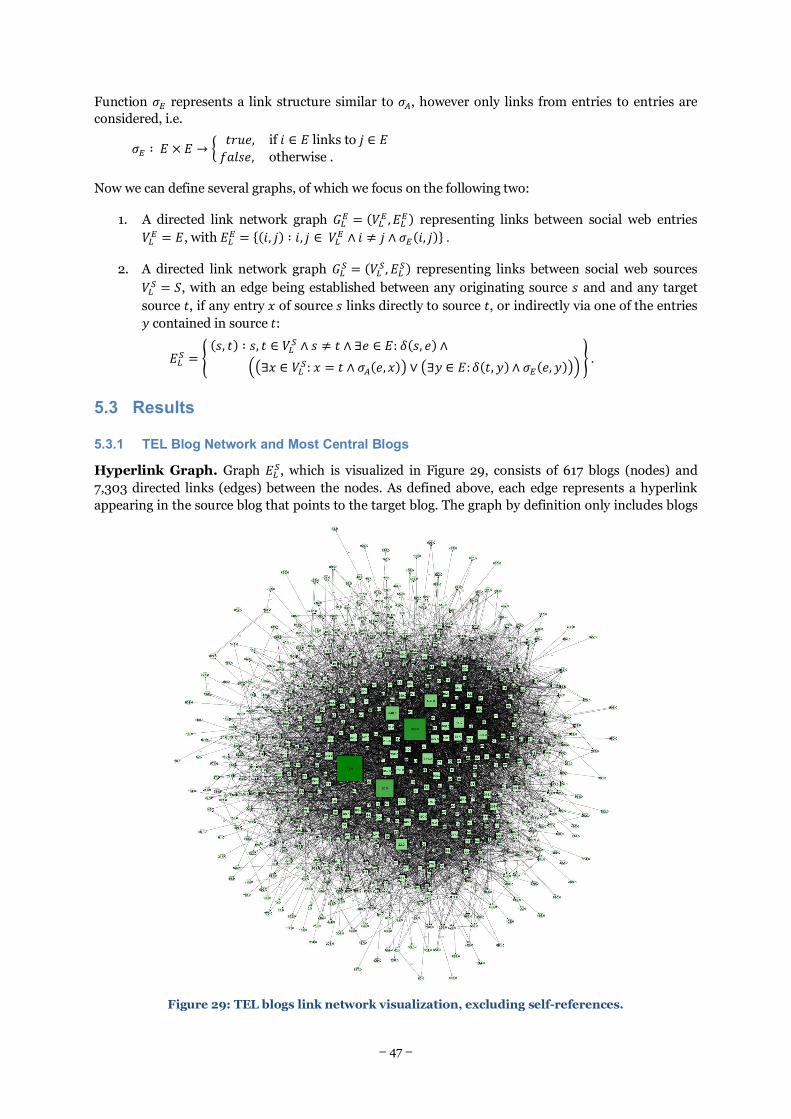
– 47 –
Function <> represents a link structure similar to <=, however only links from entries to entries are
considered, i.e.
<> ∶ � � � → � ����,if� ∈ �links to� ∈ ������,otherwise .
Now we can define several graphs, of which we focus on the following two:
1. A directed link network graph �?> = (�?> , �?>� representing links between social web entries �?> = �, with �?> = �(�, �� ∶ �, � ∈ �?> ∧ � � ∧ <>(�, ��". 2. A directed link network graph �?@ = (�?@ , �?@� representing links between social web sources �?@ = ,, with an edge being established between any originating source � and and any target
source �, if any entry A of source � links directly to source �, or indirectly via one of the entries B contained in source �: �?@ = C (�, �� ∶ �, � ∈ �?
@ ∧ � � ∧ ∃� ∈ �:.(�, �� ∧EF∃A ∈ �?@:A = � ∧ <=(�, A�G ∨ F∃B ∈ �:.(�, B� ∧ <>(�, B�GIJ.
5.3 Results
5.3.1 TEL Blog Network and Most Central Blogs
Hyperlink Graph. Graph �?@, which is visualized in Figure 29, consists of 617 blogs (nodes) and
7,303 directed links (edges) between the nodes. As defined above, each edge represents a hyperlink
appearing in the source blog that points to the target blog. The graph by definition only includes blogs
Figure 29: TEL blogs link network visualization, excluding self-references.

– 48 –
that link to another blog or that are being linked to by another blog, therefore not all sources indexed
in the TEL-Map Mediabase are represented in the network. However, the network includes 77% of all
Mediabase sources, which indicates a healthy, interlinked selection of sources for the Mediabase.
The network exposes one single weakly connected network, i.e. the largest connected component
includes 100% of the network’s nodes; network analysis reveals that there are a total of 217 strongly
connected components, that is, sub-networks where all nodes are immediately connected to each other
through edges. The diameter of the network equals 9 and the average path length is 2.97, which
indicates a highly integrated network, where nodes are close to each other.
Top Sources. Table 12 exposes the twenty most relevant blog sources in the TEL-Map Mediabase
ordered by PageRank, which not only takes into account the weight of edges between nodes, but also
the importance of the source node of a link. The “TEL” column indicates whether a blog is primarily
about TEL related topics (e.g. e-learning, educational technology, etc.) It is evident that nodes with a
high PageRank typically also have strong centrality characteristics in the network. The list includes
some prominent blogs, like those of Stephen Downes (ranked 6th and 8th) and CogDogBlog (9th), while
it also includes references to sources that are not genuinely TEL related, but of high relevance to TEL,
e.g. Creative Commos News (2nd) which deals with licensing issues, and Read/WriteWeb (1st) or Google
Operating System (14th) which deal with (web) technology with no particular TEL focus. Since about
half of the blogs in the table are not genuinely about TEL, it appears that TEL blogs heavily link to
sources that discuss cutting-edge technology.
Table 12: Top twenty blog sources by PageRank. The number in square bracket indicates the blog’s overall rank for the respective metric.
TEL Source PageRank In-Degree Authority Hub Between-
ness Centr.
Read/WriteWeb – http://www.readwriteweb.com .0449 [1] 178 [1] .0228 [1] .0257 [1] .1238 [1]
Creative Commons » CC News – http://creativecommons.org .0400 [2] 144 [3] .0185 [3] .0212 [2] .0386 [4]
apophenia – http://www.zephoria.org/thoughts .0205 [3] 99 [7] .0127 [7] .0152 [6] .0162 [13]
X Weblogg-ed – http://weblogg-ed.com .0158 [4] 132 [4] .0169 [4] .0197 [3] .0384 [5]
Joi Ito's Web – http://joi.ito.com .0149 [5] 19 [117] .0025 [117] .0029 [109] .0015 [151]
X Stephen's Web – http://www.downes.ca .0143 [6] 150 [2] .0192 [2] .0000 [472] .0000 [390]
X Cool Cat Teacher Blog – http://coolcatteacher.blogspot.com .0100 [7] 95 [8] .0122 [8] .0143 [7] .0092 [35]
Half an Hour – http://halfanhour.blogspot.com .0098 [8] 112 [5] .0144 [5] .0163 [4] .0595 [3]
CogDogBlog – http://cogdogblog.com .0098 [9] 78 [10] .0101 [10] .0117 [9] .0349 [6]
X Moving at the speed of creativity – http://www.speedofcreativity.org .0093 [10] 86 [9] .0111 [9] .0129 [8] .0268 [9]
X elearnspace – http://www.elearnspace.org/blog .0090 [11] 111 [6] .0143 [6] .0158 [5] .0798 [2]
iterating toward openness – http://opencontent.org/blog .0085 [12] 45 [28] .0059 [28] .0069 [26] .0085 [37]
X Ideas and Thoughts from an EdTech – http://ideasandthoughts.org .0084 [13] 68 [12] .0088 [12] .0105 [11] .0152 [14]
Google Operating System – http://googlesystem.blogspot.com .0081 [14] 42 [32] .0055 [32] .0063 [31] .0026 [113]
X D'Arcy Norman dot net – http://www.darcynorman.net .0080 [15] 56 [17] .0073 [17] .0085 [17] .0103 [29]
Seth's Blog – http://sethgodin.typepad.com .0079 [16] 68 [12] .0088 [12] .0095 [13] .0043 [76]
X K12 Online Conference – http://k12onlineconference.org .0079 [17] 57 [16] .0074 [16] .0088 [15] .0010 [183]
X The Rapid eLearning Blog – http://www.articulate.com/rapid-elearning .0078 [18] 43 [30] .0056 [30] .0062 [33] .0032 [97]
Avant Game – http://avantgame.blogspot.com .0075 [19] 8 [232] .0011 [232] .0014 [195] .0029 [105]
Michael Geist Blog – http://www.michaelgeist.ca .0074 [20] 30 [61] .0039 [61] .0046 [59] .0039 [81]
Terms in Top Sources. The frequency of word appearance in the entries contained in the blog listed
in Table 12 is displayed as a word cloud in Figure 30. Apart from Google, frequently appearing terms
include for instance: access, copyright, internet, time, course, Canadian, people, search, learn.
Unfortunately this list does not provide conclusive hints to potentially trending topics, probably with
the exception of access and copyright.

– 49 –
5.3.2 TEL Blog Clusters
The blog network includes six communities / clusters, which were identified using the Louvain method
[1]. The clusters are listed in Table 13 along with frequency of word stems appearing in the entries of
those blogs in 2011. In total, there are 16,371 blog entries indexed during the year 2011 to date12.
Clusters C1 and C2 have a negligible count of blog entries, and cluster C2 in particular is represented
mostly by blogs in German language. This language-based clustering indicates that bloggers tend to
point to sources in their own language.
Table 13: Clusters of TEL blogs indexed in Mediabase.
# Color in
Figure 31 Blogs / Entries Top 20 Word Stems in 2011
C0 Yellow 160 blogs (19.9%)
6,865 entries (41.9%)
C1 Gray 13 blogs (1.6%) 30 entries (0%)
C2 Pink 43 blogs (5.3%)
302 entries (1.8%) (German stop-words only)
C3 Green 133 blogs (16.5%)
5,389 entries (32.9%)
C4 Blue 117 blogs (14.6%)
1,770 entries (7.1%)
C5 Brown 150 blogs (18.7%)
1,447 entries (8.8%)
12 Note that the blog network in Figure 29 does not include all indexed blogs, therefore the figures in Table 13 do
not add up to 100%.
Figure 30: Top 100 word stems appearing in 2011 blog entries of the top 20 blogs.
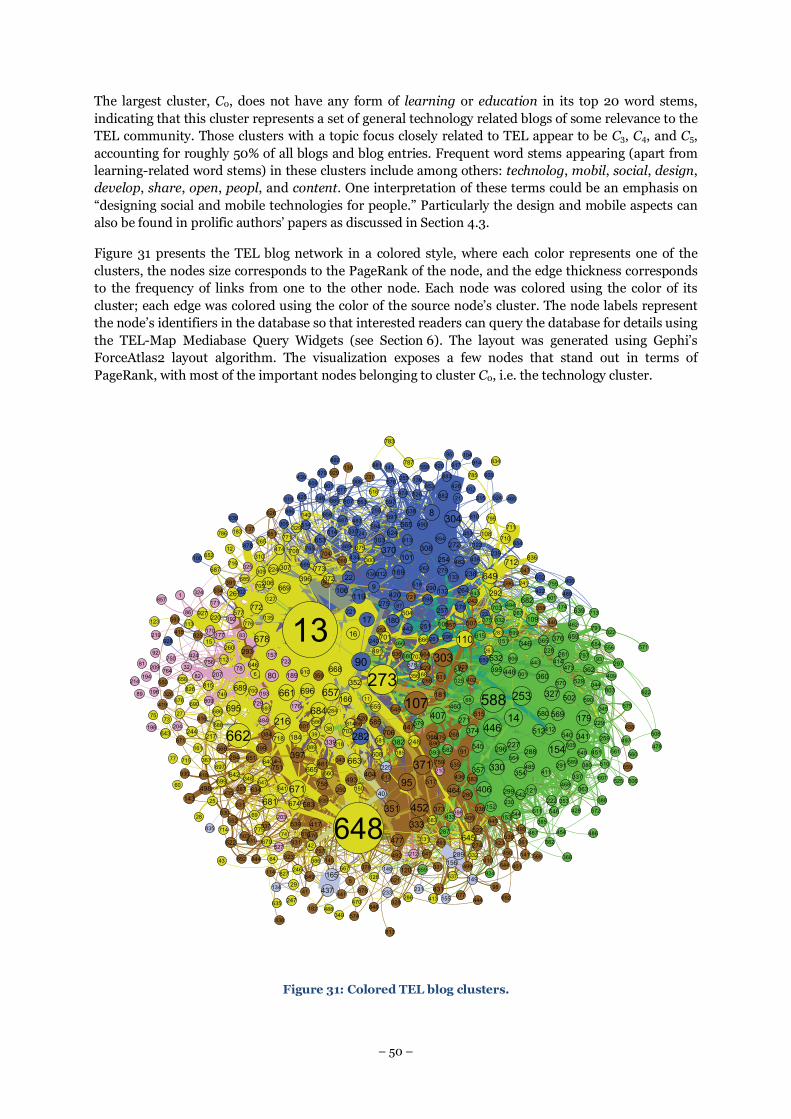
– 50 –
The largest cluster, C0, does not have any form of learning or education in its top 20 word stems,
indicating that this cluster represents a set of general technology related blogs of some relevance to the
TEL community. Those clusters with a topic focus closely related to TEL appear to be C3, C4, and C5,
accounting for roughly 50% of all blogs and blog entries. Frequent word stems appearing (apart from
learning-related word stems) in these clusters include among others: technolog, mobil, social, design,
develop, share, open, peopl, and content. One interpretation of these terms could be an emphasis on
“designing social and mobile technologies for people.” Particularly the design and mobile aspects can
also be found in prolific authors’ papers as discussed in Section 4.3.
Figure 31 presents the TEL blog network in a colored style, where each color represents one of the
clusters, the nodes size corresponds to the PageRank of the node, and the edge thickness corresponds
to the frequency of links from one to the other node. Each node was colored using the color of its
cluster; each edge was colored using the color of the source node’s cluster. The node labels represent
the node’s identifiers in the database so that interested readers can query the database for details using
the TEL-Map Mediabase Query Widgets (see Section 6). The layout was generated using Gephi’s
ForceAtlas2 layout algorithm. The visualization exposes a few nodes that stand out in terms of
PageRank, with most of the important nodes belonging to cluster C0, i.e. the technology cluster.
Figure 31: Colored TEL blog clusters.
225
40
155
578
149
156
148
165
437 231134
233
289
835
193
339
189
83
80
398
176
32
207
756
78
82
809
157
729
192
214
212
81
89
170
722
325
177
198
203
171
86
857
424
3241
527
92
750
194
196
204
209
210
219
484
764
90
106
8304
21
883
370
169
272
119
101
624
255
87
308
23257
9
22
854
17
565
180
238
874
490
558
103
262
598
312
420
653
442
602
487
251
278
765
438
132
434
591
279
810
240
807
614
221
85
275
906
258 638
290
425
254
302
518
305
563
482
379
526617
650
264
595
597
298
239
139
24
133
928
426
215
122913
882519
901
483
465
136
146
147
282
576
102
400
514
609
469
261
422
524
654
636
892
878
820
335
914
439
453
100
104
489
594
600
853
858
885
881
886
917
271
406
588
703
357
407
680
446
346
460
68
365
153
382
448
14
154
354330
327253
288296
360
569
540
532
549
542
259
468
414
109
179
512
485
395
341
615
806
228
222
545
502
682
529
151
639
299
580
297
572
589
579
459
385
713
607
105
291
803
570
473
546
229
582
590
556
281
374
599
152
433
227
230
501
362
393
755
497
376
345
511
93
337
659
797
287
174
505
121 363
125
466
561
267
494
412
525
451
411
409
832462
922
510
301
544
575
353
562
344
554
564
368
375
571
380
388
560
924
506
428
443
454
791322
508
467
478
486
547
843
4
107
583
181
758250
435
493
5
397
378
416
629
293
303
371
359
404
333
351
706
759
517
634
436
447
96
464
91
620
566
495
384
751
452
601
461
417
95
704
41
114
522
405
507
120
477
523
585
613
552
610
551
294
331
431
403
399
338
445
373
535
328
475
664
98
539
383
274
137
596
440
143
498
145
280
557
929
415
419
410
499
593
931
268
721
534
366
402
242
631
252
266
269
628
538
844
391
622
492
387
621
130
326
515
503
692677
343
358
548
849
423
644
456
237
531
930
401
458
476
574
347
559
182
418
441
444
450
848
361
536
496
651
541
530
141
825
550
568852
871
876
757
839
837
813
831
838
863
648
6
669
772
662
661
13678
273
577
474
660
27
216
663
217
396
307
686
306
127
708
65711
110
696
372
684
668
15
166
716
38
581
695
702
220
687
248
491
16
135
671
352
26
647
814
161
701
665
608
683
681
184
131
310
712
666
718
776
241
224
655
504
25
699
244
28
29
39
218
150
675
74
64
470
168
77
7573
771
389
637
284
42
674
43
60
108
263
300
69
749
705
815
185
283
640
773
260
707112
113
927
123
649
128
645
309
140
586
292
658
667
642
689
775
641
826
714
646
679
697
246
247
265
286
786
783
348
12
329
332
349
356
367
413
386
710
183
652
711
488
516
635
643
690
836
676
685
688
693
700
795
834
715
787
785
827
910
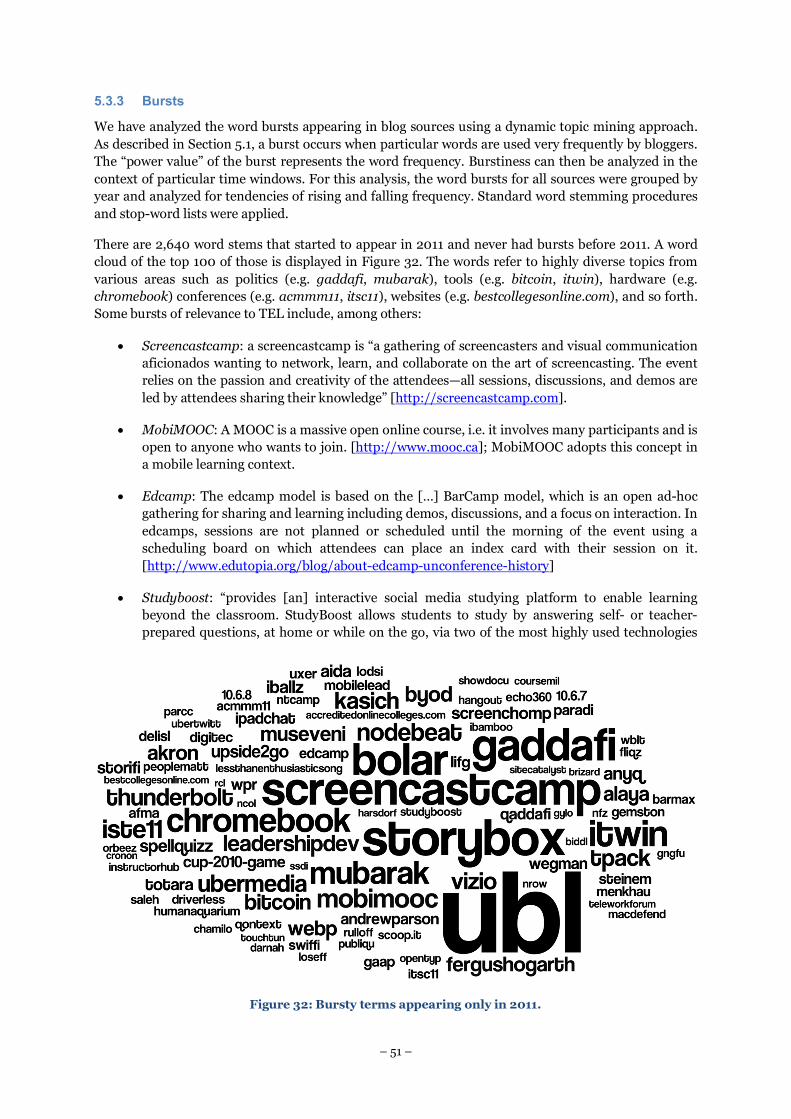
– 51 –
5.3.3 Bursts
We have analyzed the word bursts appearing in blog sources using a dynamic topic mining approach.
As described in Section 5.1, a burst occurs when particular words are used very frequently by bloggers.
The “power value” of the burst represents the word frequency. Burstiness can then be analyzed in the
context of particular time windows. For this analysis, the word bursts for all sources were grouped by
year and analyzed for tendencies of rising and falling frequency. Standard word stemming procedures
and stop-word lists were applied.
There are 2,640 word stems that started to appear in 2011 and never had bursts before 2011. A word
cloud of the top 100 of those is displayed in Figure 32. The words refer to highly diverse topics from
various areas such as politics (e.g. gaddafi, mubarak), tools (e.g. bitcoin, itwin), hardware (e.g.
chromebook) conferences (e.g. acmmm11, itsc11), websites (e.g. bestcollegesonline.com), and so forth.
Some bursts of relevance to TEL include, among others:
• Screencastcamp: a screencastcamp is “a gathering of screencasters and visual communication
aficionados wanting to network, learn, and collaborate on the art of screencasting. The event
relies on the passion and creativity of the attendees—all sessions, discussions, and demos are
led by attendees sharing their knowledge” [http://screencastcamp.com].
• MobiMOOC: A MOOC is a massive open online course, i.e. it involves many participants and is
open to anyone who wants to join. [http://www.mooc.ca]; MobiMOOC adopts this concept in
a mobile learning context.
• Edcamp: The edcamp model is based on the […] BarCamp model, which is an open ad-hoc
gathering for sharing and learning including demos, discussions, and a focus on interaction. In
edcamps, sessions are not planned or scheduled until the morning of the event using a
scheduling board on which attendees can place an index card with their session on it.
[http://www.edutopia.org/blog/about-edcamp-unconference-history]
• Studyboost: “provides [an] interactive social media studying platform to enable learning
beyond the classroom. StudyBoost allows students to study by answering self- or teacher-
prepared questions, at home or while on the go, via two of the most highly used technologies
Figure 32: Bursty terms appearing only in 2011.

– 52 –
amongst students: SMS text messaging and instant messaging. For teachers, StudyBoost
empowers them to use popular technology to further engage their students beyond the
classroom or to integrate technology for learning into their plans. For students, StudyBoost
makes true mLearning a reality by leveraging technology they are intimately familiar with and
that they carry around everywhere.” [https://studyboost.com/about_us]
These four bursts in 2011 all point in to a model of leveraging web technology (in particular: mobile
technology) for an open and inclusive approach to education and learning.
In a further step we identified bursty words that have been rising in power over the last three years.
3,641 word stems match this criterion, of which the top one hundred are displayed as a word cloud in
Figure 33. Again, the figure exposes many terms with no particular TEL provenance. However, there
are mentions of technologies and trends that are definitely relevant to TEL (and appearing to point
into a similar direction as the bursts exclusively appearing in 2011 as presented above). For instance:
• Screencastcamp (see above);
• ds106 (an open online course on digital storytelling; see http://ds106.us and transmedia
(often used in conjunction with storytelling);
• mobilelearn, mlearncon, and tablet (as a mobile device).
6 Embeddable Interactive Visualizations and Queries As a typical result of interacting with information visualization artifacts, the exploration of the social-
network view on TEL-Map Mediabase artifacts such as papers, blogs and projects as presented in
previous sections will spawn more specific questions and exploratory tasks (cf. [5]). It may trigger
wishes for “zooming into” the data by obtaining more detailed information on contained nodes and
edges, e.g. a list of the top funded organizations or the projects with the highest rate of consortium
progression to or from other projects, or all papers that have specific words in the abstract, etc.
Figure 33: Bursty terms with rising frequency over the last three years.

– 53 –
To achieve interaction with the data based on specific queries arising during the exploratory process,
we developed a web-based toolkit for interactive SQL query visualization, which was developed
specifically for end-users.
The toolkit was implemented as a set of inter-communicating Google Gadgets, allowing users to
connect with TEL-Map Mediabase databases and query these databases using SQL. The result of a
query is immediately visualized by simply choosing one of the predefined types of visualization, i.e.
tables (the typical result presentation in database query applications), bar and pie charts, timelines,
and graphs. There are several configuration options for the more complex visualizations, particularly
for graphs.
For instance, the screenshot in Figure 34 shows two different visualizations of a query that obtains an
ordered list of pairs of organizations that are involved in the same FP7 project consortia, restricted to
pairs that appeared together in more than one project consortium—i.e. a subset of the partnership
graph �$ introduced in Section 3.4. The left side of the figure shows the query results visualized as a
table. With two mouse clicks the same query results can be visualized as a graph. For constructing the
graph on the right-hand side of Figure 34 the first column of the query result is interpreted as the
source node, the second column as the target node, and the third column as the edge weight. The
layout algorithm for the graph visualization, the meaning of columns, and other parameters can be
configured easily using dropdown boxes (the configuration portion was clipped from the screenshots
in Figure 34.
Figure 35 shows an example of a timeline-based visualization. The first column of the result is
automatically interpreted as a timestamp, and all other result columns are plotted against that value.
The top-right corner displays the values for the current point in time, where the user hovers with the
mouse cursor. The visualization in Figure 35 shows a per-year breakdown of average and maximum
funding per project in FP6 and FP7 as well as sum of funding and number of projects which started in
that year.
Figure 34: Visualization of the same SQL query as a table (left) and as a graph (right).

– 54 –
Furthermore, it is possible to formulate queries with certain filter parameters and have the
visualization react to changed filter values. For example one might only be interested in a sub-network
of �$ that restricts the resulting visualization to immediate collaborators of one particular partner. On
selection of a partner, the gadget refreshes its visualization based on the new query and its results.
Once the query author decides to share the current query and its visualization with the public, one
click (on the “Send to Gadget Creator” button) will generate a custom gadget: A web service in the
toolkit’s backend generates the complete code for a Google Gadget which will display the query result
visualization. Once published the resulting gadget can be embedded into any web page, e.g. into the
personal iGoogle homepage. By combining multiple gadgets produced with this toolkit, it is then
possible to arrange complete interactive web-based data dashboards, where stakeholders can have a
real-time visual presentation of data that is interesting and relevant to them.
Currently we have links to the query widgets available on the TEL-Map website (see the D4.3 resource
page at http://telmap.org/?q=content/d4.3), allowing either to open the widgets in a normal browser
window or to embed them in the personal iGoogle homepage. To remove SQL-related barriers and
simplify the setup of such “intelligence dashboards” for different stakeholders in TEL to facilitate the
stakeholders in observing different variables of interest at a glance, we are currently working on
enhanced visualizations and stakeholder-tailored sets of predefined and refinable queries on the
different data sources represented in the TEL-Map Mediabase. These are planned to be offered via the
Learning Frontiers portal as embeddable widgets.
Figure 35: SQL query visualization as an annotated timeline.

– 55 –
7 Key Findings for Weak Signals In this section we present a list the key findings drawn from the analyses and results reported mainly
in Sections 3–5. Those key findings that are related to or have implications for European Commission
policy in TEL are highlighted with a bounding box. The key findings are grouped by the three data
sources in the TEL-Map Mediabase.
7.1 TEL Projects
“Multi-Culturality” The list of the most prolific organizations in FP7 exposes the diversity of top
organizations both in structure and location. The top-five list includes a distance university, a research
company, a traditional university, topped by a psychology department at a technical university, all
located in different countries. The topic distribution also shows that particularly in FP7 there are many
aspects in the project descriptions that are both genuinely related to human needs, with strong
supportability by technology (e.g. adaptation).
North-South Axis. The more than 200 organizations that have participated or are participating in
TEL projects in FP7 to date are mostly aligned on a North-South axis across Europe starting in
Scotland/England and the Nordic countries, via Netherlands, Belgium, West Germany, Switzerland
and Austria, and practically terminating in Northern Italy. The Southern and Eastern regions of
Europe and some prominent countries like France appear underrepresented. There is a huge
development potential for the countries in these regions, and for the European Commission as well, in
terms of funding and contribution in future TEL calls.
eContentplus as Gap Filler. While there are strong ties between FP6 and FP7 in terms of
participating organizations, it was demonstrated that eContentplus acted as a broker between FP6 and
FP7 project consortia. Particularly some Best Practice Networks like ASPECT or ICOPER, and also
Targeted Projects like OpenScout, have many strong consortium overlaps with both preceding FP6
projects and succeeding FP7 projects. This pattern is probably simply due to the fact that in 2007 there
were neither new project launches in FP6 nor in FP7. On the other hand it could also be attributed to a
plain “research follows money” attitude. That is, if there had not been funding from eContentplus,
organizations would likely have looked for funding opportunities in TEL-related programmes with
different focus between 2006 and 2008. Anyway, eContentplus apparently was supportive and non-
disruptive for the organizational collaboration network in European TEL, since eContentplus projects
are found in all identified project clusters, despite having a quite “narrow” topic focus around e-
content and metadata issues.
Role of Project Type. In the social network analysis of TEL projects it was revealed that Integrated
Projects (IPs), Networks of Excellence (NoEs) and eContentplus Best Practice Networks (BPNs) are
the most central projects, whereby this cannot solely be ascribed to the typically larger size of the
consortia of these projects compared to e.g. STREPs. For instance, these projects typically also include
pairs of organizations that appear in list of most frequent collaborators. Also these projects have a
significant share of their consortium made of organizations that have a highly favorable centrality vs.
clustering ratio. This indicates that IPs and NoEs are very important not only for shaping the research
agenda, but also for creating the strong and sustained collaboration ties between TEL organizations.
The TEL Family. With every new TEL project, relatively fewer organizations are penetrating the
existing overall collaboration network in TEL projects. Over the last three years, an average of 40% of
the consortia of new projects was not previously involved in any TEL projects. The sharpest drop in
this number occurred for projects that started in the year 2008 (from 62% to 42%), when the first FP7
TEL projects were launched. It appears that at the transition to FP7, the project consortia—and the
European Commission—resorted to building on and funding an established core of organizations, thus
strengthening existing collaboration bonds; this will eventually lead to a tightly knit “family” of TEL

– 56 –
organizations, an inertial mass that can impede the involvement of new organizations, and likely also
new ideas and research foci. This is strengthened by the fact that of the 34 launched TEL projects since
2008, 4 out of 5 are being coordinated by organizations that have already participated in at least one
previous TEL project. Of course, from the EC’s viewpoint it seems reasonable to fund projects where a
large share of the consortium have previous experience in EC-funded TEL projects. Still, this appears
to be a policy issue that requires attention.
7.2 TEL Papers
Solid European Base. European researchers are extremely well represented in the most important
TEL conferences and journals, as well as by social network metrics in their co-authorship network. For
instance, of the 15 most prolific authors in TEL outlets 8 are currently based in Europe; the same ratio
applies to the list of 15 most betweenness-central authors in the co-authorship network of TEL outlets.
“Under Construction.” The five TEL-related conferences, which were subject to scrutiny in
Section 4, have developed constantly, although at a different pace. Comparing this pattern with that of
established conferences in a field—e.g. in sub-disciplines of computer science like databases, data
mining, etc.—we found that the TEL conferences expose a development pattern that is typical of
“young” and interdisciplinary conferences. This means that while there is significant core of 20-30% of
the authors in the “inner circle”, there are also dozens or even hundreds of very small sub-networks
within the co-authorship network that are disconnected from each other. Nevertheless, we see that
conferences and journals in TEL are building their community in a way that shapes a clear core. In this
sense, maintaining and promoting key members who play the role of gate keepers is important.
EC-TEL. The EC-TEL conference series and its (collocated) events can be considered as a highly
successful community in terms of development pattern of the co-authorship network and citation
network. EC-TEL managed to achieve a tight collaboration network and stable citation network after
only few years, while other TEL related conferences are struggling with coherence in their community.
This rapid community development is certainly being propelled by the strong ties in EU TEL projects,
and it is certainly a strong piece of evidence for a high-impact initiative that has its roots in the FP6
network of excellence, PROLEARN.
Interdisciplinarity. TEL is an interdisciplinary field of research, which is both evident from the
project descriptions, core organizations involved in the projects, and also from the publications. For
instance, the authors who published in important TEL journals Educational Technology & Society,
Transactions on Learning Technology, and Computers & Education, also have papers published in
more than one thousand different conference series since 2005 in our data set. That is, the authors are
coming from a multitude of different (sub-)disciplines. In terms of community development,
interdisciplinarity has pros and cons. On the one hand, it attracts researchers from different areas to a
conference. On the other hand, it slows down the process of building the core, as we saw in the
development pattern of more focused conferences like AIED, ITS and ECTEL, versus conferences like
ICWL and ICALT, which have a broader topic focus. The most important conference series for TEL
authors on a global scale authors is probably ICALT: in the events since 2005, ICALT has published a
large number of papers, and it is also an important venue for authors who frequently publish in TEL-
related journals.
Intelligent Systems. The key weak signals that emerged from analysis of papers by central authors
at three main TEL conferences include emotionally interactive learning systems, intelligent tutoring
and exploitation of sensor technologies and mobile devices for authentic learning activities. As said
above in a different context, the European Commission demonstrated great sensibility for these weak
signals, since they are well represented in the target outcomes of the TEL objective in the upcoming
ICT Call 8, which include “TEL systems endowed with capabilities of human tutors” in an affective and
personalized way, as well as “tools for fostering creativity and non-standard thinking”.

– 57 –
7.3 TEL Social Web
Technology Sources as Authorities. From the analysis of the blog network, it became evident that
the largest cluster of blogs being pointed to from entries in the TEL blogosphere are related to
technology news and trends in general and not to TEL in particular; TEL related blogs can be found in
three separate clusters, with one focusing on schools, and the other two focusing on learning,
education, and technology aspects. Two of the TEL related clusters are rather hard to distinguish in
terms of content; more detailed analyses will have to be performed to identify what differentiates these
clusters.
Open and Inclusive Education. The word bursts that have appeared only in 2011, as well as those
with a rising frequency of occurrence in the last three years, indicate a clear emphasis in the most
central blog sources on leveraging web technology—in particular mobile technology—for open and
inclusive approaches to education and learning, e.g. through MOOCs: massive open online courses.
This emphasis could be an interesting thread to follow up in European R&D policy.
8 Conclusion TEL-Map aims at providing the European Commission and other TEL stakeholders with detailed
information (trend-indicators, statistics, analyses, policy implications) on the current and future TEL
landscape. This deliverable reported first analyses and results obtained in WP4 involving the
application of social network analysis and topic mining in several TEL data sources. For each source,
the formal foundation for social network analysis was laid to enable a graph-based and network-based
analysis of the current TEL landscape. In addition, stakeholders are facilitated in interacting with the
TEL data sets and analysis results using intuitive, embeddable tools and flexible analyses. This will
support stakeholders in perceiving, understanding and reasoning about complex data sources in TEL,
which is one of the main goals of visual analytics [22].
There are several limitations in the current data sources and the analyses, which will have to be
addressed in forthcoming WP4 work:
Firstly, the scientific publications indexed in the TEL Papers database are not fully representative of
current trends and current work. Also many highly successful innovative technologies and practices do
not necessarily come with scientific papers. For instance, there was probably no scientific publication
that introduced micro-blogging in education before Twitter was taken up by early-adopting teachers.
In addition to that, our main data source is DBLP, which presents itself as a computer science
bibliography. Although many important TEL venues are represented in DBLP, it only represents a
small subset of potentially relevant venues. In future work we plan to include additional sources.
However, many conference and workshop publications are not indexed in any publicly accessible
bibliography, therefore presenting a serious obstacle to maintaining a comprehensive TEL
publications database.
Secondly, the blogosphere indexed in the TEL Social Media database have been collected with direct
involvement of the community (e.g. through the Mediabase Commander plugin for Firefox); this
database does not constitute a centrally controlled set of sources. Therefore there are many sources
that are not explicitly or immediately related to TEL. For upcoming work we plan to come up with a
data cleansing and sources filtering strategy to increase the focus on TEL.
Finally, the TEL projects dataset exclusively contains FP6, FP7 and eContentplus projects relevant to
TEL. There are many additional sources and projects that could be included, e.g. the Lifelong Learning
Programme, additional projects from the EC Policy Support Programme, the UK JISC funded projects,
and many more. Also, we currently have descriptive metadata on the projects only; that is, we do not
have project deliverables in the database (which would significantly increase the text corpus for data

– 58 –
mining), nor do we have a unified, integrated view on persons as paper authors, as bloggers, and as
members of organizations participating in TEL projects.
By next year several new TEL projects will be funded in FP7 ICT call 8, thousands of new TEL-related
papers will be published, and the blogosphere indexed in the TEL-Map Mediabase will continue to
grow to reflect those changes and subsequent changes. There is a dedicated page on the TEL-Map
website [http://telmap.org/?q=content/d4.3] where the up-to-date data can be accessed, obtained and
queried using embeddable query visualization widgets. In addition, the core results of the first analyses
reported in this deliverable, as well as upcoming analyses with extended and enhanced data sets and
results will be published as stories on the Learning Frontiers portal and accessible via the TEL-Map
website.
References 1. Blondel, V.D., Guillaume, J.-L., Lambiotte, R., Lefebvre, E.: Fast unfolding of communities in
large networks. Journal of Statistical Mechanics: Theory and Experiment 2008, P10008 (2008)
2. Brandes, U., Erlebach, T. (eds.): Network Analysis: Methodological Foundations. Springer (2005)
3. European Commission: FP7 in Brief. http://is.gd/fp7brief (2007)
4. European Commission: Community Research and Development Information Service (CORDIS). http://cordis.europa.eu/home_en.html
5. Fekete, J.-D., van Wijk, J., Stasko, J., North, C.: The Value of Information Visualization. In: Kerren, A., Stasko, J., Fekete, J.-D., North, C. (eds.) Information Visualization, pp. 1-18. Springer Berlin / Heidelberg (2008)
6. Hiltunen, E.: Good Sources of Weak Signals: A Global Study of Where Futurists Look For Weak Signals. Journal of Futures Studies 12(4), 21–43 (2008)
7. Keim, D., Andrienko, G., Fekete, J.-D., Görg, C., Kohlhammer, J., Melançon, G.: Visual Analytics: Definition, Process, and Challenges. In: Kerren, A., Stasko, J., Fekete, J.-D., North, C. (eds.) Information Visualization, pp. 154-175. Springer Berlin / Heidelberg (2008)
8. Kienle, A., Wessner, M.: Analysing and cultivating scientific communities of practice. International Journal of Web Based Communities 2(4), 377 - 393 (2006)
9. Klamma, R., Cao, Y., Spaniol, M.: Watching the Blogosphere: Knowledge Sharing in the Web 2.0. In: Nicolov, N., Glance, N., Adar, E., Hurst, M., Liberman, M., Martin, J.H., Salvetti, F. (eds.) Proceedings of the 1st International Conference on Weblogs and Social Media, Boulder, Colorado, USA, March 26-28, 2007, pp. 105 – 112 (2007)
10. Klamma, R., Spaniol, M., Cao, Y., Jarke, M.: Pattern-Based Cross Media Social Network Analysis for Technology Enhanced Learning in Europe. In: Nejdl, W., Tochtermann, K. (eds.) Innovative Approaches for Learning and Knowledge Sharing, pp. 242-256. Springer Berlin Heidelberg, Berlin, Heidelberg (2006)
11. Klamma, R., Spaniol, M., Denev, D.: PALADIN: A Pattern Based Approach to Knowledge Discovery in Digital Social Networks. Proceedings of I-KNOW ’06, 6th International Conference on Knowledge Management, pp. 457-464. Graz, Austria (2006)
12. Kleinberg, J.M.: Hubs, authorities, and communities. ACM Computing Surveys 31, 5-es (1999)
13. McCallum, A., Nigam, K., Ungar, L.H.: Efficient clustering of high-dimensional data sets with application to reference matching. Proceedings of the sixth ACM SIGKDD international conference on Knowledge discovery and data mining - KDD ’00, pp. 169-178. Boston, Massachusetts, United States (2000)
14. Milgram, S.: The small world problem. Psychology Today 2, 60-67 (1967)

– 59 –
15. Ochoa, X., Méndez, G., Duval, E.: Who We Are: Analysis of 10 Years of the ED-MEDIA Conference. World Conference on Educational Multimedia, Hypermedia and Telecommunications 2009, pp. 189-200 (2009)
16. Olivier, B. (ed.): TEL-Map Deliverable D1.2: Conceptual Framework for Dynamic Roadmapping. http://is.gd/telmapD12 (2011)
17. Page, L., Brin, S., Motwani, R., Winograd, T.: The PageRank Citation Ranking: Bringing Order to the Web. http://ilpubs.stanford.edu:8090/422/ (1999)
18. Petrushyna, Z., Klamma, R.: No Guru, No Method, No Teacher: Self-classification and Self-modelling of E-Learning Communities. In: Dillenbourg, P., Specht, M. (eds.) Times of Convergence. Technologies Across Learning Contexts, pp. 354-365. Springer Berlin Heidelberg, Berlin, Heidelberg
19. Pham, M.C., Klamma, R.: The Structure of the Computer Science Knowledge Network. 2010 International Conference on Advances in Social Networks Analysis and Mining (ASONAM), pp. 17-24. IEEE (2010)
20. Pham, M.C., Klamma, R., Jarke, M.: Development of Computer Science Disciplines - A Social Network Analysis Approach. http://arxiv.org/abs/1103.1977 (2011)
21. Reinhardt, W., Meier, C., Drachsler, H., Sloep, P.: Analyzing 5 years of EC-TEL proceedings - Who we are and what we publish. Proceedings of Sixth European Conference on Technology Enhanced Learning. Springer LNCS, Palermo, Italy (2011)
22. Thomas, J.J., Cook, K.A. (eds.): Illuminating the Path: The Research and Development Agenda for Visual Analytics. IEEE Computer Society (2005)
23. Voigt, C., Pirkkalainen, H. (eds.): TEL-Map Deliverable D4.1: Report on Weak Signals Collection. http://telmap.org/?q=content/deliverables (2011)
24. Wang, X., Jin, X., Chen, M., Zhang, K., Shen, D.: Topic Mining over Asynchronous Text Sequences. IEEE Transactions on Knowledge and Data Engineering PrePrint, 1-15 (2010)
25. Wasserman, S., Faust, K.: Social Network Analysis: Methods and Applications. Cambridge University Press (1994)
26. Wild, F., Haley, D., Bülow, K.: CONSPECT: Monitoring Conceptual Development. In: Luo, X., Spaniol, M., Wang, L., Li, Q., Nejdl, W., Zhang, W. (eds.) Advances in Web-Based Learning – ICWL 2010, pp. 299-308. Springer Berlin Heidelberg, Berlin, Heidelberg (2010)
27. yWorks: Organic Layout Style. http://is.gd/yedorganic
28. yWorks: yEd Graph Editor. http://yworks.com/yed
29. GaLA Home Page. http://www.galanoe.eu/

– 60 –
Appendix A: TEL Projects — Timeline This figure shows a timeline of TEL projects funded under FP6, FP7, and eContentplus.
KALEIDOSCOPE (FP6)
PROLEARN (FP6)
TELCERT (FP6)
ICLASS (FP6)
UNFOLD (FP6)
LEACTIVEMATH (FP6)
CONNECT (FP6)
E-LEGI (FP6)
EMAPPS.COM (FP6)
ICAMP (FP6)
I-MAESTRO (FP6)
MGBL (FP6)
VEMUS (FP6)
CALIBRATE (FP6)
ARGUNAUT (FP6)
ATGENTIVE (FP6)
COOPER (FP6)
LEAD (FP6)
LT4EL (FP6)
PROLIX (FP6)
TENCOMPETENCE (FP6)
RE.MATH (FP6)
ARISE (FP6)
ELU (FP6)
KP-LAB (FP6)
PALETTE (FP6)
UNITE (FP6)
LOGOS (FP6)
APOSDLE (FP6)
ECIRCUS (FP6)
ELEKTRA (FP6)
L2C (FP6)
JEM (eContentplus)
MACE (eContentplus)
MELT (eContentplus)
CITER (eContentplus)
EdReNe (eContentplus)
eViP (eContentplus)
KeyToNature (eContentplus)
Organic.Edunet (eContentplus)
Intergeo (eContentplus)
EUROGENE (eContentplus)
COSMOS (eContentplus)
GRAPPLE (FP7)
LTFLL (FP7)
SCY (FP7)
MATURE (FP7)
80DAYS (FP7)
IDSPACE (FP7)
EduTubePlus (eContentplus)
iCOPER (eContentplus)
ASPECT (eContentplus)
TARGET (FP7)
INTELLEO (FP7)
STELLAR (FP7)
DYNALEARN (FP7)
ROLE (FP7)
COSPATIAL (FP7)
XDELIA (FP7)
mEducator (eContentplus)
Math-Bridge (eContentplus)
LiLa (eContentplus)
OpenScienceResources (eContentplus)
OpenScout (eContentplus)
ALICE (FP7)
ARISTOTELE (FP7)
MIRROR (FP7)
METAFORA (FP7)
MIROR (FP7)
NEXT-TELL (FP7)
ITEC (FP7)
ECUTE (FP7)
SIREN (FP7)
IMREAL (FP7)
GALA (FP7)
TERENCE (FP7)
TEL-MAP (FP7)
2004 2005 2006 2007 2008 2009 2010 2011 2012 2013 2014 2015

– 61 –
Appendix B: TEL Projects — SNA Metrics This table lists the 77 projects in our data set including SNA metrics (ordered by project acronym).
PROJECTProgr-
amme
Start
YearCluster
80DAYS FP7 2008 1 .0115 [28] .0121 [26] .0087 [52] 13 [51] 18 [49] .5315 [48] .0016 [52] .6667 [20]
ALICE FP7 2010 0 .0102 [37] .0106 [32] .0076 [57] 11 [53] 14 [58] .5241 [52] .0015 [54] .7091 [18]
APOSDLE FP6 2006 0 .0115 [28] .0106 [32] .0129 [26] 22 [22] 26 [29] .5672 [26] .0208 [13] .5238 [50]
ARGUNAUT FP6 2005 4 .0089 [40] .0091 [37] .0123 [29] 22 [22] 27 [28] .5758 [23] .0082 [25] .5455 [46]
ARISE FP6 2006 4 .0064 [53] .0076 [44] .0060 [63] 11 [53] 11 [61] .5067 [62] .0004 [66] .8545 [10]
ARISTOTELE FP7 2010 4 .0115 [28] .0000 [75] .0059 [64] 8 [65] 10 [63] .4967 [67] .0008 [63] .5357 [48]
ASPECT eContentplus 2008 5 .0281 [8] .0302 [7] .0246 [9] 30 [12] 59 [9] .6179 [12] .0284 [8] .5034 [53]
ATGENTIVE FP6 2005 2 .0000 [73] .0015 [69] .0031 [73] 3 [72] 3 [72] .4153 [73] .0000 [72] 1.0000 [1]
CALIBRATE FP6 2005 5 .0064 [53] .0060 [51] .0135 [23] 17 [34] 30 [23] .5507 [33] .0064 [31] .4485 [66]
CITER eContentplus 2006 1 .0102 [37] .0106 [32] .0055 [68] 9 [62] 9 [67] .5033 [66] .0015 [53] .5000 [56]
CONNECT FP6 2004 4 .0051 [57] .0045 [55] .0145 [20] 20 [26] 32 [21] .5630 [27] .0081 [26] .5158 [51]
COOPER FP6 2005 3 .0051 [57] .0060 [51] .0111 [37] 16 [38] 26 [29] .5352 [45] .0009 [62] .8250 [12]
COSMOS eContentplus 2007 4 .0115 [28] .0121 [26] .0119 [31] 15 [44] 25 [32] .5429 [38] .0050 [37] .5429 [47]
COSPATIAL FP7 2009 0 .0089 [40] .0091 [37] .0058 [65] 9 [62] 10 [63] .5067 [62] .0011 [59] .6389 [27]
DYNALEARN FP7 2009 1 .0089 [40] .0091 [37] .0056 [67] 8 [65] 9 [67] .5067 [62] .0020 [50] .4286 [70]
ECIRCUS FP6 2006 0 .0038 [62] .0030 [61] .0087 [51] 10 [58] 15 [55] .5101 [60] .0017 [51] .6444 [25]
ECUTE FP7 2010 0 .0064 [53] .0060 [51] .0065 [60] 6 [69] 10 [63] .4872 [69] .0003 [69] .8000 [14]
EdReNe eContentplus 2007 5 .0000 [73] .0015 [69] .0027 [77] 2 [74] 2 [74] .3938 [74] .0000 [72] 1.0000 [1]
EduTubePlus eContentplus 2008 1 .0077 [48] .0076 [44] .0089 [49] 12 [52] 18 [49] .5278 [51] .0041 [41] .4697 [61]
E-LEGI FP6 2004 2 .0051 [57] .0045 [55] .0184 [13] 34 [9] 42 [13] .6441 [8] .0365 [5] .4385 [68]
ELEKTRA FP6 2006 1 .0077 [48] .0076 [44] .0082 [55] 11 [53] 16 [54] .5170 [56] .0014 [55] .6364 [29]
ELU FP6 2006 5 .0102 [37] .0106 [32] .0104 [40] 18 [31] 22 [37] .5588 [30] .0091 [24] .4444 [67]
EMAPPS.COM FP6 2005 5 .0026 [69] .0030 [61] .0076 [58] 7 [68] 15 [55] .4634 [71] .0001 [71] .8571 [8]
EUROGENE eContentplus 2007 2 .0153 [23] .0166 [21] .0126 [28] 22 [22] 29 [24] .5802 [21] .0058 [32] .6667 [20]
eViP eContentplus 2007 0 .0077 [48] .0076 [44] .0055 [69] 9 [62] 9 [67] .5101 [60] .0011 [58] .6389 [27]
GALA FP7 2010 0 .0536 [1] .0619 [1] .0332 [4] 42 [3] 79 [5] .6847 [4] .0580 [3] .3449 [75]
GRAPPLE FP7 2008 3 .0217 [14] .0242 [11] .0278 [7] 35 [8] 69 [7] .6333 [9] .0220 [11] .4571 [64]
ICAMP FP6 2005 2 .0038 [62] .0045 [55] .0110 [38] 15 [44] 25 [32] .5315 [48] .0030 [43] .5524 [43]
ICLASS FP6 2004 1 .0038 [62] .0030 [61] .0155 [17] 24 [19] 35 [17] .5846 [20] .0151 [19] .4783 [59]
iCOPER eContentplus 2008 2 .0332 [6] .0378 [5] .0347 [3] 39 [5] 91 [3] .6667 [7] .0218 [12] .4791 [58]
IDSPACE FP7 2008 3 .0153 [23] .0166 [21] .0094 [46] 17 [34] 21 [40] .5507 [33] .0010 [61] .8235 [13]
I-MAESTRO FP6 2005 0 .0000 [73] .0015 [69] .0028 [75] 2 [74] 2 [74] .3838 [76] .0000 [72] 1.0000 [1]
IMREAL FP7 2010 0 .0230 [13] .0242 [11] .0106 [39] 18 [31] 20 [43] .5547 [32] .0152 [18] .5294 [49]
INTELLEO FP7 2009 2 .0089 [40] .0091 [37] .0062 [61] 10 [58] 12 [60] .5170 [56] .0004 [67] .8000 [14]
Intergeo eContentplus 2007 1 .0115 [28] .0136 [23] .0091 [48] 14 [49] 18 [49] .5241 [52] .0053 [35] .5934 [36]
ITEC FP7 2010 5 .0255 [9] .0287 [8] .0164 [16] 22 [22] 37 [16] .5758 [23] .0174 [14] .5065 [52]
JEM eContentplus 2006 2 .0026 [69] .0030 [61] .0028 [76] 2 [74] 2 [74] .3858 [75] .0000 [72] 1.0000 [1]
KALEIDOSCOPE FP6 2004 0 .0000 [73] .0015 [69] .0612 [1] 61 [1] 150 [1] .8352 [1] .1630 [1] .2732 [76]
Key ToNature eContentplus 2007 5 .0128 [25] .0121 [26] .0116 [33] 20 [26] 22 [37] .5758 [23] .0287 [7] .6474 [24]
KP-LAB FP6 2006 2 .0089 [40] .0091 [37] .0113 [35] 16 [38] 22 [37] .5429 [38] .0136 [23] .4000 [73]
L2C FP6 2006 2 .0089 [40] .0076 [44] .0085 [53] 16 [38] 17 [53] .5507 [33] .0046 [39] .8333 [11]
LEACTIVEMATH FP6 2004 1 .0051 [57] .0045 [55] .0100 [41] 15 [44] 21 [40] .5352 [45] .0025 [46] .6952 [19]
LEAD FP6 2005 2 .0038 [62] .0030 [61] .0072 [59] 10 [58] 14 [58] .5135 [58] .0012 [57] .6667 [20]
LiLa eContentplus 2009 1 .0115 [28] .0121 [26] .0061 [62] 10 [58] 11 [61] .5205 [54] .0014 [56] .6444 [25]
LOGOS FP6 2006 1 .0026 [69] .0030 [61] .0031 [72] 3 [72] 3 [72] .4294 [72] .0000 [72] 1.0000 [1]
LT4EL FP6 2005 2 .0064 [53] .0060 [51] .0114 [34] 19 [30] 26 [29] .5630 [27] .0024 [48] .7485 [16]
LTFLL FP7 2008 2 .0217 [14] .0242 [11] .0167 [15] 27 [15] 41 [15] .5984 [15] .0066 [28] .6325 [30]
MACE eContentplus 2006 3 .0179 [18] .0211 [14] .0195 [12] 33 [10] 48 [12] .6333 [9] .0158 [16] .5000 [56]
Math-Bridge eContentplus 2009 3 .0293 [7] .0332 [6] .0153 [18] 26 [16] 35 [17] .5891 [16] .0159 [15] .5508 [45]
MATURE FP7 2008 0 .0089 [40] .0091 [37] .0097 [43] 16 [38] 19 [45] .5390 [41] .0041 [42] .5750 [39]
mEducator eContentplus 2009 2 .0255 [9] .0287 [8] .0133 [24] 24 [19] 28 [27] .5891 [16] .0232 [10] .5652 [41]
MELT eContentplus 2006 5 .0128 [25] .0136 [23] .0139 [22] 20 [26] 32 [21] .5588 [30] .0052 [36] .5842 [37]
METAFORA FP7 2010 1 .0191 [16] .0211 [14] .0095 [45] 16 [38] 19 [45] .5390 [41] .0047 [38] .5833 [38]
MGBL FP6 2005 5 .0000 [73] .0015 [69] .0028 [74] 1 [77] 2 [74] .3671 [77] .0000 [72] .0000 [77]
MIROR FP7 2010 1 .0077 [48] .0076 [44] .0051 [70] 6 [69] 8 [70] .4967 [67] .0005 [65] .6667 [20]
MIRROR FP7 2010 0 .0255 [9] .0287 [8] .0127 [27] 24 [19] 29 [24] .5802 [21] .0057 [33] .6123 [34]
NEXT-TELL FP7 2010 0 .0179 [18] .0196 [17] .0099 [42] 15 [44] 20 [43] .5315 [48] .0030 [44] .6000 [35]
OpenScienceResources eContentplus 2009 4 .0166 [21] .0181 [19] .0117 [32] 14 [49] 25 [32] .5390 [41] .0023 [49] .6154 [33]
OpenScout eContentplus 2009 2 .0459 [2] .0514 [2] .0293 [6] 39 [5] 75 [6] .6726 [5] .0347 [6] .4656 [62]
Organic.Edunet eContentplus 2007 4 .0128 [25] .0136 [23] .0119 [30] 17 [34] 25 [32] .5390 [41] .0055 [34] .4779 [60]
PALETTE FP6 2006 1 .0089 [40] .0091 [37] .0077 [56] 11 [53] 15 [55] .5205 [54] .0024 [47] .4182 [71]
PROLEARN FP6 2004 1 .0026 [69] .0015 [69] .0440 [2] 50 [2] 114 [2] .7451 [2] .0641 [2] .3682 [74]
PROLIX FP6 2005 1 .0115 [28] .0121 [26] .0213 [10] 29 [13] 53 [10] .6080 [13] .0146 [20] .5025 [55]
RE.MATH FP6 2005 1 .0038 [62] .0030 [61] .0093 [47] 11 [53] 19 [45] .5135 [58] .0030 [45] .4364 [69]
ROLE FP7 2009 2 .0370 [5] .0423 [4] .0272 [8] 39 [5] 69 [7] .6726 [5] .0279 [9] .4521 [65]
SCY FP7 2008 4 .0179 [18] .0196 [17] .0129 [25] 20 [26] 29 [24] .5630 [27] .0066 [27] .5579 [42]
SIREN FP7 2010 0 .0077 [48] .0076 [44] .0049 [71] 6 [69] 7 [71] .4872 [69] .0006 [64] .7333 [17]
STELLAR FP7 2009 2 .0395 [4] .0453 [3] .0318 [5] 42 [3] 81 [4] .6909 [3] .0385 [4] .4146 [72]
TARGET FP7 2009 0 .0115 [28] .0121 [26] .0112 [36] 17 [34] 23 [36] .5468 [37] .0065 [29] .5515 [44]
TELCERT FP6 2004 3 .0038 [62] .0030 [61] .0142 [21] 25 [17] 34 [20] .5891 [16] .0065 [30] .6267 [31]
TEL-MAP FP7 2010 2 .0408 [3] .0000 [75] .0204 [11] 31 [11] 51 [11] .6230 [11] .0144 [21] .5032 [54]
TENCOMPETENCE FP6 2005 3 .0115 [28] .0106 [32] .0176 [14] 25 [17] 42 [13] .5891 [16] .0141 [22] .5700 [40]
TERENCE FP7 2010 5 .0242 [12] .0000 [75] .0096 [44] 18 [31] 21 [40] .5429 [38] .0043 [40] .6209 [32]
UNFOLD FP6 2004 3 .0038 [62] .0045 [55] .0083 [54] 15 [44] 18 [49] .5352 [45] .0004 [68] .9048 [6]
UNITE FP6 2006 4 .0191 [16] .0211 [14] .0152 [19] 28 [14] 35 [17] .6080 [13] .0157 [17] .4630 [63]
VEMUS FP6 2005 4 .0051 [57] .0045 [55] .0057 [66] 8 [65] 10 [63] .5067 [62] .0001 [70] .8571 [8]
XDELIA FP7 2009 2 .0166 [21] .0181 [19] .0088 [50] 16 [38] 19 [45] .5507 [33] .0010 [60] .8583 [7]
Betweenness
Centrality
Local Clust-
ering Coeff.Authority Hub
Page-
RankDegree
Weighted
Degree
Closeness
Centrality