media market digest jan-jul'16
TRANSCRIPT

Media Market Digest July 2016

2
TV
Grew by 6% vs Jan-Jul’15 Price for commercial will
increase for 2-3 more years p.3-10
Radio
Twice increase vs Jan-Jul’15 Results of the second wave of
radio listening survey p.26-27
Research & Trends Smartphones usage in Ukraine
research results How do Ukrainians purchase
online? p.28-33
Digital ¼ of users watch YouTube
more than TV in UA
Instagram launches business-profiles with analytics in UA p.11-17
OOH
Growth by 21% vs Jan-Jul’15 The absolute leader in sales
remains Lviv with 94% sold-out
p.18-23
Moderate increase by 16% vs Jan-Jul’15
p.25
LION White Rock rocks on Coub.com
Cases
ZOU Campaigns
p.34-35

3

Jan-Jul’2016 in term
of WTRP’s vs Jan-
Jul’2015
4 Source: GFK/Nielsen, Direct Advertising, excl. Social & Media, TA: 18-50 50k+. Data owner is ITC. Processed by “CCM”
Subsidiary Enterprise
Key facts
SOR in average 88% In Jul’2016
The dynamics is typical for pre-crisis
years
Jul’16 vs Jun’16
Olympic Games in 2016 were watched in
average 2 times worse* than in 2012
in WTRP’s
* In terms of Average Audience
159,6
58,6
46,4
38,4
32,9
28,1
27,5
25,2
22,7
20,7
Pharma
Food
Telecom
Hygiene
Cosmetics
Trade
Cold AFB
Confectionery
Entertainment
Auto
13%
11%
13%
29%
128%
11%
29%
20%
-3%
-3%
5 Source: GFK/Nielsen, Direct Advertising, excl. Social & Media, TA: 18-50 50k+. ‘000WTRPs. Data owner is ITC.
Processed by “CCM” Subsidiary Enterprise
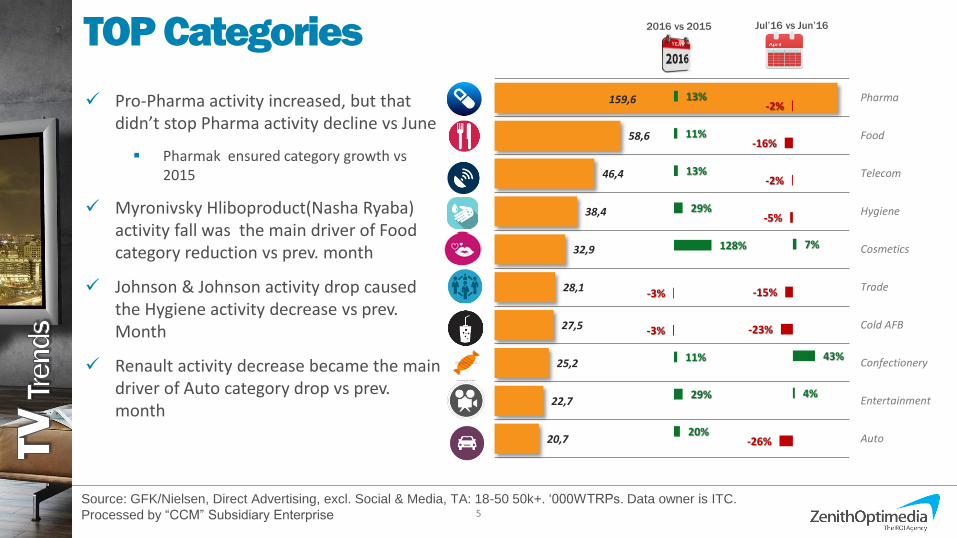
Pro-Pharma activity increased, but that didn’t stop Pharma activity decline vs June
Pharmak ensured category growth vs 2015
Myronivsky Hliboproduct(Nasha Ryaba) activity fall was the main driver of Food category reduction vs prev. month
Johnson & Johnson activity drop caused the Hygiene activity decrease vs prev. Month
Renault activity decrease became the main driver of Auto category drop vs prev. month
7%
43%
4%
-2%
-16%
-2%
-5%
-15%
-23%
-26%
TOP Categories 2016 vs 2015 Jul’16 vs Jun’16

25,3
23,5
20,9
18,3
16,7
14,6
13,7
13,0
12,8
12,0
Nestle
Procter&Gamble
Pharmak
Reckitt Benckiser
L'Oreal
Vodafone
Kyivstar
Ukrnafta
Unilever
Danone
46%
35%
10%
126%
15%
8%
216%
-12%
-3%
-21%
6 Source: GFK/Nielsen, Direct Advertising, excl. Social & Media, TA: 18-50 50k+. ‘000WTRPs. Data owner is ITC.
Processed by “CCM” Subsidiary Enterprise
66%
84%
4%
8%
52%
-19%
-26%
-44%
-25%
-19%
TOP Advertisers 2016 vs 2015 Jul’16 vs Jun’16
Vodafone was the main driver of Telecom category drop vs prev. month while Kyivstar drives category growth vs prev. year
Procter&Gamble activity increase in July provided Detergent category growth vs prev. month
Unilever caused Perfumes category decrease vs. 2015
The main drivers of Advertiser in category drop were Axe, Dove and Rexona
Mondelez rose its activity in July, that had a positive impact on Confectionery category growth
7 Andrew Partyka, CEO of StarLight Sales, summed up first 6 months of the year, noted TV commercial market resumption and told about new working conditions with advertisers since autumn 2016.
Andrew Partyka: price for commercial will increase for 2-3 more years at least
Source: http://goo.gl/jud6g8
7

8
Commercial TV-market is continuing its updating, it has increased by 40% during the first half-year 2016. This indicator will make 30% on results of the year according to the StarLight Sales assessment. This is 5 points higher than previous forecast, - the company said.
Market demand for TV commercial has increased by 5% (in WGRP’s), despite the prohibition of direct commercial of beer, that made 6,4% of demand in the last pre-crisis 2013 year (in WGRP’s). Such categories as cosmetics and hygiene, e-commerce, household cleaning, realty and jewelry showed the maximum growth in the first half-year 2016. Budgets and activity in key categories : pharma, foodstuffs and communication have increased. Auto category resumed its presence on the air.
Commercial TV-market has increased by 40 % during the first half-year 2016
Source: http://goo.gl/dVs4kr
Two core factors of market high growth in 1HY 2016: 1. High inflation imposed by TV sellers in 1HY and abnormal low cost in 1HY 2015 2. Turbulence in economy, rapid national currency devaluation in 1HY 2015. Advertisers planned activities very carefully, maintained locomotive brands
Current market optimistic development allows us to agree with Alliance annual forecast for market growth about +30%. Maxim Pozhar, TV Buying Group Head ZenithOptimedia Ukraine

TIC spread the statement about press conference «Changes in the universal program service - risks for the information security of Ukraine», that was convened by Telecommunication Chamber of Ukraine on July 20.
Statement of TIC: Telecommunication Chamber is covering business interests by national security protection motive
Source: http://goo.gl/Q5QZz8
Telecommunication Chamber convened press conference about the draft law №3504 «About bringing changes to the Law of Ukraine " About Television and Radio Broadcasting " (about clarifying terms of distribution of TV organizations programs which are in universal program service)» on July 20. The union of cable providers spoke out against the norms about levying payment for TV channels rebroadcasting.
Telecommunication Chamber spoke out against the payment for TV channels rebroadcasting
9
Source: http://goo.gl/xHO9gU

10
Source: http://goo.gl/nV9u2J
“1+1“ leads in three audiences at once in MB Top Channel research according to first half-year results. Also leadership left for the “Ukraine“ channel in one another audience . “1+1” has the most noticeable growth of share and “Inter” - the most noticeable fall compared to the same period of previous year.
Top-list of TV channels in first half-year: three times “1+1“ and “Ukraine“ channel
What do “ VOLIA“ subscribers watch: the company has summed up the
telemetry for the half-year
Source: http://goo.gl/hpmOTO
The largest provider of cable television is continuing to share information about TV preferences of their IPTV-subscribers . Here are data from «VOLIA» company for June. TOP-6 of broadcasters didn’t change again and coincides with «big six» of TV panel Nielsen− “1+1”, “Ukraine”, STB, ICTV, “Novyi Kanal “ and “Inter” channels. The leader of TV Viewing is still “1+1”, second position in the rating didn’t belong to STB this time, it belonged to the “Ukraine” channel, that is explained by “Euro 2016”.

11

35,0
30,2
25,4
25,2
22,3
22,2
21,2
18,6
18,2
16,5
Skoda
Beiersdorf AG
Fozzy Group
Nestle
Mondelez
Kyivstar
Mars-Wrigley
McDonald's
Metro
Pepsico
VOD TOP Categories
62,1
52,3
39,1
37,7
33,8
29,6
28,5
26,1
22,7
16,2
Trade
Confectionery
Alcohol
Auto
Telecom
Food
Cosmetics
IT
Restaurants
Hot Beverages
VOD monitoring includes HTML5 formats from the middle of March which caused technical growth of Impressions monitoring data is not stable
12
VOD TOP Advertisers &
Source: Communication Alliance, represents 20%-25% of all video ad. Impressions, Mln. Data
processed by “CCM” Subsidiary Enterprise

13
Carlsberg Group
Nestle
Citrus
Douwe Egberts
Kyivstar
Reckitt Benckiser
Wargaming
Mondelez
Unilever
Hyundai KIA AG
Alcohol
Trade
Entertainment
Culinary
Telecom
Auto
Hygiene
Cosmetics
Hot Beverages
Confectionary
Q2 2016
Source: Gemius Ad Real, Impressions. Data is processed by “CCM” Subsidiary Enterprise
Q2 2016
TOP Categories TOP Advertisers & VOD

Marketers look for marketing opportunities in the Pokémon Go
phenomenon
A week since its launch, the game of finding imaginary creatures in the real world has turned augmented reality into a major marketing tool. Game owners plan to launch “sponsored locations” soon, so that brands can pay to put their names on valued destinations that players seek. Already, businesses can buy virtual Lure Modules that attract Pokémon — and, the businesses hope, will also attract players.
14
Source: http://goo.gl/Y2XBDF
While it's difficult to predict the virality and success of any content, we often find that the truly successful have many elements in common, and Pokemon Go has hit on all of them: a) build emotional connection with your target consumer; b) consumer-focused (it's easy to use); c) visibility (you see them everywhere); d) social element (relate to themes going on in the real world); e) headline-worthy (build shareable content that creates social conversation).
Maryna Grygorenko, Digital Director ZenithOptimedia Ukraine

YouTube usage growth rates higher in Ukraine than globally: time of watching videos increased by 70% for a year. According to the survey YouTube Audience Profiling Study 2016, 26% of Ukrainians aged 25 to 44 watch YouTube more than television. 83% of Ukrainian users visit YouTube at least once a month, and 55 % of them - everyday. A half of video views are on mobile devices.
15
A quarter of users watch YouTube more than TV in UA
Source: http://goo.gl/tdLC66
Why Youtube stars are more influential to Millenials than traditional celebs
Source: https://goo.gl/DBLbb8
For millennials who spend a lot of time watching online video, YouTube creators are more influential than traditional celebrities. Google presents comparison of YouTube stars to the influence of stars of TV, film, sports, music, and more

IAB’s released the first report offers some new insights into what it will take to keep people away from ad blockers. The survey included ~1,300 computer users and 200 mobile users over six months in the US, including those with and without ad blockers. According to the study: 26% actually have blockers, 37% of users haven’t used blockers, 20% are ex-ad blockers, and 17% are thinking about getting an ad blocker. In other words, about three-quarters don’t currently use blockers.
16
IAB:’s Ad Blocking: Who Blocks Ads, Why, and How to Win Them Back
Source: http://goo.gl/h8DNQM
Facebook: Showing You More Personally Informative Stories
Source: http://goo.gl/uPycgN
Facebook has introduced an additional signal for ranking of newsfeed. It will learn to determine automatically which stories would be the most interesting to the user. The ranking will use Feed Quality Program, which includes global crowd-sourced surveys of tens of thousands of people per day, as well as people who answer more detailed questions about what they like seeing in their feeds.

MyTarget proposed new type of advertising – pre-roll. Which can place in social networks «Odnoklassniki», «MyMail.ru» and others Mail.ru projects.
17
myTarget will launch video automatized purchase in the pre-roll on
Mail.Ru Group projects
Source: http://goo.gl/nFUt9n
Instagram launches business-profiles with analytics for Ukraine
Source: http://goo.gl/ewOhe8
Now brands can turn personal accounts into business profiles and get access to new Instagram business tools, first of all – Insights – that give businesses actionable information about who their followers are and which posts resonate better than others.
18

16,0
13,3
12,2
7,6
6,7
6,7
6,6
6,1
5,6
5,5
Fozzy Group
Epicenter
Sport Life
Lifecell
Vodafone
Riel
Samsung
Privatbank
Metro
Allo
50%
5%
14%
43%
27%
-13%
-15%
-3%
-17%
TOP Categories
146,5
94,5
58,5
45,6
30,4
23,3
19,0
18,5
16,2
14,1
Trade
Realty
Entertainment
Auto
Telecom
Finance
Sport
Restaurants
Medicine
Tourism
15%
54%
25%
49%
0%
16%
17%
29%
61%
-5%
Epicenter and Fozzy Group activity decreased, but that didn’t stop Trade category growth vs prev. month
Al'fa-Bank was the main reason of Finance category drop vs prev. month, while UniCredit Bank ensured decrease vs 2015
Sport Life drove Sport category growth vs prev. month and vs prev. year
McDonald's was the leader by growth in Restaurants category
2016 vs 2015
19
2016 vs 2015
TOP Advertisers &
Source: Communication Alliance-OOH, Budget, Mln UAH. Data is processed by “CCM” Subsidiary
Enterprise

20
The market of out-of-home advertising in the first half of 2016
Source: http://goo.gl/QBxZJF
OOН native advertising at the Kyiv International Airport
Source: http://goo.gl/xyTNUh
Two modern, stylish and symbolic capital entities — a residential complex Skyline and Kyiv International Airport, together with progressive advertising vision of the company Amstar and the professionalism of the operator RTM-Ukraine has created a entire and native advertising on the front of the Terminal A.
Traditional market survey out-of-home advertising is dedicated to the data of the first half of the year 2016 as well as compared to the period January-June 2016 to the same period last year.
The absolute leader in sales remains Lviv with 94% sold-out of commercial placement, despite significant inflation of rent in June 2016.
We recommend to start reservation for this year as soon as possible. Especially if we are talking about Western region.
Olga Muravyova, Head of buying department ZenithOptimedia Ukraine
Service open data helps each active citizen to know who is the owner of advertising designs, check the legality of their location marked on the map service, and create an e-mail appeal for the elimination of violations.
21
The opportunity to manage advertising was given
in Kiev
Source: http://goo.gl/TLm1hk
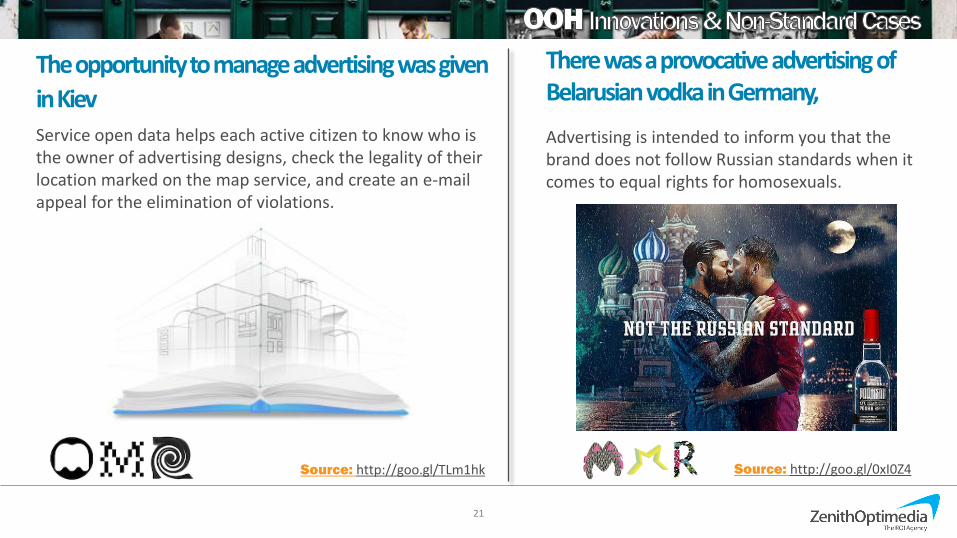
There was a provocative advertising of Belarusian vodka in Germany,
Advertising is intended to inform you that the brand does not follow Russian standards when it comes to equal rights for homosexuals.
Source: http://goo.gl/0xI0Z4

22
Source:: https://goo.gl/A0chRp
Moving Walls looks to educate Malaysian advertisers Moving Walls Malaysia has launched a new campaign, Lookup Lah, which hopes to educate Malaysian advertisers on the importance of investigating marketing data and figures found online.
Source: http://goo.gl/QYydKd
Renault has learned to recognize the cars to show targeted ads on the roads On a billboard in West London are cameras that respond to the make, model and color of the car. Passes by the driver of the vehicle brand advertising will see the new Renault Megan.

23
http://goo.gl/FTQyLi https://goo.gl/BUHElZ
http://goo.gl/1DFlKD http://goo.gl/bDpNU7 http://goo.gl/swQI1W
Advertising agency Happiness, Brussels advertised yield on the screens of the second part of the fiction film by Roland Emmerich original outdoor advertising.
http://goo.gl/efXFXl
Startup Debuts Digital Billboards with User-Generated Content to Sell Real Items from Real People in Real Time–All Within 5miles.
The creators of World of Tanks branding of the airplane in the style of the game.
Out of Home enjoys a symbiotic relationship with Twitter, and has much in common.
Operator of out-of-home advertising Ocean Outdoor intends to develop a new strategy for advertising on digital-screens at Piccadilly Circus in London.
Advertising Tomb Raider video game with real people on a billboard won the festival "Cannes Lions" 17 awards, including five Gold Lions.

24

15,3
7,8
6,1
6,0
5,1
4,2
3,7
3,6
3,4
3,3
L'Oreal
Seldiko
Olaynfarm
ChaneL
Hexagone
Fitobiotehnologii
Procter&Gamble
UkrainianNational Lotery
Burda
Pandora
57%
10%
39%
176%
191%
-47%
-33%
TOP Categories
49,0
42,9
42,8
39,6
21,2
20,8
11,8
11,8
11,7
8,8
Trade
Entertainment
Cosmetics
Pharma
Wear
Auto
Perfumes
Jewellery
Finance
Alcohol
21%
40%
71%
76%
21%
12%
-3%
-10%
-13%
-29%
Toyota activity increased, but that didn’t stop Auto activity decline vs prev. month and vs prev. year
Artek - Bukovel' rose its activity vs prev. year, that had a positive impact on Tourism category growth
Procter&Gamble activity drop didn’t stop Cosmetics category increase in 2016
Calzedonia and Philipp Plein activity fall caused the Wear activity decrease vs prev. month
2016 vs 2015 2016 vs 2015
TOP Advertisers &
25 Source: Communication Alliance, Budget, Mln UAH. Data is processed by “CCM” Subsidiary Enterprise

26
15,5
14,7
10,0
9,5
6,9
6,0
5,9
5,7
5,6
4,3
BayaderaLogistik
Natur Produkt
Victor & Co
Get'man
Zolotiy vik
Megapolis
Poltava Distillery
Russkoe radio
MobilLuck
UkrainianNational Lotery
7%
31%
61%
47%
524%
100%
TOP Categories
48,5
46,6
31,9
25,0
18,7
18,5
13,1
8,2
7,8
7,7
Alcohol
Entertainment
Trade
Pharma
Food
Auto
Realty
Jewellery
Finance
Education
75%
112%
47%
104%
29%
48%
103%
Umanpivo was the main reason of Alcohol category growth vs prev. month, while Getman ensured growth vs 2015
ProStor became the main driver of Trade category increase vs June
Realty category increased thanks to ORBI GROUP activity growth
Twin Tower project advertising was launched in July
2016 vs 2015 2016 vs 2015
TOP Advertisers &
Source: Communication Alliance, Budget, Mln UAH. Data is processed by “CCM” Subsidiary Enterprise
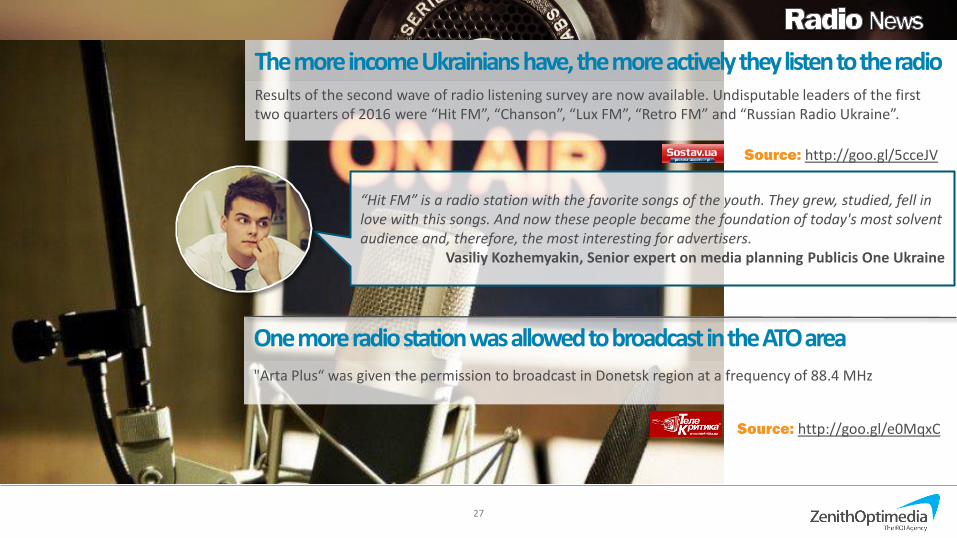
"Arta Plus“ was given the permission to broadcast in Donetsk region at a frequency of 88.4 MHz
One more radio station was allowed to broadcast in the ATO area
Results of the second wave of radio listening survey are now available. Undisputable leaders of the first two quarters of 2016 were “Hit FM”, “Chanson”, “Lux FM”, “Retro FM” and “Russian Radio Ukraine”.
27
The more income Ukrainians have, the more actively they listen to the radio
Source: http://goo.gl/e0MqxC
Source: http://goo.gl/5cceJV
“Hit FM” is a radio station with the favorite songs of the youth. They grew, studied, fell in love with this songs. And now these people became the foundation of today's most solvent audience and, therefore, the most interesting for advertisers.
Vasiliy Kozhemyakin, Senior expert on media planning Publicis One Ukraine

28

Based on the advertising market dynamics during the first half of the year Ukrainian Advertising Coalition traditionally holds an expert survey to clarify their forecasts for the advertising and communication market in Ukraine. As a result advertising market is growing much faster than expected at the end of the previous year. The forecast was revised from 12% to 21% growth of investments. All media except Print are going to show growth in 2016.
29
Ukrainian Advertising Coalition specified forecast of the advertising market volume in Ukraine in 2016
Source: http://goo.gl/PKSzzB
According to StarLight Sales, TV advertising market is going to grew by 30-35%. At the end of the year Sponsorship growth rate is going to be 80%. Media market is recovering faster, than Advertising Coalition predicts.
StarLight Sales: Media market is growing faster, than Advertising Coalition predicts
Source: http://goo.gl/QIPsT3
The economy is steadily overcoming the crisis in spite of quite unstable political environment. One of the key signals of situation improvement within the advertising industry is high demand within attractive segments of the market. The UAC forecast may be revised ones or several times in case such level of demand remains till the end of the year. The negative side of such situation is a risk of quality placement deterioration and growth of the cost. In such situation accurate budget planning is the major solution in order to avoid mentioned risks.
Vyacheslav Levchenko, Media Director ZenithOptimedia Ukraine

Nazar Grynyk, mobile marketing expert, presented the results of the study: how smartphones and mobile applications in Ukrane are used, expectations of mobile advertising and why does Pokemon Go conquer the world. Compared with the last year the number of smartphone users has increased by 22%. 33% of all Internet traffic is generated by mobile devices in Ukraine and only 1-2% of media budgets are invested in mobile advertising.
30
Smartphones usage in Ukraine research results
Source: http://goo.gl/zLqpBp
H1’2016 results: budgets, ad formats and forecasts. Volume of mobile budgets rose by more than 4 times compared with the same period last year. The leaders were FMCG advertisers (28,7% of all mobile advertising).
Mobile advertising in Ukraine analysis
Source: http://goo.gl/BV41C5
31
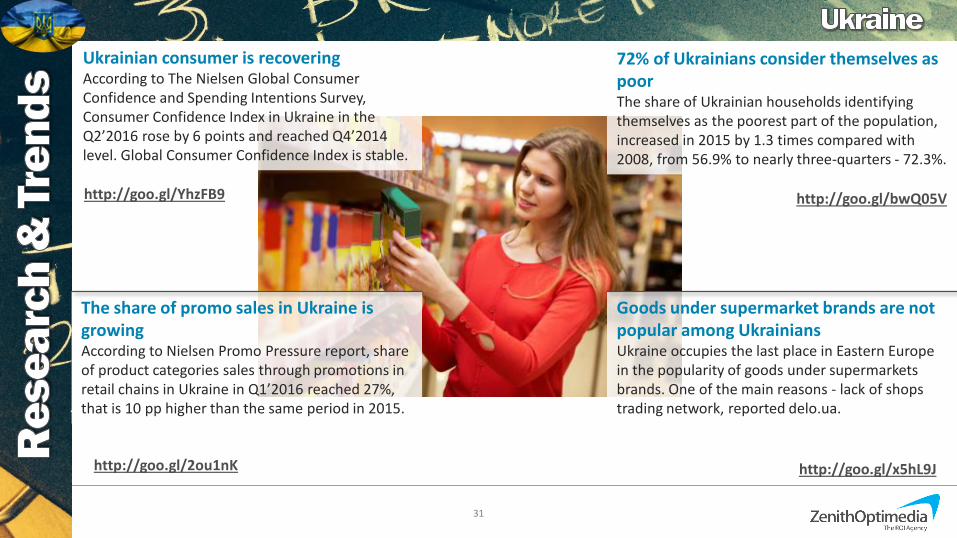
Ukrainian consumer is recovering According to The Nielsen Global Consumer Confidence and Spending Intentions Survey, Consumer Confidence Index in Ukraine in the Q2’2016 rose by 6 points and reached Q4’2014 level. Global Consumer Confidence Index is stable.
http://goo.gl/YhzFB9
http://goo.gl/bwQ05V
http://goo.gl/2ou1nK
http://goo.gl/x5hL9J
Goods under supermarket brands are not popular among Ukrainians Ukraine occupies the last place in Eastern Europe in the popularity of goods under supermarkets brands. One of the main reasons - lack of shops trading network, reported delo.ua.
The share of promo sales in Ukraine is growing According to Nielsen Promo Pressure report, share of product categories sales through promotions in retail chains in Ukraine in Q1’2016 reached 27%, that is 10 pp higher than the same period in 2015.
72% of Ukrainians consider themselves as poor The share of Ukrainian households identifying themselves as the poorest part of the population, increased in 2015 by 1.3 times compared with 2008, from 56.9% to nearly three-quarters - 72.3%.
32
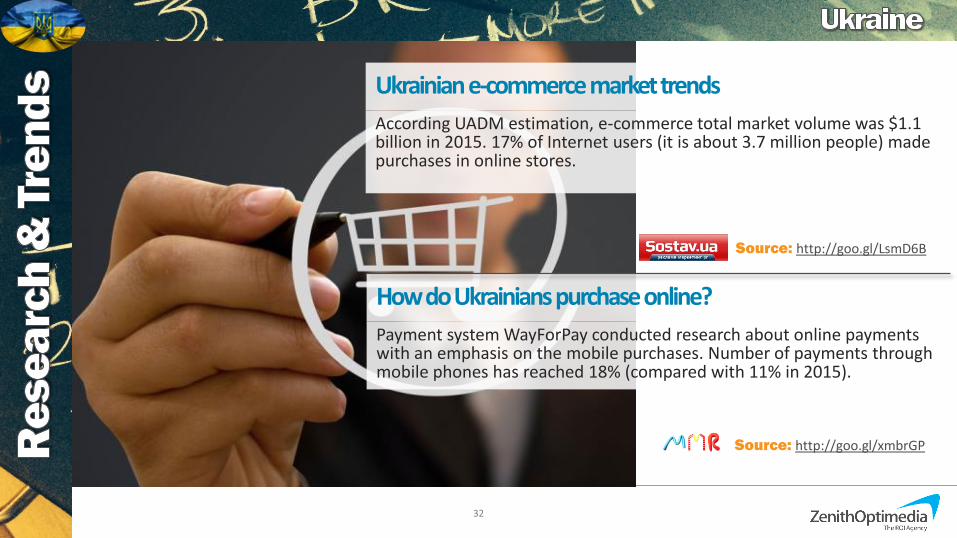
According UADM estimation, e-commerce total market volume was $1.1 billion in 2015. 17% of Internet users (it is about 3.7 million people) made purchases in online stores.
Ukrainian e-commerce market trends
Payment system WayForPay conducted research about online payments with an emphasis on the mobile purchases. Number of payments through mobile phones has reached 18% (compared with 11% in 2015).
How do Ukrainians purchase online?
Source: http://goo.gl/LsmD6B
Source: http://goo.gl/xmbrGP

33 * Click on the image works as direct link to the Source
How Consumers
Buy Brands: The new decision journey

34

Target
Media
Tools
Decision
Period
Summary
&
Results
35
LION White Rock rocks on Coub.com
Provide audience engaging brand experience to launch LION White Rock
Target
Coub.com Media
June 06, 2016 – July 06, 2016 Period
Branded page on coub.com with contest Through integration of media insertions in Display & VOD Ad, Coub video Ad invites to Coub brand page where user can find video produced by users and create their personal variant.
First in Ukraine branded Coub page to rock TA To involving target audience and integrate brand’s communication message into UGC – UCG is a trend among TA. Users generate content on branded page and via voting we had choose the winners.
Recoubs: 632 Likes: 2 480
Unique users: 28 085 Coub views: 635 160
Post Effect – one of the winners place the photo with wined countlines as the cover photo on his Coub-channel.

36
Thank You!