media consumption habits females age breaks 13+ 18-24 18-34 18-49 25-54 50+
TRANSCRIPT

Media Consumption HabitsFemales
Age Breaks•13+•18-24•18-34•18-49•25-54•50+

Females (13+)

Best Video Device: Females Overwhelmingly Prefer TV
Best Device for Watching Video
CAB 2013 Custom Study, Video Nation: Anytime, Anywhere, Anyplace. Females = Females 13+BASE: Users of each device to watch video 205 Overall, which of the following is the best device for watching video?
8%
5%
28%
Females
75%Television
Computer
Smartphone
Tablet 7%
3%
28%
All Respondents
75%

CAB 2013 Custom Study, Video Nation: Anytime, Anywhere, AnyplaceBASE: Watches video on device. Females = Females 13+1056 On which of the following devices do you find advertisements most memorable?
“Device On Which Advertising Is Most Memorable”(Among Owners of Each Device) – Females
Television Ads Are “Judged” Most Memorable By Females
Television
Computer
Smartphone Tablet

“I Expect To See Advertising On This Device (Top 2 Box)”Females
Television Has The Highest Advertising Acceptance Among Females
CAB 2013 Custom Study, Video Nation: Anytime, Anywhere, AnyplaceBASE: Watches video on device. Females = Females 13+1000/1005/1010/1015 How much do you agree with the following statement - “I expect to see advertising on this device” – when watching video on a particular device? (Top 2 Box – strongly agree, agree)
Television
Computer
Smartphone Tablet
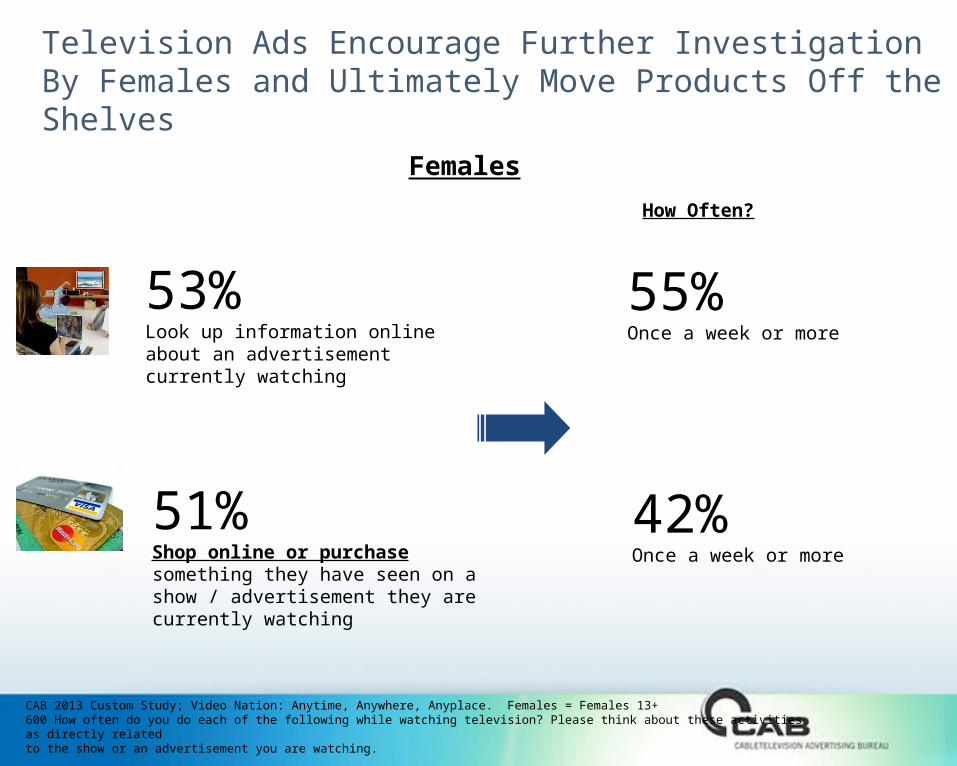
Television Ads Encourage Further Investigation By Females and Ultimately Move Products Off the Shelves
CAB 2013 Custom Study; Video Nation: Anytime, Anywhere, Anyplace. Females = Females 13+600 How often do you do each of the following while watching television? Please think about these activities as directly related to the show or an advertisement you are watching.
53% Look up information online about an advertisement currently watching
55% Once a week or more
51% Shop online or purchase something they have seen on a show / advertisement they are currently watching
Females
How Often?
42% Once a week or more

Women 18-24
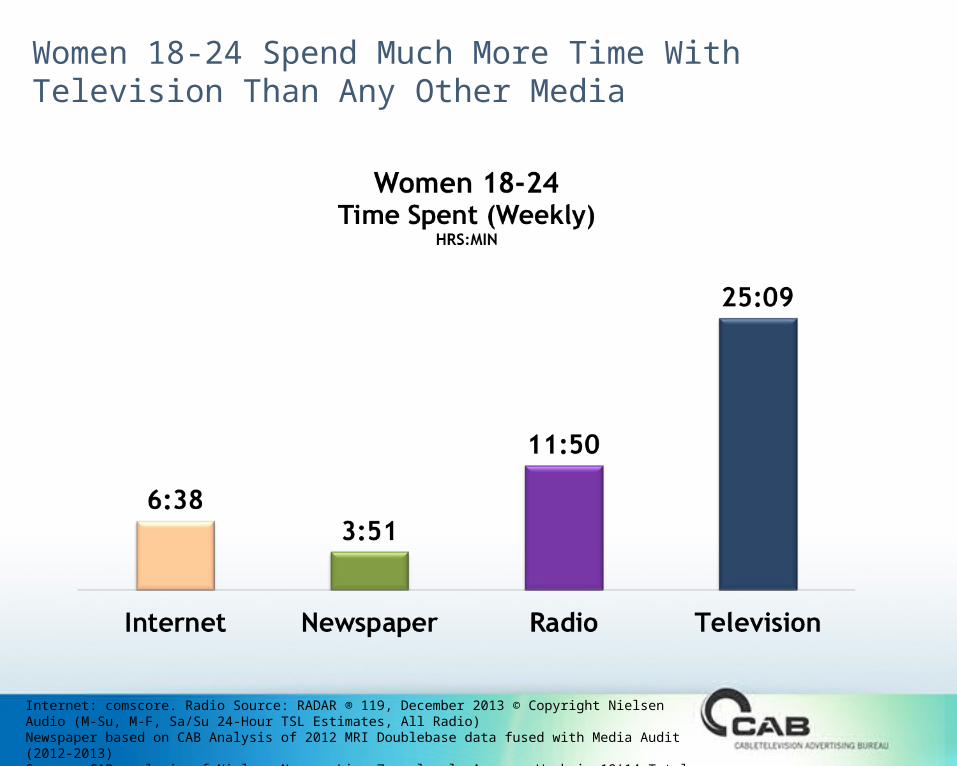
Women 18-24 Spend Much More Time With Television Than Any Other Media
Internet: comscore. Radio Source: RADAR ® 119, December 2013 © Copyright Nielsen Audio (M-Su, M-F, Sa/Su 24-Hour TSL Estimates, All Radio)Newspaper based on CAB Analysis of 2012 MRI Doublebase data fused with Media Audit (2012-2013)Source: CAB analysis of Nielsen Npower Live+7 pm level. Average Week in 1Q’14 Total Day

Young Adult Females Love The Entertainment Value That Television Provides
• A majority of young females see Television as “a good escape” for “pure entertainment”
Source: 2013 GfK MRI Doublebase. Base: A18+
Women 18-24 Media Attitudes(% that agree with statement)

Women 18-24 Spend Over 18 Hours Per Week Watching Cable TV Programming; More Than 3x The Amount They Spend With Broadcast
Source: CAB analysis of Nielsen Npower Live+7 pm level. 1Q’14 Total Day
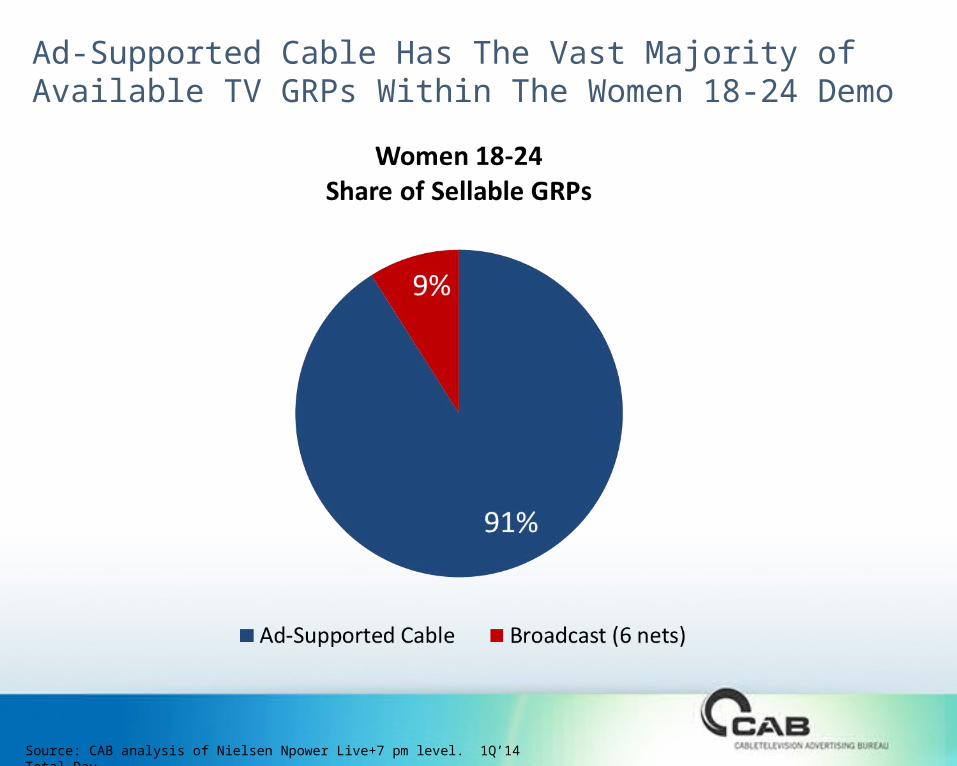
Ad-Supported Cable Has The Vast Majority of Available TV GRPs Within The Women 18-24 Demo
Source: CAB analysis of Nielsen Npower Live+7 pm level. 1Q’14 Total Day

W18-24 Cable Ratings Have Seen A Significant Increase Over The Last Ten Years While Broadcast Has Steadily Declined
Total Day Women 18-24 Rating10-Year Trend
*Time period reflects 1Q only in each year
Source: CAB Analysis of Nielsen Live+7 time period data. Broadcast reflects the “Big 4” in 1Q’04 and the “Big 4 + CW” in 1Q’09 & 1Q’14
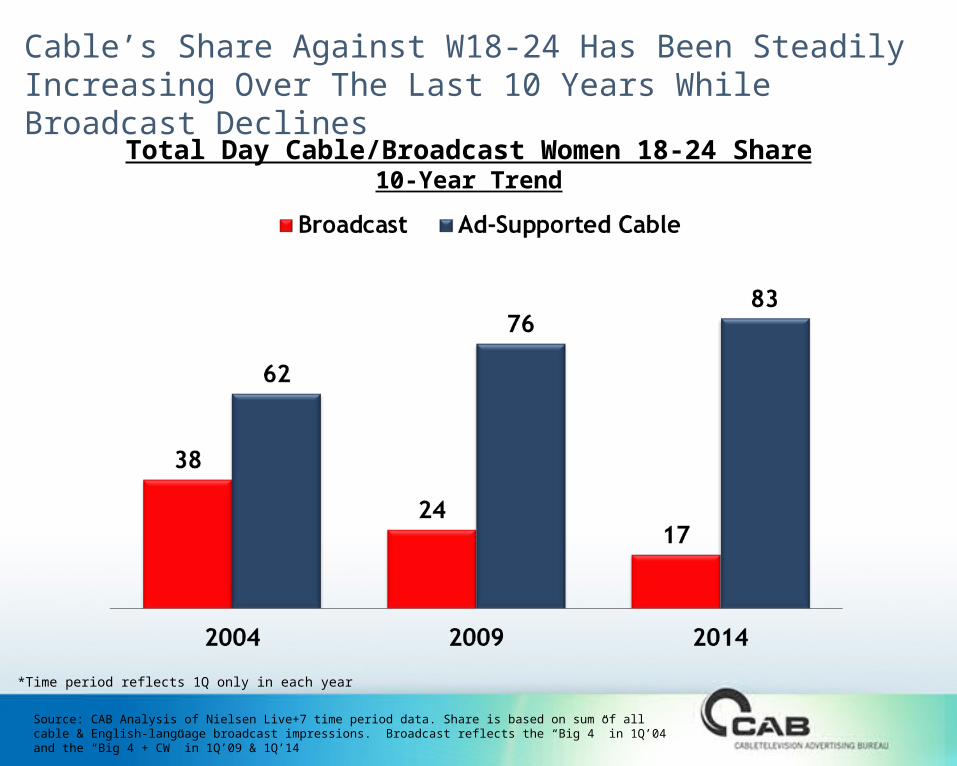
Cable’s Share Against W18-24 Has Been Steadily Increasing Over The Last 10 Years While Broadcast Declines
Total Day Cable/Broadcast Women 18-24 Share10-Year Trend
*Time period reflects 1Q only in each year
Source: CAB Analysis of Nielsen Live+7 time period data. Share is based on sum of all cable & English-language broadcast impressions. Broadcast reflects the “Big 4” in 1Q’04 and the “Big 4 + CW” in 1Q’09 & 1Q’14

Across Genres, Branded Cable Content is the Most Sought After on the Internet For Women 18-24
Source: CAB analysis of comScore data, March 2014. Top sites by category
Sports
NBC Sports Network
ESPN
USA Today Sports
Bleacher Report
FOX Sports on MSN
College Humor/Cracked
Adult Swim
Cheezburger
TheOnion.com
Comedy Central
CNN
Yahoo!
BuzzFeed
NBC News
USA Today
ToneMedia
MTV
Spotify
Fuse
Hearst Home Design
eHow Home & Garden
ApartmentTherapy.com
Michaels.com
HGTV
The Weather Channel
Weatherbug
Accuweather
MSN Weather
Yahoo! Weather
NBCU TV
A+E Networks
ABC
TV Guide
PBS.Org
All Recipes
BlogHer Food
Food Network
My Recipes Network
Foodie by Glam
Disney Entertainment
CoolMath-Games.com
Nickelodeon Kids & Teens
PBSKIDS.org
Poptropica
Sports Comedy General News Music
Home Weather TV Entertainment
Kids
Food
Soundcloud
Top 5 Websites by Genre – W18-24
= Ad-supported cable brand
EA Websites
GSN
FreeRide Games
Wild Tangent Media
Spil Games
Gaming

Women 18-34

Women 18-34 Spend Much More Time With Television Than Any Other Media
Internet: comscore. Radio Source: RADAR ® 119, December 2013 © Copyright Nielsen Audio (M-Su, M-F, Sa/Su 24-Hour TSL Estimates, All Radio)Newspaper based on CAB Analysis of 2012 MRI Doublebase data fused with Media Audit (2012-2013)Source: CAB analysis of Nielsen Npower Live+7 pm level. Average Week in 1Q’14 Total Day
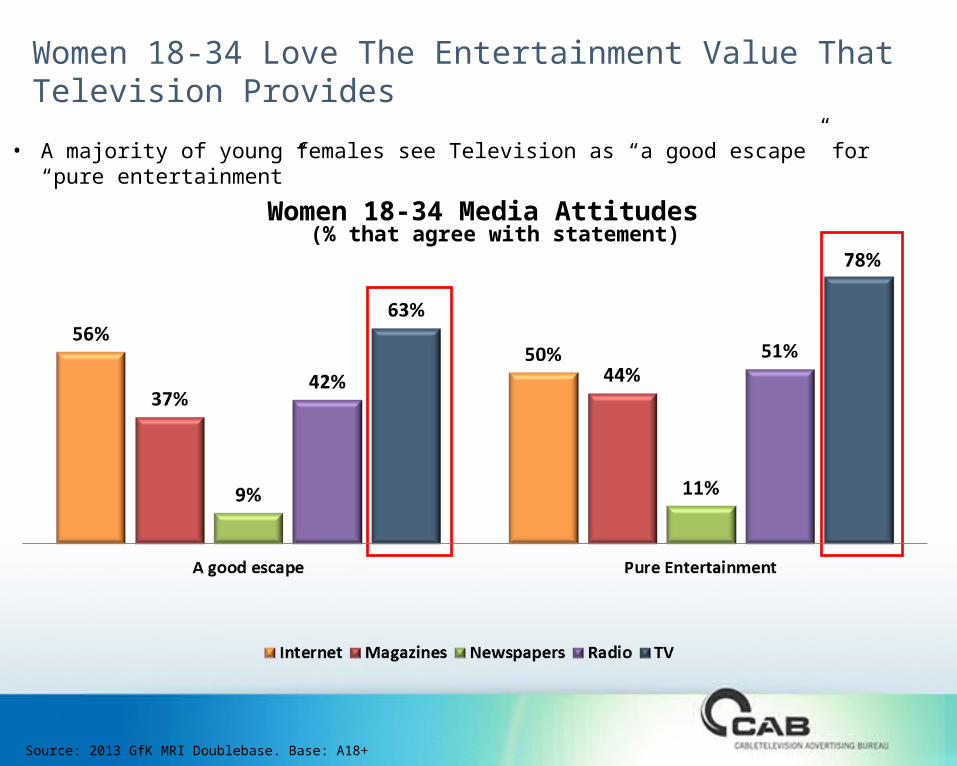
Women 18-34 Love The Entertainment Value That Television Provides
• A majority of young females see Television as “a good escape” for “pure entertainment”
Source: 2013 GfK MRI Doublebase. Base: A18+
Women 18-34 Media Attitudes(% that agree with statement)

Women 18-34 Spend More Than 19 Hours Per Week Watching Cable TV Programming, Greatly Exceeding Their Time Spent With Broadcast
Source: CAB analysis of Nielsen Npower Live+7 pm level. 1Q’14 Total Day

Ad-Supported Cable Has A Large Majority of The Available TV GRPs Within The Women 18-34 Demo
Source: CAB analysis of Nielsen Npower Live+7 pm level. 1Q’14 Total Day

W18-34 Cable Ratings Have Seen A Significant Increase Over The Last Ten Years While Broadcast Has Steadily Declined
Total Day Women 18-34 Rating10-Year Trend
*Time period reflects 1Q only in each year
Source: CAB Analysis of Nielsen Live+7 time period data. Broadcast reflects the “Big 4” in 1Q’04 and the “Big 4 + CW” in 1Q’09 & 1Q’14

Cable’s Share Against W18-34 Has Been Steadily Increasing Over The Last 10 Years While Broadcast Declines
Total Day Cable/Broadcast Women 18-34 Share10-Year Trend
*Time period reflects 1Q only in each year
Source: CAB Analysis of Nielsen Live+7 time period data. Share is based on sum of all cable & English-language broadcast impressions. Broadcast reflects the “Big 4” in 1Q’04 and the “Big 4 + CW” in 1Q’09 & 1Q’14

Across Genres, Branded Cable Content is the Most Sought After on the Internet For Women 18-34
Source: CAB analysis of comScore data, September 2013. Top sites by category
Sports
NBC Sports Network
ESPN
Bleacher Report
USA Today Sports
FOX Sports on MSN
College Humor/Cracked
Adult Swim
Huffington Post Comedy
Comedy Central
Cheezburger
CNN
Yahoo!
NBC News
BuzzFeed
USA Today
MTV
ToneMedia
Spotify
Yahoo! Music
Hearst Home Design
eHow Home & Garden
Houzz.com
ApartmentTherapy.com
HGTV
The Weather Channel
Weatherbug
Accuweather.com
MSN Weather
Yahoo! Weather
NBCU TV
A+E Networks
ABC
TV Guide
Discovery Networks
BlogHer Food
All Recipes
Food Network
My Recipes Network
Foodie by Glam
CoolMath-Games.com
Disney Entertainment
Nickelodeon Kids & Teens
PBSKids.org
Poptropica
Sports Comedy General News Music
Home Weather TV Entertainment
Kids
Food
Soundcloud
Top 5 Websites by Genre – W18-34
= Ad-supported cable brand
EA Websites
GSN
FreeRide Games
Zynga
Gaming
King.com

Women 18-49

Women 18-49 Spend Much More Time With Television Than Any Other Media
Internet: comscore. Radio Source: RADAR ® 119, December 2013 © Copyright Nielsen Audio (M-Su, M-F, Sa/Su 24-Hour TSL Estimates, All Radio)Newspaper based on CAB Analysis of 2012 MRI Doublebase data fused with Media Audit (2012-2013)Source: CAB analysis of Nielsen Npower Live+7 pm level. Average Week in 1Q’14 Total Day
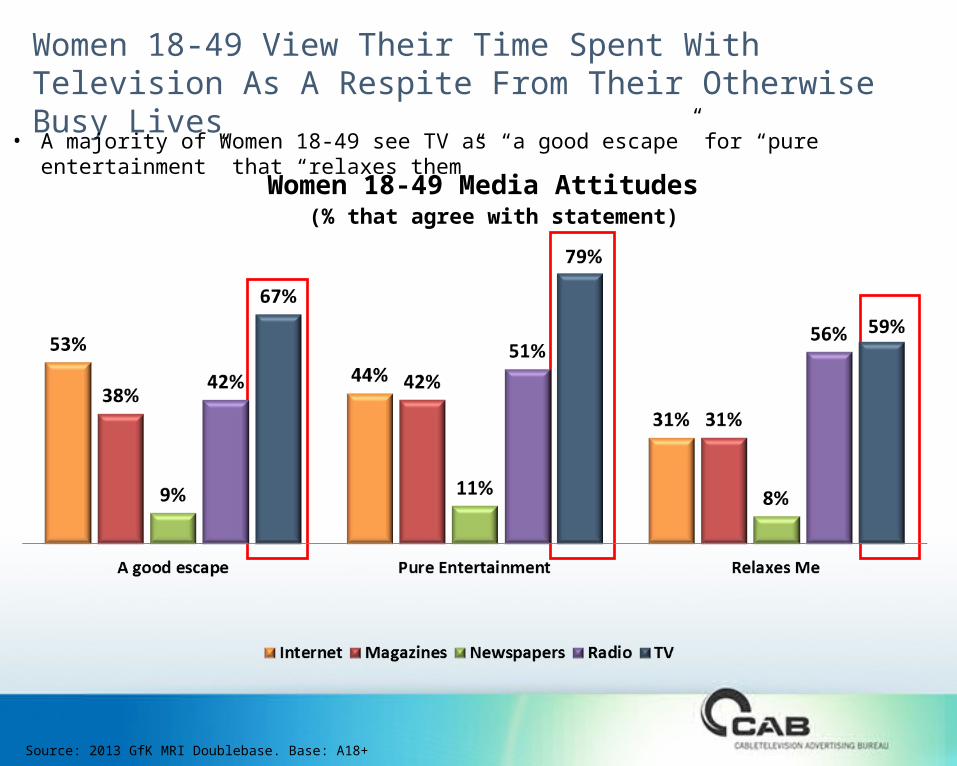
Women 18-49 View Their Time Spent With Television As A Respite From Their Otherwise Busy Lives
Source: 2013 GfK MRI Doublebase. Base: A18+
• A majority of Women 18-49 see TV as “a good escape” for “pure entertainment” that “relaxes them”
Women 18-49 Media Attitudes(% that agree with statement)

Women 18-49 Spend More Than 19 Hours Per Week Watching Cable TV Programming
Source: CAB analysis of Nielsen Npower Live+7 pm level. 1Q’14 Total Day

Ad-Supported Cable Has A Large Majority of The Available TV GRPs Within The Women 18-49 Demo
Source: CAB analysis of Nielsen Npower Live+7 pm level. 1Q’14 Total Day

W18-49 Cable Ratings Have Seen A Significant Increase Over The Last Ten Years While Broadcast Has Steadily Declined
Total Day Women 18-49 Rating10-Year Trend
*Time period reflects 1Q only in each year
Source: CAB Analysis of Nielsen Live+7 time period data. Broadcast reflects the “Big 4” in 1Q’04 and the “Big 4 + CW” in 1Q’09 & 1Q’14
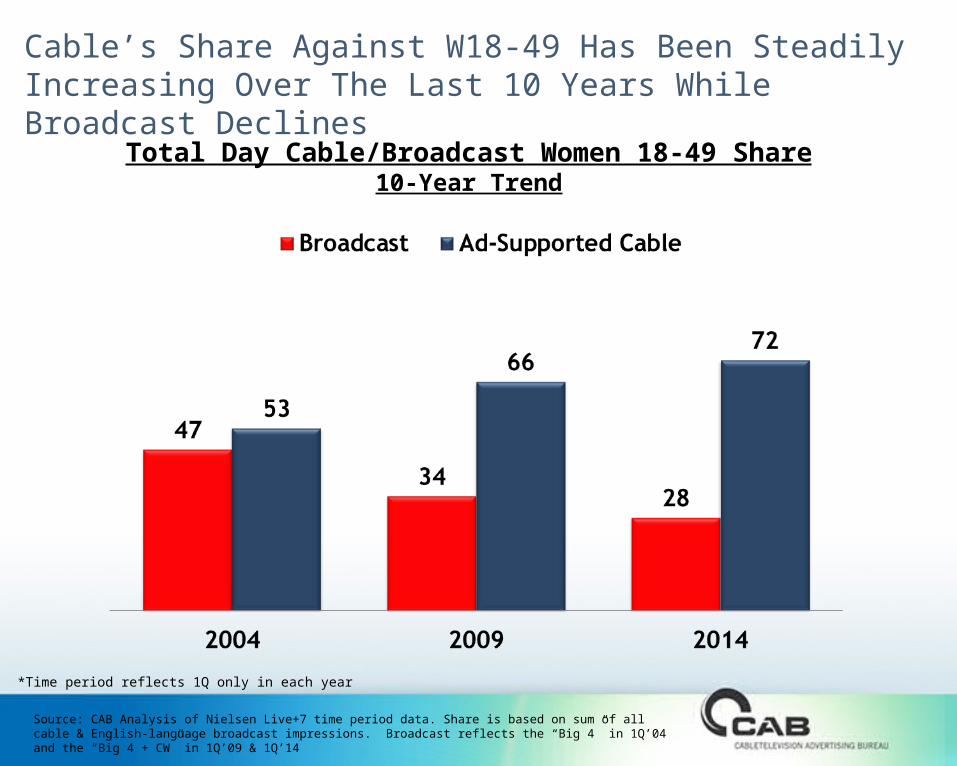
Cable’s Share Against W18-49 Has Been Steadily Increasing Over The Last 10 Years While Broadcast Declines
Total Day Cable/Broadcast Women 18-49 Share10-Year Trend
*Time period reflects 1Q only in each year
Source: CAB Analysis of Nielsen Live+7 time period data. Share is based on sum of all cable & English-language broadcast impressions. Broadcast reflects the “Big 4” in 1Q’04 and the “Big 4 + CW” in 1Q’09 & 1Q’14
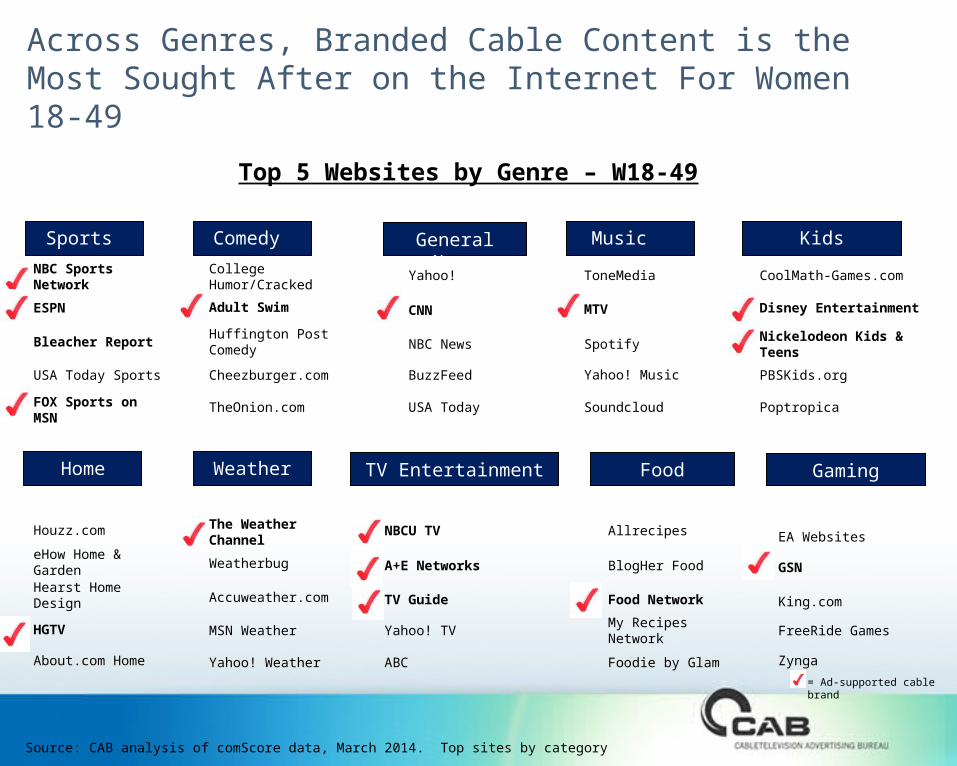
Across Genres, Branded Cable Content is the Most Sought After on the Internet For Women 18-49
Source: CAB analysis of comScore data, March 2014. Top sites by category
NBC Sports Network
ESPN
Bleacher Report
USA Today Sports
FOX Sports on MSN
College Humor/Cracked
Adult Swim
Huffington Post Comedy
Cheezburger.com
TheOnion.com
Yahoo!
CNN
NBC News
BuzzFeed
USA Today
ToneMedia
MTV
Spotify
Soundcloud
Houzz.com
eHow Home & Garden
Hearst Home Design
HGTV
About.com Home
The Weather Channel
Weatherbug
Accuweather.com
MSN Weather
Yahoo! Weather
NBCU TV
A+E Networks
TV Guide
Yahoo! TV
ABC
Allrecipes
BlogHer Food
Food Network
My Recipes Network
Foodie by Glam
CoolMath-Games.com
Disney Entertainment
Nickelodeon Kids & Teens
PBSKids.org
Poptropica
Sports Comedy General News Music
Home Weather TV Entertainment
Kids
Food
Yahoo! Music
Top 5 Websites by Genre – W18-49
= Ad-supported cable brand
EA Websites
GSN
King.com
FreeRide Games
Zynga
Gaming

Women 25-54

Women 25-54 Spend Much More Time With Television Than Any Other Media
Internet: comscore. Radio Source: RADAR ® 119, December 2013 © Copyright Nielsen Audio (M-Su, M-F, Sa/Su 24-Hour TSL Estimates, All Radio)Newspaper based on CAB Analysis of 2012 MRI Doublebase data fused with Media Audit (2012-2013)Source: CAB analysis of Nielsen Npower Live+7 pm level. Average Week in 1Q’14 Total Day
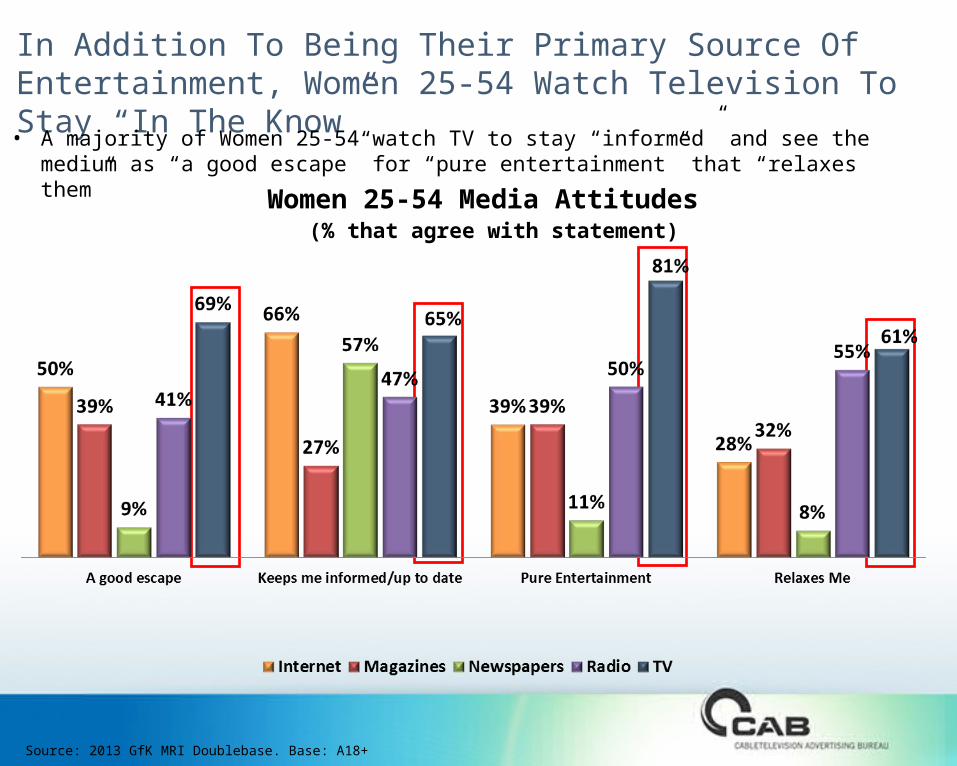
In Addition To Being Their Primary Source Of Entertainment, Women 25-54 Watch Television To Stay “In The Know”
Source: 2013 GfK MRI Doublebase. Base: A18+
• A majority of Women 25-54 watch TV to stay “informed” and see the medium as “a good escape” for “pure entertainment” that “relaxes them”
Women 25-54 Media Attitudes(% that agree with statement)

Cable Edges Out Broadcast On Time Spent Viewing For Women 25-54
Source: CAB analysis of Nielsen Npower Live+7 pm level. 1Q’14 Total Day

Ad-Supported Cable Has A Large Majority of The Available TV GRPs Within The Women 25-54 Demo
Source: CAB analysis of Nielsen Npower Live+7 pm level. 1Q’14 Total Day
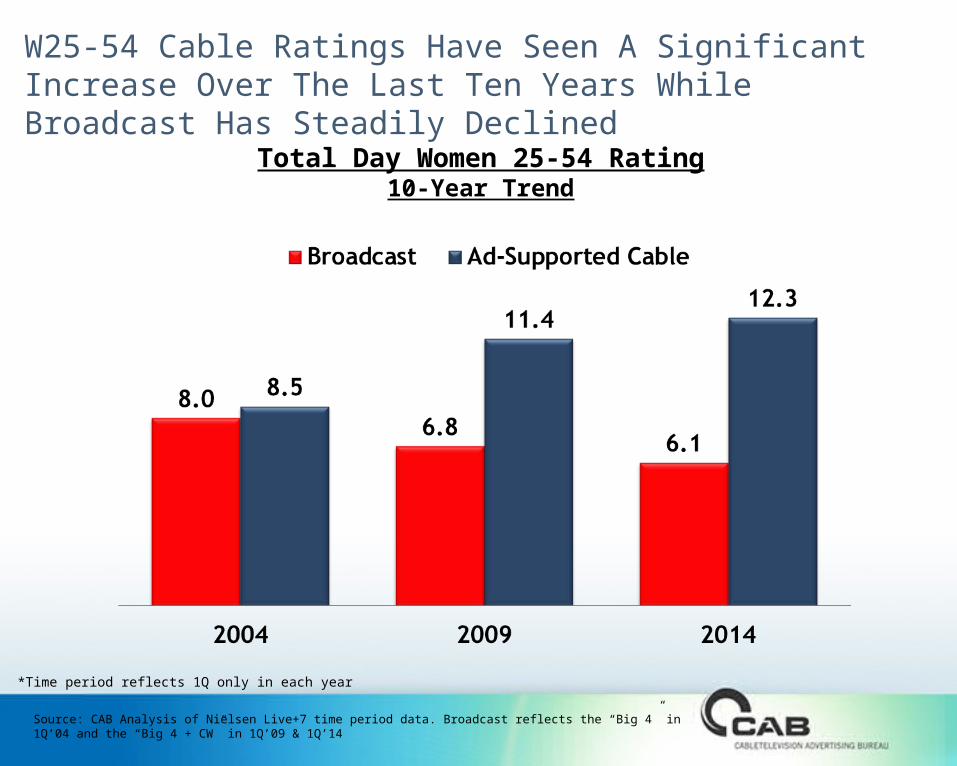
W25-54 Cable Ratings Have Seen A Significant Increase Over The Last Ten Years While Broadcast Has Steadily Declined
Total Day Women 25-54 Rating10-Year Trend
*Time period reflects 1Q only in each year
Source: CAB Analysis of Nielsen Live+7 time period data. Broadcast reflects the “Big 4” in 1Q’04 and the “Big 4 + CW” in 1Q’09 & 1Q’14
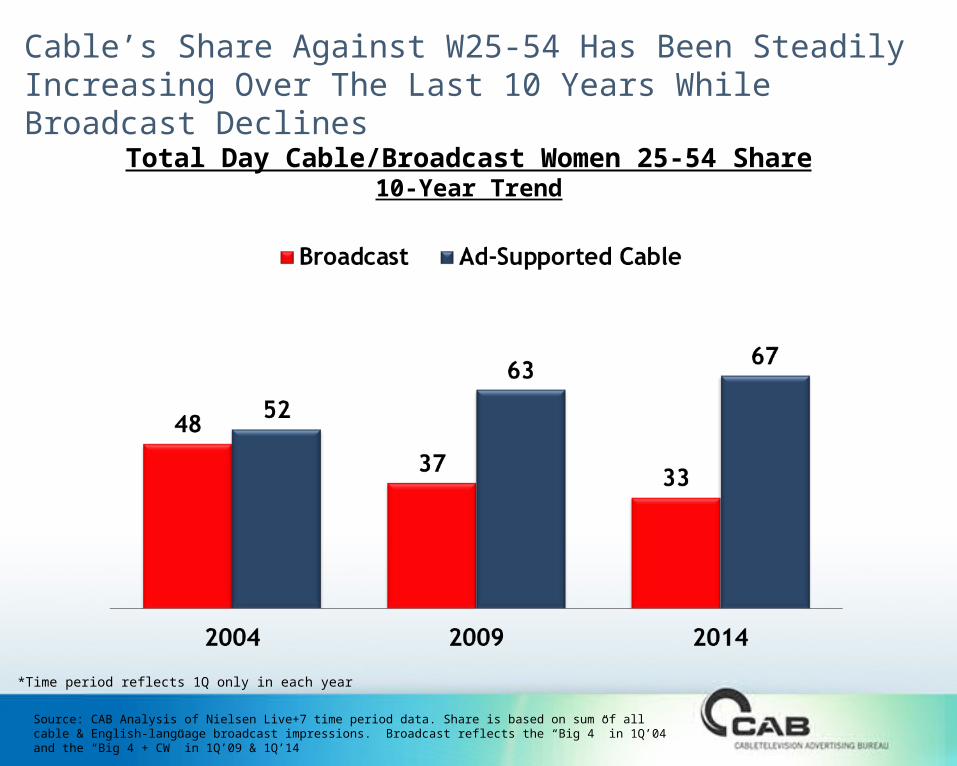
Cable’s Share Against W25-54 Has Been Steadily Increasing Over The Last 10 Years While Broadcast Declines
Total Day Cable/Broadcast Women 25-54 Share10-Year Trend
*Time period reflects 1Q only in each year
Source: CAB Analysis of Nielsen Live+7 time period data. Share is based on sum of all cable & English-language broadcast impressions. Broadcast reflects the “Big 4” in 1Q’04 and the “Big 4 + CW” in 1Q’09 & 1Q’14

Across Genres, Branded Cable Content is the Most Sought After on the Internet For Women 25-54
Source: CAB analysis of comScore data, March 2014. Top sites by category
Sports
NBC Sports Network
ESPN
Bleacher Report
FOX Sports on MSN
USA Today
College Humor/Cracked
Huffington Post Comedy
Adult Swim
TheOnion.com
Cheezburger.com
Yahoo!
CNN
NBC News
USA Today
CBS News
ToneMedia
MTV
Spotify
MSN Music
Houzz.com
eHow Home & Garden
HGTV
Hearst Home Design
About.com Home
The Weather Channel
Weatherbug
Accuweather.com
MSN Weather
Yahoo! Weather
NBCU TV
Yahoo! TV
A+E Networks
TV Guide
MSN TV
Allrecipes
BlogHer Food
Food Network
MyRecipeNetwork.com
About.com Food
CoolMath-Games.com
Disney Entertainment
Nickelodeon Kids & Teens
PBSKIDS.Org
Poptropica Worldwide
Sports Comedy General News Music
Home Weather TV Entertainment
Kids
Food
Yahoo! Music
Top 5 Websites by Genre – W25-54
= Ad-supported cable brand
EA Websites
King.com
GSN
Zynga
FreeRide Games
Gaming

Women 50+
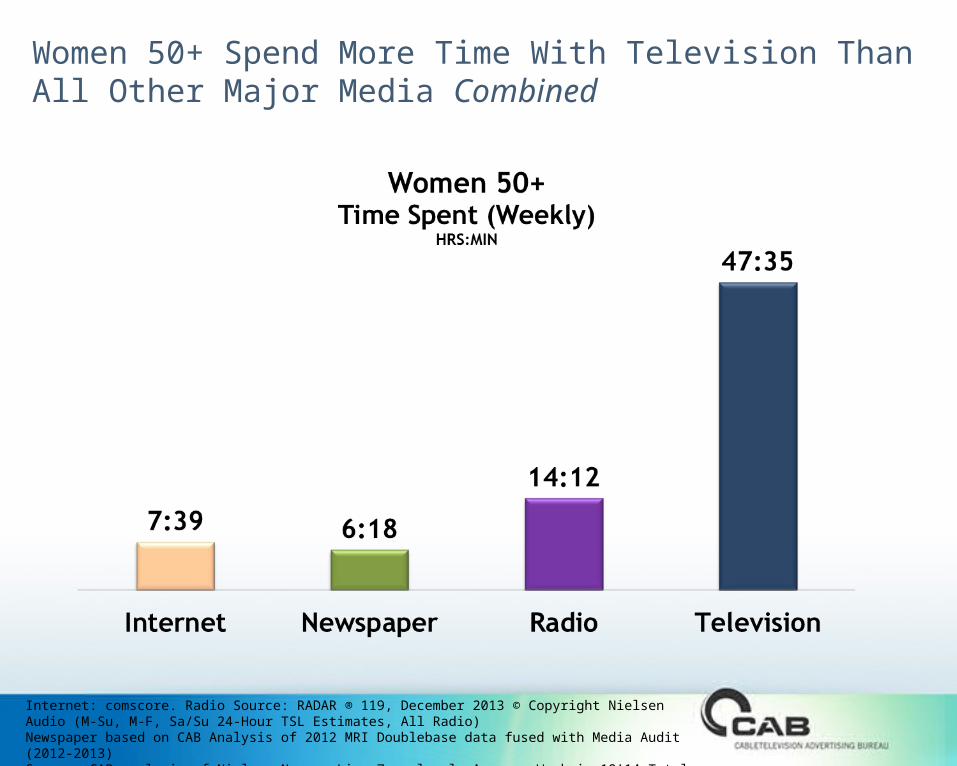
Women 50+ Spend More Time With Television Than All Other Major Media Combined
Internet: comscore. Radio Source: RADAR ® 119, December 2013 © Copyright Nielsen Audio (M-Su, M-F, Sa/Su 24-Hour TSL Estimates, All Radio)Newspaper based on CAB Analysis of 2012 MRI Doublebase data fused with Media Audit (2012-2013)Source: CAB analysis of Nielsen Npower Live+7 pm level. Average Week in 1Q’14 Total Day

To Women 50+, Television is Their Trusted, Primary Resource For Entertainment, Exploration And Information
Source: 2013 GfK MRI Doublebase. Base: A18+
• A majority of Women 50+ watch TV to “learn” and stay “informed” while seeing the medium as “a good escape” for “pure entertainment” that “puts them in a good mood” and “relaxes them”
• Television is also the most trusted media within this demographicWomen 50+ Media Attitudes
(% that agree with statement)

Ad-Supported Cable Has A Large Majority of The Available TV GRPs Within The Women 50+ Demo
Source: CAB analysis of Nielsen Npower Live+7 pm level. 1Q’14 Total Day

W50+ Cable Ratings Have Seen A Significant Increase Over The Last Ten Years While Broadcast Has Steadily Declined
Total Day Women 50+ Rating10-Year Trend
*Time period reflects 1Q only in each year
Source: CAB Analysis of Nielsen Live+7 time period data. Broadcast reflects the “Big 4” in 1Q’04 and the “Big 4 + CW” in 1Q’09 & 1Q’14

Cable’s Share Against Women 50+ Has Been Steadily Increasing Over The Last 10 Years While Broadcast Declines
Total Day Cable/Broadcast Women 50+ Share10-Year Trend
*Time period reflects 1Q only in each year
Source: CAB Analysis of Nielsen Live+7 time period data. Share is based on sum of all cable & English-language broadcast impressions. Broadcast reflects the “Big 4” in 1Q’04 and the “Big 4 + CW” in 1Q’09 & 1Q’14

Women 50+ Are Much More Likely To Be “Heavy” Consumers of Television Than Almost All Other Media
Source: 2013 GfK MRI Doublebase. Base: A18+
• Women 50+ especially pop high against TV programming that airs during the day
Women 50+ Media Quintiles“Heavy” Usage (Quintile 1) Index vs. Adults

Across Genres, Branded Cable Content is the Most Sought After on the Internet For Women 50+
Source: CAB analysis of comScore data, March 2014. Top sites by category
NBC Sports Network
FOX Sports on MSN
ESPN
Bleacher Report
USA Today Sports
Huffington Post Comedy
College Humor/Cracked
Adult Swim
Comedy Central
TheOnion.com
Yahoo!
CNN
NBC News
FOX News
CBS News
Yahoo! Music
MSN Music
MTV
Spotify
Houzz.com
eHow Home & Garden
HGTV
Hearst Home Design
About.com Home
The Weather Channel
Weatherbug
Accuweather.com
MSN Weather
Yahoo! Weather
NBCU TV
Yahoo! TV
MSN TV
TV Guide
AOL - Huffington Post TV
Allrecipes
Food Network
BlogHer Food
FOOD.com
My Recipes Network
Nickelodeon Kids & Teens
CoolMath-Games.com
Disney Entertainment
Mattel Sites
PBSKIDS.Org
Sports Comedy General News Music
Home Weather TV Entertainment
Kids
Food
ToneMedia
Top 5 Websites by Genre – W50+
= Ad-supported cable brand
King.com
Zynga
EA Websites
FreeRide Games
GSN
Gaming