media and investors presentation - valora and investors‘ presentation 2012 financial year results...
TRANSCRIPT

Zurich, March 26, 2013
Media and investors‘ presentation
2012 financial year results

March 26, 2013 Valora Holding AG – 2012 results Page 2
Agenda
Introduction
2012 Valora Group results 2
Outlook | Summary 5
Divisions„ strategic initiatives 3
1
Projections for 2013 | 2015 4

Page 3
2012 in retrospect Major profitability-enhancing milestones reached
Valora Holding AG – 2012 results
Strategy «Valora 4 Growth» strategy successfully completed | Acquisition of Ditsch/Brezelkönig
and Convenience Concept provide sound basis for sustainable future growth and
increase competence in retail, particularly in immediate-consumption market
March 26, 2013
EBIT CHF 65.8 million, slightly above earlier guidance
EBITDA CHF 121.2 million, 3.6% up on 2011 result
Valora Retail Contribution to Group results held steady at 2011 levels after adjusting for one-off
factors and despite weakness of overall market
Valora Trade Significantly greater competition in „classic“ Trade categories resulted in increased
pressure on margins | new categories (esp. EMH, ScanCo) met expectations
Valora Services First major milestones in division„s strategic re-direction through divestment of Services
Austria and Swiss goods wholesaling unit
1
2
3
5
4
March 26, 2013 Valora Holding AG – 2012 results Page 4
Agenda
Introduction
2012 Valora Group results 2
1
Outlook | Summary 5
Divisions„ strategic initiatives 3
Projections for 2013 | 2015 4

Page 5
Key financial metrics for 2012 Acquisitions enhance top-line results | special factors substantially impact bottom line
in CHF million versus 2011
External sales
Net revenues
EBIT
EBITDA margin
3 320.2
2 847.9
65.8
4.3%
+12.1%
+1.1%
-6.7%
+0.1%P
Gross profit 940.3 +7.3%
Operating costs (net) -874.6 +8.5%
Comments
Acquisitions positively influenced growth in
external sales (CHF 470 million)
Higher gross profit mainly thanks to
Ditsch/BK integration; year-on-year decline
at Retail/Services (due to weak press
market) and Trade (due to margin pressure)
Operating profit reflects substantial impact
of one-off factors (relating to divestments)
Valora Holding AG – 2012 results
Gross-profit margin 33.0% +1.9%P
EBITDA 121.2 +3.6%
March 26, 2013
EBIT margin 2.3% -0.2%P

Page 6
Comments
2012 Group net profit Higher financing costs due to expanded scale of operations
EBIT 65.8 -6.7%
Net result of financing activities -12.6 +237.9%
Share of associate/JV results 0.5 +83.7%
Earnings before
Income taxes 53.6 -20.0%
Income taxes -7.9 -21.3%
Group net profit 45.7 -20.2%
Group‘s overall tax rate 14.7% -0.2%P
Increased debt burden (acquisitions)
resulted in higher interest expense
Overall tax rate within projected long-term
range
Valora Holding AG – 2012 results March 26, 2013
EBITDA 121.2 +3.6%
in CHF million versus 2011

Page 7
Key balance-sheet metrics Convenience Concept and Ditsch/BK acquisitions raise balance-sheet total
in Mio. CHF Cash / cash-equivalents
Shareholders‘ equity
Net working capital
147.2
575.3
Equity cover 35.9%
+34.3%
+24.4%
136.3 +16.2%
Net debt 361.6 +329.7 mn
-6.0%P
NWC in % of net revenues 4.8% +0.6%P
Comments
Valora Holding AG – 2012 results
Change in equity cover reflects 2012
acquisitions. Equity cover remains within
strategic target range
Net debt as ratio of EBITDA* (leverage
ratio) now 2.4x
* based on annualised EBITDA for Ditsch/Brezelkönig
in Mio. CHF Balance-sheet total 1 602.1 +45.2%
Leverage ratio* 2.4x +2.1x
in Mio. CHF Goodwill 469.6 +316 mn
March 26, 2013
in CHF million versus 2011

Page 8
Valora Retail performance EBITDA up on 2011 levels | real-estate divestment has one-off impact on EBIT
Key metrics for division (in CHF million)
EBIT 25.3 -39.4%
Gross profit 606.0 +6.2%
Operating costs (net) -580.7 +9.8%
EBITDA margin (adjusted)* 4.2% +0.1%P
Comments
Relatively stable operating profit
Results successfully absorbed effects of
adverse factors (press-market decline,
integration costs, social plan in Germany and
outlet transformation costs [Tamoil/avec.])
Effective cost management
Net revenues 1 663.4 +3.1%
Valora Holding AG – 2012 results
adjusted* 39.5
Gross-profit margin 36.4% +1.1%P
External sales 2 139.5 +21.5%
EBITDA (adjusted)* 70.1 +5.6%
March 26, 2013
versus 2011
* adjusted for book-value loss on Muttenz sale (HHM)

Page 9
Valora Retail performance CC acquisition boosts external sales | all core formats performing well
External sales at Retail division (in CHF million)
-0.7%
+92.9%
+2.8%
Schmelzer-Bettenhausen since January 1, 2012
765.4
1 268.1
89.6
16.5
Total division 2 139.5 +21.5%
Valora Holding AG – 2012 results
Net revenues* at Retail division (in CHF million)
323.7
1 081.8
225.2
32.7
Total Division 1 663.4
+1.6%
+11.0%
+1.7%
+3.1%
-7.2%
March 26, 2013
versus 2011 versus 2011
* Net revenues: proceeds from sale of goods, services and products manufactured by Valora itself, net of any deductions for rebates, discounts and other agreed concessions.

Page 10
Ditsch/Brezelkönig performance Successful integration | results confirm initial projections for 2012 growth
Net revenues* by country (in CHF million)
36.4
14.0
Total Ditsch/BK 50.1
* Ditsch/Brezelkönig results consolidated from October 1, 2012
Further Ditsch/BK key metrics* (in CHF million)
EBIT 7.1
Gross profit 38.4
Operating costs (net) -31.3
EBITDA margin 21.1%
Comments
Ditsch/Brezelkönig integration progressing
successfully
Results confirm net revenue and
profitability projections
Existing outlet-network and product-range
synergies to be exploited in 2013 – 2015
Valora Holding AG – 2012 results
Gross-profit margin 76.6%
EBITDA 10.6
March 26, 2013

Page 11
Valora Services performance Group exposure to press market reduced | divestment of Services Austria and Swiss wholesaling units
FY 2012 net revenues at Services division (in CHF million)
Further key metrics for division (in CHF million)
EBIT 12.0 -40.0%
Gross profit 103.4 -15.7%
Operating costs (net) -91.4 -11.0%
EBITDA margin 3.3% -0.8pct pts
Group exposure to press market reduced
Net revenues decline due to sale of Services
Austria and decrease in net revenues in
Swiss wholesaling unit
Decline in Swiss and Luxembourg press
sales in line with expectations
Comments
Valora Holding AG – 2012 results
Gross-profit margin 22.2% +1.8 pct pts
465 103
93
39 230
-10.6% -43.7% -21.1% -6.4% -22.5% versus FY 2011
EBITDA 15.4 -36.9%
March 26, 2013
Devestitonen
WS 2013 2012
Services AT
600
FY 2011 FY 2012

Page 12
Valora Trade performance New categories perform well | Trade classic categories under intense margin pressure
FY 2012 net revenues at Trade division (in CHF million)
+6.4% 792.5
66.5
180.7 +4.8%
+7.4%
346.3 +0.7%
Total
Division
Net revenues increased in all national markets, 2011
acquisitions kick in for full year during 2012
Despite higher gross profits (thanks to new categories),
overall gross-profit margin declined due to intense margin
pressure from principals and retailers alike (in classic
categories, where some prices declined)
Further key metrics for Trade division (in CHF million)
EBIT 8.1 -50.4%
Gross profit 178.8 +3.8%
Operating costs (net) -170.7 +9.5%
EBITDA margin 1.4% -1.2%P
Comments
* travel Retail, food services, cosmetics
Valora Holding AG – 2012 results
Gross-profit margin 22.6% -0.6%P
EBITDA 11.4 -41.5%
198.9 +19.5%
«classic»
«new categories*» «Nordics»
March 26, 2013

Page 13
Cash flow Capital expenditure up sharply | deterioration in NWC and NCA
Valora Holding AG – 2012 results
in Mio. CHF EBIT
2012 2011
Comments
Acquisition-related increase in
depreciation and amortisation, plus
deteriorating NWC/NCA
Higher interest expense resulting from
increased level of acquisition financing
Higher capital expenditure due to building
transformation work (outlets, head office)
65.8 70.5
Depreciation and amortisation 55.4 46.5
EBITDA 121.2 117.0
Elimination of non-cash items -18.2 -15.0
NWC and NCA -28.3 5.9
Interest, taxes (net) -20.2 -11.0
Cash flow from operations 54.5 97.0
Capital expenditure -72.2 -55.1
Asset disposals 59.9 9.7
Free cash flow 42.2 51.6
March 26, 2013
Cash flow from ordinary
investing activities
-12.3 -45.4
in CHF million

March 26, 2013 Valora Holding AG – 2012 results Page 14
Agenda
Introduction
2012 Valora Group results 2
Divisions‘ strategic initiatives 3
1
Outlook | Summary 5
Projections for 2013 | 2015 4

Retail Germany
Page 15
Strategic initiatives at Valora Retail (1/2) Retail Germany focusing on outlet network and product ranges
Valora Holding AG – 2012 results
~ 40 ~ 25
Total ~ 1 660
# POS
~ 650
~ 180
~ 180
~ 150
March 26, 2013
~ 500
ServiceStore DB renovation
Transform ServiceStore DB outlets
Professionalise distribution and category management capabilities
Implement new product ranges in convenience business
Implementation of CTN+ concept at Cigo
Identify ~ 650 Cigo outlets with potential for layout and product-range transformation to k kiosk model
Strengthen food and services offering
Streamlining of Cigo outlet portfolio planned

Retail Switzerland
Page 16
Strategic initiatives at Valora Retail (2/2) Retail Switzerland focusing on product ranges and cost management
Valora Holding AG – 2012 results
~ 900
~ 120
~ 40 ~ 25
Total ~ 1 085
# outlets
March 26, 2013
Strategy
Growth in food and services revenues to compensate for decline in press sales
Enhanced product-range mix and improved cost management to raise profitability
Actions
Substantial layout and product-range transformations for at least 300 outlets by 2015
Product ranges to be systematically enhanced
Agency business model to be extended to more outlets
Results
100 outlets to be transformed during 2013
Pilot sites generating very positive performance

Page 17
Strategic initiatives at Ditsch/Brezelkönig (1/2) Format on sustainable growth trajectory
Valora Holding AG – 2012 results
CAGR 8%
2012 – 2017 sales growth (in %)
Wholesale
Given plant locations, requisite
volumes will be largely
produced in Germany
Retail growth of ~10% p.a.
3% organic
7% from new outlets
Both country units to expand
their networks
Switzerland +100%
Germany + 25%
Switzerland
50% new sites
50% transformed Valora sites
Germany
100% new sites
Comments Planned outlet expansion in
Germany / Switzerland
2012 2017
230
Ditsch/Brezelkönig growth trajectory
March 26, 2013
4% p.a.
Retail 10% p.a.
* incl. production facilities and maintenance
Page 18
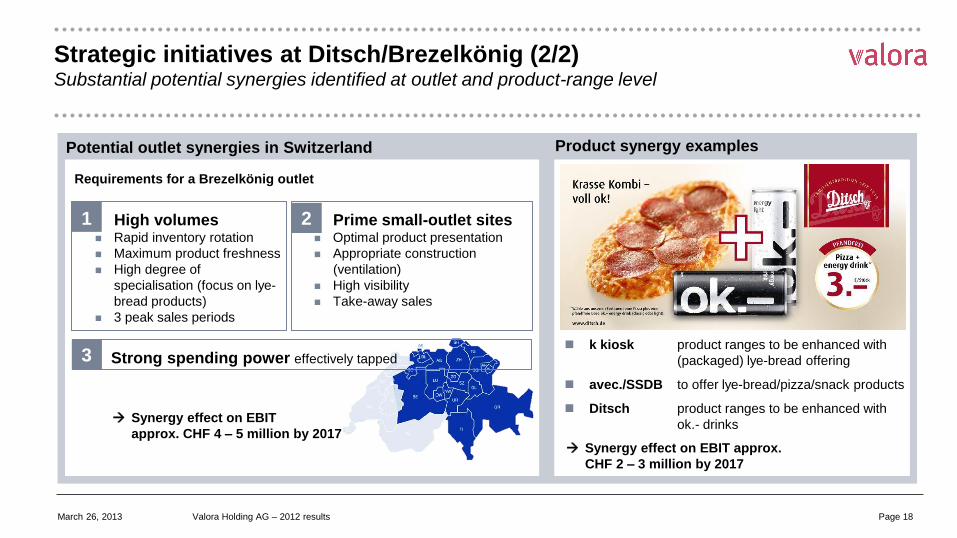
Strategic initiatives at Ditsch/Brezelkönig (2/2) Substantial potential synergies identified at outlet and product-range level
Valora Holding AG – 2012 results
Potential outlet synergies in Switzerland
March 26, 2013
Product synergy examples
k kiosk product ranges to be enhanced with
(packaged) lye-bread offering
avec./SSDB to offer lye-bread/pizza/snack products
Ditsch product ranges to be enhanced with
ok.- drinks
Synergy effect on EBIT approx.
CHF 2 – 3 million by 2017
Requirements for a Brezelkönig outlet
High volumes Rapid inventory rotation
Maximum product freshness
High degree of
specialisation (focus on lye-
bread products)
3 peak sales periods
Prime small-outlet sites Optimal product presentation
Appropriate construction
(ventilation)
High visibility
Take-away sales
1 2
3 Strong spending power effectively tapped
Synergy effect on EBIT
approx. CHF 4 – 5 million by 2017

Page 19
Strategic initiatives at Valora Services (1/2) Sharp market contraction since 2009 | schedule for repositioning Services division
Valora Holding AG – 2012 results
Decline in Services revenues 2009 – 2012
Whole-
sale
2009 2011
197 183
66
42
150
118
300
257
713
600
35%
103
39
93
230
465
2012
March 26, 2013
Q1 2012 3rd-party logistics business launched under new „nilo“
brand
Q2 2012 Sustainable repositioning process commenced
Q3 2012 Valora Services Austria sold
Q4 2012 Announcement divestiture Swiss goods wholesaling unit
Q1 2013 Analysis of logistics services commenced (goods and press
products within Valora Switzerland)
Q2 2013 Evaluation of specific partnership options
Q3 2013 Decision on possible options
1 Joint ventures
2
3
4
Co-operations
Partnerships
FOCUS
Disposal of
(sub)areas of
business
Services repositioning to date, possible future options
in CHF million
Wholesale
unit sold
01/2013
Services
Austria sold
09/2012

Page 20
Strategic initiatives at Valora Services (2/2) Substantial potential to leverage logistics infrastructure
Valora Holding AG – 2012 results
Net revenues from 3rd party logistics
March 26, 2013
Overview of Valora Services intra-day/overnight logistics
Goods Press
Drittkunden
2010 2011 2012 2013E
9
11
13
(in CHF million) Overnight Intra-day
Pre
ss
3rd
part
ies
Press capability provides basis for additional business opportunities
Requirements for overnight logistics orders for 3rd party customers fully covered by
existing press network
Some 3rd party logistics services already
offered on smaller scale in earlier years
Net revenues and market presence increased
following „nilo“ launch in early 2012
Activity generates relatively high operating
margins as distribution infrastructure already
in place

Page 21
Strategic initiatives at Valora Trade (1/2) Major challenges in classic categories | successful start in cosmetics
Valora Holding AG – 2012 results
Net revenues 2008 – 2012 (in CHF million)
Market consolidation in traditional
categories since 2008 among principals
and brands (Kraft/Cadbury, Wrigley/Mars,
Norges-Gruppen/SuperCrossDK etc.)
Decline in net revenues (-18%) due to
exchange-rate effects, parallel imports,
market concentration and private-label
brands
Division successfully enters new
cosmetics category (with above-average
profitability) in 2010
Organic growth within the new categories
(cosmetics achieving 2% p.a.)
Comments
March 26, 2013
* excluding travel retail, food services, cosmetics
726
73
214
439
722
70
201
451
630
48
197
385
578
62
172
344
594
67
181
346
2008 2009 2010 2011 2012
62 56
167 «New Categories» (travel retail, food service, cosmetics)
92
199
- 18%
Nordics Schweiz Österreich/Deutschland
Trade Classic*

Page 22
Strategic initiatives at Valora Trade (2/2) Focusing on small/medium-sized principals | reducing dependence on large scale partners in retail
Valora Holding AG – 2012 results
Analysis of principal portfolio by principal size
Focus on small/medium-sized brand manufacturers with
higher profitability, and reduced dependence on large
principals
Renegotiate contractual terms with large principals to raise
profitability | increase share of portfolio devoted to
small/medium-sized principals
Reduce dependence on traditional retail by developing
alternative distribution channels (food services, pharmacies,
drugstores, specialised retailers etc.)
Raise efficiency levels in back-office structures (by
modernising IT, centralising supply-chain services etc.)
Projected effect of above initiatives
Top line: +/- 0% p.a.
Bottom line: + 1 percentage point over implementation cycle,
till target margin (2%) reached Net revenues EBIT contribution
«large» [> CHF 10 million]
«small» [< CHF 2 million]
«medium-sized» [< CHF 5 million]
March 26, 2013
Comments
March 26, 2013 Valora Holding AG – 2012 results Page 23
Agenda
Introduction
Outlook | Summary 5
1
Projections for 2013 | 2015 4
2012 Valora Group results 2
Divisions„ strategic initiatives 3

Building sales represent conscious
withdrawal from property ownership
Services Austria sold in strategic move to
reduce Group exposure to press market
Adjusted 2012 operating profit, and
baseline for 2013 guidance, is CHF 52.1
million
Page 24
Baseline for projected 2013 performance One-off factors significantly impacted 2012 results
Valora Holding AG – 2012 results
One-off effects on 2012 results (in CHF million)
2012
reported
65.8
+14.2
Book gain
on Services
Austria
sale
-22.9
2012
adjusted
Book loss
on Muttenz
sale
52.1
Book gain
on other
real-estate
sale
Acquisition
costs
IAS19
effect
Comments
-2.2 +4.5 -7.3
March 26, 2013

Page 25
Projected 2013 performance Operating profit to be raised in 2013
Valora Holding AG – 2012 results
2012
adjusted
2013E
Guidance
Full-year effects will show marked positive
influence of Ditsch/Brezelkönig and Convenience
Concept (effect of divestments will be negative)
Manageable impact of declining press
distribution thanks to positive effect of nilo 3rd party
logistics
Comments
Acquisitions
Ditsch/BK
Convenience
Concept
Divestments
Services Austria
Swiss wholesale
Ditsch/BK
Convenience
Concept
Retail
Trade
Full-year
effects
Growth
and
synergies
Services
(incl. pos.
effect of
nilo)
March 26, 2013
52.1
13 – 15
12 – 14 (3 – 5) ~ 75
~ 80 – 85 incl. one-off effects*
2013 operating profit guidance (in CHF million)
* particularly positive effect from IAS 19 (adjustment to annuity rates)

Page 26
Projected performance for 2013 – 2015 Operating profit 2013 to be significantly increase till 2015 through growth and synergies
Valora Holding AG – 2012 results
2015 operating profit guidance (in CHF million)
2013E
Guidance
2015E
Guidance
~ 75
Convenience Concept and
Ditsch/Brezelkönig to drive growth
from 2013 to 2015
Improved product range at Retail
division to boost profitability
Adjustment to principal portfolio and
cost-efficiency measures at Valora
Trade
Comments
Ditsch/BK
Convenience
Concept
Retail
Trade
25 – 28 (2 – 3) ~ 100
Growth and
synergies
March 26, 2013
Services
(incl. pos. effect of nilo)
~ 80 – 85 incl. one-off effects*
* particularly positive effect from IAS 19 (adjustment to annuity rates)

Page 27
Optimising the liability structure in H1 2013 Proceeds of new hybrid bond issue to partially replace acquisition financing from syndicated loan
Valora Holding AG – 2012 results
Hybrid bond placement planned to optimise financing structure (during 1st half of 2013)
March 26, 2013
Proceeds of hybrid bond issue to be directed towards Ditsch/Brezelkönig acquisition financing currently
provided by syndicated loan
Maturity profile to be optimised across entire financing structure
Planned moves will benefit from current attractive terms and liquidity available in capital market.
Potential placement in next few weeks, provided market conditions favourable.
1
2
3
4

March 26, 2013 Valora Holding AG – 2012 results Page 28
Agenda
Outlook | Summary 5
Projections for 2013 | 2015 4
Introduction 1
2012 Valora Group results 2
Divisions„ strategic initiatives 3

Page 29
Summary Sustainable profitability from core retail business and high levels of dividend payout
Valora Holding AG – 2012 results
Retail focus Concentration/focus on existing formats and Ditsch/Brezelkönig | opportunistic
acquisitions to complement network remain a possibility
March 26, 2013
Investments Investments totalling some CHF 200 million by 2015 – largely devoted to repositioning
Retail network and expanding Ditsch/Brezelkönig
Press market Services division„s dependence on press market to be reduced further by evaluating
specific partnerhip options and expanding services to 3rd party customers in logistics
Profitability at Trade Rebalanced principal portfolio and systematic cost-management initiatives to improve
operating profit significantly
Dividends Shareholder-friendly dividend policy with planned sustainable payout ratio of
approximately 80%
Board of Directors Election of Ernst Peter Ditsch to Board of Directors to secure long-term
involvement of largest single shareholder in Group„s future strategic development
1
2
3
4
5
6
Page 30
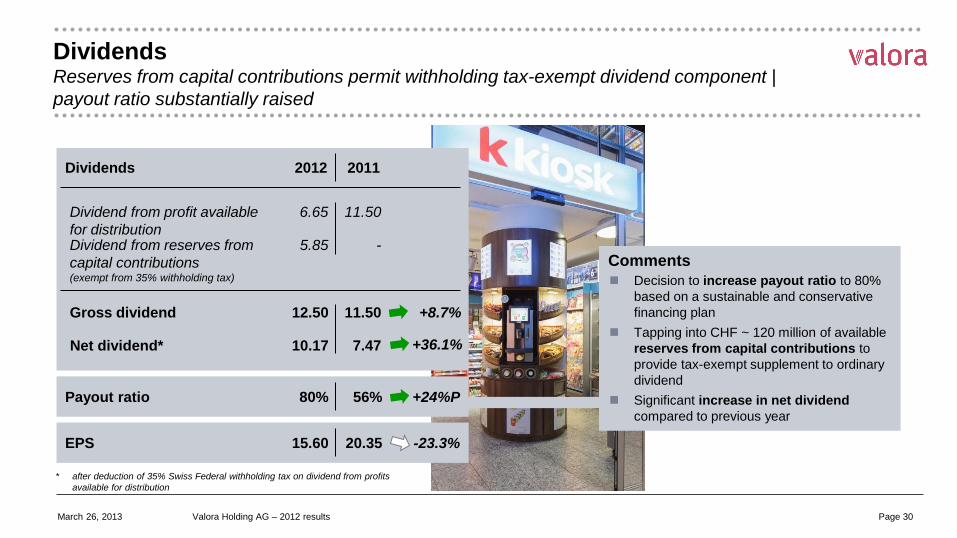
Dividends Reserves from capital contributions permit withholding tax-exempt dividend component |
payout ratio substantially raised
* after deduction of 35% Swiss Federal withholding tax on dividend from profits
available for distribution
Valora Holding AG – 2012 results
in Mio. CHF Dividends
6.65 11.50
in Mio. CHF Payout ratio
Dividend from profit available
for distribution 5.85 - Dividend from reserves from
capital contributions (exempt from 35% withholding tax)
12.50 Gross dividend 11.50
10.17 Net dividend* 7.47
2012 2011
+8.7%
+36.1%
80% 56% +24%P
Comments
Decision to increase payout ratio to 80%
based on a sustainable and conservative
financing plan
Tapping into CHF ~ 120 million of available
reserves from capital contributions to
provide tax-exempt supplement to ordinary
dividend
Significant increase in net dividend
compared to previous year
March 26, 2013
in Mio. CHF EPS 15.60 20.35 -23.3%

Page 31
Key Board recommendations to General Meeting To be held at Congress Center Basel on April 18, 2013, at 3 pm
Valora Holding AG – 2012 results
Raise dividend to CHF 12.50 – comprising CHF 6.65 from profit available for distribution and CHF 5.85
from reserves from capital contributions (the latter withholding-tax exempt)
March 26, 2013
Create authorised share capital of up to 250 000 new registered shares (~ 7% of shares currently
outstanding)
Re-election of current Board members
Election of Ernst Peter Ditsch to Valora Holding AG Board of Directors
1
2
3
4

Contacts
Corporate calendar
Mladen Tomic Phone: +41 61 467 36 50
Head of Corporate Investor Relations E-mail: [email protected]
Stefania Misteli Phone: +41 61 467 36 31
Head of Corporate Communications E-mail: [email protected]
2013 General Meeting April 18, 2013
2013 half-year results presentation August 29, 2013
Please visit our website for more information regarding VALORA
www.valora.com
Contacts
Corporate calendar

Page 33
APPENDIX
Valora Holding AG – 2012 results March 26, 2013

Page 34 Page 34
Valora Group 2012 results
in CHF million FY 2012 FY 2011 Δ
External sales 3 320.2 2 961.9 +12.1%
Net revenues 2 847.9 2 817.9 +1.1%
Gross profit 940.3 876.4 +7.3%
Gross-profit margin 33.0% 31.1% +1.9 pct pts
Operating costs -889.7 -813.9 +9.3%
Operating costs in % of net revenues 31.2% 28.9% +2.4% pct pts
Other revenues 15.1 8.0 +87.5%
EBITDA 121.2 117.0 +3.6%
EBITDA margin 4.3% 4.2% +0.1% pct pts
EBIT 65.8 70.5 -6.7%
EBIT margin 2.3% 2.5% -0.2% pct pts
March 26, 2012 Valora Holding AG – 2012 results
Page 35 Page 35
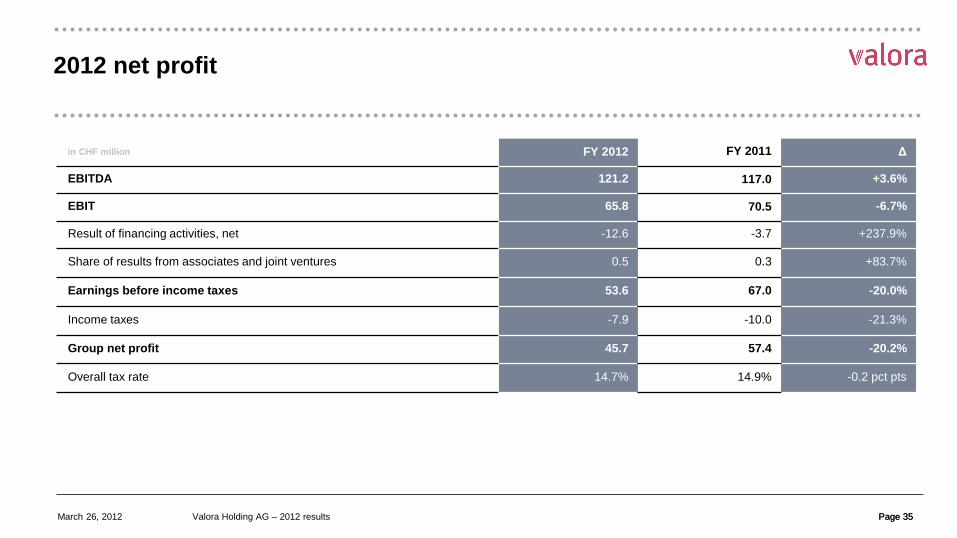
2012 net profit
in CHF million FY 2012 FY 2011 Δ
EBITDA 121.2 117.0 +3.6%
EBIT 65.8 70.5 -6.7%
Result of financing activities, net -12.6 -3.7 +237.9%
Share of results from associates and joint ventures 0.5 0.3 +83.7%
Earnings before income taxes 53.6 67.0 -20.0%
Income taxes -7.9 -10.0 -21.3%
Group net profit 45.7 57.4 -20.2%
Overall tax rate 14.7% 14.9% -0.2 pct pts
March 26, 2012 Valora Holding AG – 2012 results

Page 36 Page 36
Valora Retail 2012 results
in CHF million FY 2012 FY 2011 Δ
External sales 2 139.5 1 760.8 +21.5%
Net revenues 1 663.4 1 613.2 +3.1%
Gross profit 606.0 570.5 +6.2%
Gross-profit margin 36.4% 35.4% +1.1% pct pts
Operating costs, net -580.7 -528.7 +9.8%
EBITDA (adjusted)* 70.1 66.4 +5.6%
EBITDA margin (adjusted)* 4.2% 4.1% -0.1 pct pts
EBIT 25.3 41.8 -39.4%
EBIT adjusted* 39.5 41.8 -5.4%
March 26, 2012 Valora Holding AG – 2012 results
* adjusted for book loss on sale of Muttenz facility

Page 37 Page 37
Ditsch/Brezelkönig 2012 results
in CHF million FY 2012 FY 2011 Δ
Net revenues 50.1 n.a n.a.
Gross profit 38.4 n.a n.a.
Gross-profit margin 76.6% n.a n.a.
Operating costs, net -31.1 n.a n.a.
EBITDA 10.6 n.a n.a.
EBITDA margin 21.1% n.a n.a.
EBIT 7.1 n.a n.a.
March 26, 2012 Valora Holding AG – 2012 results

Page 38 Page 38
Valora Services 2012 results
in CHF million FY 2012 FY 2011 Δ
Net revenues 465.0 599.7 -22.5%
Gross profit 103.4 122.7 -15.7%
Gross-profit margin 22.2% 20.5% +1.8 pct pts
Operating costs, net -91.4 -102.7 -11.0%
EBITDA 15.4 24.5 -36.9%
EBITDA margin 3.3% 4.1% -0.8 pct pts
EBIT 12.0 20.0 -40.0%
March 26, 2012 Valora Holding AG – 2012 results

Page 39 Page 39
Valora Trade 2012 results
in CHF million FY 2012 FY 2011 Δ
Net revenues 792.5 744.5 +6.4%
Gross profit 178.8 172.2 +3.8%
Gross-profit margin 22.6% 23.1% -0.6 pct pts
Operating costs, net -170.7 -155.9 +9.5%
EBITDA 11.4 19.6 -41.5%
EBITDA margin 1.4% 2.6% -1.2 pct pts
EBIT 8.1 16.3 -50.4%
March 26, 2012 Valora Holding AG – 2012 results

DISCLAIMER
NOT FOR RELEASE, PUBLICATION OR DISTRIBUTION IN OR INTO THE UNITED STATES THIS DOCUMENT IS NOT BEING ISSUED IN THE UNITED STATES OF AMERICA AND SHOULD NOT BE DISTRIBUTED TO U.S. PERSONS OR PUBLICATIONS WITH A GENERAL CIRCULATION IN THE UNITED STATES. THIS DOCUMENT DOES NOT CONSTITUTE AN OFFER OR INVITATION TO SUBSCRIBE FOR OR PURCHASE ANY SECURITIES. IN ADDITION, THE SECURITIES OF VALORA HOLDING AG HAVE NOT BEEN REGISTERED UNDER THE UNITED STATES SECURITIES LAWS AND MAY NOT BE OFFERED, SOLD OR DELIVERED WITHIN THE UNITED STATES OR TO U.S. PERSONS ABSENT REGISTRATION UNDER OR AN APPLICABLE EXEMPTION FROM THE REGISTRATION REQUIREMENTS OF THE UNITED STATES SECURITIES LAWS
This document contains specific forward-looking statements, e.g. statements including terms like “believe”, “expect” or similar expressions. Such forward-looking statements are subject to known and unknown risks, uncertainties and other factors which may result in a substantial divergence between the actual results, financial situation, development or performance of Valora and those explicitly presumed in these statements. Against the background of these uncertainties readers should not rely on forward-looking statements. Valora assumes no responsibility to update forward-looking statements or adapt them to future events or developments.