mechanistic analysis of the risk of pharmacokinetic drug ... · telotristat ethyl, its active...
TRANSCRIPT

Mechanistic Analysis of the Risk of Pharmacokinetic Drug-drug
Interactions with Drugs Recently Approved by the US FDA
Jingjing Yu, MD, PhDResearch Scientist
Senior Project ManagerDrug Interaction Database Program
School of PharmacyUniversity of Washington
12-3-2018 1

Why NDA Reviews?
Provide a most unique perspective on the evolution of“drug interaction science”
Provide an opportunity to observe how pharmaceuticaland regulatory scientists interpret regulatory guidances inthe context of specific therapeutic classes
Specifically, how the results of metabolism- andtransporter-mediated drug-drug interactions,physiologically based pharmacokinetic modeling andsimulations, and pharmacogentic studies, are translatedinto labeling
2

Number of Novel Drugs Approved: 2008-2017
2008 2009 20102011
20122013
20142015
20162017
20 20
15
24
33
25
30
33
15
34
46
6 6 6
2
11 12
7
12
NDAs BLAs
3
• Average: 32 drugs/year
Nu
mb
er
of
Dru
gs

Outline
Scope of the evaluation
2017 New Drug Application (NDA) highlights: Represented therapeutic classes
Mechanistic drug-drug interaction (DDI) studieso Metabolism-based DDIs
o Transporter-mediated DDIs
o Clinical DDIs with AUC ratios ≥ 5 (for inhibition) or ≤ 0.2 (for induction)
Physiologically based pharmacokinetic (PBPK) modeling andsimulation examples
Pharmacogenetic studies
Overall conclusions
4
Manuscript titled “Mechanisms and Clinical Significance of Pharmacokinetic-based
Drug-drug Interactions with Drugs Approved by the U.S. Food and Drug Administration
in 2017”, uncopyedited version on DMD FastForward site:
http://dmd.aspetjournals.org/content/early/2018/11/15/dmd.118.084905

Data Source Metabolism and
Transport Drug
Interaction Database®,
University of
Washington
https://www.druginteractioninfo.org/
5

Data Source NDA Reviews available at Drugs@FDA
NIH ClinicalTrials.gov
https://www.accessdata.fda.gov/drugsatfda_docs/nda/2017/208745Orig1s000TOC.cfm 6

Outline
Scope of the evaluation
2017 New Drug Application (NDA) highlights: Represented therapeutic classes
Mechanistic drug-drug interaction (DDI) studieso Metabolism-based DDIs
o Transporter-mediated DDIs
o Clinical DDIs with AUC ratios ≥ 5 (for inhibition) or ≤ 0.2 (for induction)
Physiologically based pharmacokinetic (PBPK) modeling andsimulation examples
Pharmacogenetic studies
Overall conclusions
7

Therapeutic Classes for Novel Drugs Approved in 2017 (N = 34)
26%
23%
12%
12%
9%
6%
6%
3% 3%Cancer Treatments (9)
Anti-infective Agents (8)
Central Nervous System Agents (4)
Endocrinology/Metabolism DisorderTreatments (4)
Gastrointestinal Agents (3)
Cardiovascular Disease Treatments (2)
Eye Treatments (2)
Anti-inflammantory Drugs (1)
Diagnostic Agents (1)
8

Cancer Treatments (N = 9)Active Ingredient Trade Name Therapeutic Class Indications
Acalabrutinib CALQUENCE Kinase Inhibitor Mantle cell lymphoma
Copanlisib ALIQOPA Kinase Inhibitor Relapsed follicular lymphoma
Enasidenib IDHIFAIsocitrate Dehydrogenase-2
(IDH2) InhibitorRelapsed or refractory acute myeloid leukemia
(AML)
Midostaurin RYDAPT Kinase Inhibitor Acute myeloid leukemia
Abemaciclib VERZENIO Kinase InhibitorHormone receptor (HR)-positive, HER2-negative
advanced or metastatic breast cancer
Ribociclib KISQALI Kinase InhibitorHormone receptor (HR)-positive, HER2-negative
advanced or metastatic breast cancer
Neratinib NERLYNX Kinase InhibitorHuman epidermal growth factor receptor 2
(HER2)-positive breast cancer
Niraparib ZEJULAPoly ADP-ribose polymerase
(PARP) inhibitorOvarian, fallopian tube or primary peritoneal
cancer
Brigatinib ALUNBRIG Kinase InhibitorAnaplastic lymphoma kinase (ALK)-positive
metastatic non-small cell lung cancer (NSCLC)
9

Anti-infective Agents (N = 8)
Active Ingredient Trade Name Therapeutic Class Indications
Delafloxacin BAXDELA AntibacterialsAcute bacterial skin and skin structure
infections (ABSSSI)
Meropenem/vaborbactam VABOMERE Antibacterials Complicated urinary tract infections
Ozenoxaxin XEPI Antibacterials Impetigo
Secnidazole SOLOSEC Antibacterials Bacterial vaginosis
Glecaprevir/pibentasvir MAVYRET Antivirals Hepatitis C virus (HCV)
Sofosbuvir/ velpatasvir/voxilaprevir
VOSEVI Antivirals Hepatitis C virus (HCV)
Letermovir PREVYMIS Antivirals Cytomegalovirus (CMV)
Benznidazole BENZNIDAZOLE Antiparasitics Chagas disease
10

Therapeutic Classes for Drugs 2013-2016 (N = 103)
Yu. et al. (2018) Drug Metab Dispos. 46 (6): 835-845
27%
20%
16% 16%
7% 7% 7%
2%
0
2
4
6
8
10
12
14
16
Can
cer
trea
tmen
ts
Anti
vir
als
Car
dio
vas
cula
r
dru
gs
CN
S a
gen
ts
Gas
tro
inte
stin
al
agen
ts
Met
abo
lism
disorder/endoc…
Res
pir
ato
ry
agen
ts
Anti
fung
als
Nu
mb
er o
f N
ME
s
30%
24%
15%
9%7% 7%
4%2% 2%
02468
10121416
Can
cer
trea
tmen
ts
Anti
vir
als
CN
S A
gen
ts
Car
dio
vas
cula
r
dru
gs
Gas
tro
inte
stin
al
agen
ts
Met
abo
lism
dis
ord
er/
endocrinology…
Res
pir
ato
ry
Agen
ts
Anti
fung
als
Mu
scu
losk
elet
al
agen
ts
Nu
mb
er o
f N
ME
s
• Oncology (21%) and anti-infective (20%) are the most represented therapeutic areas
Oncology drugs (N = 22): 17 (78%) kinase inhibitors
Anti-infective drugs (N = 21): 10 antivirals, 6 antibacterials, 4 antifungals, and 1 anti-parasitic
• In clinically significant DDIs (AUC change in victim ≥ 2 or < 2 but triggering dose
recommendations), these two classes were also the most represented
30%
20%
15% 15%
10%
5% 5%
0
2
4
6
8
Anti
vir
als
Can
cer
trea
tmen
ts
CN
S a
gen
ts
Gas
tro
inte
stin
al
agen
ts
Met
abo
lism
dis
ord
er/
endo
crin
olo
gy a
gen
ts
Anti
bio
tics
Anti
fung
als
Nu
mb
er o
f N
ME
s
A B
C
Clinical inhibition, NME as substrate
11
Clinical inhibition, NME as inhibitor (C)
Clinical induction, NME as substrate

Novel Drugs in 2017 (N = 34)
12
NDA # Drug Name Active Ingredient DDI PGx PBPK208745 TRULANCE PLECANATIDE Y (in vitro)
208325 PARSABIV ETELCALCETIDE Y
208684 EMFLAZA DEFLAZACORT (prodrug) Y Y
208794 XERMELO TELOTRISTAT ETHYL (prodrug) Y
209092 KISQALI RIBOCICLIB Y Y
207145 XADAGO SAFINAMIDE Y
208854 SYMPROIC NALDEMEDINE Y Y
208447 ZEJULA NIRAPARIB Y
208082 AUSTEDO DEUTETRABENAZINE Y Y
209241 INGREZZA VALBENAZINE Y
207997 RYDAPT MIDOSTAURIN Y
208743 TYMLOS ABALOPARATIDE Y
208772 ALUNBRIG BRIGATINIB Y
209176 RADICAVA EDARAVONE Y
208610 BAXDELA DELAFLOXACIN Y Y
208383 BEVYXXA BETRIXABAN Y
208051 NERLYNX NERATINIB Y
209195 VOSEVI SOFOSBUVIR/VELPATASVIR/VOXILAPREVIR Y
209606 IDHIFA ENASIDENIB Y
209394 MAVYRET GLECAPREVIR/PIBRENTASVIR Y Y
209570 BENZNIDAZOLE BENZNIDAZOLE Y (in vitro)
209776 VABOMERE MEROPENEM/VABORBACTAM Y (in vitro)
209936 ALIQOPA COPANLISIB Y
209363 SOLOSEC SECNIDAZOLE Y
208716 VERZENIO ABEMACICLIB Y Y
210259 CALQUENCE ACALABRUTINIB Y Y
207795 VYZULTA LATANOPROSTENE BUNOD (prodrug) Y (in vitro)
209939 PREVYMIS LETERMOVIR Y Y
209637 OZEMPIC SEMAGLUTIDE Y
208945 XEPI OZENOXACIN Y (in vitro)
208254 RHOPRESSA NETARSUDIL Y (in vitro)
209803 STEGLATRO ERTUGLIFLOZIN Y Y Y
205598 MACRILEN MACIMORELIN Y (in vitro)
209360 ANGIOTENSIN II GIAPREZA Y (in vitro)

Outline
Scope of the evaluation
2017 New Drug Application (NDA) highlights: Represented therapeutic classes
Mechanistic drug-drug interaction (DDI) studieso Metabolism-based DDIs
o Transporter-mediated DDIs
o Clinical DDIs with AUC ratios ≥ 5 (for inhibition) or ≤ 0.2 (for induction)
Physiologically based pharmacokinetic (PBPK) modeling andsimulation examples
Pharmacogenetic studies
Overall conclusions
13

NMEs as Substrates of Enzymes:in vitro metabolism
• all NMEs were evaluated as substrates of specific drug-metabolizing enzymes
0
5
10
15
20
25
Nu
me
r o
f N
MEs
0
5
10
15
20
25
30
35
40
45
50
55
60
65
70
Nu
mb
er o
f N
ME
s
2013-2016 NMEs (N = 107)
Yu. et al. (2018) Drug Metab Dispos. 46 (6): 835-845
14

NMEs as Substrates of Enzymes:in vivo CYP3A inhibition studies (N = 11 NMEs with AUC ratios ≥ 1.25)
sensitive substrates
(FDA classification)
0
2
4
6
8
10
12
14
16
Max
imu
m A
UC
Rat
ios
Ketoconazole 400 mg QD 5-10 days or N/PItraconazole 200 mg QD or BID 6.5-10 daysClarithromycin 500 my BID 4 daysRitonavir 100 mg BID 14 daysVoriconazole 200 mg BID 4 days
*P-gp substrate, #BCRP substrate; N/P, not provided
15
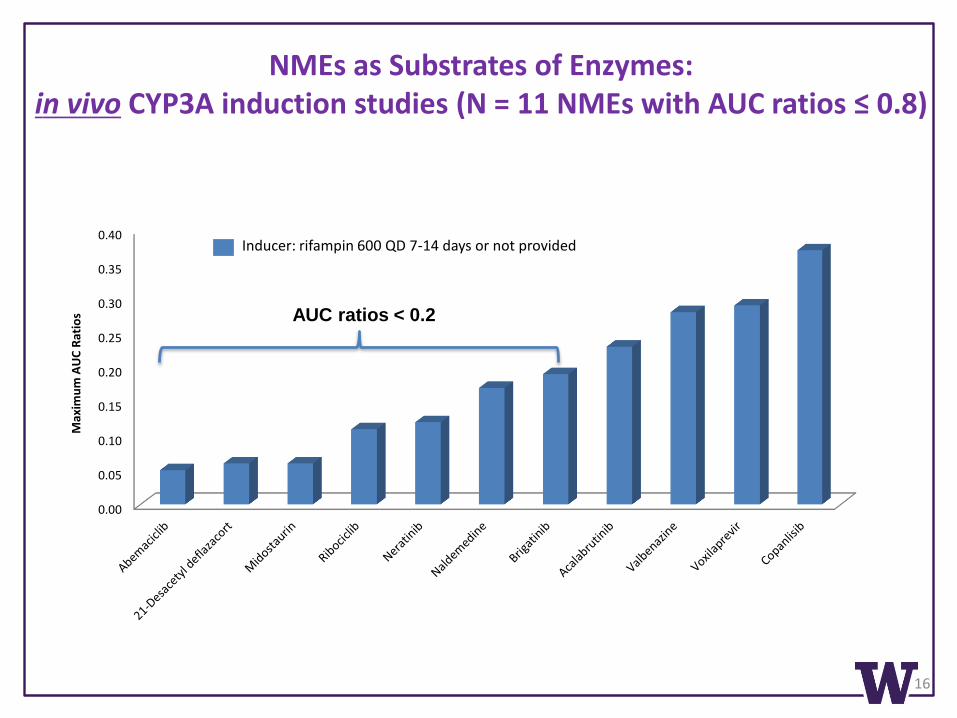
NMEs as Substrates of Enzymes:in vivo CYP3A induction studies (N = 11 NMEs with AUC ratios ≤ 0.8)
Inducer: rifampin 600 QD 7-14 days or not provided
0.00
0.05
0.10
0.15
0.20
0.25
0.30
0.35
0.40
Max
imu
m A
UC
Rat
ios
16
AUC ratios < 0.2

NMEs as Inhibitors of Enzymes:in vitro positive inhibition (N = 20 NMEs)
• 32 parents and 24 metabolites (including the active moieties of three prodrugs) were
evaluated as inhibitors of specific drug-metabolizing enzymes
• Inhibition potential on major CYPs as a post-marketing requirement (PMR)
Deflazacort (prodrug) active metabolite 6beta-hydroxydeflazocort
Telotristat ethyl (prodrug) downstream active metabolite LP-951757
0
2
4
6
8
10
12
14
16
Nu
mb
er
of
NM
Es
parent metabolite
2013-2016 NMEs (N = 107)
Yu. et al. (2018) Drug Metab Dispos. 46 (6): 835-845
17

NMEs as Inhibitors of Enzymes:In vivo positive inhibition (Max AUC ratios ≥ 1.25, N = 4)
• ~75% of the in vitro inhibitors are not considered clinically relevant
• Based on in vitro inhibition results (R > 1.1), enasidenib had possible clinical inhibitory
potency: inhibited major CYPs and UGT1A1, metabolite AGI-16903 also inhibited major
CYPs; clinical study as a PMR
Inhibitor Substrate Enzyme AUC Ratio Cmax Ratio Potency Labeling Impact
Ribociclib Midazolam CYP3A 5.20 (PBPK) 2.40 (PBPK) StrongReduce dose of sensitive CYP3A substrates with NTR
Letermovir
Midazolam CYP3A2.56-3.44 (oral)
2.48 (IV)1.83-2.10 (oral)
1.44 (IV)Moderate
Refer to the respective label for dosing of the CYP3A substrates with a moderate CYP3A inhibitor
Repaglinide CYP2C81.88 (oral) 2.47 (IV)
1.41 (oral) 1.49 (IV)
ModerateClosely monitor glucose plasma concentrations
Glecaprevir/pibentasvir
Caffeine CYP1A2 1.35 1.00 Weak None
Midazolam CYP3A 1.27 1.00 Weak None
Raltigravir UGT1A1 1.47 1.34 Weak None
Safinamide Caffeine CYP1A2 1.30 1.08 Weak None
18

NMEs as Inducers of Enzymes:in vitro positive induction (N = 16 NMEs)
• 31 parents and 15 metabolites were evaluated for induction of CYPs, phase II enzymes
(GSTs, SULTs, and UGTs), as well as regulation of nuclear receptors
• Down-regulation of major CYPs: abemaciclib and metabolites (M2 and M20)
• Induction of major CYPs as a PMR/PMC: Deflazacort (prodrug) active moiety 21-desacetyl deflazacort on major CYPs
Telotristat ethyl, its active moiety telotristat, and downstream metabolite LP-951757 (active) on
CYP1A2, CYP2B6, and UGTs
Valbenazine metabolite NBI-136110 on CYP2B6
0
2
4
6
8
10
parent metabolite
Nu
mb
er o
f N
MEs
2013-2016 NMEs (N = 107)
19

NMEs as Inducers of Enzymes:In vivo positive induction (Max AUC ratios ≤ 0.8, N = 3)
• Based on in vitro induction results, 5 other drugs with possible clinical relevance (induction or down-
regulation):
2 drugs did not show clinical induction (delafloxacin, midostaurin; marker substrate: midazolam)
2 drugs to conduct clinical trials as a PMR/PMC (brigatinib, enasidenib)
1 drug clinical evaluation is ongoing (abemaciclib)
• Majority in vitro induction is not clinically relevant
Inducer Substrate Enzyme AUC Ratio Cmax Ratio Potency Labeling Impact
Telotristat ethyl Midazolam CYP3A, UGT0.49,
0.51 (1-OH mdz)
0.74,0.66 (1-OH
mdz)Moderate
Monitor efficacy and consider dose adjustment
Letermovir VoriconazoleCYP2C19, CYP2C9
0.56 0.61 Weak
Closely monitor the plasma concentrations of drugs that are CYP2C9 and CYP2C19 substrates; adjust dose if necessary
Safinamide Midazolam CYP3A0.81,
1.42 (1-OH mdz/mdz)
0.98 Weak None
20

Outline
Scope of the evaluation
2017 New Drug Application (NDA) highlights: Represented therapeutic classes
Mechanistic Drug-drug interaction (DDI) studieso Metabolism-based DDIs
o Transporter-mediated DDIs
o Clinical DDIs with AUC ratios ≥ 5 (for inhibition) or ≤ 0.2 (for induction)
Physiologically based pharmacokinetic (PBPK) modeling andsimulation examples
Pharmacogenetic studies
Overall conclusions
21

22
2013 2014 2015 2016 2017
In vitro Transport (% of NDAs)
80% (20/25)
73% (22/30)
76% (25/33)
93% (14/15)
82% (28/34)
# of Transporter experiments
~120 (6/drug)
~450 (20/drug)
~400 (16/drug)
~310 (22/drug)
~ 590(21/drug)
# of Transporters tested
16 19 21 21 20
In vitro Metabolism(% of NDAs)
88% (22/25)
100% (30/30)
91% (30/33)
93% (14/15)
100% (34/34)
• P-gp, BCRP, and OATP1B1/3 were the most frequently tested.
• Other transporters included ASBT, BSEP, MATE1, MATE2-K, MRP1, MRP2, MRP3,
MRP4, MRP5, MRP8, NTCP, OAT1, OAT2, OAT3, OAT4, OATP1A2, OATP2B1,
OCT1, OCT2, OCT3, OCTN1, OCTN2, URAT1 (transporters in bold are
recommended for consideration by the 2017 FDA DDI guidance).
Yu et al., DMD, 2014, 2016, 2017, 2018; Dr. Lei Zhang, ASCPT Conference 2017
Transporter Studies Overview 2013-2017

NMEs as Substrates of Transporters:in vitro positive studies (N = 19 NMEs)
• Transporters: 17 were studied; 8 transporters showed negative results (MATE1,
MATE2-K, MRP2, OATP2B1, OCT1, OCT2, PEPT1, and PEPT2)
• Parent drugs: 27 (out of 35) NMEs were tested; 19 positive
• Metabolites: 14 were tested; 6 positive (including active moieties of 2 prodrugs)
0
2
4
6
8
10
12
14
16
18
P-gp BCRP OATP1B1 OATP1B3 BSEP hOATPs OAT1 OAT3 MRP4
Nu
mb
er
of
NM
Es
parent metabolite
2013-2016 NMEs (N = 107)
Yu. et al. (2018) Drug Metab Dispos. 46 (6): 835-845
23

NMEs as Substrates of Transporters:in vivo positive studies (Max AUC ratio ≥ 1.25, n = 10 NMEs)
*substrate of CYP3A (in vitro and/or in vivo); N/A, not available
**sensitive substrate of CYP3A through clinical inhibition studies with strong CYP3A inhibitors
Substrate (N = 10) PrecipitantAUC Ratio
Cmax Ratio
Transporter Possibly Affected
Labeling Impact
Inhibition DDIs
VoxilaprevirCyclosporine 9.73 14.29 OATP1B1/1B3, P-gp, BCRP Not recommended
Rifampin (SD) 7.96 8.74 OATP1B1/1B3, P-gp Contraindicated with rifampin
Glecaprevir Rifampin (SD) 8.55 6.52 OATP1B1/1B3, P-gp None (yes due to induction)
Atazanavir/ritonavir 6.53 4.05 OATP1B1/1B3, P-gp, BCRP Contraindicated with atazanavir
Acalabrutinib Itraconazole 4.96 3.90 P-gp** None (yes CYP3A)
21-Desacetyl deflazacort Clarithromycin 3.38 2.25 P-gp* None (yes CYP3A)
Betrixaban Verapamil 3.06 4.72 P-gp Reduce dose with P-gp inhibitors
Pibrentasvir Lopinavir/ritonavir 2.46 1.4 P-gp, BCRPNot recommended with lopinaviror ritonavir
Abemaciclib Verapamil 2.28 (PBPK) N/A P-gp** None
Letermovir Cyclosporine 2.10 1.48 OATP1B1/1B3 Reduce dose with cyclosporine
Naldemedine Cyclosporine 1.79 1.45 P-gp*Monitor for adverse reactions with P-gp inhibitors
Copanlisib (IV) Itraconazole 1.58 1.04 P-gp*, BCRP None (yes CYP3A)
Induction DDIs
Glecaprevir Rifampin 0.12 0.14 P-gp* Contraindicated with rifampin
Pibrentasvir Rifampin 0.17 0.21 P-gp Contraindicated with rifampin
24

NMEs as Inhibitors of Transporters: in vitro positive studies (N = 25 NMEs)
0
2
4
6
8
10
12
14
16
18
Nu
mb
er o
f N
MEs
parent metabolite
• Transporters: 19 were studied; 4 transporters showed negative results (OAT4,
OCTN2, PEPT1, and PEPT2)
• Parent drugs: 31 (out of 35) NMEs were evaluated; 25 positive
• Metabolites: 26 were evaluated; 9 positive
2013-2016 NMEs (N = 107)
Yu. et al. (2018) Drug Metab Dispos. 46 (6): 835-845
25

NMEs as Inhibitors of Transporters: P-gp: from in vitro (N = 15) to in vivo
*inhibitor of BCRP in vitro; #inhibitor of OATP1B1/3 in vitro; N/A, not available; N/T, not tested
Inhibitor (N =9) [I]1/IC50 [I]2/IC50 % BoundIn vivo
SubstrateAUC Ratio Cmax Ratio Labeling Impact
Glecaprevir*#/pibrentasvir*#
2.16 (G); 2.74 (P)
4335 (G); 11978 (P)
97.5 (G); > 99.9 (P)
Dabigatran 2.38 2.05Avoid/not recommended/adjust dose of dabigatran
Digoxin 1.48 1.72Monitor digoxin concentrationsand adjust dose of digoxin
Neratinib# 0.00001 1723 > 99 Digoxin 1.32 1.54Monitor adverse reactions of NTR P-gp substrates
Valbenazine 0.09 32 > 99 Digoxin 1.33 1.87Monitor digoxin conc./adjust dose of digoxin
Betrixaban* 0.01 61 60 Digoxin no change no change None
Letermovir*#1.66 (oral);
3.62 (IV)245 99 Digoxin 0.90 (oral) 0.78 (oral) None
Telotristat ethyl* 0.01 1739 > 99 Fexofenadine 1.14 1.11 None
Abemaciclib* 1.03 2771 96.3 N/TEffects on sensitive P-gp substrates unknown
Brigatinib* 1.42 700 66 N/TPotential to increase concentrations of P-gp substrate
Enasidenib*# > 0.1 N/A 98.5 N/T; PMRPotential to alter exposure of P-gpsubstrates
Based on [I]1/IC50 (≥ 0.1) and [I]2/IC50 (≥10) ratios, 9 drugs (including 10 NMEs) had the
potential to cause clinically relevant inhibition
26

NMEs as Inhibitors of Transporters: BCRP: from in vitro (N = 17) to in vivo
*also inhibitor of P-gp in vitro; #also inhibitor of OATP1B1/3 in vitro; ^mainly by OATP1B1/1B3; N/A, not available; N/T, not tested
Inhibitor [I]1/IC50 [I]2/IC50 % BoundIn vivo
SubstrateAUC Ratio
Cmax Ratio
Labeling Impact
Glecaprevir*#/pibentasvir*#
0.31 (G); 0.01 (P)
622 (G); 31 (P)
97.5 (G); > 99.9 (P)
Rosuvastatin^ 2.15 5.62 Reduce dose of rosuvastatin
Abemaciclib* 1.84 4935 96.3 N/TEffects on sensitive BCRP substrates unknown
Acalabrutinib < 0.1 21 97.5 N/TPotential to increase exposure of BCRP substrates
Brigatinib* 0.25 122 66 N/TPotential to increase concentrations of BCRP substrates
Enasidenib*# > 0.1 N/A 98.5 N/T; PMRPotential to alter exposure of BCRP substrates
Letermovir*#0.78 (oral);
1.70 (IV)115 99 N/T
Reduce dose of rosuvastatin and monitor for myopathy and rhabdomyolysis
Ribociclib 0.14 29.7 70 N/TMay inhibit BCRP at clinically relevant concentrations
Safinamide 0.02 15 88-89 N/T; PMRMonitor for increased pharmacologic or adverse effect of BCRP substrates
Based on [I]1/IC50 (≥ 0.1) and [I]2/IC50 (≥10) ratios, 8 drugs (including 9 NMEs) had the
potential to cause clinically relevant inhibition
27

NMEs as Inhibitors of Transporters: OATP1B1/3: from in vitro (N = 9) to in vivo
*also inhibitor of P-gp in vitro; #also inhibitor of BCRP in vitro; inhibition of CYP3A may also contribute; N/T, not tested
InhibitorOATP1B1 Cmax/IC50
OATP1B3 Cmax/IC50
% Bound In vivo VictimAUC Ratio
Cmax Ratio
Labeling Impact
Glecaprevir*#/pibentasvir*#
42 (G); 0.08 (P)
11 (G);< 0.1 (P)
97.5 (G); > 99.9 (P)
Atorvastatin^ 8.28 22.00 Not recommended
Letermovir*# 7.83 21 99 Atorvastatin^ 3.28 2.16Reduce dose of atorvastatin and monitor for myopathy and rhabdomyolysis
sofosbuvir/velpatasvir/Voxilaprevir
1.22 0.31 > 99 Pravastatin 2.13 1.95 Reduce dose of pravastatin
Enasidenib*# > 0.1 > 0.1 98.5 N/T; PMRPotential to alter exposure of OATP1B1/3 substrates
Midostaurin6.83;
R ≥ 1.250.41 > 99.8 N/T None
Based on Cmax/IC50 (≥ 0.1) and R (≥1.25) values, 5 drugs (including 6 NMEs) had the potential
to cause clinically relevant inhibition
28

Outline
Scope of the evaluation
2017 New Drug Application (NDA) highlights: Represented therapeutic classes
Mechanistic Drug-drug interaction (DDI) studieso Metabolism-based DDIs
o Transporter-mediated DDIs
o Clinical DDIs with AUC ratios ≥ 5 (for inhibition) or ≤ 0.2 (for induction)
Physiologically based pharmacokinetic (PBPK) modeling andsimulation examples
Pharmacogenetic studies
Overall conclusions
29

Most Significant Clinical Inhibitions: max AUC ratios ≥ 5
* Substrate of P-gp in vitro
Substrate InhibitorMax AUC
RatioMax Cmax
RatioEnzyme/Transporter
Possibly AffectedLabeling Impact
NME as substrate (N= 6)
Abemaciclib* Ketoconazole 15.73 (PBPK) N/P CYP3A, P-gp Avoid with ketoconazole
Midostaurin Ketoconazole 10.42 1.83 CYP3AConsider alternative therapies that do not inhibit CYP3A; monitor for adverse reactions
Voxilaprevir Cyclosporine 9.73 14.29 OATP1B1/1B3, P-gp, BCRPVOSEVI not recommended with OATP inhibitor
Glecaprevir* Rifampin 8.55 6.52 OATP1B1/1B3, P-gp(contraindicated with rifampin due to induction)
Voxilaprevir Rifampin 7.96 8.74 OATP1B1/1B3 Contraindicated with rifampin
GlecaprevirAtazanavir/
ritonavir6.53 4.05 OATP1B1/1B3, P-gp, BCRP Contraindicated with atazanavir
Neratinib* Ketoconazole 5.16 3.63 CYP3A, P-gp Avoid with strong CYP3A inhibitors
Acalabrutinib* Itraconazole 4.96 3.90 CYP3A, P-gp Avoid with strong CYP3A inhibitors
NME as inhibitor (N = 4)
AtorvastatinGlecaprevir/pibentasvir
8.28 22.00 OATP1B1/1B3, CYP3A Not recommended with atorvastatin
Rosuvastatinsofosbuvir/velpatasvir/Voxilaprevir
7.35 17.96 BCRP, OATP1B1/1B3VOSEVI not recommended with BCRP substrates
Midazolam Ribociclib 5.20 (PBPK) 2.40 (PBPK) CYP3AReduce dose of sensitive CYP3A substrates with NTR
30

Most Significant Clinical Inductions: max AUC ratio ≤ 0.2
Substrate InducerMax AUC
RatioMax Cmax
RatioEnzyme/Transporter
Possibly AffectedLabeling Impact
NME as substrate (N = 9)
Abemaciclib Rifampin 0.05 0.08 CYP3A, P-gp Avoid with strong CYP3A inducers
21-Desacetyl deflazacort
Rifampin 0.06 0.08 CYP3A, P-gp Avoid with strong CYP3A inducers
Midostaurin Rifampin 0.06 0.27 CYP3A Avoid with strong CYP3A inducers
Ribociclib Rifampin 0.11 0.19 CYP3A, P-gp Avoid with strong CYP3A inducers
Neratinib Rifampin 0.12 0.22 CYP3A, P-gp Avoid with strong CYP3A inducers
Glecaprevir Rifampin 0.12 0.14 P-gp, CYP3A Contraindicated with rifampin
Naldemedine Rifampin 0.17 0.61 CYP3A, P-gp Avoid with strong CYP3A inducers
Pibrentasvir Rifampin 0.17 0.21 P-gp Contraindicated with rifampin
Brigatinib Rifampin 0.19 0.40 CYP2C8, CYP3A, P-gp Avoid with strong CYP3A inducers
NME as inducer (no clinical DDIs with max AUC ratio ≤ 0.2)
31
Outline
Scope of the evaluation
2018 New Drug Applications (NDAs) highlights: Represented therapeutic classes
Mechanistic Drug-drug interaction (DDI) studieso Metabolism-based
o Transport-mediated
o Clinical DDIs with AUC ratios ≥ 5 (for inhibition) or ≤ 0.2 (for induction)
Physiologically based pharmacokinetic (PBPK) modeling andsimulation examples
Pharmacogenetic studies
Overall conclusions
32
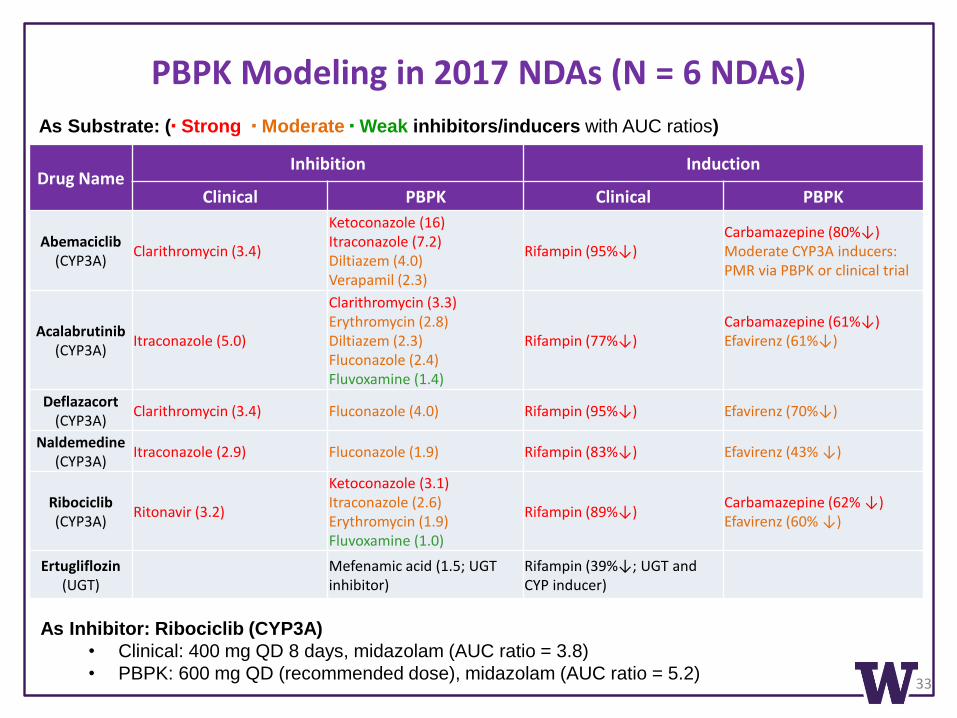
PBPK Modeling in 2017 NDAs (N = 6 NDAs)
33
Drug NameInhibition Induction
Clinical PBPK Clinical PBPK
Abemaciclib(CYP3A)
Clarithromycin (3.4)
Ketoconazole (16) Itraconazole (7.2)Diltiazem (4.0) Verapamil (2.3)
Rifampin (95%↓)Carbamazepine (80%↓)Moderate CYP3A inducers:PMR via PBPK or clinical trial
Acalabrutinib(CYP3A)
Itraconazole (5.0)
Clarithromycin (3.3) Erythromycin (2.8)Diltiazem (2.3)Fluconazole (2.4)Fluvoxamine (1.4)
Rifampin (77%↓)Carbamazepine (61%↓)Efavirenz (61%↓)
Deflazacort(CYP3A)
Clarithromycin (3.4) Fluconazole (4.0) Rifampin (95%↓) Efavirenz (70%↓)
Naldemedine(CYP3A)
Itraconazole (2.9) Fluconazole (1.9) Rifampin (83%↓) Efavirenz (43% ↓)
Ribociclib(CYP3A)
Ritonavir (3.2)
Ketoconazole (3.1)Itraconazole (2.6)Erythromycin (1.9)Fluvoxamine (1.0)
Rifampin (89%↓)Carbamazepine (62% ↓)Efavirenz (60% ↓)
Ertugliflozin(UGT)
Mefenamic acid (1.5; UGTinhibitor)
Rifampin (39%↓; UGT and CYP inducer)
As Substrate: (▪ Strong ▪ Moderate ▪ Weak inhibitors/inducers with AUC ratios)
As Inhibitor: Ribociclib (CYP3A)
• Clinical: 400 mg QD 8 days, midazolam (AUC ratio = 3.8)
• PBPK: 600 mg QD (recommended dose), midazolam (AUC ratio = 5.2)

Outline
Scope of the evaluation
2017 New Drug Application (NDA) highlights: Represented therapeutic classes
Mechanistic Drug-drug interaction (DDI) studieso Metabolism-based
o Transport-mediated
o Clinically significant DDIs
Physiologically based pharmacokinetic (PBPK) modeling andsimulation examples
Pharmacogenetic studies
Overall conclusions
34

Pharmacogenetic Studies
35
Five drugs had pharmacogenetic data related to drug metabolism and transport:
Positive effect: Deutetrabenazine
• Extensively metabolized by carbonyl reductase to two major active metabolites, alpha-
and beta-dihydrodeutetrabenazine, which were subsequently metabolized primarily by
CYP2D6
• In CYP2D6 PMs (N = 4), IMs (N = 3), EMs (N = 13), total alpha- and beta-
dihydrodeutetrabenazine exposure in PMs was > 2-fold higher than in EMs/IMs
• In a separate PK study (N = 90), total alpha- and beta-dihydrodeutetrabenazine exposure
in subjects with impaired CYP2D6 function was > 2-fold higher than in subjects with
functional CYP2D6
• Label: adjust dose in CYP2D6 PMs
No effect:
• Delafloxacin: UGT1A1, UGT2B4, UGT2B15, P-gp, BCRP variants
• Ertugliflozin: UGT1A9 variants
• Glecaprevir: OATP1B1 variants
• Letermovir: UGT1A1, OATP1B1 variants

Overall Conclusions
• A total of 46 drugs were approved by the FDA in 2017, including 34 NDAs
• All the NDAs were systemically evaluated for metabolism- and transport-mediated DDI and similar trends were observed compared with drugsapproved 2013-2016
• CYP3A was confirmed as the predominant enzyme responsible forclinically significant drug interactions involving both inhibition andinduction
• Inhibition of OATP1B1/1B3 is emerging as a significant mechanism ofDDIs, leading to large changes in exposure of victim drugs (antivirals,statins)
• In addition to clinical trials, PBPK simulations continue to develop as aclinical tool to support dose recommendations
36

UW DIDB Program Team• Scientific Team: Faculties and
Research Staff
• IT Support: Chris Kinsella
• Administrative Coordinator:
Grace Lee
Dr. Isabelle Ragueneau-Majlessi
Dr. Jingjing Yu
Dr. Tasha Ritchie
Dr. Cheryl Wu
Dr. Jessica Sontheimer
Dr. Katie Owens
Dr. Rene Levy
Dr. Catherine Yeung
Dr. Sophie Argon
Acknowledgements
Dr. Ichiko Petrie
Technology:
Chris Kinsella
37

38
THANK YOU