mechanisms maintaining reduced appetite and normoglycaemia ... · mechanisms maintaining reduced...
TRANSCRIPT
1
Mechanisms maintaining reduced appetite
and normoglycaemia after metabolic
surgery. The role of bile acids.
Dimitrios Pournaras MRCS
PhD Dissertation
Supervisors
Dr. Carel W le Roux
Professor Stephen R Bloom
May 2012

2
Table of Contents
Table of contents 2
Acknowledgements 5
Abstract 6
List of Figures 7
List of Tables 10
List of Abbreviations 11
1. Introduction
1.1 Metabolic Surgery 12
1.2 Gut hormones and bile acids 38
1.3 The interaction between metabolic surgery, gut hormones and bile acids 47
1.4 Hypothesis 65
2. Glycaemic control after metabolic surgery and the concept of diabetes
remission.
2.1 Introduction 66
2.2 Methods 67
2.3 Results 75
2.4 Discussion 88

3
3. The mechanism of action of metabolic surgery is due to gut
hormone/incretin modulation.
3.1 Introduction 93
3.2 Methods 93
3.3 Results 109
3.4 Discussion 126
4. The role of bile acids in improving glycaemic control after metabolic
surgery.
4.1 Introduction 131
4.2 Methods 131
4.3 Results 146
4.4 Discussion 159
4. Summary and conclusion 165
References 168
Appendix - Published papers 198
Obesity, gut hormones, and bariatric surgery. World J Surg 2009;33(10):1983-
8.
Remission of type 2 diabetes after gastric bypass and banding: mechanisms
and 2 year outcomes. Ann Surg 2010;252(6):966-71.

4
The gut hormone response following Roux-en-Y gastric bypass: cross-
sectional and prospective study. Obes Surg 2010;20(1):56-60.
Effect of the definition of type II diabetes remission in the evaluation of
bariatric surgery for metabolic disorders. Br J Surg 2012;99(1):100-3.
Effect of bypassing proximal gut on gut hormones involved with glycemic
control and weight loss. Surg Obes Relat Dis Surg Obes Relat Dis
2012;8(4):371-4.
The Role of Bile After Roux-en-Y Gastric Bypass in Promoting Weight Loss
and Improving Glycaemic Control. Endocrinology 2012;153(8):3613-9.

5
Acknowledgements
I am grateful to my supervisors Dr Carel W le Roux and Prof Stephen R Bloom
for their support, guidance and inspiration.
I would like to thank Mr Richard Welbourn and Mr David Mahon in the
Department of Bariatric and Metabolic Surgery, Musgrove Park Hospital,
Taunton for making the human studies possible and for their supervision and
mentorhip from a surgical point of view.
I am also grateful to Prof Julian Walters, Hammersmith Hospital and Dr Jamie
Alaghband-Zadeh, Kings College Hospital for their support in exploring the
role of bile in metabolic surgery.
I would like to thank Mr Alan Osborne and Mr Simon Hawkins, my
predecessors, who offered me insight into their studies and guided me with
the development of subsequent studies.
I am most grateful to the participants of my studies, not only for making them
possible, but also for offering me important insight into life before and after
metabolic surgery. I will cherish this knowledge in the years to come.
Finally I would like to thank my parents John and Smaragda Pournaras for
their love and support.

6
Abstract
Obesity is becoming the healthcare epidemic of this century. Weight loss surgery is
the only effective treatment for morbid obesity. Furthermore glycaemic control in
type 2 diabetic patients is improved after metabolic surgery.
Here I observed that with gastric bypass, type 2 diabetes can be improved and even
rapidly put into a state of remission irrespective of weight loss. This is achieved via
an improvement of both insulin resistance and insulin production. Reduced insulin
resistance within the first week after surgery remains unexplained, but increased
insulin production in the first week after surgery may be explained by the enhanced
postprandial GLP-1 response.
In addition, I demonstrate that bile flow changes lead to increased gut hormone
response in animal models. Roux-en-Y gastric bypass in humans causes changes
in bile flow leading to increased plasma bile acid concentrations. This phenomenon
may explain the improved glycaemic control following gastric bypass.
In conclusion I investigated the mechanism of diabetes remission after metabolic
surgery and explored the role of gut hormones and bile acids in the changes in
glucose homeostasis following metabolic surgery.

7
List of figures
Figure 1. Weight loss over time for gastric bypass (n = 22) and gastric banding (n =
12) patients over a 3 year period.
Figure 2. Kaplan-Meier curve for time to remission of type 2 diabetes in patients who
had gastric bypass (solid line) or gastric banding (broken line) over a 3 year period.
Figure 3. Correlation between % weight loss and HbA1c improvement after gastric
bypass. Pearson r=0.3196, 95% confidence interval -0.1180 to 0.6532, p=0.1471.
Figure 4. Diabetes remission for gastric bypass, sleeve gastrectomy and gastric
banding with the new American Diabetes Association definition and the previous
definition.
Figure 5: Glucose route after oral (black arrows) and after gastrostomy load (empty
arrows).
Figure 6. Visual Analogue Scales for hunger and satiety.
Figure 7: Plasma levels of (a) glucose, (b) insulin, (c) GLP-1 and (d) PYY following
oral (black circles) and gastrostomy (open circles) glucose load.
Figure 8. Insulin resistance measure with HOMA in patients with type 2 diabetes
following a 1000 kcal diet with no surgery over 7 days (n=15) and gastric band (n=9),
gastric bypass (n=17) and patients without diabetes following gastric bypass (n=5)
over a period of 42 days.
Figure 9. Delta insulin defined as the difference between fasting and 15 min
postprandial insulin after gastric bypass in patients with type 2 diabetes (n=17) and
without type 2 diabetes (n=5).

8
Figure 10. Postprandial GLP-1 response after a 400 kcal meal following gastric
bypass in patients with type 2 diabetes (n=17) and without type 2 diabetes (n=5).
Figure 11. BMI before and 12, 18 and 24 months after gastric bypass.
Figure 12. The PYY postprandial response in the cross-sectional study (12, 18 and
24 months).
Figure 13. The PYY postprandial response in the prospective study (18-24 months).
Figure 14. The GLP-1 response in the cross-sectional study (12, 18 and 24 months).
Figure 15. The GLP-1 postprandial response in the prospective study (18-24
months).
Figure 16. Satiety as measured with the VAS in the prospective study.
Figure 17. Illustration of the anatomy of the canine experiment showing the
canulation.
Figure 18. Illustration of the functional anatomy of the bile in ileum group.
Figure 19. Fasting plasma FGF19 concentrations (median and interquartile ranges)
at day 0, 4 and 42 in six gastric banding patients (white bars) and twelve gastric
bypass patients (black bars).
Figure 20. Fasting total plasma bile acid concentrations at day 0, 4 and 42 in seven
gastric banding patients (white bars) and twelve gastric bypass patients (black bars).
Figure 21. The shows the area under the curve (AUC) for the postprandial GLP-1
response after 400 g of food in dogs pre-operatively or postoperatively either
receiving food alone without bile (Food), bile alone without food (Bile) or food and
bile in combination (Food+Bile).

9
Figure 22. The shows the area under the curve (AUC) for the postprandial PYY
response after 400 g of food in dogs pre-operatively or postoperatively either
receiving food alone without bile (Food), bile alone without food (Bile) or food and
bile in combination (Food+Bile).
Figure 23. Plasma GLP-1 levels in rats with bile draining into their duodenum or bile
draining into their ileum.
Figure 24. Plasma PYY levels in rats with bile draining into their duodenum or bile
draining into their ileum.
Figure 25. The weight of rats in bile in duodenum (solid line) and bile in ileum
(broken line) groups before and 28 days after surgery.
Figure 26. Food intake of bile in duodenum (solid line) and bile in ileum (broken line)
rats before and 28 days after surgery.

10
List of tables
Table 1. The Edmonton obesity staging system (Sharma and Kushner 2009).
Table 2. The King’s criteria (Aylwin and Al-Zaman 2008) are summarised.
Table 3: Summary of gut hormone changes after RYGB (Pournaras and le Roux
2010).
Table 4. Protocol used for band adjustments from Favretti, O'Brien, Dixon 2002).
Table 5. Study 1: Patient characteristics presented as Mean (standard deviation)
except where the median (range) is indicated.
Table 6. Patient characteristics and type 2 diabetes remission rates 23 months
(range 12-75) postoperatively.
Table 7: List of complications leading to inability to feed with the enteral route.
Table 8: Two-way ANOVA values comparing oral and gastrostomy tube glucose load
as a function of group and time for glucose, insulin, insulin, GLP-1 and PYY plasma
levels following oral and gastrostomy tube glucose load as a function of group and
time.
Table 9. Demographic characteristics of patients undergoing standard meal tests
pre-operatively and at day 2, 4, 7 and 42. Comparisons were made between
patients with diabetes (DM) who had very low calorie diet, gastric banding, gastric
bypass or patients who did not have diabetes but underwent gastric bypass.
Table 10: Demographic characteristics of patients in cross-sectional study and
prospective study.

11
List of Abbreviations
ANOVA Analysis of Variance
AUC Area Under the Curve
BMI Body Mass Index
CCK Cholecystokinin
CPAP Conitnous Positive Airway Pressure
EDTA Ethylenediaminetetraacetic acid
FGF19 Fibroblast Growth Factor 19
GIP Glucose-dependent Insulinotropic Polypeptide
GLP-1 Glucagon-Like Peptide-1
HOMA-IR Homeostatic Model Assessment-Insulin Resistance
NASH Nonlcoholic Steatohepatitis
OXM Oxyntomodulin
PCOS Polycystic Ovary Syndrome
PP Pancreatic Polypeptide
PYY Peptide YY
SEM Standard error of the mean
VAS Visual Analogue Scales

12
1. Introduction
1.1 Metabolic surgery
Introduction
Weight loss surgery is now recognised as the most effective long term treatment for
morbid obesity (Sjostrom et al 2007). The effect of these procedures is not restricted
to sustained weight loss. Improvement in obesity related comorbidity may represent
a more important effect than weight loss itself. The Diabetes Surgery Summit in
Rome in 2007 suggested the use of the term “metabolic surgery” to reflect profound
effect of weight loss procedures on the metabolic syndrome. This concept is gaining
acceptance as evidenced by the number of scientific societies worldwide which
include the word metabolic in their title. Of note is that the British Obesity and
Metabolic Surgery Society, the American Society for Metabolic and Bariatric Surgery
and the International Federation for the Surgery of Obesity and Metabolic Disorders
have also changed its name to reflect this.
Obesity Staging, the Edmonton obesity staging system (EOSS)
Body Mass Index (BMI) is used as the main criterion for qualifying for weight loss
surgery. The National Institute for Health and Clinical Excellence in the UK, as well
as the National Institute of Health in the United Sates of America, recommend weight
loss surgery in adults with BMI of 40 kg/m2 and above or BMI between 35 kg/m2 and
40 kg/m2 with obesity related co-morbidity (The National Institute of Clinical
Excellence, 2006; Gastrointestinal Surgery for Severe Obesity. NIH Consensus
Statement Online 1991 Mar 25-27). However it is recognised that BMI is associated

13
with a number of limitations (Hu 2007). Sharma et al proposed a novel clinical
staging system, the Edmonton obesity staging system which scores obese
individuals on a 5-point ordinal scale and takes into account severity of co-
morbidities and functional status (Sharma and Kushner 2009). The objective was to
provide a simple framework to aid decision making in clinical practice (Sharma and
Kushner 2009).
The ability of the Edmonton obesity staging system to predict mortality was
examined in a nationally representative US sample by Padwal et al (Padwal,
Pajewski, Allison and Sharma 2011). Data from the National Health and Human
Nutrition Examination Surveys (NHANES) III 1988–1994 and the NHANES 1999–
2004, with mortality data up to the end of 2006 were used (Padwal, Pajewski, Allison
and Sharma 2011). Overweight or obese individuals aged 20 or older who had been
randomized to the morning session at the mobile examination centre were scored
according to the Edmonton obesity staging system (Padwal, Pajewski, Allison and
Sharma 2011). The analysis was retrospective. Individuals with class III obesity
following adjustment for metabolic syndrome or hypertriglyceridemic waist (this was
defined as waist circumference ≥ 90 cm and a triglyceride levels ≥ 2 mmol/L for men;
waist circumference ≥ 85 cm and triglyceride levels ≥ 1.5 mmol/L for women) had
similar mortality risk compared to class II obese individuals (Padwal, Pajewski,
Allison and Sharma 2011). In contrast individuals with Edmonton obesity staging
system score of 2 or 3 had a 4 to 12-fold greater hazard ratio compared to
individuals with Edmonton obesity staging system score of 0 or 1 (Padwal, Pajewski,
Allison and Sharma 2011).

14
It has been suggested that the Edmonton obesity staging system may have a role in
patient selection for weight loss surgery (Gill, Karmali and Sharma 2011). However
it is important to note that this score has not been prospectively validated yet for use
in this population.

15
Table 1. The Edmonton obesity staging system (Sharma and Kushner 2009).
Stage Description Management
0 No apparent obesity-related risk
factors (e.g., blood pressure, serum
lipids, fasting glucose, etc. within
normal range), no physical symptoms,
no psychopathology, no functional
limitations and/or impairment of well
being
Identification of factors
contributing to increased body
weight. Counselling to prevent
further weight gain through
lifestyle measures including
healthy eating and increased
physical activity.
1 Presence of obesity-related subclinical
risk factors (e.g., borderline
hypertension, impaired fasting glucose,
elevated liver enzymes, etc.), mild
physical symptoms (e.g., dyspnoea on
moderate exertion, occasional aches
and pains, fatigue, etc.), mild
psychopathology, mild functional
limitations and/or mild impairment of
well being
Investigation for other (non-weight
related) contributors to risk
factors. More intense lifestyle
interventions, including diet and
exercise to prevent further weight
gain. Monitoring of risk factors and
health status.
2 Presence of established obesity-
related chronic disease (e.g.,
hypertension, type 2 diabetes, sleep
apnoea, osteoarthritis, reflux disease,
Initiation of obesity treatments
including considerations of all
behavioural, pharmacological and
surgical treatment options. Close

16
polycystic ovary syndrome, anxiety
disorder, etc.), moderate limitations in
activities of daily living and/or well
being
monitoring and management of
comorbidities as indicated.
3 Established end-organ damage such
as myocardial infarction, heart failure,
diabetic complications, incapacitating
osteoarthritis, significant
psychopathology, significant functional
limitations and/or impairment of well
being
More intensive obesity treatment
including consideration of all
behavioural, pharmacological and
surgical treatment options.
Aggressive management of
comorbidities as indicated.
4 Severe (potentially end-stage)
disabilities from obesity-related chronic
diseases, severe disabling
psychopathology, severe functional
limitations and/or severe impairment of
well being
Aggressive obesity management
as deemed feasible. Palliative
measures including pain
management, occupational
therapy and psychosocial support.

17
The King’s College criteria
Aylwin et al have proposed a score with the objective to stratify obesity in a weight-
independent manner but focusing on the disease burden, in other words moving
away from morbid obesity and focusing on obese morbidity (Aylwin and Al-Zaman
2008). The criteria can be seen on table 2.

18
Table 2. The King’s criteria (Aylwin and Al-Zaman 2008) are summarised
below:
Stage 0 Stage 1 Stage 2 Stage 3
Airway Normal snoring Require CPAP Cor pulmonale
BMI <35 35-40 40-50 >50
Cardiovascular <10% risk 10-20% risk Heart disease Heart failure
Diabetes Normal Impaired
fasting
glycaemia
Type 2
diabetes
Uncontrolled
type 2 diabetes
Economic Normal Suffered
discrimination
Unemployed
due to obesity
Requires
financial
support
Functional Can manage 3
flights of stairs
Manage 1 or 2
flights of stairs
Requires
walking aids or
wheel chair
House bound
Gonadal Normal PCOS Infertility Sexual
dysfunction
Health status Normal Low mood or
QoL
Depression or
poor QoL
Severe
depression
Image Normal Does not like Body image Eating disorder

19
body dysphoria
Junction
gastro-
oesophagus
Normal Heart burn Oesophagitis Barrett’s
Oesophagus
Kidney Normal proteinuria GFR<60ml/min GFR<30ml/min
Liver Normal Raised GGT NASH Liver failure

20
The criteria were modified and the score was used on patients undergoing weight
loss surgery in a study by Aasheim et al (Aasheim, Aylwin, Radhakrishnan, Sood,
Jovanovic, Olbers and le Roux 2011). Inter-observer reliability was assessed with
eleven clinicians (six physicians, two surgeons, two medical students and one nurse
specialist; of these, four physicians, one surgeon, one student and one nurse had
previous experience with the modified King’s Criteria) scored the same 12 individuals
(Aasheim, Aylwin, Radhakrishnan, Sood, Jovanovic, Olbers and le Roux 2011).
Different assessors assigned mostly similar scores for the same individual (Aasheim,
Aylwin, Radhakrishnan, Sood, Jovanovic, Olbers and le Roux 2011). However there
was high variability between assessors for some domains with Body Image being the
one with the worst observer consistency (Aasheim, Aylwin, Radhakrishnan, Sood,
Jovanovic, Olbers and le Roux 2011).
Aasheim et al demonstrated that according to the modified King’s Criteria patients
undergoing weight loss and metabolic surgery experienced improvement in their
health postoperatively (Aasheim, Aylwin, Radhakrishnan, Sood, Jovanovic, Olbers
and le Roux 2011). The authors suggested that in the clinical setting the modified
King’s Criteria added structure to a patient-centred clinical interaction. More
importantly this work highlighted the need to focus on outcomes of metabolic surgery
other than weight loss itself (Aasheim, Aylwin, Radhakrishnan, Sood, Jovanovic,
Olbers and le Roux 2011).

21
The King’s criteria are a useful tool for the risk stratification of patients preoperatively
but also postoperatively with the comprehensive documentation of risk and the
potential increase or decrease following surgery (le Roux and Pournaras 2010a).
They will be used in this thesis as a roadmap presenting the benefit of surgery for
patients, focusing on co-morbidity and functional improvement rather than weight
loss (le Roux and Pournaras 2010).
Airway
Obstructive Sleep Apnoea is common in the obese population and in patient
undergoing weight loss surgery in particular. In the Longitudinal Assessment of
Bariatric Surgery study obstructive sleep apnoea was detected in 48.9% of the
population consisting of 4776 consecutive individuals undergoing primary weight loss
surgery (Flum et al 2009). Furthermore obstructive sleep apnoea was associated
with a significantly higher incidence of adverse effects perioperatively (Flum et al
2009).
In a 2004 meta-analysis, 85.7% of patients achieved resolution of obstructive sleep
apnoea (Buchwald, Avidor, Braunwald, Jensen, Pories, Fahrbach and Schoelles
2004). A more recent meta-analysis confirmed that weight loss surgery significantly
reduced the apnoea-hypopnoea index (Greenburg, Lettieri and Eliasson 2009). In
the same study the levels of the index recorded suggested moderately severe
obstructive sleep apnoea postoperatively (Greenburg, Lettieri and Eliasson 2009).

22
Therefore patients should be informed during the consent process that obstructive
sleep apnoea may persist postoperatively (Greenburg, Lettieri and Eliasson 2009).
Body mass Index (BMI)
In Buchwald’s landmark meta-analysis the mean percentage of excess weight loss at
the time point the status of comorbidity was assessed was 47.5% for gastric
banding, 61.6% for gastric bypass, 68.2% for gastroplasty, and 70.1% for
biliopancreatic diversion or duodenal switch (Buchwald, Avidor, Braunwald, Jensen,
Pories, Fahrbach and Schoelles 2004). The Swedish Obese Subjects study
provides the best available comparison of weight loss between weight loss surgery
and non-surgical management of obesity in the long term (Sjostrom et al 2007). In
the three surgical groups the total body weight loss was 25% ten years after gastric
bypass, 16% after vertical-banded gastroplasty, and 14% after banding (Sjostrom et
al 2007). In the non-surgical group weight remained within ±2% during the ten year
period (Sjostrom et al 2007).
Cardiovascular
Weight loss is known to reduce cardiovascular risk. However, metabolic surgery is
associated with improvement in cardiac function and the reversal of obesity related
cardiomyopathy (Ashrafian, le Roux, Darzi and Athanasiou 2008). Improved cardiac
function, ventricular remodelling and atherosclerotic load have also been
demonstrated (Ashrafian, le Roux, Darzi and Athanasiou 2008).

23
Diabetes
The effect of metabolic surgery on glucose metabolism is the subject of this thesis
and will be described in detail in subsequent chapters.
Economic
The cost-effectiveness of metabolic surgical procedures for the health care systems
will be described further in a separate section. The benefit specifically to recipients
of metabolic surgery has been shown in this study by Hawkins et al using data from
Somerset, UK (Hawkins, Osborne, Finlay, Alagaratnam, Edmond and Welbourn
2007). They demonstrated that the number of individuals receiving income from
work was increased postoperatively (Hawkins, Osborne, Finlay, Alagaratnam,
Edmond and Welbourn 2007). The same group also showed that the number of
hours worked was also increased and there was a reduction in state benefits claims
postoperatively (Hawkins, Osborne, Finlay, Alagaratnam, Edmond and Welbourn
2007).
Functional
Obesity is associated with poor function, physical illness and disability (Weil,
Wachterman, McCarthy, Davis, O'Day, Iezzoni and Wee 2002; Ferraro and Booth
1999). Bergkvist et al studied populations of patients attending an orthopaedic
department in both the emergency and the elective/chronic setting (Bergkvist,
24
Hekmat, Svensson and Dahlberg 2009). Significant relationships between obesity
and common orthopaedic conditions were demonstrated (Bergkvist, Hekmat,
Svensson and Dahlberg 2009).
Miller et al conducted a longitudinal, observational study of 28 morbidly obese
individuals followed for 12 months after laparoscopic gastric bypass using the
Fitness Arthritis and Seniors Trial disability questionnaire for the estimation of
physical function, the Short Physical Performance Battery and a lateral mobility task
to assess performance tasks and maximal isometric knee torque for measurement of
strength (Miller, Nicklas, You and Fernandez 2009). An increase in mobility and
improvement in the performance of daily activities was demonstrated as early as
three weeks postoperatively (Miller, Nicklas, You and Fernandez 2009).
De Souza et al used the 6-minute walk test in a group of 51 patients undergoing
weight loss surgery (de Souza, Faintuch, Fabris, Nampo, Luz, Fabio, Sitta and de
Batista Fonseca IC 2009). The test was performed preoperatively and seven to
twelve months postoperatively and a significant improvement was reported. (de
Souza, Faintuch, Fabris, Nampo, Luz, Fabio, Sitta and de Batista Fonseca IC 2009).
Gonadal
In a report from six centres participating in the Longitudinal Assessment of Bariatric
Surgery-2 study a prevalence of polycystic ovary syndrome (PCOS) of 13.1% was

25
recorded (Gosman, King, Schrope, Steffen, Strain, Courcoulas, Flum, Pender and
Simhan 2010). Furthermore 41.9% experienced infertility and 61.4% had a live birth
with a previous history of infertility (Gosman, King, Schrope, Steffen, Strain,
Courcoulas, Flum, Pender and Simhan 2010). In another study of 24 women with
PCOS undergoing gastric bypass, a significant improvement of PCOS symptoms
postoperatively was reported (Eid, Cottam, Velcu, Mattar, Korytkowski, Gosman,
Hindi and Schauer 2005).
I have recently shown that 23 out 149 (15.4%) consecutive women of child bearing
age (18-45 years old) undergoing weight loss surgery at Musgrove Park Hospital,
Taunton were diagnosed with PCOS (Pournaras, Manning, Bidgood, Fender, Mahon
and Welbourn 2010). Furthermore in the same population, for 11 of 149 (7.4%)
women of childbearing age, subfertility was the main reason for undergoing weight
loss surgery (Pournaras, Manning, Bidgood, Fender, Mahon and Welbourn 2010).
It is well documented that maternal obesity is associated with a higher risk for both
mother and fetus (Gross, Sokol and King 1980; Morin 1998). A recent systematic
review suggests that the risk of maternal complications, such as gestational diabetes
and preeclampsia, as well as neonatal complications, such as premature delivery
and low birth weight, are lower following weight loss surgery compared to obese
individuals (Maggard 2008).

26
A study from George Fileding’s unit demonstrated that gastric banding is safe and
well-tolerated during pregnancy with a lower incidence of gestational diabetes and
maternal hypertension (Skull, Slater, Duncombe and Fielding 2004).
Focusing on male fertility Shayeb et al studied 2035 men presenting to a fertility
clinic and demonstrated that obese men were more likely to have lower semen
volume and fewer morphologically normal spermatozoa than non-obese men
(Shayeb, Harrild, Mathers and Bhattacharya 2011). These findings are consistent
with another study showing obesity is associated with a higher risk of low sperm
quality (Hammoud, Wilde, Gibson, Parks, Carrell and Meikle 2008). The effects of
surgically induced weight loss on male fertility remain largely unknown.
Health status perceived
In the Swedish Obese Subjects study, health related quality of life improved
significantly after weight loss surgery but not in the control group (Karlsson, Sjöström
and Sullivan 1998). Using the Short Form-36 (SF-36) O’Brien et al demonstrated in
a randomised controlled trial comparing of gastric banding versus conservative
management in patients with a BMI of 30-35, that quality of life improved significantly
after gastric banding in all domains of the SF-36 (O'Brien et al 2006). The above
results are consistent with another prospective study comparing patients undergoing
gastric bypass surgery with two control groups; patients who requested but did not
undergo surgery and obese individuals (Kolotkin, Crosby, Gress, Hunt and Adams

27
2009). Health related quality of life was improved in the surgical group compared to
the controls groups (Kolotkin, Crosby, Gress, Hunt SC and Adams 2009)
Image of body
The Melbourne group demonstrated that super-obese patients undergoing gastric
banding surgery have reduced evaluation of appearance preoperatively which is
improved with weight loss after surgery (Dixon, Dixon and O'Brien 2002). They also
showed an associated psychological benefit with this improvement (Dixon, Dixon
and O'Brien 2002). In the SOS study, a small effect of surgery on social interaction
was reported as measured by health-related limitations in social interaction within the
family, among friends and in the community (Karlsson, Taft, Rydén, Sjöström and
Sullivan 2007). This was only present on patients who achieved a 10% weight loss
or more (Karlsson, Taft, Rydén, Sjöström and Sullivan 2007). An improvement in the
scores of patients on body image dissatisfaction subscale three years after
biliopancreatic diversion has been also reported (Adami, Gandolfo, Campostano,
Meneghelli, Ravera and Scopinaro 1998)
It has to be noted that individuals may face significant morbidity due to the severe
change in body image and this needs to be accounted for, and aggressively treated
appropriately. The cosmetic outcomes of weight loss surgery may be very poor.
These interventions are not cosmetic surgery. A new field, post-bariatric body
contouring surgery is emerging as a subspecialty of plastic surgery with the objective

28
to address specific cosmetic and occasionally functional issues amenable to plastic
surgical interventions.
Junction gastro-oesophagus (gastro-oesophageal reflux disease)
A meta-analysis demonstrated that obesity is associated with a higher risk of gastro-
oesophageal reflux symptoms, erosive oesophagitis, and oesophageal
adenocarcinoma (Hampel, Abraham and El-Serag 2005). The same study showed a
trend for progressive increase of the above with increasing weight (Hampel,
Abraham and El-Serag 2005).
Gastric bypass surgery leads to the improvement of gastro-oesophageal reflux
symptoms and oesophageal exposure to acid (Mejía-Rivas, Herrera-López,
Hernández-Calleros, Herrera and Valdovinos 2008). This is to be expected
considering that these procedures were initially designed for peptic ulcer disease in
the era prior to pharmacological treatment.
In a study of 100 patients, 73% were reported to have gastro-oesophageal reflux
symptoms (Merrouche, Sabaté, Jouet, Harnois, Scaringi, Coffin and Msika 2007).
The different effects of gastric bypass and gastric banding on oesophageal function
were demonstrated, with worsening of pH-metric data and occasional severe
dyskinesia after gastric banding Merrouche, Sabaté, Jouet, Harnois, Scaringi, Coffin
29
and Msika 2007). Suter et al also demonstrated that postoperative oesophageal
dysmotility and gastrooesophageal reflux are not uncommon after gastric banding
suggesting routine preoperative evaluation (Suter, Dorta, Giusti and Calmes 2005).
Low amplitude of contraction in the lower oesophagus and increased oesophageal
acid exposure should be regarded as contraindications to gastric banding and
patients with such findings should be offered an alternative weight loss surgical
procedure (Suter, Dorta, Giusti and Calmes 2005). George Fielding’s group propose
the addition of routine repair of a hiatus hernia during gastric band placement when
indicated as it significantly reduces the reoperation rate due to gastric prolapse and
pouch dilatation (Gulkarov, Wetterau, Ren and Fielding 2008).
Kidney
Obesity is a risk factor for the progression of chronic kidney disease and a
systematic review demonstrated that weight loss is associated with decreased
proteinuria and microalbuminuria (Afshinnia, Wilt, Duval, Esmaeili and Ibrahim
2010). There were no available data regarding the durability of this decrease and
the effect of weight loss on chronic kidney disease (Afshinnia, Wilt, Duval, Esmaeili
and Ibrahim 2010).
A report of a patient with end-stage renal disease who experienced dramatic
improvement of renal function after gastric bypass surgery, obviating the need for
dialysis and transplantation has led to increased interest in this renal effect of weight
loss surgery (Tafti, Haghdoost, Alvarez, Curet and Melcher 2009). Navarro-Dıaz et

30
al studied 61 obese patients undergoing weight loss surgery (Navarro-Díaz, Serra,
Romero, Bonet, Bayés, Homs, Pérez and Bonal 2006). All renal parameters
improved in the first 12 months postoperatively when the majority of weight loss
occurred (Navarro-Díaz, Serra, Romero, Bonet, Bayés, Homs, Pérez and Bonal
2006). However, 24-h albuminuria still improved during the second year of follow-up
(Navarro-Díaz, Serra, Romero, Bonet, Bayés, Homs, Pérez and Bonal 2006). The
authors suggested that this decrease in 24-h albuminuria may not be related to
glomerular filtration rate but possibly due to the decrease in BMI and the
improvement of other metabolic factors (Navarro-Díaz, Serra, Romero, Bonet,
Bayés, Homs, Pérez and Bonal 2006).
Liver
Non-alcoholic fatty liver disease (NAFLD) is a spectrum ranging from fatty liver,
followed by non-alcoholic steatohepatitis (NASH) and the more severe form being
cirrhosis and progress to hepatocellular carcinoma or liver failure (Kim and Younossi
2008). Non-alcoholic fatty liver disease has become the most common form of liver
disease (Kim and Younossi 2008).
NAFLD and NASH appear to improve or completely resolve in the majority of
patients after weight loss surgery (Mummadi, Kasturi, Chennareddygari and Sood
2008; Mathurin et al 2009).

31
Metabolic surgery and cancer
The effect of weight loss surgery on cancer incidence is not part of any scoring
system of obesity (such as the Edmonton obesity staging system or the King’s
College criteria). However it is an effect of weight loss surgery which has been
described and well documented. A recent systematic review and meta-analysis of
prospective observational studies confirmed that increased BMI is associated with
increased risk of common and less common cancers (Renehan, Tyson, Egger,
Heller and Zwahlen 2008). In men, a 5 kg/m2 increase in BMI was associated with
oesophageal adenocarcinoma, thyroid cancer, colonic cancer and renal cancer. In
women, a 5 kg/m2 increase in BMI was associated with endometrial cancer,
gallbladder cancer, oesophageal adenocarcinoma and renal cancer (Renehan,
Tyson, Egger, Heller and Zwahlen 2008). Furthermore weaker positive associations
were recorded between increased BMI and rectal cancer and malignant melanoma
in men; postmenopausal breast, pancreatic, thyroid, and colon cancers in women;
and leukaemia, multiple myeloma, and non-Hodgkin lymphoma in both sexes
(Renehan, Tyson, Egger, Heller and Zwahlen 2008) .
Adams et al demonstrated that all cause mortality after gastric bypass surgery was
significantly reduced when compared with obese controls (Adams, Gress, Smith,
Halverson, Simper, Rosamond, Lamonte, Stroup and Hunt 2007). This was a study
comparing 7925 patients undergoing gastric bypass surgery and 7925 obese
individuals applying for a driver's license in Utah matched for age, sex, and BMI
(Adams, Gress, Smith, Halverson, Simper, Rosamond, Lamonte, Stroup and Hunt

32
2007). Cancer specific mortality was reduced by 60% (Adams, Gress, Smith,
Halverson, Simper, Rosamond, Lamonte, Stroup and Hunt 2007).
Adams et al investigated this effect further in another study by using cancer
incidence and mortality data through 2007 from the Utah Cancer Registry (Adams,
Stroup, Gress, Adams, Calle, Smith, Halverson, Simper, Hopkins and Hunt 2009).
They compared 6,596 Utah patients who had gastric bypass in Utah and 9,442
severely obese individuals applying for a Utah Driver’s License (Adams, Stroup,
Gress, Adams, Calle, Smith, Halverson, Simper, Hopkins and Hunt 2009). The
follow-up was in excess of 24 years with a mean of 12.5 years (Adams, Stroup,
Gress, Adams, Calle, Smith, Halverson, Simper, Hopkins and Hunt 2009). Total
cancer incidence was significantly lower in the surgical group with a hazard ratio of
0.76 (Adams, Stroup, Gress, Adams, Calle, Smith, Halverson, Simper, Hopkins and
Hunt 2009). Cancer specific mortality was decreased in patients undergoing gastric
bypass surgery with a hazard ratio of 0.54 (Adams, Stroup, Gress, Adams, Calle,
Smith, Halverson, Simper, Hopkins and Hunt 2009). An intriguing finding of this
study was that reduced mortality was observed for all cancers, not only the obesity
related ones (Adams, Stroup, Gress, Adams, Calle, Smith, Halverson, Simper,
Hopkins and Hunt 2009).
In the same issue of the New England Journal of Medicine in which Adams study
was published, the Swedish Obese Subject study trial reported that weight loss
surgery is associated with long-term weight loss and decreased overall mortality

33
(Sjöström et al 2007). Sjostrom et al intended to perform a randomised control trial
comparing weight loss surgery with best medical treatment. However the study was
not approved by the Ethics Committee due to the high risk associated with weight
loss surgery. The fact that a similar trial is currently considered not ethical due to the
high risk associated with non-surgical treatment following the reported outcomes of
the SOS trial highlights the unique contribution of this study in the field. The study
performed was a prospective, matched control trial including 4047 obese subjects;
2010 undergoing weight loss surgery and 2037 undergoing conventional treatment,
recruited over a 13.4-year period and follow-up for a mean of 10.9±3.5 years
(Sjöström et al 2007). The follow-up in terms of vital status was complete for
participants with exception of three, achieving an impressive rate of 99.9% (Sjöström
et al 2007). Two participants were deleted from the records upon their request and
one withdrew from the study and subsequently obtained an unlisted social security
number (Sjöström et al 2007). In the weight loss surgery group 101 deaths were
recorded compared to 129 deaths in the control group with an unadjusted overall
hazard ratio of 0.76 and with the most common cause of death myocardial infarction
and cancer (Sjöström et al 2007).
A report on cancer incidence in the SOS trial was published in 2009 (Sjöström et al
2009). In the weight loss surgery group 117 cancers were detected compared 169 in
the control group with a hazard ratio 0.67 (Sjöström et al 2009). In females
incidence of cancer was lower in the surgical group compared to the control group,
but there was no difference in males (Sjöström et al 2009). However the number of
male participants was lower (Sjöström et al 2009).

34
Weight loss surgery is associated with a protective effect on cancer, although the
mechanism of this interaction remains to be elucidated. Abdominal obesity is linked
to alterations in insulin and the insulin-like growth factor-1 (IGF-1), sex steroids and
adipokines (Sjöström et al 2009; Renehan, Frystyk and Flyvbjerg 2006; Key,
Appleby, Reeves, Roddam et al 2003; Barb, Williams, Neuwirth and Mantzoros
2007). In the SOS study baseline sagittal trunk diameter came out as a strong
multiple cancer predictor. In contrast weight and BMI did not. More importantly
these findings highlight the fact the favourable effect of metabolic surgery is
extended well beyond weight loss.
Cost effectiveness
Although the effect of metabolic surgery on comorbidity is slowly recognised by the
scientific community there is still debate about the cost effectiveness of this type of
surgery. In fact the surgical management of obesity and obesity related
comorbidities is associated with polarised opinions among general surgeons not
performing weight loss surgery, physicians and the public.
Nicholas Christou’s group in Montreal performed a comparison in terms of health-
related costs between 1035 patients undergoing weight loss surgery and to 5746
age- and sex-matched controls (Sampalis, Liberman, Auger and Christou 2004).
The follow-up period was five years and the endpoint was all-cause hospitalisation
with the cost of the surgical procedure included (Sampalis, Liberman, Auger and
35
Christou 2004). The total hospitalization cost was higher in the surgical group in the
first year, however at 5 years the cost was higher for the control group allowing the
authors to conclude that weight loss surgery decreases long-term direct health-care
costs and the initial cost of this treatment can be recovered over a period of 3.5
years (Sampalis, Liberman, Auger and Christou 2004). Of note is the fact that the
majority of the patients in the surgical group underwent open gastric bypass surgery
(Sampalis, Liberman, Auger and Christou 2004). With the use of the laparoscopic
approach the comparison may be more favourable for weight loss surgery
(Sampalis, Liberman, Auger and Christou 2004).
Focusing on medication cost in another study from the USA 78 patients aged 55 to
75 undergoing laparoscopic gastric bypass surgery were assessed preoperatively
and 6 months, 1 year, and yearly postoperatively thereafter (Snow, Weinstein,
Hannon, Lane, Ringold, Hansen and Pointer 2004). The number of medications per
patient fell by 66% (Snow, Weinstein, Hannon, Lane, Ringold, Hansen and Pointer
2004). With the cost of the surgical intervention as one-off, the crossover point for
cost effectiveness was at 2.5 years (Snow, Weinstein, Hannon, Lane, Ringold,
Hansen and Pointer 2004; Welbourn and Pournaras 2010).
The Health Technology Assessment report used for the 2002 National Institute of
Clinical Excellence Guidelines for weight loss surgery estimated that the incremental
cost effectiveness ratios per quality-adjusted life year were £8527 for gastric banding
and £6289 for gastric bypass (Clegg, Colquitt, Sidhu, Royle, Loveman and Walker

36
2002; Welbourn and Pournaras 2010). Both of these were well below the
conventional threshold of £30 000 often used by the National Institute of Clinical
Excellence to determine cost effectiveness (Clegg, Colquitt, Sidhu, Royle, Loveman
and Walker 2002; Welbourn and Pournaras 2010).
An updated Health Technology Assessment systematic review assessed the cost-
effectiveness of weight loss surgery in 2009 (Picot, Jones, Colquitt,
Gospodarevskaya, Loveman, Baxter and Clegg 2009). Picot el al reported that
weight loss surgery was cost-effective compared to non-surgical treatment
modalities in the published estimates of cost-effectiveness (Picot, Jones, Colquitt,
Gospodarevskaya, Loveman, Baxter and Clegg 2009). However, these estimates
were likely to be unreliable according to the authors (Picot, Jones, Colquitt,
Gospodarevskaya, Loveman, Baxter and Clegg 2009). Hence they developed a
novel economic model. According to this the cost of weight loss surgery was higher
than non-surgical treatment the three patient populations used for analysis, but was
associated with an improved effect (Picot, Jones, Colquitt, Gospodarevskaya,
Loveman, Baxter and Clegg 2009). For morbid obesity incremental cost-
effectiveness ratios ranged between £2000 and £4000 per quality-adjusted life year
gained (Picot, Jones, Colquitt, Gospodarevskaya, Loveman, Baxter and Clegg
2009). These figures remain within the range regarded as cost-effective by National
Institute of Clinical Excellence.
Cost effectiveness and type 2 diabetes

37
Focusing on type 2 diabetes related outcomes, O’Brien and his group in Melbourne
reported cost-effectiveness results from a randomised control trial comparing gastric
banding versus best medical treatment for type 2 diabetes (Keating, Dixon, Moodie,
Peeters, Playfair and O'Brien 2009). The incremental cost effectiveness ratio for
gastric banding was lower than the comparable figure for conventional therapy
suggesting that within a 2-year period gastric banding was below the currently
accepted cost-effectiveness threshold in Australia (Keating, Dixon, Moodie, Peeters,
Playfair and O'Brien 2009).
Klein et al examined the administrative claims database of privately insured patients
in the US covering 8.5 million lives 1999-2007, identified obese patients with
diabetes, aged 18-65 years, who were treated with weight loss surgery and matched
them with controls for demographic characteristics, comorbidities, and health-care
costs (Klein, Ghosh, Cremieux, Eapen and McGavock 2011). The cost of
laparoscopic surgery was fully recovered at 26 months (Klein, Ghosh, Cremieux,
Eapen and McGavock 2011). Within one month medication costs were significantly
lower for the surgical group (Klein, Ghosh, Cremieux, Eapen and McGavock 2011).
Conclusion
Weight loss surgery leads to an improvement in a number of obesity related
comorbidites secondary to the weight loss itself but also due to weight loss
independent effects.

38
Gut hormones and bile acids
Energy homeostasis
Energy intake and expenditure are regulated by the mechanisms of energy
homeostasis and lead to a stable body mass over time (Morton, Cummings, Baskin,
Barsh and Schwartz 2006; Flier 2004; Pournaras and le Roux 2009). From an
evolutionary point of view one can hypothesise that survival in an environment with
limited availability of food provided selection bias towards homeostatic systems
which are more sensitive to reduced energy intake rather than energy excess
(Schwartz, Woods, Seeley, Barsh, Baskin and Leibel 2003; Pournaras and le Roux
2009). This phenomenon may perhaps explain the current obesity epidemic
(Pournaras and le Roux 2009). Non-surgical weight loss is associated with
increased hunger and reduced metabolic rate which is a physiological response to
reduced energy intake. Leptin and insulin are the key messengers of the status of
energy stores from the periphery to the central nervous system (Morton, Cummings,
Baskin, Barsh and Schwartz 2006; Flier 2004; Pournaras and le Roux 2009).
The central melanocortin system, which plays a crucial role in the regulation of
energy homeostasis, is influenced by signals mediated through gut hormones
(Ellacott, Halatchev and Cone 2006; Pournaras and le Roux 2009). These
molecules cause hunger and postprandial satiety and hence regulate appetite
control (Pournaras and le Roux 2009).

39
Weight loss procedures were developed with the objective to cause weight loss due
to the reduction of gastric volume (laparoscopic adjustable gastric banding,
laparoscopic sleeve gastrectomy), malabsorption of nutrients (biliopancreatic
diversion, duodenal switch) or the effect of both (Roux-en-Y gastric bypass)
(Pournaras and le Roux 2009). There is no evidence that calorie or protein
malabsorption occurs after gastric bypass. It has been demonstrated that negating
the effect of the satiety gut hormone change with octeotride is associated with
increased food intake and reduced satiety (le Roux, Welbourn, Werling, Osborne,
Kokkinos, Laurenius, Lonroth, Fandriks, Ghatei, Bloom and Olbers 2007). A number
of studies have suggested that gut hormone concentrations change after gastric
bypass leading to the establishment of the concept of the gut-brain axis. The
available data will be reviewed below.
Gut hormones
In this chapter anorexigenic and orexigenic gut hormones are reviewed in
decreasing order in terms of level of evidence regarding their role in the mechanism
of action of weight loss surgery namely peptide YY (PYY), glucagon-like peptide-1
(GLP-1), ghrelin, cholecystokinin (CCK), glucose-dependent insulinotropic
polypeptide (GIP), oxyntomodulin (OXM) and pancreatic polypeptide (PP).
Peptide YY (PYY)
Peptide YY is 36-amino-acid peptide, member of the PP-fold peptide family. Y is the
abbreviation for tyrosine. PYY was found throughout the small gut in very low

40
concentrations in the duodenum and jejunum increasing in the terminal ileum and
even higher concentrations throughout the colon with the maximum in the rectum
(Adrian, Ferri, Bacarese-Hamilton, Fuessl, Polak and Bloom 1985). Basal plasma
concentrations of PYY were low but rose in response to food, remaining elevated for
several hours postprandially (Adrian, Ferri, Bacarese-Hamilton, Fuessl, Polak and
Bloom 1985). PYY levels are not altered by gastric distension (Oesch, Rüegg,
Fischer, Degen and Beglinger 2006). PYY decreases appetite and reduces food
intake by 33% over 24 hours in non obese individuals (Batterham, Cowley, Small,
Herzog, Cohen, Dakin, Wren, Brynes, Low, Ghatei, Cone and Bloom 2002).
Furthermore obese individuals are not resistant to the anorectic effects of PYY and
have lower endogenous PYY suggesting that PYY deficiency may contribute to the
pathogenesis of obesity (Batterham, Cohen, Ellis, Le Roux, Withers, Frost, Ghatei
and Bloom 2003).
Glucagon-like peptide-1 (GLP-1)
GLP-1 is released postprandially by the same endocrine L-cells as PYY and OXM
(Cummings and Overduin 2007). GLP-1 and PYY inhibit food intake additively
(Neary, Small, Druce, Park, Ellis, Semjonous, Dakin, Filipsson, Wang, Kent, Frost,
Ghatei and Bloom 2005). GLP-1 has an additional role as an incretin, a hormone
which is secreted from gastrointestinal tract cells into the systemic circulation in
response to the presence of nutrients intraluminally (Baggio and Drucker 2007).
GLP-1 leads to glucose-dependent insulin secretion, induction of ß-cell proliferation
and enhanced resistance to apoptosis (Baggio and Drucker 2007). GLP-1 has

41
further effects on glucose regulation with slowing of gastric emptying and glucose-
dependent inhibition of glucagon secretion (Baggio and Drucker 2007).
Ghrelin
The only known orexigenic gut hormone is ghrelin, is a 28-amino acid peptide
produced from the fundus of the stomach and the proximal intestine (Kojima,
Hosoda, Date, Nakazato, Matsuo and Kangawa 1999; Frühbeck, Diez Caballero and
Gil 2004). Central and peripheral administration leads to increased food intake
(Wren, Small, Abbott, Dhillo, Seal, Cohen, Batterham, Taheri, Stanley, Ghatei and
Bloom 2001; Wren, Seal, Cohen, Brynes, Frost, Murphy, Dhillo, Ghatei and Bloom
2001). The preprandial elevation and the postprandial fall in ghrelin levels suggest
that ghrelin may play a physiological role in meal initiation (Cummings, Purnell,
Frayo, Schmidova, Wisse and Weigle 2001). Diet induced weight loss of 17% of
initial body weight was associated with a 24% increase in the 24 hour ghrelin profile
suggesting that ghrelin may also have a role in the long-term regulation of body
weight (Cummings, Weigle, Frayo, Breen, Ma, Dellinger and Purnell 2002). Data
from Imperial demonstrate that obese individuals have lower fasting ghrelin levels
and reduced postprandial ghrelin suppression compared to normal weight individuals
(le Roux, Patterson, Vincent, Hunt, Ghatei and Bloom 2005).
Cholecystokinin (CCK)
CCK is secreted by I cells located in the duodenum, jejunum, and proximal ileum in
response to a meal (Chandra and Liddle 2007). CCK has been implicated in gastric
42
emptying and distension, gallbladder contraction, pancreatic secretion, and intestinal
motility as well as postprandial satiety (Chandra and Liddle 2007; Kellum,
Kuemmerle, O’Dorisio, Rayford, Martin, Engle, Wolf and Sugerman 1990).
Intraperitoneal administration of CCK in mice diminished food intake by 90% (Kopin,
Mathes, McBride, Nguyen, Al-Haider, Schmitz, Bonner-Weir, Kanarek and Beinborn
1999). In contrast intraperitoneal administration of CCK in mice, lacking CCK-A
receptors did not reduce food intake (Kopin, Mathes, McBride, Nguyen, Al-Haider,
Schmitz, Bonner-Weir, Kanarek and Beinborn 1999). The latter group of mice had
the same weight as wild-type mice and Kopin et al suggested that CCK plays a role
in appetite but is not essential for homeostasis (Kopin, Mathes, McBride, Nguyen, Al-
Haider, Schmitz, Bonner-Weir, Kanarek and Beinborn 1999).
Glucose-dependent insulinotropic peptide or Gastric Inhibitory Peptide
GIP is also an incretin with similar to GLP-1 effect on islet β-cells acting through
structurally distinct yet related receptors (Yip and Wolfe 2000). It is produced in the
proximal gut and is released postprandially (Yip and Wolfe 2000). It was initially
named so due to the gastric acid inhibitory properties, but the effect on insulin seems
to be more important from a physiological point of view (Yip and Wolfe 2000).
Oxyntomodulin (OXM)
Infusion of OXM reduced ad libitum energy intake at a buffet meal and also reduced
hunger scores without causing nausea or affecting food palatability (Cohen, Ellis, Le
Roux, Batterham, Park, Patterson, Frost, Ghatei and Bloom 2003). In a randomised,

43
double-blind human trial the effect of OXM treatment was tested with self
administered injections of OXM three times daily 30 minutes before each meal. In
the treatment group body weight was reduced by 2.3 kg compared to 0.5 kg in the
control group (Wynne, Park, Small, Patterson, Ellis, Murphy, Wren, Frost, Meeran,
Ghatei and Bloom 2005).
Pancreatic polypeptide (PP)
PP is a gut hormone released from the pancreas in response to nutrients. Plasma
levels of PP increased rapidly after a meal in healthy volunteers and remained
elevated after six hours (Adrian, Bloom, Bryant, Polak, Heitz and Barnes 1976).
Plasma PP has been shown to be reduced in conditions associated with increased
food intake such as Prader-Willi syndrome (Zipf, O'Dorisio, Cataland and Sotos
1981). Plasma PP has been shown to be increased in anorexia nervosa (Uhe,
Szmukler, Collier, Hansky, O'Dea and Young 1992). Infusion of PP leads to
decreased appetite and food intake (Batterham, le Roux, Cohen, Park, Ellis,
Patterson, Frost, Ghatei and Bloom 2003).
Bile acids
Bile consists of bile acids, cholesterol, phosphatidylcholine and bilirubin. The
primary bile acids in humans are cholic acid and chenodeoxycholic acid (Vlahcevic,
Pandak and Stravitz 1999). They are synthesized with the aid of enzymes found in
the endoplasmic reticulum, cytosol, mitochondria, and peroxisomes and they are
conjugated to glycine or taurine before they are secreted into bile canaliculi

44
(Vlahcevic, Pandak and Stravitz 1999). Conjugated bile acids are the major solutes
in bile; they are less toxic and are more efficient promoters of intestinal absorption of
dietary lipid than unconjugated bile acids (Vessey, Crissey and Zakim 1977; Pircher,
Kitto, Petrowski, Tangirala, Bischoff, Schulman and Westin 2003).
Following a meal, bile flows into the duodenum and proximal gut (Houten, Watanabe
and Auwerx 2006). Bile acids are absorbed by both passive diffusion and active
transport in the terminal ileum, and then transported to the liver via the portal vein in
the so called enterohepatic recirculation (Houten, Watanabe and Auwerx 2006).
They are subsequently taken up at the basolateral sinusoidal membrane and
exported again at the apical canalicular membrane of the hepatocytes into the bile
canaliculus (Houten, Watanabe and Auwerx 2006). Each BA molecule may
complete 4–12 cycles between the liver and intestine per day (Houten, Watanabe
and Auwerx 2006).
Bile acids have been recently recognised as potential targets for drug treatment in
obesity and diabetes. However this concept is not entirely novel. The use of bile
acids as appetite suppressants was first reported in 1968 (Bray and Gallagher 1968).
In a randomized, double-blind, crossover study of cholestyramine compared with
placebo for a period of 6 weeks each 21 patients with type 2 diabetes mellitus were
included (Garg and Grundy 1994). The aim was to assess efficacy and tolerability of
the bile acid sequestrant cholestyramine (Garg and Grundy 1994). Unexpectedly in
45
the post hoc analysis improved glycaemic control with mean plasma glucose values
lowered by 13% and a median reduction in urinary glucose excretion were reported
as well as a trend for lower glycated haemoglobin (Garg and Grundy 1994).
Suzuki et al compared a different bile acid sequestrant, colestimide, to acarbose in a
randomised open label study and showed a significant decrease in glucose levels
(Suzuki, Oba, Futami, Suzuki, Ouchi, Igari, Matsumura, Watanabe, Kigawa and
Nakano 2006). Zieve et al showed in a double blind, placebo controlled study that a
12-week treatment with colesevelam, another bile acid sequestrant, in addition to
oral antihyperglycaemic medications, was associated with a significant reduction in
HbA1c compared to placebo (Zieve, Kalin, Schwartz, Jones and Bailey 2007). In
another study comparing colestimide to pravastin, using a randomised open label
design, colestimide therapy for three months led to reduced HbA1c and fasting
glucose levels (Yamakawa, Takano, Utsunomiya, Kadonosono and Okamura 2007).
Three similar multicenter studies assessed the efficacy of colevesham in patients not
adequately controlled receiving insulin therapy alone or in combination with oral
antidiabetic agents in one, receiving sulfonylurea monotherapy or sulfonylurea in
combination with additional oral antidiabetic agents in the second and receiving
metformin monotherapy or metformin in combination with additional oral antidiabetic
agents in the third (Goldberg, Fonseca, Truitt and Jones 2008; Fonseca,
Rosenstock, Wang, Truitt and Jones 2008; Bays, Goldberg, Truitt and Jones 2008).
A prospective, randomized, double-blind, placebo-controlled, parallel-group design

46
was used in all studies and all three confirmed that colesevelam improved glycaemic
control (Goldberg, Fonseca, Truitt and Jones 2008; Fonseca, Rosenstock, Wang,
Truitt and Jones 2008; Bays, Goldberg, Truitt and Jones 2008).
Different possible mechanisms have been suggested in attempt to dissect the effects
of bile acids on glucose metabolism. Disruption of enterohepatic circulation of bile
acids may have an effect on the Farnesoid X Receptor (FXR) pathway, the
intracellular signalling pathway for bile acids (Guzelian and Boyer 1974). Bile acids
promote GLP-1 secretion through TGR5 in STC-1 cells (Katsuma, Hirasawa and
Tsujimoto 2005). The effect of GLP-1 on glucose metabolism has already been
described in the GLP-1 section. Bile acids inhibit gluconeogenesis in both FXR
dependent and independent manner (Thomas, Pellicciari, Pruzanski, Auwerx and
Schoonjans 2008; De Fabiani, Mitro, Gilardi, Caruso, Galli and Crestani 2003;
Yamagata, Daitoku, Shimamoto, Matsuzaki, Hirota, Ishida and Fukamizu 2004; Ma,
Saha, Chan and Moore 2006). Bile acids increase energy expenditure and therefore
reduce insulin resistance. This effect is dependent on induction of the cyclic-AMP-
dependent thyroid hormone activating the enzyme type 2 iodothyronine deiodinase
(D2) (Watanabe, Houten, Mataki, Christoffolete, Kim, Sato, Messaddeq, Harney,
Ezaki, Kodama, Schoonjans, Bianco and Auwerx 2006). In addition bile acids act via
the phosphatidylinositol 3 (PI3) kinase/AKT/glycogen synthase (kinase) 3
(GSK3)/glycogen synthase (GS) pathway (Han, Studer, Gupta, Fang, Qiao, Li,
Grant, Hylemon and Dent 2004). Through this pathway bile acids cooperate with
insulin in the regulation of glucose storage in hepatocytes (Han, Studer, Gupta,
Fang, Qiao, Li, Grant, Hylemon and Dent 2004). Bile acids through fibroblast growth

47
factor 19 (FGF19) may cause increased metabolic rate and decreased adiposity as
well as increased energy expenditure (Tomlinson, Fu, John, Hultgren, Huang, Renz,
Stephan, Tsai, Powell-Braxton, French and Stewart 2002). All these are beneficial
for insulin sensitivity. FGF19 also regulates hepatic protein and glycogen
metabolism in an insulin-independent manner (Kir, Beddow, Samuel, Miller, Previs,
Suino-Powell, Xu, Shulman, Kliewer and Mangelsdorf DJ 2011).
The effect of metabolic surgery on gut hormones and bile acids
The changes in gut hormones and bile acids after RYGB, the commonest weight
loss operation are summarised in Table 1.
Metabolic Surgery and PYY
In both a human model of gastric bypass and a rodent model of jejuno-intestinal
bypass increased postprandial PYY responses were shown (le Roux, Aylwin,
Batterham, Borg, Coyle, Prasad, Shurey, Ghatei, Patel and Bloom 2006). In an a
follow-up study it was confirmed that gastric bypass leads to enhanced postprandial
PYY and GLP-1 responses in the first week after surgery (le Roux, Welbourn,
Werling, Osborne, Kokkinos, Laurenius, Lönroth, Fändriks, Ghatei, Bloom and
Olbers 2007). This was associated with enhanced postprandial satiety as measured
with visual analogue scores (le Roux, Welbourn, Werling, Osborne, Kokkinos,
Laurenius, Lönroth, Fändriks, Ghatei, Bloom and Olbers 2007). In a comparison of
good versus poor responders to gastric bypass, the poor responders had attenuated
PYY and GLP-1 postprandial responses compared to patients with good weight loss

48
(le Roux, Welbourn, Werling, Osborne, Kokkinos, Laurenius, Lönroth, Fändriks,
Ghatei, Bloom and Olbers 2007). These findings demonstrated an association
between the enhanced postprandial satiety gut hormone response and appetite
control after gastric bypass surgery.
In the same study causation was shown with another experiment (le Roux,
Welbourn, Werling, Osborne, Kokkinos, Laurenius, Lönroth, Fändriks, Ghatei, Bloom
and Olbers 2007). Using a randomised double-blind saline controlled design and
including patients who had undergone gastric bypass and were weight stable,
inhibition of the gut hormone response with the somatostatin analogue octeotride led
to increased food intake and reduced satiety (le Roux, Welbourn, Werling, Osborne,
Kokkinos, Laurenius, Lönroth, Fändriks, Ghatei, Bloom and Olbers 2007).
Octeotride had no effect on patients who had previously undergone gastric banding
and acted as a control group (le Roux, Welbourn, Werling, Osborne, Kokkinos,
Laurenius, Lönroth, Fändriks, Ghatei, Bloom and Olbers 2007). Hence gastric
bypass can be considered a surgically induced a behavioural modification (appetite
control) which is due to the modulation of the satiety gut hormone response.
Korner et al performed a prospective study of patients undergoing gastric bypass
and gastric banding (Korner, Inabnet, Febres, Conwell, McMahon, Salas, Taveras,
Schrope and Bessler 2009). PYY levels were measured preoperatively, 26 and 52
weeks postoperatively using a liquid mixed standard meal (Korner, Inabnet, Febres,
Conwell, McMahon, Salas, Taveras, Schrope and Bessler 2009). Although there
49
was no difference in fasting PYY levels at any time point, a progressive increase in
fasting PYY in the gastric bypass was reported, which reached significance
compared to preoperatively at the 52 week time point (Korner, Inabnet, Febres,
Conwell, McMahon, Salas, Taveras, Schrope and Bessler 2009). Postprandial
levels of PYY (30 minutes) increased 3.5 times at both postoperative time points
after gastric bypass and were significantly higher compared to the gastric banding
group (Korner, Inabnet, Febres, Conwell, McMahon, Salas, Taveras, Schrope and
Bessler 2009). When postprandial PYY was assessed with the area under the curve
(AUC), this was increased at 26 weeks and increased even further with a significant
difference at 52 weeks (Korner, Inabnet, Febres, Conwell, McMahon, Salas,
Taveras, Schrope and Bessler 2009). Postprandial PYY AUC increased 26 weeks
after gastric banding but not after 52 weeks (Korner, Inabnet, Febres, Conwell,
McMahon, Salas, Taveras, Schrope and Bessler 2009). Of note is that the two
groups were not matched for BMI preoperatively as the patients in the gastric bypass
group were heavier, but both groups had similar BMI at 26 and 52 weeks making the
findings of this study an important contribution in the evidence base of PYY increase
after gastric bypass surgery (Korner, Inabnet, Febres, Conwell, McMahon, Salas,
Taveras, Schrope and Bessler 2009).
Laferrère’s group performed a similar comparative study in which participants
underwent gastric bypass or gastric banding (Bose, Machineni, Oliván, Teixeira,
McGinty, Bawa, Koshy, Colarusso and Laferrère 2010). The two groups were
matched for preoperative weight and age. They were studied preoperatively,
postoperatively following weight loss of 12 kg and at one year postoperatively with a

50
50 g (in 200 mL) oral glucose test being used (Bose, Machineni, Oliván, Teixeira,
McGinty, Bawa, Koshy, Colarusso and Laferrère 2010). Postprandial PYY levels
increased at the fist postoperative time point following gastric bypass but not gastric
banding (Bose, Machineni, Oliván, Teixeira, McGinty, Bawa, Koshy, Colarusso and
Laferrère 2010). No further changes were noted at 12 months (Bose, Machineni,
Oliván, Teixeira, McGinty, Bawa, Koshy, Colarusso and Laferrère 2010). This study
demonstrated that gastric bypass leads to an increased postprandial PYY response
controlling for the effect of surgery and weight loss by using a matched control group
and matching for similar weight loss at the first postoperative time point (Bose,
Machineni, Oliván, Teixeira, McGinty, Bawa, Koshy, Colarusso and Laferrère 2010).
The same group performed a comparative study of the effect of equivalent weight
loss (10kg) after gastric bypass and diet on PYY (Oliván, Teixeira, Bose, Bawa,
Chang, Summe, Lee and Laferrère 2009). Again the PYY response to an oral
glucose tolerance test was enhanced following bypass but not after diet again
controlling for the effect of weight loss (Oliván, Teixeira, Bose, Bawa, Chang,
Summe, Lee and Laferrère 2009).
Exploring the effects of other procedures on PYY, Garcia-Fuentes et al showed
increased PYY fasting levels 7 months after biliopancreatic diversion compared to
preoperatively and there was a significant difference compared to patients
undergoing gastric bypass (Garcia-Fuentes, Garrido-Sanchez, Garcia-Almeida,
Garcia-Arnes, Gallego-Perales, Rivas-Marin, Morcillo, Cardona and Soriguer 2008).

51
Sleeve gastrectomy has also been suggested to have an effect on PYY.
Karamanakos et al performed a prospective double blind study comparing gastric
bypass and sleeve gastrectomy (Karamanakos, Vagenas, Kalfarentzos and
Alexandrides 2008). Time points were preoperatively and 1, 3, 6, and 12 months
postoperatively (Karamanakos, Vagenas, Kalfarentzos and Alexandrides 2008).
Fasting PYY levels increased significantly after sleeve gastrectomy as well as gastric
bypass (Karamanakos, Vagenas, Kalfarentzos and Alexandrides 2008). In a
subgroup of patients, samples were collected 2 hours after a standard 420 kcal
mixed meal and PYY postprandial levels increased significantly after both sleeve
gastrectomy and gastric bypass compared to fasting levels (Karamanakos, Vagenas,
Kalfarentzos and Alexandrides 2008).
Peterli et al performed a similar randomized, prospective study comparing gastric
bypass and sleeve gastrectomy (Peterli, Wölnerhanssen, Peters, Devaux, Kern,
Christoffel-Courtin, Drewe, von Flüe and Beglinger 2009). In this study preoperative
fasting PYY levels were higher in the bypass group compared to gastric banding with
no significant difference (Peterli, Wölnerhanssen, Peters, Devaux, Kern, Christoffel-
Courtin, Drewe, von Flüe and Beglinger 2009). Fasting PYY levels decreased
postoperatively in both groups (Peterli, Wölnerhanssen, Peters, Devaux, Kern,
Christoffel-Courtin, Drewe, von Flüe and Beglinger 2009). However an increased
postprandial PYY response was reported one week after both sleeve gastrectomy
and gastric bypass (Peterli, Wölnerhanssen, Peters, Devaux, Kern, Christoffel-
Courtin, Drewe, von Flüe and Beglinger 2009).

52
Metabolic Surgery and GLP-1
As expected, in accordance to the PYY response, the postprandial GLP-1 response
is also enhanced after gastric bypass. Rubino et al showed no difference in fasting
GLP-1 levels in a group of patients, both diabetic and non diabetic undergoing
gastric bypass (Rubino, Gagner, Gentileschi, Kini, Fukuyama, Feng and Diamond
2004). Morinigo et al performed two prospective studies of patients undergoing
gastric bypass (Morínigo, Moizé, Musri, Lacy, Navarro, Marín, Delgado, Casamitjana
and Vidal 2006; Morínigo, Lacy, Casamitjana, Delgado, Gomis and Vidal 2006).
Fasting GLP-1 did not increase at the 6 week or the 12 month time point.
De Carvalho et al investigated prospectively eleven normal glucose tolerant and
eight abnormal glucose metabolism obese patients undergoing initially diet-
restriction followed by gastric bypass with a silastic ring around the gastric pouch,
the FOBI procedure (de Carvalho, Marin, de Souza, Pareja, Chaim, de Barros
Mazon, da Silva, Geloneze, Muscelli and Alegre 2009). GLP-1 levels at 30 and 60
min after a glucose tolerance test increased nine months postoperatively.
Laferrère et al investigated a group of nine obese, type 2 diabetic women who
underwent gastric bypass (Laferrère, Teixeira, McGinty, Tran, Egger, Colarusso,
Kovack, Bawa, Koshy, Lee, Yapp and Olivan 2008). They used a group of matched
individuals who were on low calorie diet as controls. A 50-gr oral glucose test was
performed prior to the intervention and one month afterwards. In addition to GLP-1

53
levels, the incretin effect was also calculated. Fasting GLP-1 levels remained
unchanged in both groups. Both the postprandial GLP-1 and the incretin effect were
increased following gastric bypass but not after diet-induced weight loss.
The same group studied 11 participants with type 2 diabetes preoperatively and 1, 6,
and 12 months after gastric bypass (Bose, Teixeira, Olivan, Bawa, Arias, Machineni,
Pi-Sunyer, Scherer and Laferrère 2010). The blunted incretin effect improved at 1
month and remained unchanged at 6 and 12 months after gastric bypass. The
blunted GLP-1 levels followed a similar response after gastric bypass with the
improvement at 1 month remaining unchanged at 12 months.
Morinigo et al showed on their study of 9 patients undergoing gastric bypass that a
significant increase in the GLP-1 postprandial response using a standard mixed
liquid meal (Morínigo, Moizé, Musri, Lacy, Navarro, Marín, Delgado, Casamitjana
and Vidal 2006). In a subsequent study from the same group, a 12-month
prospective study using the same standard test meal, participants had normal
glucose tolerance, impaired glucose tolerance or type 2 diabetes (Morínigo, Lacy,
Casamitjana, Delgado, Gomis and Vidal 2006). Postprandial GLP-1 was increased
at the 6-week time point for participants with normal or impaired glucose tolerance
but not in participants with type 2 diabetes. The postprandial GLP-1 response was
similar among the three groups at 12 months.

54
Lugari et al studied 22 non-diabetic patients undergoing biliopancreatic diversion
and 9 age-matched healthy volunteers using a mixed meal preoperatively and
postoperatively when patients reached 50% excess weight loss (Lugari, Dei Cas,
Ugolotti, Barilli, Camellini, Ganzerla, Luciani, Salerni, Mittenperger, Nodari, Gnudi
and Zandomeneghi 2004). An overall increase in circulating GLP-1 levels was
reported whilst plasma DPP-IV activity remained abnormally increased
postoperatively.
Further work on the effect of biliopancreatic diversion on GLP-1 was performed by
Valverde et al (Valverde, Puente, Martín-Duce, Molina, Lozano, Sancho, Malaisse
and Villanueva-Peñacarrillo 2005). An oral glucose tolerance test was used in
patients at 1, 3 and 6 months after biliopancreatic diversion. As a control group
participants were also tested 6 months after vertical banded gastroplasty. One
month after biliopancreatic diversion the postprandial GLP-1 response was
increased. Both the basal plasma GLP-1 concentration and its incremental area
during the oral glucose tolerance test continued to increase. However a more
pronounced increase in basal and incremental plasma GLP-1 was observed after
biliopancreatic diversion compared to vertical banded gastroplasty.
Mingrone’s group studied 10 patients with type 2 diabetes undergoing biliopancreatic
diversion (Guidone, Manco, Valera-Mora, Iaconelli, Gniuli, Mari, Nanni, Castagneto,
Calvani and Mingrone 2006). Following an oral glucose tolerance test postprandial

55
GLP-1 response increased one week postoperatively and did not increase further at
4 weeks.
The effect of sleeve gastrectomy on GLP-1 was studied in the randomised control
trial of gastric bypass vs. sleeve gastrectomy by Peterli et al (Peterli,
Wölnerhanssen, Peters, Devaux, Kern, Christoffel-Courtin, Drewe, von Flüe and
Beglinger 2009). The postprandial GLP-1 response was more enhanced one week
after gastric bypass compared to sleeve gastrectomy. This exaggerated GLP-1
response remained unchanged 3 months after gastric bypass but increased further
after sleeve gastrectomy.
Varderas et al performed a prospective study of non-diabetic undergoing sleeve
gastrectomy using a standard liquid meal preoperatively and two months
postoperatively (Valderas, Irribarra, Rubio, Boza, Escalona, Liberona, Matamala and
Maiz 2011). The incremental area under the curve of GLP-1 increased after sleeve
gastrectomy.
A study from the USA showed no change in fasting GLP-1 levels 6 and 12 months
after gastric banding (Shak, Roper, Perez-Perez, Tseng, Francois, Gamagaris,
Patterson, Weinshel, Fielding, Ren and Blaser 2008).

56
Usinger et al investigated the GLP-1 response in 10 patients before and 6 weeks
after gastric banding also using 75 g-oral glucose tolerance test (Usinger, Hansen,
Kristiansen, Larsen, Holst and Knop 2011). This study did not show any change in
fasting or postprandial GLP-1.
Finally in Korner’s comparative study fasting levels and 30minute postprandial levels
of GLP-1 did not change 26 and 52 weeks after gastric banding (Korner, Inabnet,
Febres, Conwell, McMahon, Salas, Taveras, Schrope and Bessler 2009).
Metabolic Surgery and Ghrelin
Cummings et al showed in a landmark study, which led to great interest in the
interaction of weight loss surgery and gut hormones, a profound suppression of
ghrelin levels post gastric bypass (Cummings, Weigle, Frayo, Breen, Ma, Dellinger
and Purnell 2002). Data from other centres have been heterogeneous (Pournaras,
le Roux 2009). Studies showed decreased fasting and postprandial (Geloneze,
Tambascia, Pilla, Geloneze, Repetto and Pareja 2003; Morínigo, Casamitjana,
Moizé, Lacy, Delgado, Gomis and Vidal 2004), unchanged fasting and postprandial
(le Roux, Welbourn, Werling, Osborne, Kokkinos, Laurenius, Lönroth, Fändriks,
Ghatei, Bloom and Olbers 2007; Faraj, Havel, Phélis, Blank, Sniderman and
Cianflone 2003; Stoeckli, Chanda, Langer and Keller 2004) and increased fasting
ghrelin levels after gastric bypass (Vendrell, Broch, Vilarrasa, Molina, Gómez,
Gutiérrez, Simón, Soler and Richart 2004).

57
Lin et al showed that the divided gastroplasty creating a small proximal gastric
pouch, as part of gastric bypass, results in an early decline in circulating ghrelin
levels that are not observed with other gastric procedures (Lin, Gletsu, Fugate,
McClusky, Gu, Zhu, Ramshaw, Papanicolaou, Ziegler and Smith 2004). An intact
vagus nerve is required for exogenous ghrelin to increase appetite and food intake
(le Roux, Neary, Halsey, Small, Martinez-Isla, Ghatei, Theodorou and Bloom 2005).
Perioperative factors may play a role. Sundbom et al showed that ghrelin levels fall
transiently on postoperative day 1 after gastric bypass, increased after 1 month to
preoperative levels, and rose further at 6 and 12 months (Sundbom, Holdstock,
Engström and Karlsson 2007). The authors suggest that this is due to vagal
dysfunction (Sundbom, Holdstock, Engström and Karlsson 2007). Differences in the
surgical technique may also contribute to the variation in the results as with a vertical
pouch, ghrelin producing cells are more likely to be excluded, compared to a
horizontal pouch (Pories 2008). In obese individuals, insulin resistance and
hyperinsulinaemia are inversely associated with ghrelin concentrations (McLaughlin,
Abbasi, Lamendola, Frayo and Cummings 2004). A potential hypothesis is that
preoperative differences as well as differences in the postoperative improvement in
of insulin and insulin resistance may affect ghrelin levels and hence contribute to the
variation in results (Pournaras and le Roux 2009).
Finally, the different assays used for ghrelin may be responsible for the diversity in
the results published in the literature (Chandarana, Drew, Emmanuel, Karra,
Gelegen, Chan, Cron and Batterham 2009). Serine-3 of ghrelin is acylated with an
eight carbon fatty acid, octanoate (Yang, Brown, Liang, Grishin and Goldstein 2008).

58
This is essential for ghrelin’s effects. De Vriese et al demonstrated in a human study
that ghrelin is degraded by several esterases (De Vriese, Gregoire, Lema-Kisoka,
Waelbroeck, Robberecht and Delporte 2004). This process renders ghrelin inactive
(De Vriese, Gregoire, Lema-Kisoka, Waelbroeck, Robberecht and Delporte 2004).
Chandarana et al showed that fasting plasma acyl-ghrelin concentrations were
markedly higher in samples processed with 4-(2-aminoethyl)-benzenesulfonyl
fluoride hydrochloride in addition to hydrochloric acid and aprotinin compared to
samples processed with hydrochloric acid and aprotinin or aprotinin alone
(Chandarana, Drew, Emmanuel, Karra, Gelegen, Chan, Cron and Batterham 2009).
Furthermore they detected higher acyl-ghrelin levels in hydrochloric acid and
aprotinin samples compared to aprotinin only samples. These subtle differences in
the processing of the samples may explain the different results amongst different
centres.
Despite the fact that ghrelin has led to considerable interest in the gut brain axis, the
inconsistent response among studies and centres have made a challenging
candidate for elucidating the mechanism of metabolic surgery.
Metabolic Surgery and CCK
Rubino et al showed no change in fasting CCK three weeks after gastric bypass
(Rubino, Gagner, Gentileschi, Kini, Fukuyama, Feng and Diamond 2004). Kellum et

59
al studied patients before and six months after gastric bypass and vertical banded
gastroplasty showing no change in the CCK response to a glucose meal (Kellum,
Kuemmerle, O'Dorisio, Rayford, Martin, Engle, Wolf and Sugerman 1990).
Foschi et al studied eight patients before and after weight loss of 20% of the initial
BMI following vertical banded gastroplasty (Foschi, Corsi, Pisoni, Vago, Bevilacqua,
Asti, Righi and Trabucchi 2004). A control group of healthy volunteers was used.
There was no difference in basal CCK levels between the two groups. Following an
acidified liquid meal peak CCK levels were increased after vertical banded
gastroplasty.
Naslund et al showed increased basal CCK levels 20 years after jejuno-ileal bypass
(Naslund, Gryback, Hellstrom, Jacobsson, Holst, Theodorsson and Backman 1997).
The same group studied eight patients before and 9 months after jejuno-ileal bypass
using a standard mixed meal (Naslund, Melin, Gryback, Hagg, Hellstrom,
Jacobsson, Theodorsson, Rössner and Backman 1997). Postprandial CCK levels
were lower than non-obese controls both pre and postoperatively.
Metabolic Surgery and GIP

60
Rubino et al studied the GIP response in diabetic and non-diabetic patients before
and three weeks after gastric bypass (Rubino, Gagner, Gentileschi, Kini, Fukuyama,
Feng and Diamond 2004). Gastric bypass led to reduced fasting GIP levels in
diabetic patients whereas no changes in GIP levels were found in non-diabetics.
Bose et al also showed no difference in fasting GIP levels after gastric bypass (Bose,
Teixeira, Olivan, Bawa, Arias, Machineni, Pi-Sunyer, Scherer and Laferrère 2010).
Work from Phil Schauer’s unit in accordance with the findings of the previous studies
showed no change in fasting GIP one and four weeks following gastric bypass
(Kashyap, Daud, Kelly, Gastaldelli, Win, Brethauer, Kirwan and Schauer 2010).
Breitman et al showed no change in fasting GIP two and eight weeks after gastric
bypass (Breitman, Saraf, Kakade, Yellumahanthi, White, Hackett and Clements
2011).
In the work by Blandine Laferrere GIP levels in response to an oral glucose tolerance
test increased at one month and remained at this levels 6 and 12 months after
gastric bypass (Laferrère, Heshka, Wang, Khan, McGinty, Teixeira, Hart and Olivan
2007; Bose, Teixeira, Olivan, Bawa, Arias, Machineni, Pi-Sunyer, Scherer and
Laferrère 2010).
Guidone et al studied 10 patients with type 2 diabetes before and one and four
weeks after biliopancreatic diversion using an oral glucose tolerance test (Guidone,
Manco, Valera-Mora, Iaconelli, Gniuli, Mari, Nanni, Castagneto, Calvani and
61
Mingrone 2006). Fasting GIP levels as well as the postprandial GIP response
decreased one week postoperatively and remained unchanged at four weeks.
Fasting GIP levels do not change six weeks after gastric banding according to study
by Usinger et al (Usinger, Hansen, Kristiansen, Larsen, Holst and Knop 2011). Shak
et al showed no change in fasting GIP 6 and 12 months after gastric banding (Shak,
Roper, Perez-Perez, Tseng, Francois, Gamagaris, Patterson, Weinshel, Fielding,
Ren and Blaser 2008).
Metabolic Surgery and Enteroglucagon and OXM
Kellum et al showed that gastric bypass was associated with an exaggerated
enteroglucagon response to glucose (Kellum, Kuemmerle, O'Dorisio, Rayford,
Martin, Engle, Wolf and Sugerman 1990). Furthermore enteroglucagon appears to
be a marker of the dumping syndrome after gastric bypass. Laferrère et al
demonstrated a 2-fold peak of OXM levels rose in response to oral glucose and the
peak of OXM was significantly correlated with GLP-1 and PYY (Laferrère, Swerdlow,
Bawa, Arias, Bose, Oliván, Teixeira, McGinty and Rother 2010).
Metabolic Surgery and PP
No changes in PP were detected after gastric bypass in one study (le Roux, Aylwin,
Batterham, Borg, Coyle, Prasad, Shurey, Ghatei, Patel and Bloom 2006). Sundbom

62
et al showed that PP concentrations decreased on day 1 after gastric bypass and
subsequently returned to preoperative levels (Sundbom, Holdstock, Engström and
Karlsson 2007). A prospective study of patients undergoing gastric banding showed
that a low PP meal response preoperatively was associated with greater weight loss
postoperatively (Dixon, le Roux, Ghatei, Bloom, McGee and Dixon 2011). The
findings allowed the authors to hypothesise that low PP postprandial response may
be a predictor of greater weight loss after gastric banding.
Metabolic Surgery and bile acids
Patti et al has shown in a cross-sectional study of three groups; patients after gastric
bypass, individuals matched to preoperative BMI and individuals matched to current
BMI (Patti, Houten, Bianco, Bernier, Larsen, Holst, Badman, Maratos-Flier, Mun,
Pihlajamaki, Auwerx and Goldfine 2009). Total serum bile acid concentrations were
higher after gastric bypass and were inversely correlated with 2-h post-meal glucose
and fasting triglycerides as well as positively correlated with adiponectin and peak
GLP-1. Total bile acids strongly correlated inversely with thyrotrophic hormone.
The increase in plasma bile acids was reflected in both primary and secondary bile
acids. The authors found no change in FGF19, a marker of bile acid absorption from
the ileum and regulator of bile acids synthesis. The main limitation of this study was
the cross-sectional design. Although control groups matched for preoperative and
postoperative weight loss, the effect of rapid weight loss itself cannot be excluded.

63
Hence prospective studies need to be conducted to establish the role of bile acids in
the effect of metabolic surgery.

64
Table 3: Summary of gut hormone changes after RYGB (Pournaras and le
Roux 2010).
Gut hormone Basal level Postprandial
GLP-1 Unchanged Increased
PYY Unchanged Increased
Ghrelin Inconclusive Decreased
CCK Unchanged Unchanged
GIP Decreased Unknown
PP Unchanged Unchanged
Bile acids Increased Unknown

65
Hypothesis
This thesis deals with the following hypotheses. Firstly I hypothesise that gastric
bypass leads to improved glycaemic control in a weight loss independent manner.
Secondly, that one of the mechanisms for this observation involves gut hormones
and particularly the incretin GLP-1. Finally, I hypothesise that another mechanism is
the change in bile flow which contributes to improved glucose metabolism.

66
2. Glycaemic control after metabolic surgery
2.1 Introduction
The purpose of this chapter is to provide the evidence that the effect of gastric
bypass on glycaemic control is not only related to weight loss. During the period of
the research undertaken, the concept of diabetes remission was introduced and
subsequently new criteria were proposed. Initially the discontinuation of medication
with acceptable measurements of fasting glucose was reported (Pories, Swanson,
MacDonald, Long, Morris, Brown, Barakat, deRamon, Israel and Dolezal 1995).
Anecdotally this could lead to patients stopping their medication as they considered
themselves “cured”. There were also conflicts within the multidisciplinary team with
diabetologists being sceptical regarding the effects of metabolic surgery and
metabolic surgeons being over enthusiastic regarding the effects of surgery on
diabetes. The lack of a strict definition did not help this. The common example of
patients remaining postoperatively on Metformin, an effective and proven cost-
effective treatment, and hence not considered on remission was associated with
disappointment of patients and surgeons. More important was the issue of follow-up
from a diabetes point of view. A patient who is regularly told that they are cured of
their diabetes are likely to forego life-saving follow up such as regular BP recordings,
eye tests, renal function test.

67
A consensus group comprising experts in endocrinology, diabetes education,
transplantation, metabolism, metabolic surgery and haematology–oncology
proposed new definitions of partial and complete remission of type 2 diabetes (Buse,
Caprio, Cefalu, Ceriello, Del Prato, Inzucchi, McLaughlin, Phillips, Robertson,
Rubino, Kahn and Kirkman 2009). The input of haematologists and oncologists was
deemed valuable as they do deal with the concept of remission of cancer in their
routine practice. The implication of these recommendations was that a standard
metric was proposed for reporting rates of diabetes remission allowing comparison
between different procedures from different units in future. Secondly, the more strict
criteria for glycaemic control remission may affect treatment options suggesting that
patients may benefit from hypoglycaemic treatment after metabolic surgery. Finally
opening the debate of optimal glycaemic control after metabolic surgery can now be
facilitated.
The remission rate after metabolic surgery using the new criteria was established for
the first time in the second study described in this chapter.
2.2 Methods
Study 1: Glycaemic control after gastric bypass and gastric banding
This study was performed according to the principles of the Declaration of Helsinki.
The Somerset Research and Ethics committee approved the study (LREC Protocol

68
Number: 05/Q2202/96). Exclusion criteria were pregnancy, substance abuse, more
than two alcoholic drinks per day. Written informed consent was obtained from all
participants.
Selection criteria for study 1 included patients with type 2 diabetes undergoing either
gastric bypass or gastric banding operations. This was not a randomised study.
Data were collected prospectively on 34 consecutive patients with type 2 diabetes.
All operations were performed by the same surgeon in one centre within a period of
three years. It was patient’s choice which determined the type of operation
performed. Participants were informed about the different operations by the
physicians, the surgeons and the dieticians as part of the preoperative consultation.
They were also encouraged to attend patient support groups organised by the British
Obesity Surgery Patients Association.
Fasting glucose, HbA1c, and dosage of anti-diabetic medication were recorded pre-
operatively and during follow-up at 3, 6, 12, 18, 24 and 36 months. Remission of
type 2 diabetes was previously defined as being off diabetes medications with
normal fasting blood glucose (5.6 mmol/l) or HbA1c of less than 6% (Buchwald,
Avidor, Braunwald, Jensen, Pories, Fahrbach and Schoelles 2004; Buchwald, Estok,
Fahrbach, Banel, Jensen, Pories, Bantle and Sledge 2009). This definition was used
in meta-analyses estimating the effect of weight loss surgery on type 2 diabetes
(Buchwald, Avidor, Braunwald, Jensen, Pories, Fahrbach and Schoelles 2004;
Buchwald, Estok, Fahrbach, Banel, Jensen, Pories, Bantle and Sledge 2009).

69
In this study (study 1) remission of type 2 diabetes was defined using the WHO
definition of type 2 diabetes. Therefore remission was achieved when all the below
criteria were met:
1. Fasting plasma glucose below 7 mmol/L in the absence of medical treatment for at
least 3 days.
2. A two hour plasma glucose below 11.1 mmol/L following an oral glucose tolerance
test as specified by the World Health Organisation (Report of a WHO Consultation,
Definition, diagnosis and classification of diabetes mellitus and its complications.
Part 1 Diagnosis and classification of diabetes mellitus. World Health Organization,
Department of Noncommunicable Disease Surveillance, Geneva, 1999).
3. HbA1c below 6% after 3 months of last hypoglycaemic agent usage. This criterion
was added as it was often used in the surgical literature at the time of designing the
experiment (Buchwald, Avidor, Braunwald, Jensen, Pories, Fahrbach and Schoelles
2004; Buchwald, Estok, Fahrbach, Banel, Jensen, Pories, Bantle and Sledge 2009;
O'Brien, Dixon, Laurie, Skinner, Proietto, McNeil, Strauss, Marks, Schachter,
Chapman and Anderson 2006; Schauer, Burguera, Ikramuddin, Cottam, Gourash,
Hamad, Eid, Mattar, Ramanathan, Barinas-Mitchel, Rao, Kuller and Kelley 2003).
The technique used for the bypass was a combination of linear stapler and hand
sewn enterotomy closure for both the gastrojejunostomy and jejuno-jejunostomy, in
an antegastric-retrocolic configuration (Higa, Boone, Ho and Davies 2000). This was

70
a modification of the technique first described by Higa et al (Higa, Boone, Ho and
Davies 2000).
A preoperative low-calorie, low-carbohydrate diet was used for 2 weeks aiming to
reduce perioperative risk by reducing liver size and improving intraoperative
exposure. Intravenous antibiotic prophylaxis with 1.5g cefuroxime and 500mg
metronidazole at induction was routinely used (Pournaras, Jafferbhoy, Titcomb,
Humadi, Edmond, Mahon and Welbourn 2010).
Reverse Trendelenburg position was used with the operating on the right of the
patient and assistant positioned between the legs of the patient. Pneumoperitoneum
was obtained with a Verres needle inserted below the left costal margin at the mid-
clavicular line. Thromboprophylaxis included the routine use of TED stockings and
40 mg of low molecular weight heparin preoperatively and then for 7 days
postoperatively and lower limb pneumatic compression devices intraoperatively.
Five ports were used. An isolated lesser curve-based, 15–20-ml gastric pouch was
created and a retrocolic antegastric Roux limb was made 100 cm long for patients
with a BMI equal to or less than 50 kg/m2 and 150 cm long for patients with BMI of
more than 50 kg/m2. The bilio-pancreatic limb was 25 cm. The gastrojejunostomy
was closed over a 34 Fr bougie. A blue dye leak test via a nasogastric tube was
routinely performed. All hernia defects (jejunojejunostomy, Petersen’s and
mesocolon) were routinely closed with a purse-string suture.

71
An enhanced recovery protocol was used with patients being offered a glass of water
in the recovery room progressing to free fluids on postoperative day 1 and a soft diet
thereafter. The first routine postoperative review in the outpatient department was 6
weeks after discharge with a minimum regular follow-up program for uncomplicated
patients afterwards of 6 months, 12 months postoperatively, and yearly thereafter,
and more intensive follow-up for complex patients.
The surgical technique used for gastric banding was the pars flaccida described by
the Melbourne group (O'Brien, Dixon, Laurie and Anderson 2005). A preoperative
low-calorie, low-carbohydrate diet was used for 2 weeks aiming to reduce
perioperative risk by reducing liver size and improving intraoperative exposure as
with the gastric bypass. Intravenous antibiotic prophylaxis with 1.5g cefuroxime and
500mg metronidazole at induction was routinely used (Pournaras, Jafferbhoy,
Titcomb, Humadi, Edmond, Mahon and Welbourn 2010). Thromboprophylaxis
included the routine use of TED stockings and 40 mg of low molecular weight
heparin preoperatively and then for 7 days postoperatively. Lower limb pneumatic
compression devices intraoperatively. Five ports were used. The Swedish
Adjustable Gastric band® (Ethicon Endo-Surgery) and the LAP-BAND® (Allergan)
bands were used for all gastric banding procedures. The pars flaccida dissection
technique with gastro-gastric tunnelling sutures was the operative method utilised
(O'Brien, Dixon, Laurie and Anderson 2005). The same enhanced recovery protocol
as the one sued for gastric bypass was used with patients being offered a glass of
water in the recovery room progressing to free fluids on postoperative day 1 and a
soft diet thereafter. Follow-up was also similar with the first postoperative review in

72
the outpatient department 6 weeks after discharge. Patients were then seen monthly
and adjustments were performed until optimal reduction in hunger or restriction was
achieved. The adjustments were performed using the indicators described by
Favretti et al (Favretti, O'Brien and Dixon 2002) as seen in table 4. Patients were
seen at least six times in the first year and then once a year minimum (Pournaras,
Osborne, Hawkins, Vincent, Mahon, Ewings, Ghatei, Bloom, Welbourn and le Roux
2010).

73
Table 4. Protocol used for band adjustments from Favretti, O'Brien, Dixon
2002).
Consider adding
fluid
Adjustment not
required
Consider removing fluid
Inadequate weight
loss
Adequate rate of
weight loss
Vomiting, heartburn, reflux into the
mouth
Rapid loss of satiety
after meals
Eating reasonable
range of food
Coughing spells, wheezing and
choking, especially at night
Increased volume of
meals
No negative
symptoms
Difficulty coping with broad range of
foods
Hunger between
meals
Maladaptive eating behaviour

74
Latest follow-up (24-36 months) data were collected. No patient was lost to follow
up.
Study 2: Diabetes remission with the new criteria.
For this study data collection was prospective in three different centres. These were
Imperial Weight Centre, Imperial College, London, UK; Musgrove Park Hospital,
Taunton, UK; Department of Gastrointestinal Surgery, Oslo University Hospital, Aker,
Oslo, Norway. Permission was obtained from the Imperial College Healthcare NHS
Trust Clinical Governance & Patient Safety Committee (Ref:09/808).
All participants were operated between August 2004 and July 2009. Inclusion
criteria were preoperative diagnosis of type 2 diabetes and weight loss surgery.
Patients were reviewed 6 weeks, 6 months and 12 months postoperatively. Median
follow-up was 23 months (range 12-75 months).
According to the 2009 consensus of the American Diabetes Association partial
remission of diabetes was defined as hyperglycaemia (HbA1c<6.5% and fasting
glucose 5.6–6.9 mmol/l) at least 1 year after surgery in the absence of active
hypoglycaemic pharmacologic therapy or ongoing procedures. Complete remission
was defined as a return to normal measures of glucose metabolism (HbA1c < 6%,
fasting glucose < 5.6 mmol/l) at least 1 year after surgery without hypoglycaemic
pharmacologic therapy or ongoing procedures (Buse, Caprio, Cefalu, Ceriello, Del
Prato, Inzucchi, McLaughlin, Phillips, Robertson, Rubino, Kahn and Kirkman 2009).

75
Statistical analysis
Data were analyzed using SPSS version 14 (SPSS Inc., Chicago, IL). Results were
expressed as number (%), mean ± SD or median (range). Time to glucose below 7
mmol/L (below the World Health Organization definition of diabetes which includes
fasting plasma glucose ≥ 7.0 mmol/l) off all medication was compared between
operative groups by log-rank test (study 1). The Mann-Whitney test was used for
non-parametric demographic data and the unpaired t-test was used for parametric
demographic data in study 1. Fisher’s exact test and the Freeman-Halton extension
of the Fisher’s exact test were used to compare categorical data and one-way
ANOVA was used to compare continuous data for study 2. A p value of ≤ 0.05 was
considered significant.
2.3 Results
Study 1: Glycaemic control after gastric bypass and gastric banding
The number of diabetic and non diabetic patients undergoing gastric bypass (n =
109) and gastric banding (n = 107) during the study period (between January 2004
and January 2007) was similar suggesting that the clinicians involved in the patients
care and particularly the surgeon did not have a preference for one procedure versus

76
the other, hence reducing although not eliminating the risk of bias. Thirty four
consecutive patients with type 2 diabetes on hypoglycaemic treatment presenting for
weight loss surgery were identified (16%). Twenty two of these chose to undergo
Roux-en-Y gastric bypass and 12 laparoscopic adjustable gastric banding. The two
groups were well matched for demographic characteristics, duration of diabetes or
pre- and post-operative BMI (Table 5).

77
Table 5. Study 1: Patient characteristics presented as Mean (standard
deviation) except where the median (range) is indicated. *p<0.05 (t-test, Mann-
Whitney, Fisher’s exact test).
Bypass Banding *p value
Age (years) 46.0 ± 9.6 47.4 ± 10.9 0.71
Pre-op Weight (kg) 137.4 ± 22.9 137.7 ± 31.8 0.97
Pre-op BMI 47.4 ± 7.2 47.1 ± 7.1 0.90
Pre-op HbA1c 9.1 ± 1.9 8.4 ± 1.7 0.29
Duration of diabetes (years) 7.0 (1-18) 5.5 (1-14) 0.61
Proportion on insulin pre-op (%) 12/22 (54%) 4/12 (33%) 0.04
Follow-up (months) 29.5 ± 8.0 33.0 ± 7.5 0.21
% Total Weight Loss 29.5 ± 8.4 28.5 ± 10.0 0.76
% Excess BMI Loss 63.3 (30.8-
103.2)
62.3(45.1-105.9) 0.92
BMI at follow-up 33.0 ± 5.2 32.6 ± 5.1 0.80
HbA1c at follow-up 6.2 ± 1.2 6.5 ± 1.2 0.59

78
Although patients lost weight postoperatively they remained in the obese state with a
mean BMI of 33 ± 5.2 kg/m2 after gastric bypass and 32.6 ± 5.1 kg/m2 after gastric
banding. There was no statistically significant difference between the two groups in
weight at 3, 6, 12, 18, 24 and 36 months (Figure 1).
HbA1c improved significantly after both procedures (p < 0.001 compared to
preoperatively for both groups). Fasting plasma glucose levels were 6.6 ± 2.7
mmol/L and 7.3 ± 2.4 mmol/L for the gastric bypass and gastric banding groups
respectively (p = 0.43) at latest follow-up. The time to a fasting plasma glucose
below 7 mmol/L off all medication was significantly shorter for gastric bypass than
gastric banding, with a hazard ratio of 8.2, (p = 0.001, 95% confidence interval 1.8 to
36.7).
Fifteen out of 22 patients undergoing gastric bypass patients (68%) were in
remission as defined for study 1 at 12 months postoperatively (Figure 2). In contrast
no gastric banding patients achieved remission and this was a statistically significant
difference at the level of p<0.001. Weight loss at the same time point was similar
(p=0.14) between the groups with 25.2 ± 8.2 % for gastric bypass and 20.4 ± 9.1 %
for gastric banding. Sixteen out of 22 patients undergoing gastric bypass (72%)
were in remission compared to two gastric band patients (17%) at maximum follow
up and again this was significant (p = 0.01). However weight loss remained similar
(p = 0.76) between the groups with 29.5 ± 8.4 % for gastric bypass and 28.5 ± 10 %
for gastric banding. There was no correlation between weight loss and HbA1c

79
improvement after gastric bypass with Pearson r of 0.3196, 95% confidence interval
-0.1180 to 0.6532 and p of 0.1471 (Figure 3).

80
Figure 1. Weight loss over time for gastric bypass (n = 22) and gastric banding
(n = 12) patients over a 3 year period.
Gastric bypass
100
80
60
40
20
0
0 12 24 36
Time (months)
Percentage
of
preoperative
weight
Gastric band
Months 0 3 6 12 24 36
Band n=22 12 12 12 12 12 8
Bypass n=12 22 22 22 22 22 11

81
Figure 2. Kaplan-Meier curve for time to remission of type 2 diabetes in
patients who had gastric bypass (solid line) or gastric banding (broken line)
over a 3 year period.
100
80
60
40
20
0
0 12 24 36
Time (months)
Percentage
with
diabetes
Gastric bypass
Gastric band
Months 0 3 6 12 24 36
Band n=22 12 12 12 12 12 8
Bypass n=12 22 22 22 22 22 11
p=0.001

82
Figure 3. Correlation between % weight loss and HbA1c improvement after
gastric bypass. Pearson r=0.3196, 95% confidence interval -0.1180 to 0.6532,
p=0.1471.
0 10 20 30 40 500
2
4
6
8
% weight loss
Hb
A1c im
pro
vem
en
t

83
The severity of diabetes as demonstrated by the number of patients on insulin
treatment preoperatively was worse in the bypass group (12 of 22 gastric, 54%
compared to the gastric banding group (4 of the 12, 33%) (p = 0.04).
In terms of length of stay there was no difference in median length of stay for gastric
bypass between patients with diabetes (n = 22, 4 days range 1-114) or without
diabetes (n = 87, 3 days range 1- 44) (p=0.47). For gastric banding there was no
difference in median length of stay between patients with diabetes (n = 12, 1 day
range 1-2) or without diabetes (n = 95, 1 day range 1-3) (p=0.68). Diabetic and non
diabetic patients after bypass stayed longer in hospital than patients after banding (p
<0.001).
There was one early complication in a diabetic patient who was re-operated on day 1
post gastric bypass for a small bowel enterotomy. The patient made a full recovery
and was discharged following a 114-day stay (Pournaras, Jafferbhoy, Titcomb,
Humadi, Edmond, Mahon and Welbourn 2010). The non diabetic patient that
required hospital admission for 44 days had an anastomotic leak and also made a
full recovery (Pournaras, Jafferbhoy, Titcomb, Humadi, Edmond, Mahon and
Welbourn 2010).

84
Study 2: Diabetes remission with the new American Diabetes Association criteria.
The demographic characteristics of the 209 patients included in this study can be
seen on Table 6. The prevalence of type 2 diabetes before surgery was 36 out of
136 patients (26%) at Oslo University Hospital Aker, 93 out of 551 (17%) at
Musgrove Park Hospital and 80 out of 319 (25%) at Imperial College Healthcare
NHS Trust.

85
Table 6. Patient characteristics and type 2 diabetes remission rates 23 months
(range 12-75) postoperatively.
Total
n=209
Gastric
bypass
n=160
Sleeve
gastrectomy
n=19
Gastric
banding
n=30
p values
Age (years) 48 ± 10 47 ± 9 53 ± 14 46 ± 10 0.041
Women, N (%) 137
(66%)
105
(66%) 11 (58%) 21 (70%) 0.695
Insulin usage before
surgery, N (%) 63 (30%) 51 (32%) 6 (32%) 6 (19%) 0.457
BMI (kg/m2)
before surgery
after surgery
48 ± 7
35 ± 7
48 ± 7
34 ± 6
50 ± 8
42 ± 6
47 ± 9
36 ± 8
0.390
0.002
Fasting glucose (mmol/L)
before surgery
after surgery
9.6 ± 3.6
6.3 ± 2.6
9.8 ± 3.6
6.0 ± 2.1
8.9 ± 4.2
8.0 ± 5.3
7.4 ± 0.7
6.5 ± 2.1
0.144
0.004
HbA1C (%)
before surgery
after surgery
8.0 ± 1.9
6.2 ± 1.2
8.1 ± 1.9
6.2 ± 1.2
7.5 ± 1.5
6.8 ± 1.7
7.7 ± 1.5
6.3 ± 0.7
0.388
0.081
Complete remission with
2009 criteria, N (%) 72 (34%) 65 (41%) 5 (26%) 2 (7%) 0.0004
Partial remission with
2009 criteria, N (%) 28 (13%) 25 (16%) 1 (5%) 2 (7%) 0.301
Remission with previous
definition, N (%)
103
(49%) 92 (58%) 6 (32%) 5 (17%) <0.0001

86
The remission rate of type 2 diabetes following after weight loss surgery was
significantly lower with the new criteria (72 of 209 patients, 34%) than with the
previous definition (103 of 209, 49%) (p=0.003). As seen on figure 4, the newly
defined remission rate was 41% after gastric bypass (65 of 160 patients), 26% for
sleeve gastrectomy (five of 19 patients) and 7% for gastric banding (two of 30
patients). The remission rate after gastric bypass was significantly lower compared
to the previous definition used (p=0.003).
There was a significant improvement in HbA1c levels for all groups postoperatively
(p<0.001) and HbA1c levels were 6.2 ± 1.2% after gastric bypass, 6.8 ± 1.7% after
sleeve gastrectomy and 6.3 ± 0.7% after gastric banding (p=0.081 between groups).

87
Figure 4. Diabetes remission for gastric bypass, sleeve gastrectomy and
gastric banding with the new American Diabetes Association definition and the
previous definition. * p<0.001 between groups # p<0.01 compared to previous
definition

88
2.4 Discussion
In study 1 we performed a comparison in glycaemic control and diabetes remission
in patients undergoing gastric bypass and gastric banding in a single centre.
Although this was not a randomised trial, both groups were matched for age, sex and
BMI before and after surgery. At latest follow up significantly more patients had
fasting plasma glucose concentration below 7 mmol/L without hypoglycaemic
treatment after gastric bypass than after gastric banding (72% vs 17%). Furthermore
the diabetes remission rate over time was more rapid after gastric bypass. The
findings of this study suggest that the improved glycaemic control may be
independent of weight loss.
Different studies comparing glycaemic control after gastric bypass and gastric
banding also suggested that glycaemic and diabetes related outcomes were more
favourable after gastric bypass (Bowne, Julliard, Castro, Shah, Morgenthal and
Ferzli 2006; Parikh, Ayoung-Chee, Romanos, Lewis, Pachter, Fielding G and Ren
2007). The remission rate for the gastric bypass group is comparable to other
studies; however the remission rate for the gastric banding group was lower than
previously published O’Brien, Dixon, Laurie, Skinner, Proietto, McNeil, Strauss,
Marks, Schachter, Chapman and Anderson 2006; Schauer, Burguera, Ikramuddin,
Cottam, Gourash, Hamad, Eid, Mattar, Ramanathan, Barinas-Mitchel, Rao, Kuller
and Kelley 2003; Bowne, Julliard, Castro, Shah, Morgenthal and Ferzli 2006; Parikh,
Ayoung-Chee, Romanos, Lewis, Pachter, Fielding and Ren 2007; Kim, Daud, Ude,
DiGiorgi, Olivero-Rivera, Schrope, Davis, Inabnet and Bessler 2006; Weber, Mueller,
Bucher, Wildi, Dindo, Horber, Hauser and Clavien 2004; Dixon and O’Brien 2002).

89
This can be explained by the stricter definition used for the remission of type 2
diabetes in comparison to other studies (le Roux, Welbourn, Werling, Osborne,
Kokkinos, Laurenius, Lönroth, Fändriks, Ghatei, Bloom and Olbers 2007; Parikh,
Ayoung-Chee, Romanos, Lewis, Pachter, Fielding G and Ren 2007; Kim, Daud,
Ude, DiGiorgi, Olivero-Rivera, Schrope, Davis, Inabnet and Bessler 2006; Weber,
Mueller, Bucher, Wildi, Dindo, Horber, Hauser and Clavien 2004; Dixon and O’Brien
2002; Levy, Fried and Santini 2007). Remission for this study was defined as fasting
plasma glucose below 7 mmol/L and 2 hour post oral glucose tolerance test plasma
glucose below 11.1 mmol/L with a HbA1c below 6% being off all hypoglycaemic
treatment. Also all participants required antihyperglycaemic agents and a significant
proportion of them needed insulin reflecting severe disease with reduced beta cell
reserve. The duration of the disease prior to surgery was prolonged in our
population with a median of 7 years in the bypass group and 5.5 years in the
banding group. All these factors are associated with inferior outcomes after weight
loss surgery (Schauer, Burguera, Ikramuddin, Cottam, Gourash, Hamad, Eid, Mattar,
Ramanathan, Barinas-Mitchel, Rao, Kuller and Kelley 2003).
Schauer et al reported inferior weight loss after gastric bypass in diabetic patients
compared to non diabetic patients, although the reason for this has not been
elucidated (Schauer, Burguera, Ikramuddin, Cottam, Gourash, Hamad, Eid, Mattar,
Ramanathan, Barinas-Mitchel, Rao, Kuller and Kelley 2003). This may explain the
similar weight loss between the two groups in this study. It is recognised that
frequent follow-up for band adjustments is associated with better weight loss and this
may also be the cause of the similar weight loss between the groups (Shen, Dugay,

90
Rajaram, Cabrera, Siegel and Ren 2004). Finally Kim et al reported similar weight
loss between banding and bypass although their population was not diabetic (Kim,
Daud, Ude, DiGiorgi, Olivero-Rivera, Schrope, Davis, Inabnet and Bessler 2006).
Limitations of study 1 are the lack of randomisation, and the relatively small size of
the groups. However the groups were well matched.
Study 2 is the first report evaluating the effect of the 2009 criteria on diabetes
remission rates after weight loss surgery. The complete diabetes remission rate was
significantly lower than the previously defined remission rate on the same population.
Glycaemic control as measure with HbA1c was similar between different procedures
although there was a significant difference in the usage of hypoglycaemic
medication.
The concept of remission changed throughout the period of this research project.
Although for study 1 we used a very strict definition, the 2009 criteria are robust and
are rapidly becoming accepted as the gold standard (Buse, Caprio, Cefalu, Ceriello,
Del Prato, Inzucchi, McLaughlin, Phillips, Robertson, Rubino, Kahn and Kirkman
2009). The impressive outcomes of weight loss surgery, the reported remission of
type 2 diabetes and the introduction of “metabolic surgery” have led to increased
interest in the field and study 1 has contributed to the evidence base supporting the
weight loss independent effect of gastric bypass on glucose metabolism. It is study
2, however, that can lead to a more rational approach in the field of metabolic

91
surgery with realistic expectations from surgeons, diabetologists and patients.
Furthermore the findings of study 2 may lead to a focus on achieving good glycaemic
control rather than remission from type 2 diabetes. And more importantly a shift in
the metabolic surgical literature away from glycaemic control and aiming towards the
reduction of microvascular and macrovascular complications associated with
diabetes (UKPDS 33 1998; Ray, Seshasai, Wijesuriya, Sivakumaran, Nethercott,
Preiss, Erqou and Sattar 2009).
Remission may be low in this population due to the reduced beta cell reserve.
Patients treated in the NHS tend to have a higher comorbidity burden, with long
standing type 2 diabetes, often on insulin. Data regarding these characteristics were
not available for study 2, but from study 1 the above statement can be supported.
Patients on the early stages of type 2 diabetes are more likely to achieve remission
Schauer, Burguera, Ikramuddin, Cottam, Gourash, Hamad, Eid, Mattar,
Ramanathan, Barinas-Mitchel, Rao, Kuller and Kelley 2003). On the other hand,
patients with long standing, difficult to control type 2 diabetes may benefit more from
surgery as other treatment options are limited and less likely to succeed. Operating
on this population may be associated with a higher perioperative risk. Identifying the
patients who are likely to benefit more from metabolic surgery, calculate the risk and
optimise outcomes remain burning issues in the field.
Limitations of the study include the relatively low numbers of type 2 diabetes patients
in the gastric banding and sleeve gastrectomy groups and the lack of randomisation.
92
Also there was no data available on the duration of diabetes. The 20.8% prevalence
of patients with diabetes is similar to the one reported in other studies (Buchwald,
Avidor, Braunwald, Jensen, Pories, Fahrbach and Schoelles 2004; Buchwald, Estok,
Fahrbach, Banel, Jensen, Pories, Bantle and Sledge 2009). The proportion of
patients with insulin treated type 2 diabetes was similar to the one reported in the UK
& Ireland National Bariatric Surgery Registry (Welbourn, Fiennes, Kinsman and
Walton 2011).
In conclusion, gastric bypass leads to the remission of type 2 diabetes in a weight
loss independent manner. The 2009 criteria are associated with a lower remission
rates after metabolic surgery than previously thought. However metabolic surgery
leads to improved glycaemic control.

93
3. The mechanism of action of metabolic surgery is partly due to gut hormone
modulation.
3.1 Introduction
The question raised from chapter 2 is that if it is not the weight loss which leads to
the remission of type 2 diabetes then what the mechanism is. In a group of patients
for whom access to the gastric remnant was available, I was able to test two different
routes of a meal test controlling for weight loss. I hypothesised that the first
postoperative days, before any substantial weight loss has occurred, is the period
when most of these changes occur. Therefore I investigated the postprandial
changes in glucose, insulin and gut hormones in the first weeks after gastric bypass.
Finally establishing the long term effect of gastric bypass was possible in the third
study of this chapter.
3.2 Methods
Study 1: The effect of the altered nutrient route in glucose metabolism and the gut
hormone response
This study was approved by the Clinical Governance and Patient Safety committee
of Imperial College Healthcare NHS Trust (reference number: 10/807) and was
performed according to the declaration of Helsinki. Informed consent was obtained

94
from five patients who had undergone gastric bypass in the Imperial Weight Centre.
All patients were type 2 diabetic prior to surgery and were in remission, achieving
normoglycaemia with no hypoglycaemic medication at the time of participation in the
study. The weight loss achieved was 29.9 ± 4.6 % and the mean BMI was reduced
from 43.2 ± 1.9 preoperatively to 29.9 ± 2.4 kg/m2 (p=0.001).
Secondary to surgical complications participants in this study were unable to feed
using the enteral route and hence all had a functioning gastrostomy tube providing
access to the gastric remnant, duodenum and proximal jejunum. The causes of the
surgical complications are listed in table 7. All participants had fully recovered
(tolerating an oral diet and sustaining a stable weight) by the time they entered the
study (14 ± 4 months postoperatively, range 9-24 months) following conservative or
surgical treatment.

95
Table 7: List of complications leading to inability to feed with the enteral route.
Patient 1 Münchausen syndrome
Patient 2 Twist at the gastro-eosophageal junction
causing severe dysphagia.
Patient 3 Twist at the gastro-eosophageal junction
causing severe dysphagia.
Patient 4 Twist at the gastro-eosophageal junction
causing severe dysphagia.
Patient 5 Twist at the gastro-eosophageal junction
causing severe dysphagia.

96
Participants were examined at 08.00 following an overnight fast on two different
occasions with a 3 to 6 day-interval. A 410ml solution containing 75 g of glucose,
287 kcal (Lucozade Energy Original, GlaxoSmithKline) was given orally on day one
(to ensure that participants could tolerate the volume orally), and via gastrostomy on
the second occasion. Figure 5 is a schematic illustration of the gastrointestinal
glucose route after oral and gastrostomy loading. A venous catheter was placed in a
large vein and blood samples were collected prior to and 15, 30, 60, 90, 120, 150
and 180 minutes following the glucose test. All samples were collected in tubes
containing EDTA and aprotinin and were immediately centrifuged and stored in a -
80°C freezer until further analysis.
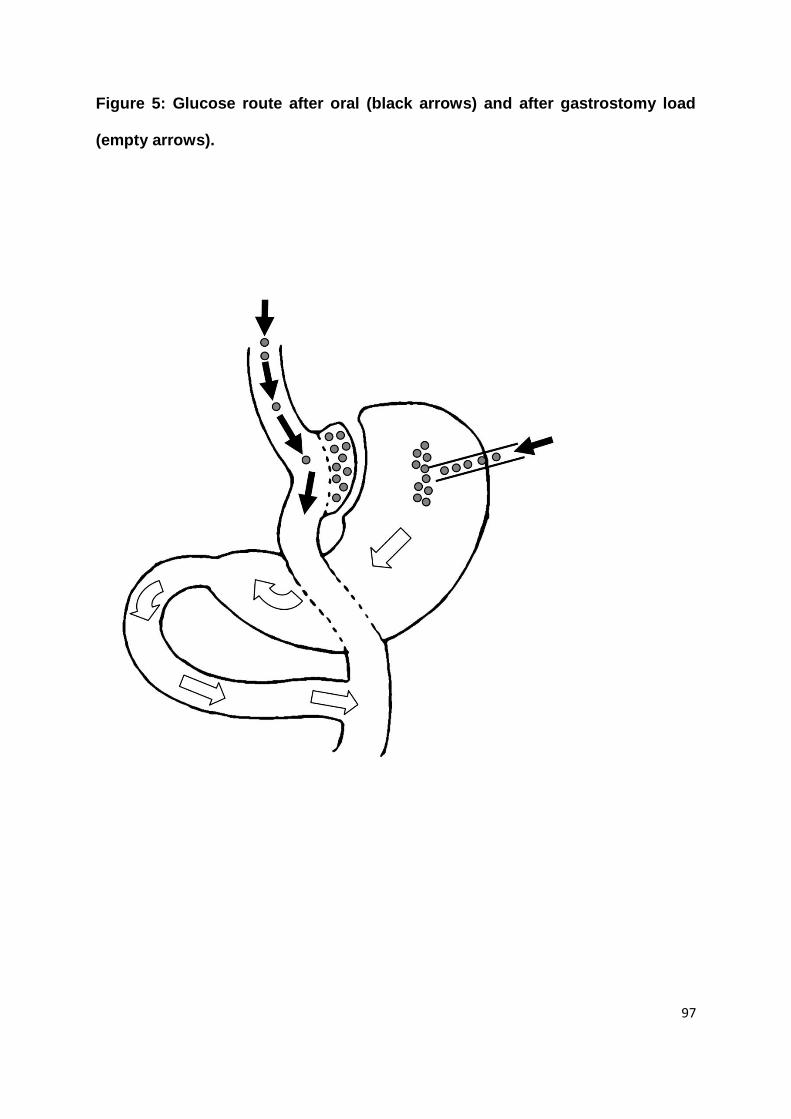
97
Figure 5: Glucose route after oral (black arrows) and after gastrostomy load
(empty arrows).

98
Glucose levels were measured with an automated glucose analyser (Abbott
laboratories, Chicago USA) and insulin levels with an automated chemiluminescent
immunoassay (Abbott laboratories, Chicago, USA).
For the measurement of gut hormones all samples were assayed in duplicate. PYY-
like immunoreactivity was measured with a specific and sensitive radioimmunoassay
(Savage, Adrian, Carolan, Chatterjee and Bloom 1987). The assay measured the
biologically active components, the full length (PYY1-36) and the fragment (PYY3-36).
Antiserum (Y21) was produced in a rabbit against synthetic porcine PYY (Bachem,
UK) coupled to bovine serum albumin with glutaraldehyde and used at a final dilution
of 1:50000. This antibody cross-reacts fully with the biologically active circulating
forms of human PYY, but not with pancreatic polypeptide, neuropeptide Y, or any
other known gastrointestinal hormone (Adrian, Ferri, Bacarese-Hamilton, Fuessl,
Polak and Bloom 1985). 125I-labeled PYY was prepared by the Iodogen method and
purified by high pressure liquid chromatography. The specific activity of the 125I-
labelled PYY was 54 Bq per femtomole. The assay was performed in a total volume
of 700 µL of 0.06 M phosphate buffer, pH 7.26, containing 0.3 % bovine serum
albumin. The samples were incubated for 3 days at 4 ºC before separation of free
and antibody-bound label by sheep anti-rabbit antibody. Two hundred µL of plasma
was assayed, while 200 µL of PYY-free, Haemacel colloid fluid was added to
standards and other reference tubes to neutrilise any non-specific assay
interference. The assay has been reported to detect changes of 2 pmol/L, with an
intra-assay coefficient of variation (CV) of 5.8 % and an interassay CV of 9.8 %.

99
Plasma GLP-1 was measured in duplicate by an established in-house
radioimmunoassay. The GLP-1 assay detected changes of 7.5 pmol/L, with an intra-
assay CV of 6.1 % (Kreymann, Williams, Ghatei and Bloom 1987).
Study 2: Changes in glucose metabolism and the gut hormone response in the initial
postoperative period after gastric bypass.
This study was performed according to the principles of the Declaration of Helsinki.
The Somerset Research and Ethics committee approved the study (LREC Protocol
Number: 05/Q2202/96). Exclusion criteria included pregnancy, substance abuse,
more than 2 alcoholic drinks per day. Written informed consent was obtained from
all participants.
A group of type 2 diabetic, morbidly obese patients undergoing gastric bypass in the
Department of Bariatric and Metabolic Surgery, Musgrove Park Hospital, Taunton
(n=17), were compared with three different control groups including patients a) with
type 2 diabetes and obesity undergoing gastric banding (n=9) to control for the effect
of general anaesthetic, laparoscopy and surgical trauma b) patients with type 2
diabetes and obesity undergoing very low calorie diet for one week (n=15) to control
for the effect of reduced food intake in the immediate postoperative period and c)
non insulin resistant obese subjects undergoing gastric bypass (n=5). All
participants underwent a two week diet of 1000 kcal prior to the intervention.
Diabetic patients were optimised in terms of glycaemic control with the aid of
pharmacotherapy and lifestyle intervention under the guidance of physicians with a

100
special interest in obesity and type 2 diabetes for a minimum six month period
preoperatively. None of the participants was on insulin therapy during the period of
the study. Furthermore there was no difference in the usage of oral hypoglycaemic
treatment between the groups including patients with diabetes. Time points were
pre-operatively and day 2, 4, 7 and 42 postoperatively. For the very low calorie diet
group there was no 42 day time point as this intervention only lasted for one week.
The technique used for the bypass was a combination of linear stapler and hand
sewn enterotomy closure for both the gastrojejunostomy and jejuno-jejunostomy, in
an antegastric-retrocolic configuration (Higa, Boone, Ho and Davies 2000). This was
a modification of the technique first described by Higa et al (Higa, Boone, Ho and
Davies 2000).
A preoperative low-calorie, low-carbohydrate diet was used for 2 weeks aiming to
reduce perioperative risk by reducing liver size and improving intraoperative
exposure. Intravenous antibiotic prophylaxis with 1.5g cefuroxime and 500mg
metronidazole at induction was routinely used (Pournaras, Jafferbhoy, Titcomb,
Humadi, Edmond, Mahon and Welbourn 2010).
Reverse Trendelenburg position was used with the operating on the right of the
patient and assistant positioned between the legs of the patient. Pneumoperitoneum
was obtained with a Verres needle inserted below the left costal margin at the mid-
clavicular line. Thromboprophylaxis included the routine use of TED stockings and

101
40 mg of low molecular weight heparin preoperatively and then for 7 days
postoperatively and lower limb pneumatic compression devices intraoperatively.
Five ports were used. An isolated lesser curve-based, 15–20-ml gastric pouch was
created and a retrocolic antegastric Roux limb was made 100 cm long for patients
with a BMI equal to or less than 50 kg/m2 and 150 cm long for patients with BMI of
more than 50 kg/m2. The bilio-pancreatic limb was 25 cm. The gastrojejunostomy
was closed over a 34 Fr bougie. A blue dye leak test via a nasogastric tube was
routinely performed. All hernia defects (jejunojejunostomy, Petersen’s and
mesocolon) were routinely closed with a purse-string suture.
An enhanced recovery protocol was used with patients being offered a glass of water
in the recovery room progressing to free fluids on postoperative day 1 and a soft diet
thereafter. The first routine postoperative review in the outpatient department was 6
weeks after discharge with a minimum regular follow-up program for uncomplicated
patients afterwards of 6 months, 12 months postoperatively, and yearly thereafter,
and more intensive follow-up for complex patients.
The surgical technique used for gastric banding was the pars flaccida described by
the Melbourne group (O'Brien, Dixon, Laurie and Anderson 2005). A preoperative
low-calorie, low-carbohydrate diet was used for 2 weeks aiming to reduce
perioperative risk by reducing liver size and improving intraoperative exposure as
with the gastric bypass. Intravenous antibiotic prophylaxis with 1.5g cefuroxime and
500mg metronidazole at induction was routinely used (Pournaras, Jafferbhoy,

102
Titcomb, Humadi, Edmond, Mahon and Welbourn 2010). Thromboprophylaxis
included the routine use of TED stockings and 40 mg of low molecular weight
heparin preoperatively and then for 7 days postoperatively. Lower limb pneumatic
compression devices intraoperatively. Five ports were used. The Swedish
Adjustable Gastric band® (Ethicon Endo-Surgery) and the LAP-BAND® (Allergan)
bands were used for all gastric banding procedures. The pars flaccida dissection
technique with gastro-gastric tunnelling sutures was the operative method utilised
(O'Brien, Dixon, Laurie and Anderson 2005). The same enhanced recovery protocol
as the one sued for gastric bypass was used with patients being offered a glass of
water in the recovery room progressing to free fluids on postoperative day 1 and a
soft diet thereafter. Follow-up was also similar with the first postoperative review in
the outpatient department 6 weeks after discharge. Patients were then seen monthly
and adjustments were performed until optimal reduction in hunger or restriction was
achieved. The adjustments were performed using the indicators described by
Favretti et al (Favretti, O'Brien and Dixon 2002) as seen in table 4. Patients were
seen at least six times in the first year and then once a year minimum (Pournaras,
Osborne, Hawkins, Vincent, Mahon, Ewings, Ghatei, Bloom, Welbourn and le Roux
2010).
Following a 12 hour fast, a venous catheter was placed in a large vein and blood
samples were collected. For the bypass surgery group further samples were
obtained at 15, 30, 60, 90, 120, 150 and 180 minutes following a standard semi-
liquid meal containing 400 kcal. The meal macronutrient content was 48.8%
carbohydrate, 10.2% protein and 41% fat. All samples were collected in tubes

103
containing EDTA and aprotinin and were immediately centrifuged and stored in a -
80°C freezer until further analysis. Glucose levels were measured with an
automated glucose analyser (Abbott laboratories, Chicago USA) and insulin levels
with an automated chemiluminescent immunoassay (Abbott laboratories, Chicago,
USA). Delta insulin was defined as the difference between a 0 minute and 15 minute
insulin measurement (le Roux, Welbourn, Werling, Osborne, Kokkinos, Laurenius,
Lönroth, Fändriks, Ghatei, Bloom and Olbers 2007). Insulin resistance was
measured with the Homeostatic Model Assessment (HOMA-IR) Matthews, Hosker,
Rudenski, Naylor, Treacher and Turner 1985).
Plasma GLP-1 was measured in duplicate by an established in-house
radioimmunoassay. The GLP-1 assay detected changes of 7.5 pmol/L, with an intra-
assay CV of 6.1 % (Kreymann, Williams, Ghatei and Bloom 1987).
Study 3: The long term gut hormone response after gastric bypass.
This study was also performed according to the principles of the Declaration of
Helsinki. The Somerset Research and Ethics committee approved the study (LREC
Protocol Number: 05/Q2202/96). Exclusion criteria included pregnancy, substance
abuse, more than two alcoholic drinks per day and aerobic exercise for more than 30
min three times per week. Written informed consent was obtained from all
participants.

104
Thirty-four participants were studied cross-sectionally at four different time points,
preoperatively (n=17), and 12 (n=6), 18 (n=5) and 24 (n=6) months after gastric
bypass. Another group of patients (n=6) were studied prospectively.
The technique used for the bypass was a combination of linear stapler and hand
sewn enterotomy closure for both the gastrojejunostomy and jejuno-jejunostomy, in
an antegastric-retrocolic configuration (Higa, Boone, Ho and Davies 2000). This was
a modification of the technique first described by Higa et al (Higa, Boone, Ho and
Davies 2000).
A preoperative low-calorie, low-carbohydrate diet was used for 2 weeks aiming to
reduce perioperative risk by reducing liver size and improving intraoperative
exposure. Intravenous antibiotic prophylaxis with 1.5g cefuroxime and 500mg
metronidazole at induction was routinely used (Pournaras, Jafferbhoy, Titcomb,
Humadi, Edmond, Mahon and Welbourn 2010).
Reverse Trendelenburg position was used with the operating on the right of the
patient and assistant positioned between the legs of the patient (Pournaras,
Jafferbhoy, Titcomb, Humadi, Edmond, Mahon and Welbourn 2010).
Pneumoperitoneum was obtained with a Verres needle inserted below the left costal
margin at the mid-clavicular line. Thromboprophylaxis included the routine use of

105
TED stockings and 40 mg of low molecular weight heparin preoperatively and then
for 7 days postoperatively and lower limb pneumatic compression devices
intraoperatively. Five ports were used. An isolated lesser curve-based, 15–20-ml
gastric pouch was created and a retrocolic antegastric Roux limb was made 100 cm
long for patients with a BMI equal to or less than 50 kg/m2 and 150 cm long for
patients with BMI of more than 50 kg/m2 (. The bilio-pancreatic limb was 25 cm .
The gastrojejunostomy was closed over a 34 Fr bougie. A blue dye leak test via a
nasogastric tube was routinely performed. All hernia defects (jejunojejunostomy,
Petersen’s and mesocolon) were routinely closed with a purse-string suture
(Pournaras, Jafferbhoy, Titcomb, Humadi, Edmond, Mahon and Welbourn 2010).
An enhanced recovery protocol was used with patients being offered a glass of water
in the recovery room progressing to free fluids on postoperative day 1 and a soft diet
thereafter (Pournaras, Jafferbhoy, Titcomb, Humadi, Edmond, Mahon and Welbourn
2010).
Following a 12 hour fast, a venous catheter was placed in a large vein and blood
samples were collected. For the bypass surgery group further samples were
obtained at 15, 30, 60, 90, 120, 150 and 180 minutes following a standard semi-
liquid meal containing 400 kcal. The meal macronutrient content was 48.8%
carbohydrate, 10.2% protein and 41% fat. All samples were collected in tubes
containing EDTA and aprotinin and were immediately centrifuged and stored in a -
80°C freezer until further analysis. GLP-1 and PYY levels were measure as

106
described in study 2. Visual analogue scales (VAS) were used to measure hunger
and satiety immediately before consumption of the meal and at 60, 120, and 180
minutes later. The VAS can be seen in Figure 6.

107
Figure 6. Visual Analogue Scales for hunger and satiety.
Please put a mark crossing the line at the point that best describes your responses
to these two questions. A mark at 0 would indicate that you have no hunger at all or
that you feel completely empty. A mark at 100 would indicate that you feel extremely
hungry or that you feel completely full.
How hungry do you feel?
0 100
(not hungry at all) (extremely hungry)
How full do you feel?
0 100
(completely empty) (completely full)

108
For the measurement of gut hormones all samples were assayed in duplicate. PYY-
like immunoreactivity was measured with a specific and sensitive radioimmunoassay
(Savage, Adrian, Carolan, Chatterjee and Bloom 1987). The assay measured the
biologically active components, the full length (PYY1-36) and the fragment (PYY3-36).
Antiserum (Y21) was produced in a rabbit against synthetic porcine PYY (Bachem,
UK) coupled to bovine serum albumin with glutaraldehyde and used at a final dilution
of 1:50000. This antibody cross-reacts fully with the biologically active circulating
forms of human PYY, but not with pancreatic polypeptide, neuropeptide Y, or any
other known gastrointestinal hormone (Adrian, Ferri, Bacarese-Hamilton, Fuessl,
Polak and Bloom 1985). 125I-labeled PYY was prepared by the Iodogen method and
purified by high pressure liquid chromatography. The specific activity of the 125I-
labelled PYY was 54 Bq per femtomole. The assay was performed in a total volume
of 700 µL of 0.06 M phosphate buffer, pH 7.26, containing 0.3 % bovine serum
albumin. The samples were incubated for 3 days at 4 ºC before separation of free
and antibody-bound label by sheep anti-rabbit antibody. Two hundred µL of plasma
was assayed, while 200 µL of PYY-free, Haemacel colloid fluid was added to
standards and other reference tubes to neutrilise any non-specific assay
interference. The assay has been reported to detect changes of 2 pmol/L, with an
intra-assay coefficient of variation (CV) of 5.8 % and an interassay CV of 9.8 %.
Plasma GLP-1 was measured in duplicate by an established in-house
radioimmunoassay. The GLP-1 assay detected changes of 7.5 pmol/L, with an intra-
assay CV of 6.1 % (Kreymann, Williams, Ghatei and Bloom 1987).

109
Statistical analysis
For studies 1 and 2 results were analysed using GraphPad Prism version 5.00 for
Windows (GraphPad Software, San Diego, California, USA). Data were expressed
as mean ± SEM. Values for the area under the curve were calculated with the use of
the trapezoidal rule. For study 1 analysis of variance (ANOVA) with post hoc
Dunnett test were used for HOMA-IR, delta insulin and GLP-1 responses. For study
2 plasma levels of insulin, GLP-1, PYY and glucose following the two glucose
loadings were analyzed with a two-way group (between subjects) x time (within
subjects) ANOVA. Post-hoc Bonferroni tests for each concentration were applied
when there was a significant group x time interaction. For study 3 results were
analysed using SPSS statistical software (SPSS Inc., Chicago, IL). End points were
compared with the use of 2-tailed, paired Student t tests or ANOVA. A p≤0.05 was
considered significant for all three studies.
3.3 Results
Study 1: The effect of the altered nutrient route in glucose metabolism and the gut
hormone response
There was a significant difference in plasma insulin, GLP-1 and PYY (all p<0.01)
between the oral and gastrostomy glucose loading (Figures 7a, b, c and d and table
8). There was a significant main effect of time and a significant group x time

110
interaction for insulin, GLP-1 and PYY (all p<0.001). Glucose levels recovered to
baseline earlier after the oral route compared to gastrostomy (p<0.001). There was
a significant group x time interaction (p<0.001), but no significant main group effect
for glucose levels (p=0.84).

111
Table 8: Two-way ANOVA values comparing oral and gastrostomy tube
glucose load as a function of group and time for glucose, insulin, insulin, GLP-
1 and PYY plasma levels following oral and gastrostomy tube glucose load as
a function of group and time.
Time Group
Time
X Group
Glucose F(7,57)=5.81; p<0.001 F(1,57=0.04; p=0.84 F(7;57)=4.26;
p<0.001
Insulin F(7,57)=7.64; p<0.001 F(1,57)=8.88; p=0.004 F(7,57)=5.87;
p<0.001
GLP-1 F(7,58)=10.51;
p<0.001
F(1,58)=32.08;
p<0.001
F(7,58)=9.10;
p<0.001
PYY F(7,58)=8,79; p<0.001 F(1,58)=96.77;
p<0.001
F(7,58)=7.61;
p<0.001

112
Figure 7: Plasma levels of (a) glucose, (b) insulin, (c) GLP-1 and (d) PYY
following oral (black circles) and gastrostomy (open circles) glucose load.
Data are expressed as mean ± SEM. When two-way ANOVA revealed a
significant group x time interaction, post-hoc Bonferroni test was used for
time point to time point analysis between the two groups (*p<0.05, ***p<0.001).
0 30 60 90 120 150 1800
50
100
150
200
******
Time [min]
Insu
lin
mU
/mL
0 30 60 90 120 150 1800
200
400
600
800
***
***
Time [min]
GL
P-1
pm
ol/L
0 30 60 90 120 150 1800
20
40
60
80
***
***
***
* *
Time [min]
PY
Y p
mo
l/L
0 30 60 90 120 150 1800
5
10
15 *
Time [min]
Glu
co
se m
mo
l/L
a b
c d

113
Study 2: Changes in glucose metabolism and the gut hormone response in the initial
postoperative period after gastric bypass.
The demographic characteristics of the participants of the different groups are
summarised in Table 9. Insulin resistance was reduced by 44% at 7 days after
gastric bypass in the diabetic patients (Figure 8). As early as day 4, there was a
significant difference in the HOMA-IR between the bypass and the banding group
(p<0.05). Insulin resistance did not change after gastric banding or a 1000 kcal diet.
(Fig. 2). HOMA-IR remained unchanged within the normal range in the non-diabetic
gastric bypass group (Figure 8). The insulin response as measured with delta insulin
increased at 2 days after gastric bypass in both diabetic and non-diabetic groups as
seen in Figure 9. In accordance with the enhanced insulin production, the
postprandial GLP-1 response also increased in both groups (Figure 10).

114
Table 9. Demographic characteristics of patients undergoing standard meal
tests pre-operatively and at day 2, 4, 7 and 42. Comparisons were made
between patients with diabetes (DM) who had very low calorie diet, gastric
banding, gastric bypass or patients who did not have diabetes but underwent
gastric bypass.
Diet + DM Band + DM Bypass + DM Bypass
non DM
p-
value
Number 15 9 17 5
Age (years) 43.7 ± 10 48.1 ± 8.7 48.3 ± 8.6 42.4 ±
6.9
NS
Pre-op Weight
(kg)
139.0 ± 37.5 129.5 ±
28.2
138.9 ± 35.5 143.8 ±
21.6
NS
Pre-op BMI 46.9 ± 8.1 43.5 ± 11.7 48.0 ± 5.7 52.2 ±
3.3
NS
Pre-op glucose 5.9 ± 1.1 6.1 ± 1.2 7.1 ± 2 5.9 ±
1.1
NS
Pre-op HOMA-IR 7.1 ± 3 8.8 ± 9.6 9.2 ± 7.8 2.1 ± 0.4 <0.05

115
Figure 8. Insulin resistance measure with HOMA in patients with type 2
diabetes following a 1000 kcal diet with no surgery over 7 days (n=15) and
gastric band (n=9), gastric bypass (n=17) and patients without diabetes
following gastric bypass (n=5) over a period of 42 days. The solid line
indicates the level at which HOMA-IR is considered to indicate insulin
resistance.
* p<0.05 compared to pre-operative state
# p<0.05 compared with gastric banding at same time point
† p<0.05 compared to very low calorie diet at same time point
pre 2 4 7 42
Days
0
2
4
6
8
10
12
HO
MA
-IR
Diet n=15 Band n=9 Bypass n=17 BypassnonDM
* *##†
#
n=5

116
Figure 9. Delta insulin defined as the difference between fasting and 15 min
postprandial insulin after gastric bypass in patients with type 2 diabetes (n=17)
and without type 2 diabetes (n=5). * p<0.05 compared to pre-operative state for
both groups.
pre 2 4 7 42
Days
0
10
20
30
40
50
60
Delt
a i
nsu
lin
(IU
/L)
at
15m
in
Bypass DM n= 17 Bypass non DM n= 5
* ** *

117
Figure 10. Postprandial GLP-1 response after a 400 kcal meal following gastric
bypass in patients with type 2 diabetes (n=17) and without type 2 diabetes
(n=5). Measured with the area under the curve over a 3-hour period. * p<0.05
compared to pre-operative state for both groups.
pre 2 4 7 42
Days
0
3000
6000
9000
AU
C G
LP
-1 m
in.p
mo
l/L
Bypass DM n= 17 Bypass non DM n= 5
* ** *

118
Study 3: The long term gut hormone response after gastric bypass.
The demographic characteristics of the groups of this study are demonstrated in
Table 10. The BMI in the postoperative groups was significantly lower than the
preoperative group, but there was no significant difference between the three
postoperative groups (Figure 11). The PYY postprandial response curve was
increased postoperatively in both the cross-sectional and the prospective
comparisons, (p<0.05) (Figure 12 and Figure 13). This was not the case for the
GLP-1 response (p=0.189 for the prospective comparison) (Figure 14 and Figure
15). Satiety was increased postoperatively (p<0.05) (Figure 16).

119
Table 10: Demographic characteristics of patients in cross-sectional study and
prospective study.
Group Number (n) Age Sex (No of women)
preoperative 17 47.8 ± 2.0 11
12 month postoperatively 6 45.2 ± 4.0 5
18 months postoperative 5 49.6 ± 3.3 3
24 months postoperative 6 43.3 ± 4.1 6
prospective study 6 47.8 ± 2.0 5

120
Figure 11. BMI before and 12, 18 and 24 months after gastric bypass.
* p<0.05 compared to the pre-operative group
BMI (kg/m2)
* * *

121
Figure 12. The PYY postprandial response in the cross-sectional study (12, 18
and 24 months).
* p<0.05 compared to the pre-operative group
PYY (pmol/L/min)
* * *

122
Figure 13. The PYY postprandial response in the prospective study (18-24
months).
PYY (pmol/L/min)
*

123
Figure 14. The GLP-1 response in the cross-sectional study (12, 18 and 24
months).
GLP-1 (pmol/L/min)

124
Figure 15. The GLP-1 postprandial response in the prospective study (18-24
months).
GLP-1 (pmol/L/min)

125
Figure 16. Satiety as measured with the VAS in the prospective study.
* p<0.05 compared to the pre-operative group
VAS (mm)
* * *

126
3.4 Discussion
Gastric bypass has an effect on glucose handling which is independent of weight
loss and study 1 offers confirmation for this. Gastric bypass leads to the
improvement of glycaemic control via a dual mechanism of increased insulin
production and at the same time reduced insulin resistance in the first week after
surgery as demonstrated in study 2. The increased insulin production is associated
with an enhanced GLP-1 response. This improved glucose homeostasis can be
explained in part by the altered nutrient delivery as seen in study 1. Finally the
enhanced gut hormone response seen in the above studies is sustained in the long
term, accompanied by increased postprandial satiety demonstrated in both the
cross-sectional and prospective designs of study 3.
The paradoxical reduction in insulin resistance is independent of weight loss, the
effect of the surgical trauma, which usually leads to increased insulin resistance and
reduced food intake (Robertson, Bickerton, Dennis, Vidal, Jewell and Frayn 2005).
This weight loss independent effect suggested in the chapter two of this thesis and
further evidenced by the data from studies 1 and 2 in this chapter has been
attributed to alterations in the hormonal milieu (Rubino, Gagner, Gentileschi, Kini,
Fukuyama, Feng and Diamond 2004; Rubino, Forgione, Cummings, Vix, Gnuli,
Mingrone, Castagneto and Marescaux 2006). However the findings of this study are
in contrast to a study by WJ Lee et al who showed reduced insulin resistance after
banding and diet comparable to gastric bypass (Lee, Lee, Ser, Chen, and Chen
127
2008). Of note is the fact that the time point used by Lee et al was four weeks when
the effect of weight loss may have caused bias (Lee, Lee, Ser, Chen, and Chen
2008).
The enhanced insulin response as measured with delta insulin is associated with
enhanced GLP-1 response supporting the hypothesis that the increased GLP-1
response is responsible in part for the effect of bypass on insulin production. On the
other hand, the increase in insulin production is marked and perhaps other
mechanisms may contribute. In addition the reduced insulin resistance measured at
fasting is associated with unchanged fasting GLP-1 levels and therefore cannot be
explained by the GLP-1 response.
The concept of proximal gut exclusion was first suggested in an animal model, the
Goto-Kakizaki, a type of non-obese rats who spontaneously develop type 2 diabetes
(Rubino, Forgione, Cummings, Vix, Gnuli, Mingrone, Castagneto and Marescaux
2006). Rubino demonstrated in a landmark experiment that glucose homeostasis
improved after duodenal-jejunal bypass, compared to gastrojejunostomy (Rubino,
Forgione, Cummings, Vix, Gnuli, Mingrone, Castagneto and Marescaux 2006).
When the gastrojejunostomy group underwent a procedure which excluded the
duodenum, these rats experienced improved glucose tolerance (Rubino, Forgione,
Cummings, Vix, Gnuli, Mingrone, Castagneto and Marescaux 2006). And when the
duodenal passage of nutrients was restored in the former group, impaired glucose
tolerance recurred supporting the proximal gut hypothesis further.

128
Previously a report of a single case of a patient similar to our cohort has been
described in the literature (Dirksen, Hansen, Madsbad, Hvolris, Naver, Holst and
Worm 2010). The authors presented results similar to ours comparing the oral and
the gastrostomy tube route of nutrients (Dirksen, Hansen, Madsbad, Hvolris, Naver,
Holst and Worm 2010).
Cross-sectional studies have previously suggested that gastric bypass is associated
with an enhanced PYY and GLP-1 postprandial response (Korner, Bessler, Cirilo,
Conwell, Daud, Restuccia and Wardlaw 2005; Rodieux, Giusti, D'Alessio, Suter and
Tappy 2008; Vidal, Nicolau, Romero, Casamitjana, Momblan, Conget, Morínigo and
Lacy 2009). Fasting levels of PYY have been showed to increase post gastric
bypass as demonstrated in prospective studies (Reinehr, Roth, Schernthaner, Kopp,
Kriwanek and Schernthaner 2007; Garcia-Fuentes, Garrido-Sanchez, Garcia-
Almeida, Garcia-Arnes, Gallego-Perales, Rivas-Marin, Morcillo, Cardona and
Soriguer 2008) whilst there are also data showing increased postprandial PYY (Borg,
le Roux, Ghatei, Bloom, Patel and Aylwin 2006; Stratis, Alexandrides, Vagenas and
Kalfarentzos 2006; Karamanakos, Vagenas, Kalfarentzos and Alexandrides 2008;
Morínigo, Vidal, Lacy, Delgado, Casamitjana and Gomis 2008) and GLP-1 (Borg, le
Roux, Ghatei, Bloom, Patel and Aylwin 2006; Laferrère, Teixeira, McGinty, Tran,
Egger, Colarusso, Kovack, Bawa, Koshy, Lee, Yapp and Olivan 2008; de Carvalho,
Marin, de Souza, Pareja, Chaim, de Barros Mazon, da Silva, Geloneze, Muscelli and
Alegre 2009; Morínigo, Lacy, Casamitjana, Delgado, Gomis and Vidal 2006) levels
up to 12 months postoperatively.

129
For the first study the non random allocation of the oral and gastrostomy route of the
glucose load is a limitation. However, it was important to ensure that patients can
tolerate the glucose load orally and taking into consideration any possible intolerance
or hypoglycaemic episodes. Therefore instead of the standard dose, the same
glucose load could be given to the participants. This was not necessary in the study
as all participants tolerated the standard load. All tests were performed within 6 days
for each participant minimising the effect of bias or changes in glucose homeostasis.
Limitations of study 2 include the use of HOMA-IR as a marker of insulin resistance
instead of the gold standard, the Hyperinsulinaemic Euglycaemic Glucose Clamp.
Although this approach would have been more accurate, particularly in elucidating
the effect of the bypass on insulin resistance postprandially, it was deemed more
invasive and associated with considerably higher risk in the initial postoperative
period. Furthermore electing a time point and therefore reducing repeated
measurement would not have been possible as there was no available information
regarding the time scale of the change of insulin resistance after gastric bypass.
Finally for the long term investigation of the gut hormone response the limitations are
the small number of participants and the cross-sectional design. This may be
responsible for the lack of statistical difference in the GLP-1 response. The
prospective part of the study confirmed the findings of the cross-sectional study.
In conclusion gastric bypass leads increased insulin production and reduced insulin
resistance. The increased insulin production is associated with an increased
postprandial incretin response. Furthermore gastric bypass leads to increased

130
postprandial gut hormone response, associated with increased satiety in the long
term. However the mechanism of this increased gut hormone response as well as
the weight loss independent reduction in insulin resistance has not been investigated
in the above experiments and this is the topic of the next chapter.

131
4. The role of bile acids in improving glycaemic control after metabolic
surgery.
4.1 Introduction
Following the results presented in the previous chapters I hypothesised that the
altered anatomy after gastric bypass affects bile delivery to the terminal ileum and
leads to elevated plasma bile acids after gastric bypass surgery. Changes in bile flow
result in increased satiety gut hormone responses, reduced food intake and weight
loss. In this chapter this hypothesis was tested in humans after gastric bypass
surgery and two animal models of altered bile flow were used in order to explore the
potential mechanisms involved further.
4.2 Methods
The canine studies were approved by the ethics committee of Onderstepoort
Vetinary School, University of Pretoria, South Africa and the rat studies were
approved by the Home Office UK (PL 70-6669).
Study 1: Human model
The human study was approved by the Somerset Research and Ethics committee
approved the study (LREC Protocol Number: 05/Q2202/96) and was performed
according to the principles of the Declaration of Helsinki. Written informed consent
was obtained from all participants. Exclusion criteria included pregnancy, substance

132
abuse, more than 2 alcoholic drinks per day. Twelve patients undergoing gastric
bypass (seven females and five males) with a mean age of 45.2 ± 2.7 years and a
mean BMI of 49.8 ± 1.5 were recruited. Six patients undergoing gastric banding
(four females and 2 males), with a mean age of 45.4 ± 2.6 years and a mean BMI of
44 ± 2.0 kg/m2 were used as a control group. All procedures were performed
laparoscopically by one surgeon.
The technique used for the bypass was a combination of linear stapler and hand
sewn enterotomy closure for both the gastrojejunostomy and jejuno-jejunostomy, in
an antegastric-retrocolic configuration (Higa, Boone, Ho and Davies 2000). This was
a modification of the technique first described by Higa et al (Higa, Boone, Ho and
Davies 2000).
A preoperative low-calorie, low-carbohydrate diet was used for 2 weeks aiming to
reduce perioperative risk by reducing liver size and improving intraoperative
exposure. Intravenous antibiotic prophylaxis with 1.5g cefuroxime and 500mg
metronidazole at induction was routinely used (Pournaras, Jafferbhoy, Titcomb,
Humadi, Edmond, Mahon and Welbourn 2010).
Reverse Trendelenburg position was used with the operating on the right of the
patient and assistant positioned between the legs of the patient. Pneumoperitoneum
was obtained with a Verres needle inserted below the left costal margin at the mid-
clavicular line. Thromboprophylaxis included the routine use of TED stockings and

133
40 mg of low molecular weight heparin preoperatively and then for 7 days
postoperatively and lower limb pneumatic compression devices intraoperatively.
Five ports were used. An isolated lesser curve-based, 15–20-ml gastric pouch was
created and a retrocolic antegastric Roux limb was made 100 cm long for patients
with a BMI equal to or less than 50 kg/m2 and 150 cm long for patients with BMI of
more than 50 kg/m2. The bilio-pancreatic limb was 25 cm. The gastrojejunostomy
was closed over a 34 Fr bougie. A blue dye leak test via a nasogastric tube was
routinely performed. All hernia defects (jejunojejunostomy, Petersen’s and
mesocolon) were routinely closed with a purse-string suture.
An enhanced recovery protocol was used with patients being offered a glass of water
in the recovery room progressing to free fluids on postoperative day 1 and a soft diet
thereafter. The first routine postoperative review in the outpatient department was 6
weeks after discharge with a minimum regular follow-up program for uncomplicated
patients afterwards of 6 months, 12 months postoperatively, and yearly thereafter,
and more intensive follow-up for complex patients.
The surgical technique used for gastric banding was the pars flaccida described by
the Melbourne group (O'Brien, Dixon, Laurie and Anderson 2005). A preoperative
low-calorie, low-carbohydrate diet was used for 2 weeks aiming to reduce
perioperative risk by reducing liver size and improving intraoperative exposure as
with the gastric bypass. Intravenous antibiotic prophylaxis with 1.5g cefuroxime and
500mg metronidazole at induction was routinely used (Pournaras, Jafferbhoy,

134
Titcomb, Humadi, Edmond, Mahon and Welbourn 2010). Thromboprophylaxis
included the routine use of TED stockings and 40 mg of low molecular weight
heparin preoperatively and then for 7 days postoperatively. Lower limb pneumatic
compression devices intraoperatively. Five ports were used. The Swedish
Adjustable Gastric band® (Ethicon Endo-Surgery) and the LAP-BAND® (Allergan)
bands were used for all gastric banding procedures. The pars flaccida dissection
technique with gastro-gastric tunnelling sutures was the operative method utilised
(O'Brien, Dixon, Laurie and Anderson 2005). The same enhanced recovery protocol
as the one sued for gastric bypass was used with patients being offered a glass of
water in the recovery room progressing to free fluids on postoperative day 1 and a
soft diet thereafter. Follow-up was also similar with the first postoperative review in
the outpatient department 6 weeks after discharge. Patients were then seen monthly
and adjustments were performed until optimal reduction in hunger or restriction was
achieved. The adjustments were performed using the indicators described by
Favretti et al (Favretti, O'Brien and Dixon 2002) as seen in table 4. Patients were
seen at least six times in the first year and then once a year minimum (Pournaras,
Osborne, Hawkins, Vincent, Mahon, Ewings, Ghatei, Bloom, Welbourn and le Roux
2010).
Following a 12 hour fast, blood was obtained in tubes containing EDTA and
aprotinin. Samples were immediately centrifuged and stored in a -80°C freezer until
analysis.

135
Plasma FGF19 concentration was measured using a quantitative sandwich enzyme
linked immunosorbent assay (ELISA) technique (FGF19 Quantikine ELISA kit,
Catalogue Number DF1900; R&D Systems, Minneapolis, MN 55413, USA).
The FGF19 Quantikine ELISA method utilises a 96 well polystyrene microplate pre-
coated with a mouse monoclonal antibody specific for FGF19. FGF19 standards
were provided by the manufacturer (10ng of recombinant human FGF-19 in a
buffered protein solution, with preservatives, lyophilized). Serum samples (10ng)
were pipetted into the microplate wells. FGF-19 molecules were bound to the
immobilised antibody during a 2 hour incubation period. Buffer concentrate (21mL of
a concentrated solution of buffered surfactant with preservatives) was utilised to
wash unbound molecules. An enzyme-linked polyclonal antibody specific for FGF-
19 (21mL of polyclonal antibody against FGF19 conjugated to horseradish
peroxidise with preservatives) was added to the wells for an incubation period of 2
hours. Following further wash with the objective to remove unbound antibody-
enzyme reagent, a substrate solution formed of colour reagents (12.5mL of stabilised
hydrogen peroxide and 12.5mL of stabilised chromogen) was added to the wells for
a 30 minute period.
Colour development in proportion to the amount of FGF19 bound in the initial step
was observed at this stage. The colour development was terminated with the use of
an acid based stop solution. The optical density of each well was then measured
with a microplate reader capable of measuring absorbance at 450nm, with the
correction wavelength set at 540nm or 570nm. The assay was conducted according
to the manufacturer’s guidelines. Prior to the assay commencement, the unopened

136
kit was stored between 2-8ºC as recommended. All serum samples were measured
in duplicate. The assay results lead to generation of a standard curve, plotting
optical density for the standards versus the concentrations of the standards. These
data were transformed linearised using the log/log paper and regression analysis
applied to the log transformation. The FGF19 concentration in each sample was
then calculated using the absorbance values obtained by the assays on the standard
curve and reading the corresponding concentration.
In order to avoid cross contamination during the procedure, pipette tips were
changed between additions of each standard level, between sample additions, and
between reagent additions. Separate reservoirs were used for each reagent.
Washing of the plates was completed using an automatic plate washer, and to
ensure accuracy plate sealers were suitably employed during incubation steps.
The EDTA plasma samples were analysed for fractionated bile acids using high-
performance liquid chromatography (HPLC) tandem mass spectrometry. The
method was based on that of Tagliocozzi et al and developed using an Ascentis
Express fused core C18 analytical column (Sigma-Aldrich Co., Poole, UK) on a
JascoTM LC 2000 HPLC system (Tokyo, Japan) coupled to a triple quadruple mass
spectrometer API 3200TM (Applied Biosystems, Cheshire, UK) (Tagliacozzi, Mozzi,
Casetta, Bertucci, Bernardini, Di Ilio, Urbani and Federici 2003). Bile acids were
quantified using peak area analysis corrected by comparison to the respective
internal standard, glycine, taurine or unconjugated deuterium-labelled DCA. Bile
acids analysed were chenodeoxycholic acid, DCA, cholic acid and their respective
glycine and taurine conjugates. The method was linear between 0.1 and 10 mmol/L

137
for all bile acids and their conjugates with coefficients of variation ranging from 3.6%
to 8.0% at the lower limit of quantitation (0.1 mmol/L).
Multiple batches were used; interassay coefficient of variations ranging from 1.5% to
6.8% for these bile acids and their conjugates. The method allowed 12 different bile
acids to be measured within the range of 0.1-10μM. The two main plasma bile acids
in humans, glycochenodeoxycholic acid (GCDC) and Glycocholic acid (GCA) were
compared as well as total bile acids, total unconjugated bile acids, total glycine-
conjugated bile acids and total taurine-conjugated bile acids.
Study 2: Canine model
Four male and four female Beagles were fasted overnight and then given a standard
400 g test meal of dog chow (Husky, Purina, South Africa). The composition of the
test meal was 7.5% protein, 2% fat, 1% fibre, 7.5% crude ash and 82% moisture.
Five mL of blood were collected every 30 minutes from 30 minutes before the meal
up to 150 minutes postprandially.
The following day a fentanyl patch was placed and food was withheld overnight.
Following laparotomy the common bile duct was transacted and an 8 French Foley
catheter was placed into the gall bladder. An 8 French feeding tube was advanced
through the pylorus to the duodenum with the most distal point being 5-8 cm distal to
the pylorus. The altered anatomy can be seen in Figure 17. For the first 12 hours
postoperatively the dogs were given ad libitum access to water but not to food.

138
Figure 17. Illustration of the anatomy of the canine experiment showing the
canulation. A Gastrostomy tube was placed into the duodenum close to the
Ampulla of Vater. The common bile duct was ligated and the gallbladder was
canulated to allow drainage of bile.

139
One dog was terminated due to signs of jaundice and infection. The other dogs
received the standard meal of 400 g normal chow at the start of the light phase. At
this time point, as much bile as possible was aspirated from the Foley catheter and
injected through the gastrostomy tube, followed by a 5 mL flush of saline. The
objective was to prevent jaundice and enable as close as normal digestion.
On day 4, 5 and 6 the dogs were randomised to a 180-minute cross over designed
protocol of venous blood collection every 30 minutes, following a standard meal of
400 g dog food only without bile, bile only, without food or 400 g of dog food and bile
in combination.
For the measurement of gut hormones all samples were assayed in duplicate. PYY-
like immunoreactivity was measured with a specific and sensitive radioimmunoassay
(Savage, Adrian, Carolan, Chatterjee and Bloom 1987). The assay measured the
biologically active components, the full length (PYY1-36) and the fragment (PYY3-36).
Antiserum (Y21) was produced in a rabbit against synthetic porcine PYY (Bachem,
UK) coupled to bovine serum albumin with glutaraldehyde and used at a final dilution
of 1:50000. This antibody cross-reacts fully with the biologically active circulating
forms of human PYY, but not with pancreatic polypeptide, neuropeptide Y, or any
other known gastrointestinal hormone (Adrian, Ferri, Bacarese-Hamilton, Fuessl,
Polak and Bloom 1985). 125I-labeled PYY was prepared by the Iodogen method and
purified by high pressure liquid chromatography. The specific activity of the 125I-
labelled PYY was 54 Bq per femtomole. The assay was performed in a total volume
of 700 µL of 0.06 M phosphate buffer, pH 7.26, containing 0.3 % bovine serum

140
albumin. The samples were incubated for 3 days at 4 ºC before separation of free
and antibody-bound label by sheep anti-rabbit antibody. Two hundred µL of plasma
was assayed, while 200 µL of PYY-free, Haemacel colloid fluid was added to
standards and other reference tubes to neutrilise any non-specific assay
interference. The assay has been reported to detect changes of 2 pmol/L, with an
intra-assay coefficient of variation (CV) of 5.8 % and an interassay CV of 9.8 %.
Plasma GLP-1 was measured in duplicate by an established in-house
radioimmunoassay. The GLP-1 assay detected changes of 7.5 pmol/L, with an intra-
assay CV of 6.1 % (Kreymann, Williams, Ghatei and Bloom 1987).
Study 3: Rodent model
Sixteen male Wistar obese rats were randomised to a sham operation which
maintained the normal bile delivery to the duodenum or to an operation that would
deliver bile to the ileum. The bile in duodenum group underwent transections 1 cm
proximal and distal to the drainage point of the common bile duct and reanastomosis
to maintain the normal anatomy but allow for a similar surgical insult. The bile in
ileum group had the same transection of the duodenum, but the proximal and distal
ends of the transected duodenum were anastomosed end to end and continuity
restored. The segment of the duodenum containing the common bile duct was
anastomosed side to side to the distal jejunum, 10 cm proximally to the terminal
ileum. This allowed bile and pancreatic juices to bypass the duodenum and most of
the jejunum. The altered anatomy can be seen in Figure 18.

141
Figure 18. Illustration of the functional anatomy of the bile in ileum group.
Transections 1 cm proximal and distal to the drainage point of the common
bile duct were performed. The proximal and distal ends of the transected
duodenum were anastomosed end to end and continuity of the gastrointestinal
tract was restored. The segment of the duodenum containing the common
bile duct was anastomosed side to side to the distal jejunum, 10 cm proximally
to the terminal ileum.

142
Body weight and food consumption was measured daily at the beginning of the light
phase for 28 days. Faeces were collected over a 24 hour period on day 25. The
rats were then fasted for 12 h before they were terminated and blood samples were
collected.
To evaluate nutrient absorption, faeces were collected over 24 hours on
postoperative days 25 from all rats. The ballistic bomb calorimeter used was
designed by Miller and Payne in the 1950s (Miller and Payne 1959). The process
consisted of three steps. The sample was initially prepared, then a defined amount
of sample was burnt in excess of oxygen and finally the peak temperature detected
was compared with the temperature when a standard material was burnt.
The preparation of the sample, rodent faeces for this experiment, was done over a
48-hour period. Rats were kept separate in single cages and on a predetermined
day all saw dust was removed for a 24 hour period. The faeces were collected at the
end of this period in sterile containers and kept at 4 °C until further analysis. The
samples were dried overnight in an oven. The next day the specimen from each rat
was ground producing a fine powder with the objective to enable satisfactory mixing.
A representative sample weighing 400 mg was placed in a clean crucible.
Due to the low bulk density samples typically were compacted to ensure uniform and
complete combustion. Five hundred µL of water was added and the crucible was
placed on a hot plate to allow evaporation of the water and a formation of a cake like
substrate.

143
Significant malabsorption can cause high fat content in the samples, thus causing a
release that may exceed the measurement capability of the instruments rendering
the measurement invalid. With the recommended oxygen pressure of 25
atmospheres the sample should burn completely without causing a high pressure in
the bomb. With the above considerations a sample weighing 400 mg was selected.
The crucible was then placed on the pillar of the bomb and a standard 5 cm length
sewing cotton was fitted to the firing wire with its free end in contact with the sample.
The bomb body was fitted and the thermocouple inserted. Oxygen was admitted to
a pressure of 25 atmospheres. The galvanometer zeroed and the firing button was
pushed. The peak reading from the galvanometer was recorded during a 30 second
period. The gas pressure was released and the bomb body was removed and
allowed to cool in cold water awaiting assessment of the following sample (Jackson,
Davis and Macdonald 1977).
For the assessment of inflammation serum CRP levels were measured (Rat Serum
CRP ELISA kit Catalogue Number 1010; Alpha Diagnostics International, 6203
Wooldake Center Drive, San Antonio, Texas 78244, USA).
For the measurement of gut hormones all samples were assayed in duplicate. PYY-
like immunoreactivity was measured with a specific and sensitive radioimmunoassay
(Savage, Adrian, Carolan, Chatterjee and Bloom 1987). The assay measured the
biologically active components, the full length (PYY1-36) and the fragment (PYY3-36).
Antiserum (Y21) was produced in a rabbit against synthetic porcine PYY (Bachem,
UK) coupled to bovine serum albumin with glutaraldehyde and used at a final dilution

144
of 1:50000. This antibody cross-reacts fully with the biologically active circulating
forms of human PYY, but not with pancreatic polypeptide, neuropeptide Y, or any
other known gastrointestinal hormone (Adrian, Ferri, Bacarese-Hamilton, Fuessl,
Polak and Bloom 1985). 125I-labeled PYY was prepared by the Iodogen method and
purified by high pressure liquid chromatography. The specific activity of the 125I-
labelled PYY was 54 Bq per femtomole. The assay was performed in a total volume
of 700 µL of 0.06 M phosphate buffer, pH 7.26, containing 0.3 % bovine serum
albumin. The samples were incubated for 3 days at 4 ºC before separation of free
and antibody-bound label by sheep anti-rabbit antibody. Two hundred µL of plasma
was assayed, while 200 µL of PYY-free, Haemacel colloid fluid was added to
standards and other reference tubes to neutrilise any non-specific assay
interference. The assay has been reported to detect changes of 2 pmol/L, with an
intra-assay coefficient of variation (CV) of 5.8 % and an interassay CV of 9.8 %.
Plasma GLP-1 was measured in duplicate by an established in-house
radioimmunoassay. The GLP-1 assay detected changes of 7.5 pmol/L, with an intra-
assay CV of 6.1 % (Kreymann, Williams, Ghatei and Bloom 1987).
Statistical Analysis
Results were analysed using GraphPad Prism version 5.00 for Windows, GraphPad
Software, San Diego California USA. Data were expressed as means ± standard
error of the mean (SEM) when the data follow a Gaussian distribution. When the
data did not follow a Gaussian distribution the median (range) was used. Values for

145
the area under the curve were calculated with the use of the trapezoidal rule. End
points were compared with the use of 2-tailed, paired Student t tests for parametric
data and Mann-Whitney U test for non parametric data. Results were considered
significant if p < 0.05.

146
4.3 Results
Study 1: Human model
There was no statistically significant difference in fasting plasma FGF19 levels
between patients undergoing gastric banding [140ng/L (26-466)] and gastric bypass
[123ng/L (41-406)] preoperatively (p=0.37). FGF19 levels were lower than those
recorded in non-obese individuals (Walters, Tasleem, Omer, Brydon, Dew and le
Roux CW 2009). In the gastric banding group there was no significant change
between preoperative levels of fasting FGF19 and day 4 or 42 postoperatively. After
gastric bypass, fasting levels of plasma FGF19 were significantly increased as early
as day 4 postoperatively compared to preoperatively (p<0.01) as seen in Figure 19.
The enhanced FGF19 levels remained high 42 days postoperatively (p<0.05).

147
Figure 19. Fasting plasma FGF19 concentrations (median and interquartile
ranges) at day 0, 4 and 42 in six gastric banding patients (white bars) and
twelve gastric bypass patients (black bars). * p<0.05 Mann Whitney U test.
Preop Day 4 Day 420
100
200
300
400
Band Bypass
**
FG
F 1
9 (
ng
/L)

148
Levels of fasting total plasma bile acids measured in patients undergoing gastric
banding and gastric bypass preoperatively were similar. On day 4 fasting plasma
bile acids were increased after gastric bypass and there was a significant difference
compared to the gastric banding group. On day 42 after gastric bypass fasting
plasma total bile acid levels were higher compared to preoperative levels as seen in
Figure 20. There was no difference in fasting plasma total bile acid levels before and
42 days after gastric banding.
Similar results with and an increase in the gastric bypass group but not in the gastric
banding group were observed for GLP-1 in the same subjects as seen in Chapter 3,
study 2.
(b)

149
Figure 20. Fasting total plasma bile acid concentrations at day 0, 4 and 42 in
seven gastric banding patients (white bars) and twelve gastric bypass patients
(black bars). * p<0.05 Mann Whitney U test.
Preop Day 4 Day 420
5
10
15
Band Bypass
*
To
tal B
ile A
cid
s (
µM
)
(b)

150
Study 2: Canine model
The responses of GLP-1 and PYY were investigated in this canine model after
stimulation with food alone, bile alone, or a combination of both. At the time of these
experiments, no assay for canine FGF19 level measurement was available.
Baseline GLP-1 and PYY levels were the same preoperatively and postoperatively
validating this model (6936 vs. 7290 for GLP-1 and 6386 vs. 5856 for PYY). Figure
21 shows the area under the curve (AUC) over 180 minutes for the postprandial
GLP-1 response after the standard meal of 400 g dog and Figure 22 for PYY. In the
operated dogs both food alone and bile alone lead to a significant GLP-1 and PYY
response from baseline, although the responses were attenuated. The response to
bile and or food alone was inferior to the combination of food and bile either pre- or
post-operatively.

151
Figure 21. The shows the area under the curve (AUC) for the postprandial
GLP-1 response after 400 g of food in dogs pre-operatively or postoperatively
either receiving food alone without bile (Food), bile alone without food (Bile) or
food and bile in combination (Food+Bile).* p < 0.05
Pre
opBile
Food
Food+Bile
0
2000
4000
6000
8000
10000 **
*
GL
P-1
(p
mo
l/L
/min
)

152
Figure 22. The shows the area under the curve (AUC) for the postprandial PYY
response after 400 g of food in dogs pre-operatively or postoperatively either
receiving food alone without bile (Food), bile alone without food (Bile) or food
and bile in combination (Food+Bile).* p < 0.05
Pre
opBile
Food
Food+Bile
0
2000
4000
6000
8000
10000 **
**
PY
Y (
pm
ol/L
/min
)

153
Study 3: Rodent model
In this rodent model, rats had bile draining into their ileum or duodenum. Both the
plasma GLP-1 levels (Figure 23) and the plasma PYY levels (Figure 24) were higher
in the bile in ileum group than in the bile in duodenum group (p <0.05).

154
Figure 23. Plasma GLP-1 levels in rats with bile draining into their duodenum
or bile draining into their ileum. * p < 0.05.
Bile
in D
uodenum
Bile
in Il
eum
0
20
40
60
80*
GL
P-1
pm
ol/L

155
Figure 24. Plasma PYY levels in rats with bile draining into their duodenum or
bile draining into their ileum. * p < 0.05.
Bile
in D
uodenum
Bile
in Il
eum
0
10
20
30
40
50*
PY
Y p
mo
l/L

156
Both the bile in ileum and bile in duodenum groups lost a similar initial amount of
weight during the first four days while recovering from surgery as seen in Figure 25.
The bile in duodenum group however reached their pre-operative weight within 8
days. The bile in ileum group weighed significantly less than the bile in duodenum
group on day six (p <0.05) and continued to have a lower bodyweight for the duration
of the study (p <0.05). Furthermore Figure 26 shows the rats in the bile in ileum
group ate significantly less than the bile in duodenum group (p <0.05).

157
Figure 25. The weight of rats in bile in duodenum (solid line) and bile in ileum
(broken line) groups before and 28 days after surgery. * p < 0.05.
1 4 8 12 16 20 24 28
Days
200
260
320
380
440
500
Bo
dy
wei
gh
t (g
ram
s)
* * * * * *

158
Figure 26. Food intake of bile in duodenum (solid line) and bile in ileum
(broken line) rats before and 28 days after surgery. * p < 0.05.
0 4 8 12 16 20 24 28
Days
0
10
20
30
40
Fo
od
(gra
ms)
* * * * * * *

159
Faecal parameters 25 days postoperatively did not reveal differences between the
bile in the ileum and the bile in the duodenum groups at the end of the experiment in
dry weight (4.12 g ±�0.20 vs. 4.28 ± 0.18, p = 0.55) or in calorific content (3.58
faecal kcal/24 h ± 0.4 vs. 3.58 ± 0.4, p = 0.91). No increase in inflammation in the
bile in the ileum group was detected compared with the bile in the duodenum group
as evidenced by the similarity in the white cell count (11.5 ± 0.32 x1000/microlitre vs.
11.64 ± 0.42, p = 0.79) or CRP levels (370.88 microg/litre ±�26.03 vs. 378.5
±�21.71 microg/litre, p = 0.83).
4.4 Discussion
Fasting FGF 19 and plasma total bile acids were increased after gastric bypass, but
not after gastric banding.
Food and bile alone lead to the release of GLP-1 and PYY and this was
demonstrated in study 2. Food and bile together (before surgery or after surgery)
resulted in a greater PYY response compared to food alone. Furthermore a trend for
increased GLP-1 levels when food and bile were given together was also observed
but this did not reach statistical significance.
In study 3, in the rodent model, draining endogenous bile and pancreatic fluid 10 cm
proximally to the terminal ileum was associated with increased GLP-1 and PYY,
reduced food intake and body weight.

160
These data allow me to hypothesise that one of the mechanisms by which a gastric
bypass leads to the modification of the satiety gut hormone response could be due to
the passage of undiluted bile via the biliopancreatic limb, a non-physiological
phenomenon, or the altered delivery of bile to the terminal ileum, or a combination of
both.
Exogenous bile salts have been shown to stimulate the release of gut hormones
from the endocrine L-cells such as PYY in rabbit colon explants, in vivo in conscious
dogs and in humans (Ballantyne, Longo, Savoca, Adrian, Vukasin, Bilchik, Sussman
and Modlin 1989; Izukura, Hashimoto, Gomez, Uchida, Greeley and Thompson
1991; Adrian, Ballantyne, Longo, Bilchik, Graham, Basson, Tierney and Modlin
1993). The question of what arrives first in the terminal ileum after gastric bypass;
bile, nutrients or both remains to be answered.
Näslund el showed an increase in CCK after jejuno-ileal bypass (Näslund, Grybäck,
Hellström, Jacobsson, Holst, Theodorsson and Backman 1997). This may lead to
increased flow of bile from the gallbladder or the liver (Näslund, Grybäck, Hellström,
Jacobsson, Holst, Theodorsson and Backman 1997).
Bile may flow in the biliopancreatic limb reaching the distal L-cells in an undiluted
state. Activation of TGR5 by bile acids leads to the stimulation of GLP-1 production
in vitro and may explain the early and exaggerated release of incretin gut hormones
such as GLP-1 and subsequently insulin (Katsuma, Hirasawa, and Tsujimoto 2005).
161
Bile acids may also affect glucose metabolism by weight loss. This could be
attributed the enhanced satiety facilitated by the increase in satiety gut hormones as
seen in Chapter 3, studies 2 and 3. Furthermore bile acids increase energy
expenditure in brown adipose tissue, thus preventing obesity and insulin resistance
via induction of the cyclic-AMP-dependent thyroid hormone activating enzyme type 2
iodothyronine deiodinase (Watanabe, Houten, Mataki, Christoffolete, Kim, Sato,
Messaddeq, Harney, Ezaki, Kodama, Schoonjans, Bianco and Auwerx 2006). This
is achieved via the TGR5 and is consistent with studies in rat models showing that
gastric bypass prevented the decrease in energy expenditure after weight loss
(Bueter, Löwenstein, Olbers, Wang, Cluny, Bloom, Sharkey, Lutz and le Roux 2010;
Stylopoulos, Hoppin and Kaplan 2009).
Activation of the FXRα may also mediate the effects of bile acids on energy
homeostasis via FGF-19 released from ileal enterocytes, leading to improved
metabolic rate and decreased adiposity (Inagaki, Choi, Moschetta, Peng, Cummins,
McDonald, Luo, Jones, Goodwin, Richardson, Gerard, Repa, Mangelsdorf and
Kliewer 2005; Holt, Luo, Billin, Bisi, McNeill, Kozarsky, Donahee, Wang, Mansfield,
Kliewer, Goodwin, Jones 2003). FGF-19 inhibits hepatic gluconeogenesis and
works subsequent to insulin as a postprandial regulator of hepatic carbohydrate
homeostasis (Potthoff, Boney-Montoya, Choi, He, Sunny, Satapati, Suino-Powell,
Xu, Gerard, Finck, Burgess, Mangelsdorf and Kliewer 2011).
A model of studying bile acid metabolism is the use of bile acid sequestrants in
patients with type diabetes. Bile acid sequestrants have been shown to be effective
in improving glycaemic control in patients with type 2 diabetes (Garg and Grundy

162
1994; Fonseca, Rosenstock, Wang, Truitt and Jones 2008; Goldberg, Fonseca,
Truitt and Jones 2008; Staels and Fonseca 2009). Garg et al conducted a
randomised, double blind, crossover study of cholestyramine compared with placebo
with the objective to assess clinical efficacy and tolerability of cholestyramine in
patients with dyslipidaemia and type 2 diabetes (Garg and Grundy 1994). An
unexpected finding was improved glycaemic control with lower mean plasma
glucose, median reduction in urinary glucose excretion and a trend for lower glycated
haemoglobin (Garg and Grundy 1994). Following this observation a randomised,
double blind, placebo controlled, multicentre study was conducted with the objective
to assess the efficacy and safety of a new bile acid sequestrant, colesevelam in
patients with type 2 diabetes with inadequate glycaemic control on sulfonylurea
therapy (Fonseca, Rosenstock, Wang, Truitt and Jones 2008). Colesevelam
improved glycaemic control in this study and reduced LDL cholesterol levels
(Fonseca, Rosenstock, Wang, Truitt and Jones 2008). A similar study with identical
design was conducted in patients with type 2 diabetes and inadequate glycaemic
control on insulin therapy alone or in combination with oral hypoglycaemic agents
(Goldberg, Fonseca, Truitt and Jones 2008). Colesevelam was effective in these
patients for both glycaemic control and lipid management (Goldberg, Fonseca, Truitt
and Jones 2008).
In fact the bile acid sequestrant colevesham has been approved for the treatment of
hyperglycaemia in type 2 diabetes (Rodbard, Jellinger, Davidson, Einhorn, Garber,
Grunberger, Handelsman, Horton, Lebovitz, Levy, Moghissi and Schwartz 2009).
Thus, some of the beneficial metabolic effect of Roux-en-Y gastric bypass on
glycaemic control may be attributed to changes in bile acids. In study 1, the human

163
model, the previous cross sectional observation that fasting total plasma bile acids
are elevated after gastric bypass surgery is confirmed in an experiment with
prospective design (Patti, Houten, Bianco, Bernier, Larsen, Holst, Badman, Maratos-
Flier, Mun, Pihlajamaki, Auwerx, and Goldfine 2009). Furthermore this observation
was recorded at an earlier time point of 42 days after surgery reducing the bias of
the effect of weight loss and reduced food intake. The changes facilitated by bile
may increase satiety and improved glycaemic control via gut hormones as well as a
direct effect on insulin resistance. Therefore bile may be one of the key products of
the proximal gut which transfers a message to the distal gut and to other
metabolically active tissues.
A limitation of study 1, the human model, is fact that the two groups were not
randomised. However the groups were well matched for preoperative patient
characteristics. In study 2, the canine model, migration the feeding tube or the Foley
catheter may have lead to chemical peritonitis and the resulting sepsis may have
affected metabolic pathways. Post-mortem examination of all subjects confirmed the
correct position of both the feeding tube and the Foley catheter. In study 3, the
rodent model, the differential severity and insult of the two surgical procedures, and
perhaps the subsequent dissimilar response to trauma may have led to a different
inflammatory response. This possibility can be excluded due the reported
biochemical and histological markers of inflammation which were similar between the
two groups.
Gastric bypass leads to altered bile flow which subsequently leads to an increase in
fasting total plasma bile acids levels and fasting FGF19. These changes are

164
associated with enhanced postprandial GLP-1 and PYY responses. Changes in the
bile flow may be responsible for some of the metabolic effects observed after gastric
bypass surgery.

165
5. Summary and conclusion
In this thesis the effect of metabolic surgery on glucose metabolism is investigated.
First of all evidence on the weight loss independent effect of gastric bypass, the
basis of the concept of metabolic surgery is provided. Then this effect is dissected
further demonstrating that gastric bypass has a favourable effect on both insulin
production and insulin resistance. The change in insulin production is attributed to
enhanced postprandial GLP-1 production galvanising the concept that gastric bypass
is a gut hormone modulation leading to behavioural (appetite) and glycaemic
modifications. Finally in an attempt to explain the improved insulin resistance, which
is unrelated to GLP-1, the role of bile acids is explored. Bile flow changes after
bypass and leads to a change in plasma bile acids. Furthermore modifying the flow
of bile has effects on the gut hormone response, on appetite and body weight.
This thesis does not explain all the mechanism by which gastric bypass works on
appetite control and glycaemic control. However I have demonstrated that it is not
malabsorption of calories and it is not weight loss alone. Body weight is reduced
after gastric bypass and it is a welcomed change for this population. But weight
changes alone cannot explain the dramatic effect on insulin resistance. The change
in bile acids provides an attractive theory, but this needs to be explored further.
Previous attempts to explain the effects of gastric bypass have focused on the
foregut theory (exclusion of duodenum) versus the hindgut theory (early delivery of
nutrients and bile to the terminal ileum leading to the production of gut hormones).
The data presented here suggest an alternative hypothesis combining the two, in

166
which a product of the proximal gut (bile) acts as a messenger, a hormone even, to
the distal gut.
This thesis also does not fully explain the increase in insulin production. An
enhanced GLP-1 postprandial response is associated with the increase in insulin
production, but other factors may play a role, particularly as this increase is marked.
Changes in Glucagon, GIP and even somatostatin may be responsible and further
work is needed to explore this.
This thesis on its own does not provide the evidence needed for metabolic surgery to
become part of the treatment algorithm for type 2 diabetes. There are no data
available at the moment regarding the effect of gastric bypass on hard endpoints
such as mortality and macrovascular complications. And it will be the provision of
this data that can only change the status quo of metabolic surgery.
But what this thesis does show is that gastric bypass is an effective modality for
glycaemic control. And understanding how this operation works is the duty of the
surgeon performing it. Most surgeons want to know how their operations work. And
if they understand how gastric bypass works, they may be able to make it safer or
more effective.
Exploring the mechanism of action of gastric bypass is also intriguing for the
physiologist as this procedure provides an excellent model of the disease and the
reversal of it. The role of the gut in glucose metabolism is coming into focus again,
because it can now be studied appropriately, but more importantly understanding

167
how metabolic surgery works is useful for the diabetologists. Because they are the
ones who face the patients who experience the burden of the disease.
Understanding how a treatment modality works will make it more available, removing
some of the barriers in the use of metabolic surgery.
The data presented in this thesis can be used to explore the role of the gut as a
target for novel intervention for type 2 diabetes, pharmacological or not. Perhaps it
could lead to the consideration of randomised control trials to explore the role of
metabolic surgery for type 2 diabetes.
There is a distinct lack of level 1 evidence on any aspect of metabolic surgery. The
Holy Grail seems to be “head to head” comparative studies of metabolic surgery and
best medical treatment as this is the gold standard. These studies are more than
welcomed and definitely very important. But level 1 evidence is needed for the use
of these operation in different populations (adolescents, elderly, obese women with
subfertility, lower or higher BMI) and also the timing of the operations (early surgery,
length of optimisation, newly diagnosed diabetics). And the aim of this thesis is to
provide a basis for discussion and collaboration.

168
Reference List
(1) Intensive blood-glucose control with sulphonylureas or insulin compared with
conventional treatment and risk of complications in patients with type 2
diabetes (UKPDS 33). UK Prospective Diabetes Study (UKPDS) Group.
Lancet 1998 Sep 12;352(9131):837-53.
(2) The National Institute of Clinical Excellence 2006. Obesity: the prevention,
identification, assessment and management of overweight and obesity in
adults and
children. 2012.
Ref Type: Internet Communication
(3) Gastrointestinal Surgery for Severe Obesity. NIH Consensus Statement
Online 1991 Mar 25-27. 2012.
Ref Type: Internet Communication
(4) Aasheim ET, Aylwin SJB, Radhakrishnan ST, Sood AS, Jovanovic A, Olbers
T, et al. Assessment of obesity beyond body mass index to determine benefit
of treatment. Clinical Obesity 2011;1:77-84.
(5) Adami GF, Gandolfo P, Campostano A, Meneghelli A, Ravera G, Scopinaro
N. Body image and body weight in obese patients. Int J Eat Disord 1998
Nov;24(3):299-306.

169
(6) Adams TD, Gress RE, Smith SC, Halverson RC, Simper SC, Rosamond WD,
et al. Long-term mortality after gastric bypass surgery. N Engl J Med 2007
Aug 23;357(8):753-61.
(7) Adams TD, Stroup AM, Gress RE, Adams KF, Calle EE, Smith SC, et al.
Cancer incidence and mortality after gastric bypass surgery. Obesity (Silver
Spring) 2009 Apr;17(4):796-802.
(8) Adrian TE, Bloom SR, Bryant MG, Polak JM, Heitz PH, Barnes AJ.
Distribution and release of human pancreatic polypeptide. Gut 1976
Dec;17(12):940-4.
(9) Adrian TE, Ferri GL, Bacarese-Hamilton AJ, Fuessl HS, Polak JM, Bloom SR.
Human distribution and release of a putative new gut hormone, peptide YY.
Gastroenterology 1985 Nov;89(5):1070-7.
(10) Adrian TE, Ballantyne GH, Longo WE, Bilchik AJ, Graham S, Basson MD, et
al. Deoxycholate is an important releaser of peptide YY and enteroglucagon
from the human colon. Gut 1993 Sep;34(9):1219-24.
(11) Afshinnia F, Wilt TJ, Duval S, Esmaeili A, Ibrahim HN. Weight loss and
proteinuria: systematic review of clinical trials and comparative cohorts.
Nephrol Dial Transplant 2010 Apr;25(4):1173-83.
(12) Ashrafian H, le Roux CW, Darzi A, Athanasiou T. Effects of bariatric surgery
on cardiovascular function. Circulation 2008 Nov 11;118(20):2091-102.
(13) Aylwin S, Al-Zaman Y. Emerging concepts in the medical and surgical
treatment of obesity. Front Horm Res 2008;36:229-59.

170
(14) Baggio LL, Drucker DJ. Biology of incretins: GLP-1 and GIP.
Gastroenterology 2007 May;132(6):2131-57.
(15) Ballantyne GH, Longo WE, Savoca PE, Adrian TE, Vukasin AP, Bilchik AJ, et
al. Deoxycholate-stimulated release of peptide YY from the isolated perfused
rabbit left colon. Am J Physiol 1989 Nov;257(5 Pt 1):G715-G724.
(16) Barb D, Williams CJ, Neuwirth AK, Mantzoros CS. Adiponectin in relation to
malignancies: a review of existing basic research and clinical evidence. Am J
Clin Nutr 2007 Sep;86(3):s858-s866.
(17) Batterham RL, Cowley MA, Small CJ, Herzog H, Cohen MA, Dakin CL, et al.
Gut hormone PYY(3-36) physiologically inhibits food intake. Nature 2002 Aug
8;418(6898):650-4.
(18) Batterham RL, Cohen MA, Ellis SM, le Roux CW, Withers DJ, Frost GS, et al.
Inhibition of food intake in obese subjects by peptide YY3-36. N Engl J Med
2003 Sep 4;349(10):941-8.
(19) Batterham RL, le Roux CW, Cohen MA, Park AJ, Ellis SM, Patterson M, et al.
Pancreatic polypeptide reduces appetite and food intake in humans. J Clin
Endocrinol Metab 2003 Aug;88(8):3989-92.
(20) Bays HE, Goldberg RB, Truitt KE, Jones MR. Colesevelam hydrochloride
therapy in patients with type 2 diabetes mellitus treated with metformin:
glucose and lipid effects. Arch Intern Med 2008 Oct 13;168(18):1975-83.
(21) Bergkvist D, Hekmat K, Svensson T, Dahlberg L. Obesity in orthopedic
patients. Surg Obes Relat Dis 2009 Nov;5(6):670-2.

171
(22) Borg CM, le Roux CW, Ghatei MA, Bloom SR, Patel AG, Aylwin SJ.
Progressive rise in gut hormone levels after Roux-en-Y gastric bypass
suggests gut adaptation and explains altered satiety. Br J Surg 2006
Feb;93(2):210-5.
(23) Bose M, Machineni S, Olivan B, Teixeira J, McGinty JJ, Bawa B, et al.
Superior appetite hormone profile after equivalent weight loss by gastric
bypass compared to gastric banding. Obesity (Silver Spring) 2010
Jun;18(6):1085-91.
(24) Bose M, Teixeira J, Olivan B, Bawa B, Arias S, Machineni S, et al. Weight
loss and incretin responsiveness improve glucose control independently after
gastric bypass surgery. J Diabetes 2010 Mar;2(1):47-55.
(25) Bowne WB, Julliard K, Castro AE, Shah P, Morgenthal CB, Ferzli GS.
Laparoscopic gastric bypass is superior to adjustable gastric band in super
morbidly obese patients: A prospective, comparative analysis. Arch Surg 2006
Jul;141(7):683-9.
(26) Bray GA, Gallagher TF, Jr. Suppression of appetite by bile acids. Lancet 1968
May 18;1(7551):1066-7.
(27) Breitman I, Saraf N, Kakade M, Yellumahanthi K, White M, Hackett JA, et al.
The effects of an amino acid supplement on glucose homeostasis,
inflammatory markers, and incretins after laparoscopic gastric bypass. J Am
Coll Surg 2011 Apr;212(4):617-25.

172
(28) Buchwald H, Avidor Y, Braunwald E, Jensen MD, Pories W, Fahrbach K, et al.
Bariatric surgery: a systematic review and meta-analysis. JAMA 2004 Oct
13;292(14):1724-37.
(29) Buchwald H, Estok R, Fahrbach K, Banel D, Jensen MD, Pories WJ, et al.
Weight and type 2 diabetes after bariatric surgery: systematic review and
meta-analysis. Am J Med 2009 Mar;122(3):248-56.
(30) Bueter M, Lowenstein C, Olbers T, Wang M, Cluny NL, Bloom SR, et al.
Gastric bypass increases energy expenditure in rats. Gastroenterology 2010
May;138(5):1845-53.
(31) Buse JB, Caprio S, Cefalu WT, Ceriello A, Del PS, Inzucchi SE, et al. How do
we define cure of diabetes? Diabetes Care 2009 Nov;32(11):2133-5.
(32) Chan JL, Mun EC, Stoyneva V, Mantzoros CS, Goldfine AB. Peptide YY
levels are elevated after gastric bypass surgery. Obesity (Silver Spring) 2006
Feb;14(2):194-8.
(33) Chandarana K, Drew ME, Emmanuel J, Karra E, Gelegen C, Chan P, et al.
Subject standardization, acclimatization, and sample processing affect gut
hormone levels and appetite in humans. Gastroenterology 2009
Jun;136(7):2115-26.
(34) Chandra R, Liddle RA. Cholecystokinin. Curr Opin Endocrinol Diabetes Obes
2007 Feb;14(1):63-7.
(35) Clegg AJ, Colquitt J, Sidhu MK, Royle P, Loveman E, Walker A. The clinical
effectiveness and cost-effectiveness of surgery for people with morbid

173
obesity: a systematic review and economic evaluation. Health Technol Assess
2002;6(12):1-153.
(36) Cohen MA, Ellis SM, le Roux CW, Batterham RL, Park A, Patterson M, et al.
Oxyntomodulin suppresses appetite and reduces food intake in humans. J
Clin Endocrinol Metab 2003 Oct;88(10):4696-701.
(37) Cummings DE, Purnell JQ, Frayo RS, Schmidova K, Wisse BE, Weigle DS. A
preprandial rise in plasma ghrelin levels suggests a role in meal initiation in
humans. Diabetes 2001 Aug;50(8):1714-9.
(38) Cummings DE, Weigle DS, Frayo RS, Breen PA, Ma MK, Dellinger EP, et al.
Plasma ghrelin levels after diet-induced weight loss or gastric bypass surgery.
N Engl J Med 2002 May 23;346(21):1623-30.
(39) Cummings DE, Overduin J. Gastrointestinal regulation of food intake. J Clin
Invest 2007 Jan;117(1):13-23.
(40) de Carvalho CP, Marin DM, de Souza AL, Pareja JC, Chaim EA, de Barros
MS, et al. GLP-1 and adiponectin: effect of weight loss after dietary restriction
and gastric bypass in morbidly obese patients with normal and abnormal
glucose metabolism. Obes Surg 2009 Mar;19(3):313-20.
(41) de Souza SA, Faintuch J, Fabris SM, Nampo FK, Luz C, Fabio TL, et al. Six-
minute walk test: functional capacity of severely obese before and after
bariatric surgery. Surg Obes Relat Dis 2009 Sep;5(5):540-3.
(42) De FE, Mitro N, Gilardi F, Caruso D, Galli G, Crestani M. Coordinated control
of cholesterol catabolism to bile acids and of gluconeogenesis via a novel

174
mechanism of transcription regulation linked to the fasted-to-fed cycle. J Biol
Chem 2003 Oct 3;278(40):39124-32.
(43) De VC, Gregoire F, Lema-Kisoka R, Waelbroeck M, Robberecht P, Delporte
C. Ghrelin degradation by serum and tissue homogenates: identification of the
cleavage sites. Endocrinology 2004 Nov;145(11):4997-5005.
(44) Dirksen C, Hansen DL, Madsbad S, Hvolris LE, Naver LS, Holst JJ, et al.
Postprandial diabetic glucose tolerance is normalized by gastric bypass
feeding as opposed to gastric feeding and is associated with exaggerated
GLP-1 secretion: a case report. Diabetes Care 2010 Feb;33(2):375-7.
(45) Dixon AF, le Roux CW, Ghatei MA, Bloom SR, McGee TL, Dixon JB.
Pancreatic polypeptide meal response may predict gastric band-induced
weight loss. Obes Surg 2011 Dec;21(12):1906-13.
(46) Dixon JB, Dixon ME, O'Brien PE. Body image: appearance orientation and
evaluation in the severely obese. Changes with weight loss. Obes Surg 2002
Feb;12(1):65-71.
(47) Eid GM, Cottam DR, Velcu LM, Mattar SG, Korytkowski MT, Gosman G, et al.
Effective treatment of polycystic ovarian syndrome with Roux-en-Y gastric
bypass. Surg Obes Relat Dis 2005 Mar;1(2):77-80.
(48) Ellacott KL, Halatchev IG, Cone RD. Interactions between gut peptides and
the central melanocortin system in the regulation of energy homeostasis.
Peptides 2006 Feb;27(2):340-9.

175
(49) Faraj M, Havel PJ, Phelis S, Blank D, Sniderman AD, Cianflone K. Plasma
acylation-stimulating protein, adiponectin, leptin, and ghrelin before and after
weight loss induced by gastric bypass surgery in morbidly obese subjects. J
Clin Endocrinol Metab 2003 Apr;88(4):1594-602.
(50) Ferraro KF, Booth TL. Age, body mass index, and functional illness. J
Gerontol B Psychol Sci Soc Sci 1999 Nov;54(6):S339-S348.
(51) Flier JS. Obesity wars: molecular progress confronts an expanding epidemic.
Cell 2004 Jan 23;116(2):337-50.
(52) Flum DR, Belle SH, King WC, Wahed AS, Berk P, Chapman W, et al.
Perioperative safety in the longitudinal assessment of bariatric surgery. N
Engl J Med 2009 Jul 30;361(5):445-54.
(53) Fonseca VA, Rosenstock J, Wang AC, Truitt KE, Jones MR. Colesevelam
HCl improves glycemic control and reduces LDL cholesterol in patients with
inadequately controlled type 2 diabetes on sulfonylurea-based therapy.
Diabetes Care 2008 Aug;31(8):1479-84.
(54) Foschi D, Corsi F, Pisoni L, Vago T, Bevilacqua M, Asti E, et al. Plasma
cholecystokinin levels after vertical banded gastroplasty: effects of an acidified
meal. Obes Surg 2004 May;14(5):644-7.
(55) Fruhbeck G, Diez CA, Gil MJ. Fundus functionality and ghrelin concentrations
after bariatric surgery. N Engl J Med 2004 Jan 15;350(3):308-9.
(56) Garcia-Fuentes E, Garrido-Sanchez L, Garcia-Almeida JM, Garcia-Arnes J,
Gallego-Perales JL, Rivas-Marin J, et al. Different effect of laparoscopic

176
Roux-en-Y gastric bypass and open biliopancreatic diversion of Scopinaro on
serum PYY and ghrelin levels. Obes Surg 2008 Nov;18(11):1424-9.
(57) Garg A, Grundy SM. Cholestyramine therapy for dyslipidemia in non-insulin-
dependent diabetes mellitus. A short-term, double-blind, crossover trial. Ann
Intern Med 1994 Sep 15;121(6):416-22.
(58) Geloneze B, Tambascia MA, Pilla VF, Geloneze SR, Repetto EM, Pareja JC.
Ghrelin: a gut-brain hormone: effect of gastric bypass surgery. Obes Surg
2003 Feb;13(1):17-22.
(59) Gill RS, Karmali S, Sharma AM. The potential role of the Edmonton obesity
staging system in determining indications for bariatric surgery. Obes Surg
2011 Dec;21(12):1947-9.
(60) Goldberg RB, Fonseca VA, Truitt KE, Jones MR. Efficacy and safety of
colesevelam in patients with type 2 diabetes mellitus and inadequate glycemic
control receiving insulin-based therapy. Arch Intern Med 2008 Jul
28;168(14):1531-40.
(61) Gosman GG, King WC, Schrope B, Steffen KJ, Strain GW, Courcoulas AP, et
al. Reproductive health of women electing bariatric surgery. Fertil Steril 2010
Sep;94(4):1426-31.
(62) Greenburg DL, Lettieri CJ, Eliasson AH. Effects of surgical weight loss on
measures of obstructive sleep apnea: a meta-analysis. Am J Med 2009
Jun;122(6):535-42.

177
(63) Gross T, Sokol RJ, King KC. Obesity in pregnancy: risks and outcome. Obstet
Gynecol 1980 Oct;56(4):446-50.
(64) Guidone C, Manco M, Valera-Mora E, Iaconelli A, Gniuli D, Mari A, et al.
Mechanisms of recovery from type 2 diabetes after malabsorptive bariatric
surgery. Diabetes 2006 Jul;55(7):2025-31.
(65) Gulkarov I, Wetterau M, Ren CJ, Fielding GA. Hiatal hernia repair at the initial
laparoscopic adjustable gastric band operation reduces the need for
reoperation. Surg Endosc 2008 Apr;22(4):1035-41.
(66) Guzelian P, Boyer JL. Glucose reabsorption from bile. Evidence for a
biliohepatic circulation. J Clin Invest 1974 Feb;53(2):526-35.
(67) Hammoud AO, Wilde N, Gibson M, Parks A, Carrell DT, Meikle AW. Male
obesity and alteration in sperm parameters. Fertil Steril 2008 Dec;90(6):2222-
5.
(68) Hampel H, Abraham NS, El-Serag HB. Meta-analysis: obesity and the risk for
gastroesophageal reflux disease and its complications. Ann Intern Med 2005
Aug 2;143(3):199-211.
(69) Han SI, Studer E, Gupta S, Fang Y, Qiao L, Li W, et al. Bile acids enhance
the activity of the insulin receptor and glycogen synthase in primary rodent
hepatocytes. Hepatology 2004 Feb;39(2):456-63.
(70) Hawkins SC, Osborne A, Finlay IG, Alagaratnam S, Edmond JR, Welbourn R.
Paid work increases and state benefit claims decrease after bariatric surgery.
Obes Surg 2007 Apr;17(4):434-7.

178
(71) Higa KD, Boone KB, Ho T, Davies OG. Laparoscopic Roux-en-Y gastric
bypass for morbid obesity: technique and preliminary results of our first 400
patients. Arch Surg 2000 Sep;135(9):1029-33.
(72) Holt JA, Luo G, Billin AN, Bisi J, McNeill YY, Kozarsky KF, et al. Definition of a
novel growth factor-dependent signal cascade for the suppression of bile acid
biosynthesis. Genes Dev 2003 Jul 1;17(13):1581-91.
(73) Houten SM, Watanabe M, Auwerx J. Endocrine functions of bile acids. EMBO
J 2006 Apr 5;25(7):1419-25.
(74) Hu FB. Obesity and mortality: watch your waist, not just your weight. Arch
Intern Med 2007 May 14;167(9):875-6.
(75) Inagaki T, Choi M, Moschetta A, Peng L, Cummins CL, McDonald JG, et al.
Fibroblast growth factor 15 functions as an enterohepatic signal to regulate
bile acid homeostasis. Cell Metab 2005 Oct;2(4):217-25.
(76) Izukura M, Hashimoto T, Gomez G, Uchida T, Greeley GH, Jr., Thompson JC.
Intracolonic infusion of bile salt stimulates release of peptide YY and inhibits
cholecystokinin-stimulated pancreatic exocrine secretion in conscious dogs.
Pancreas 1991 Jul;6(4):427-32.
(77) Jackson RJ, Davis WB, Macdonald I. The energy values of carbohydrates:
should bomb calorimeter data be modified? Proc Nutr Soc 1977
Dec;36(3):90A.
(78) Karamanakos SN, Vagenas K, Kalfarentzos F, Alexandrides TK. Weight loss,
appetite suppression, and changes in fasting and postprandial ghrelin and

179
peptide-YY levels after Roux-en-Y gastric bypass and sleeve gastrectomy: a
prospective, double blind study. Ann Surg 2008 Mar;247(3):401-7.
(79) Karlsson J, Sjostrom L, Sullivan M. Swedish obese subjects (SOS)--an
intervention study of obesity. Two-year follow-up of health-related quality of
life (HRQL) and eating behavior after gastric surgery for severe obesity. Int J
Obes Relat Metab Disord 1998 Feb;22(2):113-26.
(80) Karlsson J, Taft C, Ryden A, Sjostrom L, Sullivan M. Ten-year trends in
health-related quality of life after surgical and conventional treatment for
severe obesity: the SOS intervention study. Int J Obes (Lond) 2007
Aug;31(8):1248-61.
(81) Kashyap SR, Daud S, Kelly KR, Gastaldelli A, Win H, Brethauer S, et al.
Acute effects of gastric bypass versus gastric restrictive surgery on beta-cell
function and insulinotropic hormones in severely obese patients with type 2
diabetes. Int J Obes (Lond) 2010 Mar;34(3):462-71.
(82) Katsuma S, Hirasawa A, Tsujimoto G. Bile acids promote glucagon-like
peptide-1 secretion through TGR5 in a murine enteroendocrine cell line STC-
1. Biochem Biophys Res Commun 2005 Apr 1;329(1):386-90.
(83) Keating CL, Dixon JB, Moodie ML, Peeters A, Playfair J, O'Brien PE. Cost-
efficacy of surgically induced weight loss for the management of type 2
diabetes: a randomized controlled trial. Diabetes Care 2009 Apr;32(4):580-4.

180
(84) Kellum JM, Kuemmerle JF, O'Dorisio TM, Rayford P, Martin D, Engle K, et al.
Gastrointestinal hormone responses to meals before and after gastric bypass
and vertical banded gastroplasty. Ann Surg 1990 Jun;211(6):763-70.
(85) Key TJ, Appleby PN, Reeves GK, Roddam A, Dorgan JF, Longcope C, et al.
Body mass index, serum sex hormones, and breast cancer risk in
postmenopausal women. J Natl Cancer Inst 2003 Aug 20;95(16):1218-26.
(86) Kim CH, Younossi ZM. Nonalcoholic fatty liver disease: a manifestation of the
metabolic syndrome. Cleve Clin J Med 2008 Oct;75(10):721-8.
(87) Kim TH, Daud A, Ude AO, DiGiorgi M, Olivero-Rivera L, Schrope B, et al.
Early U.S. outcomes of laparoscopic gastric bypass versus laparoscopic
adjustable silicone gastric banding for morbid obesity. Surg Endosc 2006
Feb;20(2):202-9.
(88) Kir S, Beddow SA, Samuel VT, Miller P, Previs SF, Suino-Powell K, et al.
FGF19 as a postprandial, insulin-independent activator of hepatic protein and
glycogen synthesis. Science 2011 Mar 25;331(6024):1621-4.
(89) Klein S, Ghosh A, Cremieux PY, Eapen S, McGavock TJ. Economic impact of
the clinical benefits of bariatric surgery in diabetes patients with BMI >/=35
kg/m(2). Obesity (Silver Spring) 2011 Mar;19(3):581-7.
(90) Kojima M, Hosoda H, Date Y, Nakazato M, Matsuo H, Kangawa K. Ghrelin is
a growth-hormone-releasing acylated peptide from stomach. Nature 1999 Dec
9;402(6762):656-60.

181
(91) Kolotkin RL, Crosby RD, Gress RE, Hunt SC, Adams TD. Two-year changes
in health-related quality of life in gastric bypass patients compared with
severely obese controls. Surg Obes Relat Dis 2009 Mar;5(2):250-6.
(92) Kopin AS, Mathes WF, McBride EW, Nguyen M, Al-Haider W, Schmitz F, et
al. The cholecystokinin-A receptor mediates inhibition of food intake yet is not
essential for the maintenance of body weight. J Clin Invest 1999
Feb;103(3):383-91.
(93) Korner J, Bessler M, Cirilo LJ, Conwell IM, Daud A, Restuccia NL, et al.
Effects of Roux-en-Y gastric bypass surgery on fasting and postprandial
concentrations of plasma ghrelin, peptide YY, and insulin. J Clin Endocrinol
Metab 2005 Jan;90(1):359-65.
(94) Korner J, Inabnet W, Febres G, Conwell IM, McMahon DJ, Salas R, et al.
Prospective study of gut hormone and metabolic changes after adjustable
gastric banding and Roux-en-Y gastric bypass. Int J Obes (Lond) 2009
Jul;33(7):786-95.
(95) Laferrere B, Heshka S, Wang K, Khan Y, McGinty J, Teixeira J, et al. Incretin
levels and effect are markedly enhanced 1 month after Roux-en-Y gastric
bypass surgery in obese patients with type 2 diabetes. Diabetes Care 2007
Jul;30(7):1709-16.
(96) Laferrere B, Teixeira J, McGinty J, Tran H, Egger JR, Colarusso A, et al.
Effect of weight loss by gastric bypass surgery versus hypocaloric diet on
glucose and incretin levels in patients with type 2 diabetes. J Clin Endocrinol
Metab 2008 Jul;93(7):2479-85.

182
(97) Laferrere B, Swerdlow N, Bawa B, Arias S, Bose M, Olivan B, et al. Rise of
oxyntomodulin in response to oral glucose after gastric bypass surgery in
patients with type 2 diabetes. J Clin Endocrinol Metab 2010 Aug;95(8):4072-6.
(98) le Roux CW, Patterson M, Vincent RP, Hunt C, Ghatei MA, Bloom SR.
Postprandial plasma ghrelin is suppressed proportional to meal calorie
content in normal-weight but not obese subjects. J Clin Endocrinol Metab
2005 Feb;90(2):1068-71.
(99) le Roux CW, Neary NM, Halsey TJ, Small CJ, Martinez-Isla AM, Ghatei MA,
et al. Ghrelin does not stimulate food intake in patients with surgical
procedures involving vagotomy. J Clin Endocrinol Metab 2005
Aug;90(8):4521-4.
(100) le Roux CW, Aylwin SJ, Batterham RL, Borg CM, Coyle F, Prasad V, et al.
Gut hormone profiles following bariatric surgery favor an anorectic state,
facilitate weight loss, and improve metabolic parameters. Ann Surg 2006
Jan;243(1):108-14.
(101) le Roux CW, Welbourn R, Werling M, Osborne A, Kokkinos A, Laurenius A, et
al. Gut hormones as mediators of appetite and weight loss after Roux-en-Y
gastric bypass. Ann Surg 2007 Nov;246(5):780-5.
(102) Lee WJ, Lee YC, Ser KH, Chen JC, Chen SC. Improvement of insulin
resistance after obesity surgery: a comparison of gastric banding and bypass
procedures. Obes Surg 2008 Sep;18(9):1119-25.

183
(103) Lin E, Gletsu N, Fugate K, McClusky D, Gu LH, Zhu JL, et al. The effects of
gastric surgery on systemic ghrelin levels in the morbidly obese. Arch Surg
2004 Jul;139(7):780-4.
(104) Lugari R, Dei CA, Ugolotti D, Barilli AL, Camellini C, Ganzerla GC, et al.
Glucagon-like peptide 1 (GLP-1) secretion and plasma dipeptidyl peptidase IV
(DPP-IV) activity in morbidly obese patients undergoing biliopancreatic
diversion. Horm Metab Res 2004 Feb;36(2):111-5.
(105) Ma K, Saha PK, Chan L, Moore DD. Farnesoid X receptor is essential for
normal glucose homeostasis. J Clin Invest 2006 Apr;116(4):1102-9.
(106) Maggard MA, Yermilov I, Li Z, Maglione M, Newberry S, Suttorp M, et al.
Pregnancy and fertility following bariatric surgery: a systematic review. JAMA
2008 Nov 19;300(19):2286-96.
(107) Mathurin P, Hollebecque A, Arnalsteen L, Buob D, Leteurtre E, Caiazzo R, et
al. Prospective study of the long-term effects of bariatric surgery on liver injury
in patients without advanced disease. Gastroenterology 2009 Aug;137(2):532-
40.
(108) Matthews DR, Hosker JP, Rudenski AS, Naylor BA, Treacher DF, Turner RC.
Homeostasis model assessment: insulin resistance and beta-cell function
from fasting plasma glucose and insulin concentrations in man. Diabetologia
1985 Jul;28(7):412-9.
(109) McLaughlin T, Abbasi F, Lamendola C, Frayo RS, Cummings DE. Plasma
ghrelin concentrations are decreased in insulin-resistant obese adults relative

184
to equally obese insulin-sensitive controls. J Clin Endocrinol Metab 2004
Apr;89(4):1630-5.
(110) Mejia-Rivas MA, Herrera-Lopez A, Hernandez-Calleros J, Herrera MF,
Valdovinos MA. Gastroesophageal reflux disease in morbid obesity: the effect
of Roux-en-Y gastric bypass. Obes Surg 2008 Oct;18(10):1217-24.
(111) Merrouche M, Sabate JM, Jouet P, Harnois F, Scaringi S, Coffin B, et al.
Gastro-esophageal reflux and esophageal motility disorders in morbidly obese
patients before and after bariatric surgery. Obes Surg 2007 Jul;17(7):894-900.
(112) MILLER DS, PAYNE PR. A ballistic bomb calorimeter. Br J Nutr 1959;13:501-
8.
(113) Miller GD, Nicklas BJ, You T, Fernandez A. Physical function improvements
after laparoscopic Roux-en-Y gastric bypass surgery. Surg Obes Relat Dis
2009 Sep;5(5):530-7.
(114) Morin KH. Perinatal outcomes of obese women: a review of the literature. J
Obstet Gynecol Neonatal Nurs 1998 Jul;27(4):431-40.
(115) Morinigo R, Casamitjana R, Moize V, Lacy AM, Delgado S, Gomis R, et al.
Short-term effects of gastric bypass surgery on circulating ghrelin levels. Obes
Res 2004 Jul;12(7):1108-16.
(116) Morinigo R, Lacy AM, Casamitjana R, Delgado S, Gomis R, Vidal J. GLP-1
and changes in glucose tolerance following gastric bypass surgery in morbidly
obese subjects. Obes Surg 2006 Dec;16(12):1594-601.

185
(117) Morinigo R, Moize V, Musri M, Lacy AM, Navarro S, Marin JL, et al.
Glucagon-like peptide-1, peptide YY, hunger, and satiety after gastric bypass
surgery in morbidly obese subjects. J Clin Endocrinol Metab 2006
May;91(5):1735-40.
(118) Morinigo R, Vidal J, Lacy AM, Delgado S, Casamitjana R, Gomis R.
Circulating peptide YY, weight loss, and glucose homeostasis after gastric
bypass surgery in morbidly obese subjects. Ann Surg 2008 Feb;247(2):270-5.
(119) Morton GJ, Cummings DE, Baskin DG, Barsh GS, Schwartz MW. Central
nervous system control of food intake and body weight. Nature 2006 Sep
21;443(7109):289-95.
(120) Mummadi RR, Kasturi KS, Chennareddygari S, Sood GK. Effect of bariatric
surgery on nonalcoholic fatty liver disease: systematic review and meta-
analysis. Clin Gastroenterol Hepatol 2008 Dec;6(12):1396-402.
(121) Naslund E, Gryback P, Hellstrom PM, Jacobsson H, Holst JJ, Theodorsson E,
et al. Gastrointestinal hormones and gastric emptying 20 years after
jejunoileal bypass for massive obesity. Int J Obes Relat Metab Disord 1997
May;21(5):387-92.
(122) Naslund E, Melin I, Gryback P, Hagg A, Hellstrom PM, Jacobsson H, et al.
Reduced food intake after jejunoileal bypass: a possible association with
prolonged gastric emptying and altered gut hormone patterns. Am J Clin Nutr
1997 Jul;66(1):26-32.

186
(123) Navarro-Diaz M, Serra A, Romero R, Bonet J, Bayes B, Homs M, et al. Effect
of drastic weight loss after bariatric surgery on renal parameters in extremely
obese patients: long-term follow-up. J Am Soc Nephrol 2006 Dec;17(12 Suppl
3):S213-S217.
(124) Neary NM, Small CJ, Druce MR, Park AJ, Ellis SM, Semjonous NM, et al.
Peptide YY3-36 and glucagon-like peptide-17-36 inhibit food intake additively.
Endocrinology 2005 Dec;146(12):5120-7.
(125) O'Brien PE, Dixon JB, Laurie C, Anderson M. A prospective randomized trial
of placement of the laparoscopic adjustable gastric band: comparison of the
perigastric and pars flaccida pathways. Obes Surg 2005 Jun;15(6):820-6.
(126) O'Brien PE, Dixon JB, Laurie C, Skinner S, Proietto J, McNeil J, et al.
Treatment of mild to moderate obesity with laparoscopic adjustable gastric
banding or an intensive medical program: a randomized trial. Ann Intern Med
2006 May 2;144(9):625-33.
(127) Oesch S, Ruegg C, Fischer B, Degen L, Beglinger C. Effect of gastric
distension prior to eating on food intake and feelings of satiety in humans.
Physiol Behav 2006 May 30;87(5):903-10.
(128) Olivan B, Teixeira J, Bose M, Bawa B, Chang T, Summe H, et al. Effect of
weight loss by diet or gastric bypass surgery on peptide YY3-36 levels. Ann
Surg 2009 Jun;249(6):948-53.
(129) Padwal RS, Pajewski NM, Allison DB, Sharma AM. Using the Edmonton
obesity staging system to predict mortality in a population-representative

187
cohort of people with overweight and obesity. CMAJ 2011 Oct
4;183(14):E1059-E1066.
(130) Parikh M, young-Chee P, Romanos E, Lewis N, Pachter HL, Fielding G, et al.
Comparison of rates of resolution of diabetes mellitus after gastric banding,
gastric bypass, and biliopancreatic diversion. J Am Coll Surg 2007
Nov;205(5):631-5.
(131) Patti ME, Houten SM, Bianco AC, Bernier R, Larsen PR, Holst JJ, et al.
Serum bile acids are higher in humans with prior gastric bypass: potential
contribution to improved glucose and lipid metabolism. Obesity (Silver Spring)
2009 Sep;17(9):1671-7.
(132) Peterli R, Wolnerhanssen B, Peters T, Devaux N, Kern B, Christoffel-Court, et
al. Improvement in glucose metabolism after bariatric surgery: comparison of
laparoscopic Roux-en-Y gastric bypass and laparoscopic sleeve gastrectomy:
a prospective randomized trial. Ann Surg 2009 Aug;250(2):234-41.
(133) Picot J, Jones J, Colquitt JL, Gospodarevskaya E, Loveman E, Baxter L, et al.
The clinical effectiveness and cost-effectiveness of bariatric (weight loss)
surgery for obesity: a systematic review and economic evaluation. Health
Technol Assess 2009 Sep;13(41):1-357, iii.
(134) Pircher PC, Kitto JL, Petrowski ML, Tangirala RK, Bischoff ED, Schulman IG,
et al. Farnesoid X receptor regulates bile acid-amino acid conjugation. J Biol
Chem 2003 Jul 25;278(30):27703-11.

188
(135) Pories WJ, Swanson MS, MacDonald KG, Long SB, Morris PG, Brown BM, et
al. Who would have thought it? An operation proves to be the most effective
therapy for adult-onset diabetes mellitus. Ann Surg 1995 Sep;222(3):339-50.
(136) Pories WJ. Ghrelin? Yes, it is spelled correctly. Ann Surg 2008
Mar;247(3):408-10.
(137) Potthoff MJ, Boney-Montoya J, Choi M, He T, Sunny NE, Satapati S, et al.
FGF15/19 regulates hepatic glucose metabolism by inhibiting the CREB-
PGC-1alpha pathway. Cell Metab 2011 Jun 8;13(6):729-38.
(138) Pournaras DJ, le Roux CW. Obesity, gut hormones, and bariatric surgery.
World J Surg 2009 Oct;33(10):1983-8.
(139) Pournaras DJ, Manning L, Bidgood K, Fender GR, Mahon D, Welbourn R.
Polycystic ovary syndrome is common in patients undergoing bariatric surgery
in a British center. Fertil Steril 2010 Jul;94(2):e41.
(140) Pournaras DJ, le Roux CW. Ghrelin and metabolic surgery. Int J Pept
2010;2010.
(141) Ray KK, Seshasai SR, Wijesuriya S, Sivakumaran R, Nethercott S, Preiss D,
et al. Effect of intensive control of glucose on cardiovascular outcomes and
death in patients with diabetes mellitus: a meta-analysis of randomised
controlled trials. Lancet 2009 May 23;373(9677):1765-72.
(142) Reinehr T, Roth CL, Schernthaner GH, Kopp HP, Kriwanek S, Schernthaner
G. Peptide YY and glucagon-like peptide-1 in morbidly obese patients before
and after surgically induced weight loss. Obes Surg 2007 Dec;17(12):1571-7.

189
(143) Renehan AG, Frystyk J, Flyvbjerg A. Obesity and cancer risk: the role of the
insulin-IGF axis. Trends Endocrinol Metab 2006 Oct;17(8):328-36.
(144) Renehan AG, Tyson M, Egger M, Heller RF, Zwahlen M. Body-mass index
and incidence of cancer: a systematic review and meta-analysis of
prospective observational studies. Lancet 2008 Feb 16;371(9612):569-78.
(145) Robertson MD, Bickerton AS, Dennis AL, Vidal H, Jewell DP, Frayn KN.
Enhanced metabolic cycling in subjects after colonic resection for ulcerative
colitis. J Clin Endocrinol Metab 2005 May;90(5):2747-54.
(146) Rodbard HW, Jellinger PS, Davidson JA, Einhorn D, Garber AJ, Grunberger
G, et al. Statement by an American Association of Clinical
Endocrinologists/American College of Endocrinology consensus panel on type
2 diabetes mellitus: an algorithm for glycemic control. Endocr Pract 2009
Sep;15(6):540-59.
(147) Rodieux F, Giusti V, D'Alessio DA, Suter M, Tappy L. Effects of gastric bypass
and gastric banding on glucose kinetics and gut hormone release. Obesity
(Silver Spring) 2008 Feb;16(2):298-305.
(148) Roux CW, Pournaras D.J. Metabolic surgery: nutritional outcomes and health
benefits. CAB Reviews: Perspectives in Agriculture, Veterinary Science,
Nutrition and Natural Resources 5[44], 1-6. 2010.
Ref Type: Magazine Article
(149) Rubino F, Gagner M, Gentileschi P, Kini S, Fukuyama S, Feng J, et al. The
early effect of the Roux-en-Y gastric bypass on hormones involved in body

190
weight regulation and glucose metabolism. Ann Surg 2004 Aug;240(2):236-
42.
(150) Rubino F, Forgione A, Cummings DE, Vix M, Gnuli D, Mingrone G, et al. The
mechanism of diabetes control after gastrointestinal bypass surgery reveals a
role of the proximal small intestine in the pathophysiology of type 2 diabetes.
Ann Surg 2006 Nov;244(5):741-9.
(151) Sampalis JS, Liberman M, Auger S, Christou NV. The impact of weight
reduction surgery on health-care costs in morbidly obese patients. Obes Surg
2004 Aug;14(7):939-47.
(152) Schauer PR, Burguera B, Ikramuddin S, Cottam D, Gourash W, Hamad G, et
al. Effect of laparoscopic Roux-en Y gastric bypass on type 2 diabetes
mellitus. Ann Surg 2003 Oct;238(4):467-84.
(153) Schwartz MW, Woods SC, Seeley RJ, Barsh GS, Baskin DG, Leibel RL. Is
the energy homeostasis system inherently biased toward weight gain?
Diabetes 2003 Feb;52(2):232-8.
(154) Shak JR, Roper J, Perez-Perez GI, Tseng CH, Francois F, Gamagaris Z, et
al. The effect of laparoscopic gastric banding surgery on plasma levels of
appetite-control, insulinotropic, and digestive hormones. Obes Surg 2008
Sep;18(9):1089-96.
(155) Sharma AM, Kushner RF. A proposed clinical staging system for obesity. Int J
Obes (Lond) 2009 Mar;33(3):289-95.

191
(156) Shayeb AG, Harrild K, Mathers E, Bhattacharya S. An exploration of the
association between male body mass index and semen quality. Reprod
Biomed Online 2011 Dec;23(6):717-23.
(157) Sjostrom L, Narbro K, Sjostrom CD, Karason K, Larsson B, Wedel H, et al.
Effects of bariatric surgery on mortality in Swedish obese subjects. N Engl J
Med 2007 Aug 23;357(8):741-52.
(158) Sjostrom L, Gummesson A, Sjostrom CD, Narbro K, Peltonen M, Wedel H, et
al. Effects of bariatric surgery on cancer incidence in obese patients in
Sweden (Swedish Obese Subjects Study): a prospective, controlled
intervention trial. Lancet Oncol 2009 Jul;10(7):653-62.
(159) Skull AJ, Slater GH, Duncombe JE, Fielding GA. Laparoscopic adjustable
banding in pregnancy: safety, patient tolerance and effect on obesity-related
pregnancy outcomes. Obes Surg 2004 Feb;14(2):230-5.
(160) Snow LL, Weinstein LS, Hannon JK, Lane DR, Ringold FG, Hansen PA, et al.
The effect of Roux-en-Y gastric bypass on prescription drug costs. Obes Surg
2004 Sep;14(8):1031-5.
(161) Staels B, Fonseca VA. Bile acids and metabolic regulation: mechanisms and
clinical responses to bile acid sequestration. Diabetes Care 2009 Nov;32
Suppl 2:S237-S245.
(162) Stoeckli R, Chanda R, Langer I, Keller U. Changes of body weight and
plasma ghrelin levels after gastric banding and gastric bypass. Obes Res
2004 Feb;12(2):346-50.

192
(163) Stratis C, Alexandrides T, Vagenas K, Kalfarentzos F. Ghrelin and peptide YY
levels after a variant of biliopancreatic diversion with Roux-en-Y gastric
bypass versus after colectomy: a prospective comparative study. Obes Surg
2006 Jun;16(6):752-8.
(164) Stylopoulos N, Hoppin AG, Kaplan LM. Roux-en-Y gastric bypass enhances
energy expenditure and extends lifespan in diet-induced obese rats. Obesity
(Silver Spring) 2009 Oct;17(10):1839-47.
(165) Sundbom M, Holdstock C, Engstrom BE, Karlsson FA. Early changes in
ghrelin following Roux-en-Y gastric bypass: influence of vagal nerve
functionality? Obes Surg 2007 Mar;17(3):304-10.
(166) Suter M, Dorta G, Giusti V, Calmes JM. Gastric banding interferes with
esophageal motility and gastroesophageal reflux. Arch Surg 2005
Jul;140(7):639-43.
(167) Suzuki T, Oba K, Futami S, Suzuki K, Ouchi M, Igari Y, et al. Blood glucose-
lowering activity of colestimide in patients with type 2 diabetes and
hypercholesterolemia: a case-control study comparing colestimide with
acarbose. J Nihon Med Sch 2006 Oct;73(5):277-84.
(168) Tafti BA, Haghdoost M, Alvarez L, Curet M, Melcher ML. Recovery of renal
function in a dialysis-dependent patient following gastric bypass surgery.
Obes Surg 2009 Sep;19(9):1335-9.
(169) Tagliacozzi D, Mozzi AF, Casetta B, Bertucci P, Bernardini S, Di IC, et al.
Quantitative analysis of bile acids in human plasma by liquid chromatography-

193
electrospray tandem mass spectrometry: a simple and rapid one-step method.
Clin Chem Lab Med 2003 Dec;41(12):1633-41.
(170) Thomas C, Pellicciari R, Pruzanski M, Auwerx J, Schoonjans K. Targeting
bile-acid signalling for metabolic diseases. Nat Rev Drug Discov 2008
Aug;7(8):678-93.
(171) Tomlinson E, Fu L, John L, Hultgren B, Huang X, Renz M, et al. Transgenic
mice expressing human fibroblast growth factor-19 display increased
metabolic rate and decreased adiposity. Endocrinology 2002
May;143(5):1741-7.
(172) Uhe AM, Szmukler GI, Collier GR, Hansky J, O'Dea K, Young GP. Potential
regulators of feeding behavior in anorexia nervosa. Am J Clin Nutr 1992
Jan;55(1):28-32.
(173) Usinger L, Hansen KB, Kristiansen VB, Larsen S, Holst JJ, Knop FK. Gastric
emptying of orally administered glucose solutions and incretin hormone
responses are unaffected by laparoscopic adjustable gastric banding. Obes
Surg 2011 May;21(5):625-32.
(174) Valderas JP, Irribarra V, Rubio L, Boza C, Escalona M, Liberona Y, et al.
Effects of sleeve gastrectomy and medical treatment for obesity on glucagon-
like peptide 1 levels and glucose homeostasis in non-diabetic subjects. Obes
Surg 2011 Jul;21(7):902-9.
(175) Valverde I, Puente J, Martin-Duce A, Molina L, Lozano O, Sancho V, et al.
Changes in glucagon-like peptide-1 (GLP-1) secretion after biliopancreatic

194
diversion or vertical banded gastroplasty in obese subjects. Obes Surg 2005
Mar;15(3):387-97.
(176) Vendrell J, Broch M, Vilarrasa N, Molina A, Gomez JM, Gutierrez C, et al.
Resistin, adiponectin, ghrelin, leptin, and proinflammatory cytokines:
relationships in obesity. Obes Res 2004 Jun;12(6):962-71.
(177) Vessey DA, Crissey MH, Zakim D. Kinetic studies on the enzymes
conjugating bile acids with taurine and glycine in bovine liver. Biochem J 1977
Apr 1;163(1):181-3.
(178) Vidal J, Nicolau J, Romero F, Casamitjana R, Momblan D, Conget I, et al.
Long-term effects of Roux-en-Y gastric bypass surgery on plasma glucagon-
like peptide-1 and islet function in morbidly obese subjects. J Clin Endocrinol
Metab 2009 Mar;94(3):884-91.
(179) Vlahcevic ZR, Pandak WM, Stravitz RT. Regulation of bile acid biosynthesis.
Gastroenterol Clin North Am 1999 Mar;28(1):1-25, v.
(180) Walters JR, Tasleem AM, Omer OS, Brydon WG, Dew T, le Roux CW. A new
mechanism for bile acid diarrhea: defective feedback inhibition of bile acid
biosynthesis. Clin Gastroenterol Hepatol 2009 Nov;7(11):1189-94.
(181) Watanabe M, Houten SM, Mataki C, Christoffolete MA, Kim BW, Sato H, et al.
Bile acids induce energy expenditure by promoting intracellular thyroid
hormone activation. Nature 2006 Jan 26;439(7075):484-9.

195
(182) Weber M, Muller MK, Bucher T, Wildi S, Dindo D, Horber F, et al.
Laparoscopic gastric bypass is superior to laparoscopic gastric banding for
treatment of morbid obesity. Ann Surg 2004 Dec;240(6):975-82.
(183) Weil E, Wachterman M, McCarthy EP, Davis RB, O'Day B, Iezzoni LI, et al.
Obesity among adults with disabling conditions. JAMA 2002 Sep
11;288(10):1265-8.
(184) Welbourn R, Pournaras D. Bariatric surgery: a cost-effective intervention for
morbid obesity; functional and nutritional outcomes. Proc Nutr Soc 2010
Nov;69(4):528-35.
(185) Wren AM, Small CJ, Abbott CR, Dhillo WS, Seal LJ, Cohen MA, et al. Ghrelin
causes hyperphagia and obesity in rats. Diabetes 2001 Nov;50(11):2540-7.
(186) Wren AM, Seal LJ, Cohen MA, Brynes AE, Frost GS, Murphy KG, et al.
Ghrelin enhances appetite and increases food intake in humans. J Clin
Endocrinol Metab 2001 Dec;86(12):5992.
(187) Wynne K, Park AJ, Small CJ, Patterson M, Ellis SM, Murphy KG, et al.
Subcutaneous oxyntomodulin reduces body weight in overweight and obese
subjects: a double-blind, randomized, controlled trial. Diabetes 2005
Aug;54(8):2390-5.
(188) Yamagata K, Daitoku H, Shimamoto Y, Matsuzaki H, Hirota K, Ishida J, et al.
Bile acids regulate gluconeogenic gene expression via small heterodimer
partner-mediated repression of hepatocyte nuclear factor 4 and Foxo1. J Biol
Chem 2004 May 28;279(22):23158-65.

196
(189) Yamakawa T, Takano T, Utsunomiya H, Kadonosono K, Okamura A. Effect of
colestimide therapy for glycemic control in type 2 diabetes mellitus with
hypercholesterolemia. Endocr J 2007 Feb;54(1):53-8.
(190) Yang J, Brown MS, Liang G, Grishin NV, Goldstein JL. Identification of the
acyltransferase that octanoylates ghrelin, an appetite-stimulating peptide
hormone. Cell 2008 Feb 8;132(3):387-96.
(191) Yip RG, Wolfe MM. GIP biology and fat metabolism. Life Sci 2000;66(2):91-
103.
(192) Zieve FJ, Kalin MF, Schwartz SL, Jones MR, Bailey WL. Results of the
glucose-lowering effect of WelChol study (GLOWS): a randomized, double-
blind, placebo-controlled pilot study evaluating the effect of colesevelam
hydrochloride on glycemic control in subjects with type 2 diabetes. Clin Ther
2007 Jan;29(1):74-83.
(193) Zipf WB, O'Dorisio TM, Cataland S, Sotos J. Blunted pancreatic polypeptide
responses in children with obesity of Prader-Willi syndrome. J Clin Endocrinol
Metab 1981 Jun;52(6):1264-6.

197

Obesity, Gut Hormones, and Bariatric Surgery
Dimitrios J. Pournaras Æ Carel W. le Roux
Published online: 9 June 2009
� Societe Internationale de Chirurgie 2009
Abstract Obesity is becoming the healthcare epidemic of
this century. Bariatric surgery is the only effective treat-
ment for morbid obesity. Gut hormones are key players in
the metabolic mechanisms causing obesity. In this review
we explore the role of these hormones as facilitators of
appetite control and weight loss after bariatric surgery, and
we describe the now established gut–brain axis.
Introduction
Obesity is a major cause of premature death, and its
prevalence is accelerating worldwide. Advice to the pop-
ulation to reduce food intake and take more exercise has
been manifestly unsuccessful. At present, surgical proce-
dures are the only effective therapy for long-term weight
loss [1]. Bariatric surgery also has profound effects on
obesity-related co-morbidities, such as type 2 diabetes,
hypertension, and sleep apnea [2]. The significantly
improved glycemic control in patients with type 2 diabetes
mellitus may have an even greater impact on morbidity and
mortality than weight loss.
The mechanism that leads to sustained weight loss as
well as diabetes remission after bariatric operations
remains to be elucidated. Gut hormones have been impli-
cated to play an important role in both weight loss and
diabetes improvement after weight loss surgery.
Energy homeostasis
Through the process of energy homeostasis, energy intake
and expenditure are adjusted, leading to remarkable sta-
bility in body mass over time [3–5]. From an evolutionary
standpoint, it is likely that survival in an environment with
constraints on the availability of food provided selection
bias toward homeostatic systems that respond to reduced
energy intake rather than energy excess [4–7]. Weight loss
leads to an increase in the perceived hunger and a decrease
in the metabolic rate. Leptin and insulin are the key mes-
sengers of the status of energy stores from the periphery to
the central nervous system [3].
The central melanocortin system, which plays a crucial
role in the regulation of energy homeostasis, is influenced
by signals mediated through peptides made in the gut and
released into the circulation [8]. These gut hormones cause
hunger and satiety effects and thus have an integral role in
appetite regulation.
Bariatric procedures were designed to promote weight
loss by the reduction of stomach volume (laparoscopic
adjustable gastric banding [LABG], laparoscopic sleeve
gastrectomy [LSG]), malabsorption of nutrients (biliopan-
creatic diversion [BPD], duodenal switch [DS]) or a com-
bination of both (Roux-en-Y gastric bypass [RYGB]). It is
now known that calorie malabsorbtion does not occur (with
the exception of the biliopancreatic diversion); however the
effects of bariatric procedures are not entirely due to the
D. J. Pournaras
Department of Bariatric Surgery, Musgrove Park Hospital,
Taunton, UK
D. J. Pournaras
Department of Investigative Medicine, Imperial College London,
London, UK
C. W. le Roux (&)
Department of Investigative Medicine, Hammersmith Hospital,
Imperial College London, Du Cane Road, W12 0NN London,
UK
e-mail: [email protected]
123
World J Surg (2009) 33:1983–1988
DOI 10.1007/s00268-009-0080-9

reduced stomach volume. A number of studies have shown
that changes in gut hormone concentrations may partially
explain the weight loss following bariatric surgery. The
purpose of this review is to explore this interaction.
Gut hormones
The discovery of appetite-signaling peptides, gut hormones,
has led to the establishment of the gut–brain axis. In this
article anorexigenic and orexigenic hormones are reviewed
in order of the level of evidence supporting their role after
bariatric surgery, namely: glucagon-like peptide-1 (GLP-1),
peptide YY (PYY), ghrelin, cholecystokinin (CCK), glu-
cose-dependent insulinotropic polypeptide (GIP), oxynto-
modulin (OXM), and pancreatic polypeptide (PP).
Glucagon-like peptide-1
Glucagon-like peptide-1 (GLP-1), together with PYY and
OXM, is released postprandially by intestinal endocrine L-
cells [9]. These peptides act synergistically and cause
satiety. Both GLP-1 and PYY inhibit food intake additively
[10]. The former plays an important role in glucose
metabolism, acting as an incretin by augmenting the insulin
response to nutrients and also slowing gastric emptying and
inhibiting the glucagon secretion in a glucose-dependent
manner [11]. Incretins are hormones that are secreted from
the gastrointestinal tract into the circulation in response to
nutrient ingestion that enhances glucose-stimulated insulin
secretion [11]. In addition, GLP-1 also promotes satiety,
and sustained GLP-1–receptor activation is associated with
weight loss in both preclinical and clinical studies [11].
In animal models GLP-1 has been shown to expand islet
mass by stimulating pancreatic b-cell proliferation and
induction of islet neogenesis, and it also promotes cell dif-
ferentiation, from exocrine cells or immature islet progenitors
toward a more differentiated b-cell phenotype [12]. Further-
more GLP-1 exerts antiapoptotic actions in vivo, resulting in
preservation of b-cell mass [12]. The postprandial GLP-1
response is enhanced after RYGB, but not after LAGB in a
similar manner to the PYY response [13, 14]. GLP-1, both
fasting and postprandial, is elevated 20 years after JIB [15].
A recent study by Laferrere et al. showed early after
RYGB, the greater GLP-1 and GIP release and improvement
of incretin effect are related not to weight loss but rather to
the surgical procedure itself, suggesting that this could
contribute to improved glycemic control after RYGB [16].
Peptide YY
Peptide YY is a 36-amino-acid peptide, and a member of
the PP-fold peptide family. The letter Y is the abbreviation
for tyrosine. The peptide is released postprandially by
intestinal endocrine L-cells in proportion to the calories
ingested, but it is not altered by gastric distension [17, 18].
It is present throughout the intestinal tract, with higher
concentrations in the distal segments [17], and it has an
inhibitory effect on gastrointestinal mobility as well as the
gastric, pancreatic, and intestinal secretion [19, 20]. It has
been shown to induce satiety and reduce food intake in
both the obese and the non-obese [21, 22]. Furthermore
obese individuals have a PYY deficiency that would reduce
satiety and could thus reinforce obesity [23].
Korner et al. showed an exaggerated postprandial PYY
response after RYGB, which may contribute to weight loss
and to the ability of an individual to maintain weight loss
postoperatively [24]. Another study on both a human model
of RYGB and a rodent model of jejuno-intestinal bypass
(JIB) demonstrated an increased postprandial PYY response
favoring enhanced satiety [13]. Mechanistic experiments on
the animal model suggested an additional to food-intake
effect of RYGB on weight loss, raising the possibility of
enhanced energy expenditure [13]. A prospective study of
patients undergoing RYGB confirmed an increased post-
prandial PYY response associated with increased satiety
observed as early as one month after operation [25]. The
authors suggested that a gut adaptive response occurs after
RYGB, which promotes satiety and is partially responsible
for the weight loss following RYGB [25].
A recent study demonstrated a causality link between
the exaggerated PYY and GLP-1 response and the
enhanced satiety after RYGB [14]. In that study increased
postprandial PYY and GLP-1 responses were seen within
days after RYGB, prior to any significant weight loss.
Furthermore, in a comparison of good versus poor
responders to RYGB in terms of weight loss, suboptimal
PYY and GLP-1 postprandial responses were associated
with the poor responders. Finally, in a randomized double-
blind saline controlled study of patients after RYGB and
LAGB, inhibition of the gut hormone response with oc-
teotride (a somatostatin analog) increased food intake in
the RYGB group but not in the LAGB group, suggesting
that gut hormones might play a key role in the reduced food
intake after RYGB [14].
Comparison of patients after LAGB with patients after
RYGB showed a reduced PYY response in the LAGB
group in a number of studies [13, 25, 26]. However a
prospective study of patients undergoing vertically banded
gastroplasty (VBG) compared to non-obese controls dem-
onstrated significantly lower PYY levels in the preopera-
tive, obese group [27]. This difference was eliminated after
VBG as PYY levels gradually increased to non-obese
levels [27]. In a recent double-blind comparison of LSG
and RYGB, PYY levels, both fasting and postprandial,
were equally increased following the two procedures [28].
1984 World J Surg (2009) 33:1983–1988
123
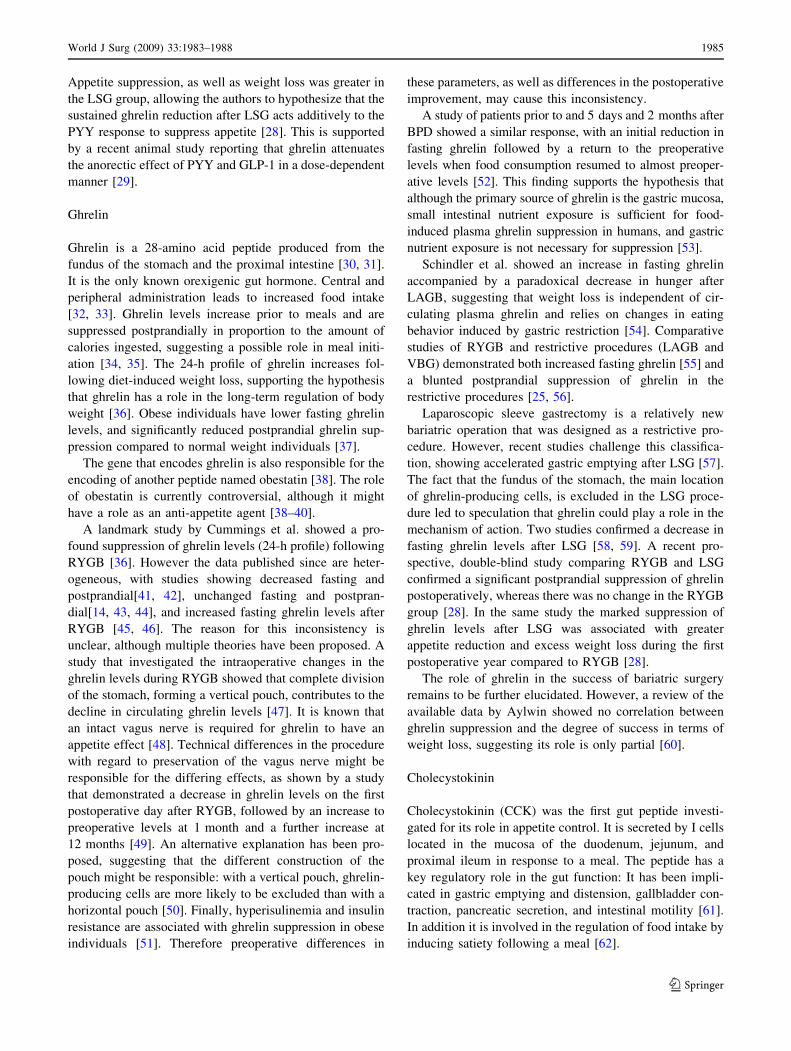
Appetite suppression, as well as weight loss was greater in
the LSG group, allowing the authors to hypothesize that the
sustained ghrelin reduction after LSG acts additively to the
PYY response to suppress appetite [28]. This is supported
by a recent animal study reporting that ghrelin attenuates
the anorectic effect of PYY and GLP-1 in a dose-dependent
manner [29].
Ghrelin
Ghrelin is a 28-amino acid peptide produced from the
fundus of the stomach and the proximal intestine [30, 31].
It is the only known orexigenic gut hormone. Central and
peripheral administration leads to increased food intake
[32, 33]. Ghrelin levels increase prior to meals and are
suppressed postprandially in proportion to the amount of
calories ingested, suggesting a possible role in meal initi-
ation [34, 35]. The 24-h profile of ghrelin increases fol-
lowing diet-induced weight loss, supporting the hypothesis
that ghrelin has a role in the long-term regulation of body
weight [36]. Obese individuals have lower fasting ghrelin
levels, and significantly reduced postprandial ghrelin sup-
pression compared to normal weight individuals [37].
The gene that encodes ghrelin is also responsible for the
encoding of another peptide named obestatin [38]. The role
of obestatin is currently controversial, although it might
have a role as an anti-appetite agent [38–40].
A landmark study by Cummings et al. showed a pro-
found suppression of ghrelin levels (24-h profile) following
RYGB [36]. However the data published since are heter-
ogeneous, with studies showing decreased fasting and
postprandial[41, 42], unchanged fasting and postpran-
dial[14, 43, 44], and increased fasting ghrelin levels after
RYGB [45, 46]. The reason for this inconsistency is
unclear, although multiple theories have been proposed. A
study that investigated the intraoperative changes in the
ghrelin levels during RYGB showed that complete division
of the stomach, forming a vertical pouch, contributes to the
decline in circulating ghrelin levels [47]. It is known that
an intact vagus nerve is required for ghrelin to have an
appetite effect [48]. Technical differences in the procedure
with regard to preservation of the vagus nerve might be
responsible for the differing effects, as shown by a study
that demonstrated a decrease in ghrelin levels on the first
postoperative day after RYGB, followed by an increase to
preoperative levels at 1 month and a further increase at
12 months [49]. An alternative explanation has been pro-
posed, suggesting that the different construction of the
pouch might be responsible: with a vertical pouch, ghrelin-
producing cells are more likely to be excluded than with a
horizontal pouch [50]. Finally, hyperisulinemia and insulin
resistance are associated with ghrelin suppression in obese
individuals [51]. Therefore preoperative differences in
these parameters, as well as differences in the postoperative
improvement, may cause this inconsistency.
A study of patients prior to and 5 days and 2 months after
BPD showed a similar response, with an initial reduction in
fasting ghrelin followed by a return to the preoperative
levels when food consumption resumed to almost preoper-
ative levels [52]. This finding supports the hypothesis that
although the primary source of ghrelin is the gastric mucosa,
small intestinal nutrient exposure is sufficient for food-
induced plasma ghrelin suppression in humans, and gastric
nutrient exposure is not necessary for suppression [53].
Schindler et al. showed an increase in fasting ghrelin
accompanied by a paradoxical decrease in hunger after
LAGB, suggesting that weight loss is independent of cir-
culating plasma ghrelin and relies on changes in eating
behavior induced by gastric restriction [54]. Comparative
studies of RYGB and restrictive procedures (LAGB and
VBG) demonstrated both increased fasting ghrelin [55] and
a blunted postprandial suppression of ghrelin in the
restrictive procedures [25, 56].
Laparoscopic sleeve gastrectomy is a relatively new
bariatric operation that was designed as a restrictive pro-
cedure. However, recent studies challenge this classifica-
tion, showing accelerated gastric emptying after LSG [57].
The fact that the fundus of the stomach, the main location
of ghrelin-producing cells, is excluded in the LSG proce-
dure led to speculation that ghrelin could play a role in the
mechanism of action. Two studies confirmed a decrease in
fasting ghrelin levels after LSG [58, 59]. A recent pro-
spective, double-blind study comparing RYGB and LSG
confirmed a significant postprandial suppression of ghrelin
postoperatively, whereas there was no change in the RYGB
group [28]. In the same study the marked suppression of
ghrelin levels after LSG was associated with greater
appetite reduction and excess weight loss during the first
postoperative year compared to RYGB [28].
The role of ghrelin in the success of bariatric surgery
remains to be further elucidated. However, a review of the
available data by Aylwin showed no correlation between
ghrelin suppression and the degree of success in terms of
weight loss, suggesting its role is only partial [60].
Cholecystokinin
Cholecystokinin (CCK) was the first gut peptide investi-
gated for its role in appetite control. It is secreted by I cells
located in the mucosa of the duodenum, jejunum, and
proximal ileum in response to a meal. The peptide has a
key regulatory role in the gut function: It has been impli-
cated in gastric emptying and distension, gallbladder con-
traction, pancreatic secretion, and intestinal motility [61].
In addition it is involved in the regulation of food intake by
inducing satiety following a meal [62].
World J Surg (2009) 33:1983–1988 1985
123

No changes in the CCK response to a meal have been
detected after RYGB or VBG in some studies, suggesting
that CCK is not a mediator of appetite control and weight
loss after bariatric surgery [62, 63]. However, in a different
study eight subjects were studied before and after VBG,
and six healthy lean volunteers were used as controls.
Although there were no differences between the two groups
in terms of basal CCK levels, the peak of CCK after the
meal was significantly higher in obese patients after VBG
than before VBG and when compared with the control
group [64]. These changes could contribute to the satiety
effects of gastric restrictive operations [64].
Glucose-dependent insulinotropic peptide or gastric
inhibitory peptide
Glucose-dependent insulinotropic peptide (GIP), also
known as gastric inhibitory peptide, is like GLP-1 in that it
has an incretin effect. The common actions shared by GIP
and GLP-1 on islet b-cells occur through structurally dis-
tinct yet related receptors. In addition, GIP promotes
energy storage via direct actions on adipose tissue and
enhances bone formation via stimulation of osteoblast
proliferation and inhibition of apoptosis [11].
Rubino et al. studied the GIP response in diabetic and
nondiabetic patients undergoing RYGB preoperatively and
3 weeks postoperatively. The RYGB procedure reduced
GIP levels in diabetic patients, whereas no changes in GIP
levels were found in the nondiabetics [64]. A study of
patients undergoing JIB demonstrated elevated postpran-
dial GIP levels postoperatively, whereas another study
demonstrated a reduction in GIP [15, 65]. A reduction in
GIP levels has also been detected after BPD [66].
Enteroglucagon and oxyntomodulin
Oyyntomodulin (OXM) belongs to the enteroglucagon
family of peptides [12]. In humans, intravenous OXM
infusion acutely decreases hunger and single-meal food
intake, without reducing the palatability of the meal or
causing nausea [67]. Furthermore, in a 4-week, double-
blind randomized human trial, repeated OXM injections
decreased body weight by 0.5 kg/week more than placebo
[68]. In another study, the enteroglucagon response to
glucose increased markedly after RYGB [62]. This
increase in enteroglucagon occurred at the same time as
development of dumping symptoms, which occurred
exclusively in RYGB patients after glucose intake.
Therefore enteroglucagon was proposed as a marker of the
dumping syndrome after RYGB. Furthermore enterogluc-
agon has been shown to be elevated following JIB and
BPD [66].
Pancreatic polypeptide
Pancreatic polypeptide (PP) is a gut hormone released from
the pancreas in response to ingestion of food. It has been
shown to be reduced in conditions associated with
increased food intake and elevated in anorexia nervosa.
Infusion of PP causes a sustained decrease in both appetite
and food intake [69].
No changes in PP were seen after RYGB, LAGB, or JIB
[13, 49, 65], suggesting that PP levels are not significantly
influenced by bariatric surgery.
The changes in gut hormones after RYGB, the com-
monest bariatric operation are summarized in Table 1.
Conclusions
Gut hormones are affected by bariatric surgical procedures
in multiple ways. It is impossible to approach bariatric
surgery outside the context of gut hormones and vice versa.
More importantly, on many occasions, the mode of action
of the bariatric operations is associated with gut hormone
pathways. Research on this interaction leads not only to
better understanding of these operations, but also offers
new insight into the regulatory systems of metabolism.
Further research will lead to refinement of the current
procedures, perhaps aiming at specific metabolic pathways.
References
1. Sjostrom L, Narbro K, Sjostrom CD et al (2007) Swedish Obese
Subjects Study. Effects of bariatric surgery on mortality in
Swedish obese subjects. N Engl J Med 357:741–752
2. Buchwald H, Avidor Y, Braunwald E et al (2004) Bariatric surgery:
a systematic review and meta-analysis. JAMA 292:1724–1737
3. Morton GJ, Cummings DE, Baskin DG et al (2006) Central
nervous system control of food intake and body weight. Nature
443:289–295
Table 1 Summary of gut hormone changes after Roux-en-Y gastric
bypass (RYGB)
Gut hormone Basal level Postprandial
GLP-1 Unchanged Increased
PYY Unchanged Increased
Ghrelin Inconclusive Decreased
CCK Unchanged Unchanged
GIP Decreased Unknown
PP Unchanged Unchanged
GLP-1 glucagon-like peptide-1; PYY peptide YY; CCK cholecysto-
kinin; GIP glucose-dependent insulinotropic polypeptide; PP pan-
creatic polypeptide
1986 World J Surg (2009) 33:1983–1988
123

4. Flier JS (2004) Obesity wars: molecular progress confronts an
expanding epidemic. Cell 116:337–350
5. Schwartz MW, Woods SC, Seeley RJ et al (2003) Is the energy
homeostasis system inherently biased toward weight gain? Dia-
betes 52:232–238
6. Ahima RS, Prabakaran D, Mantzoros C et al (1996) Role of leptin
in the neuroendocrine response to fasting. Nature 382:250–252
7. Leibel RL, Rosenbaum M, Hirsch J (1995) Changes in energy
expenditure resulting from altered body weight. N Engl J Med
332:621–628
8. Ellacott KL, Halatchev IG, Cone RD (2006) Interactions between
gut peptides and the central melanocortin system in the regulation
of energy homeostasis. Peptides 27:340–349
9. Cummings DE, Overduin J (2007) Gastrointestinal regulation of
food intake. J Clin Invest 117:13–23
10. Neary NM, Small CJ, Druce MR et al (2005) Peptide YY3–36
and glucagon-like peptide-17–36 inhibit food intake additively.
Endocrinology 146:5120–5127
11. Baggio LL, Drucker DJ (2007) Biology of incretins: GLP-1 and
GIP. Gastroenterology 132:2131–2157
12. Drucker DJ (2003) Glucagon-like peptides: regulators of cell
proliferation, differentiation, and apoptosis. Mol Endocrinol
17:161–171
13. le Roux CW, Aylwin SJ, Batterham RL et al (2006) Gut hormone
profiles following bariatric surgery favor an anorectic state,
facilitate weight loss, and improve metabolic parameters. Ann
Surg 243:108–114
14. le Roux CW, Welbourn R, Werling M et al (2007) Gut hormones
as mediators of appetite and weight loss after Roux-en-Y gastric
bypass. Ann Surg 246:780–785
15. Naslund E, Backman L, Holst JJ et al (1998) Importance of small
bowel peptides for the improved glucose metabolism 20 years
after jejunoileal bypass for obesity. Obes Surg 8:253–260
16. Laferrere B, Teixeira J, McGinty J et al (2008) Effect of weight
loss by gastric bypass surgery versus hypocaloric diet on glucose
and incretin levels in patients with type 2 diabetes. Clin Endo-
crinol Metab 93:2479–2485
17. Adrian TE, Ferri GL, Bacarese-Hamilton AJ et al (1985) Human
distribution and release of a putative new gut hormone, peptide
YY. Gastroenterology 89:1070–1077
18. Oesch S, Ruegg C, Fischer B et al (2006) Effect of gastric dis-
tension prior to eating on food intake and feelings of satiety in
humans. Physiol Behav 87:903–910
19. Gehlert DR (1998) Multiple receptors for the pancreatic poly-
peptide (PP-fold) family: physiological implications. Proc Soc
Exp Biol Med 218:7–22
20. Deng X, Wood PG, Sved AF et al (2001) The area postrema
lesions alter the inhibitory effects of peripherally infused pan-
creatic polypeptide on pancreatic secretion. Brain Res 902:18–29
21. Batterham RL, Cowley MA, Small CJ et al (2002) Gut hormone
PYY(3–36) physiologically inhibits food intake. Nature 418:650–654
22. Batterham RL, Cohen MA, Ellis SM et al (2003) Inhibition of
food intake in obese subjects by peptide YY3–36. N Engl J Med
349:941–948
23. le Roux CW, Batterham RL, Aylwin SJ et al (2006) Attenuated
peptide YY release in obese subjects is associated with reduced
satiety. Endocrinology 147:3–8
24. Korner J, Bessler M, Cirilo LJ et al (2005) Effects of Roux-en-Y
gastric bypass surgery on fasting and postprandial concentrations
of plasma ghrelin, peptide YY, and insulin. J Clin Endocrinol
Metab 90:359–365
25. Korner J, Inabnet W, Conwell IM et al (2006) Differential effects
of gastric bypass and banding on circulating gut hormone and
leptin levels. Obesity 14:1553–1561
26. Borg CM, le Roux CW, Ghatei MA et al (2006) Progressive rise
in gut hormone levels after Roux-en-Y gastric bypass suggests
gut adaptation and explains altered satiety. Br J Surg 93:210–215
27. Alvarez Bartolome M, Borque M, Martinez-Sarmiento J et al
(2002) Peptide YY secretion in morbidly obese patients before
and after vertical banded gastroplasty. Obes Surg 12:324–327
28. Karamanakos SN, Vagenas K, Kalfarentzos F et al (2008) Weight
loss, appetite suppression, and changes in fasting and postpran-
dial ghrelin and peptide-YY levels after Roux-en-Y gastric
bypass and sleeve gastrectomy: a prospective, double blind study.
Ann Surg 247:401–407
29. Chelikani PK, Haver AC, Reidelberger RD (2006) Ghrelin
attenuates the inhibitory effects of glucagon-like peptide-1 and
peptide YY (3–36) on food intake and gastric emptying in rats.
Diabetes 55:3038–3046
30. Kojima M, Hosoda H, Date Y et al (1999) Ghrelin is a growth-
hormone-releasing acylated peptide from stomach. Nature
402:656–660
31. Fruhbeck G, Diez Caballero A, Gil MJ (2004) Fundus function-
ality and ghrelin concentrations after bariatric surgery. N Engl J
Med 350:308–309
32. Wren AM, Small CJ, Abbott CR et al (2001) Ghrelin causes
hyperphagia and obesity in rats. Diabetes 50:2540–2547
33. Wren AM, Seal LJ, Cohen MA et al (2001) Ghrelin enhances
appetite and increases food intake in humans. J Clin Endocrinol
Metab 86:5992
34. Callahan HS, Cummings DE, Pepe MS et al (2004) Postprandial
suppression of plasma ghrelin level is proportional to ingested
caloric load but does not predict intermeal interval in humans. J
Clin Endocrinol Metab 89:1319–1324
35. Cummings DE, Purnell JQ, Frayo RS et al (2001) A preprandial
rise in plasma ghrelin levels suggests a role in meal initiation in
humans. Diabetes 50:1714–1719
36. Cummings DE, Weigle DS, Frayo RS et al (2002) Plasma ghrelin
levels after diet-induced weight loss or gastric bypass surgery. N
Engl J Med 346:1623–1630
37. le Roux CW, Patterson M, Vincent RP et al (2005) Postprandial
plasma ghrelin is suppressed proportional to meal calorie content
in normal-weight but not obese subjects. J Clin Endocrinol Metab
90:1068–1071
38. Zhang JV, Ren PG, Avsian-Kretchmer O et al (2005) Obestatin, a
peptide encoded by the ghrelin gene, opposes ghrelin’s effects on
food intake. Science 310:996–999
39. Jackson VR, Nothacker HP, Civelli O (2006) GPR39 receptor
expression in the mouse brain. Neuroreport 17:813–816
40. Gourcerol G, St-Pierre DH, Tache Y (2007) Lack of obestatin
effects on food intake: should obestatin be renamed ghrelin-
associated peptide (GAP)? Regul Pept 141:1–7
41. Geloneze B, Tambascia MA, Pilla VF et al (2003) Ghrelin: a gut-
brain hormone: effect of gastric bypass surgery. Obes Surg
13:17–22
42. Morınigo R, Casamitjana R, Moize V et al (2004) Short-term
effects of gastric bypass surgery on circulating ghrelin levels.
Obes Res 12:1108–1116
43. Faraj M, Havel PJ, Phelis S et al (2003) Plasma acylation-stim-
ulating protein, adiponectin, leptin, and ghrelin before and after
weight loss induced by gastric bypass surgery in morbidly obese
subjects. J Clin Endocrinol Metab 88:1594–1602
44. Stoeckli R, Chanda R, Langer I et al (2004) Changes of body
weight and plasma ghrelin levels after gastric banding and gastric
bypass. Obes Res 12:346–350
45. Vendrell J, Broch M, Vilarrasa N et al (2004) Resistin, adipo-
nectin, ghrelin, leptin, and proinflammatory cytokines: relation-
ships in obesity. Obes Res 12:962–971
World J Surg (2009) 33:1983–1988 1987
123

46. Holdstock C, Engstrom BE, Ohrvall M et al (2003) Ghrelin and
adipose tissue regulatory peptides: effect of gastric bypass sur-
gery in obese humans. J Clin Endocrinol Metab 88:3177–3183
47. Lin E, Gletsu N, Fugate K et al (2004) The effects of gastric
surgery on systemic ghrelin levels in the morbidly obese. Arch
Surg 139:780–784
48. le Roux CW, Neary NM, Halsey TJ et al (2005) Ghrelin does not
stimulate food intake in patients with surgical procedures
involving vagotomy. J Clin Endocrinol Metab 90:4521–4524
49. Sundbom M, Holdstock C, Engstrom BE et al (2007) Early
changes in ghrelin following Roux-en-Y gastric bypass: influence
of vagal nerve functionality? Obes Surg 17:304–310
50. Pories WJ (2008) Ghrelin? Yes, it is spelled correctly. Ann Surg
247:408–410
51. McLaughlin T, Abbasi F, Lamendola C et al (2004) Plasma
ghrelin concentrations are decreased in insulin-resistant obese
adults relative to equally obese insulin-sensitive controls. J Clin
Endocrinol Metab 89:1630–1635
52. Adami GF, Cordera R, Marinari G et al (2003) Plasma ghrelin
concentration in the short-term following biliopancreatic diver-
sion. Obes Surg 13:889–892
53. Parker BA, Doran S, Wishart J et al (2005) Effects of small
intestinal and gastric glucose administration on the suppression of
plasma ghrelin concentrations in healthy older men and women.
Clin Endocrinol (Oxf) 62:539–546
54. Schindler K, Prager G, Ballaban T et al (2004) Impact of lapa-
roscopic adjustable gastric banding on plasma ghrelin, eating
behaviour and body weight. Eur J Clin Invest 34:549–554
55. Nijhuis J, van Dielen FM, Buurman WA et al (2004) Ghrelin,
leptin and insulin levels after restrictive surgery: a 2-year follow-
up study. Obes Surg 14:783–787
56. Leonetti F, Silecchia G, Iacobellis G et al (2003) Different
plasma ghrelin levels after laparoscopic gastric bypass and
adjustable gastric banding in morbid obese subjects. J Clin
Endocrinol Metab 88:4227–4231
57. Melissas J, Daskalakis M, Koukouraki S et al (2008) Sleeve
gastrectomy—a ‘‘food limiting’’ operation. Obes Surg 18:1251–
1256
58. Langer FB, Reza Hoda MA, Bohdjalian A et al (2005) Sleeve
gastrectomy and gastric banding: effects on plasma ghrelin levels.
Obes Surg 15:1024–1029
59. Cohen R, Uzzan B, Bihan H et al (2005) Ghrelin levels and
sleeve gastrectomy in super-super-obesity. Obes Surg 15:1501–
1502
60. Aylwin S (2005) Gastrointestinal surgery and gut hormones. Curr
Opin Endocrinol Diabetes 12:89–98
61. Chandra R, Liddle RA (2007) Cholecystokinin. Curr Opin
Endocrinol Diabetes Obes 14:63–67
62. Kellum JM, Kuemmerle JF, O’Dorisio TM et al (1990) Gastro-
intestinal hormone responses to meals before and after gastric
bypass and vertical banded gastroplasty. Ann Surg 211:763–770
discussion 770–771
63. Rubino F, Gagner M, Gentileschi P et al (2004) The early effect
of the Roux-en-Y gastric bypass on hormones involved in body
weight regulation and glucose metabolism. Ann Surg 240:236–
242
64. Foschi D, Corsi F, Pisoni L et al (2004) Plasma cholecystokinin
levels after vertical banded gastroplasty: effects of an acidified
meal. Obes Surg 14:644–647
65. Sørensen TI, Lauritsen KB, Holst JJ et al (1983) Gut and pan-
creatic hormones after jejunoileal bypass with 3:1 or 1:3 jeju-
noileal ratio. Digestion 26:137–145
66. Sarson DL, Scopinaro N, Bloom SR (1981) Gut hormone changes
after jejunoileal (JIB) or biliopancreatic (BPB) bypass surgery for
morbid obesity. Int J Obes 5:471–480
67. Cohen MA, Ellis SM, Le Roux CW et al (2003) Oxyntomodulin
suppresses appetite and reduces food intake in humans. J Clin
Endocrinol Metab 88:4696–4701
68. Wynne K, Park AJ, Small CJ et al (2005) Subcutaneous oxy-
ntomodulin reduces body weight in overweight and obese sub-
jects: a double-blind, randomized, controlled trial. Diabetes
54:2390–2395
69. Batterham RL, le Roux CW, Cohen MA et al (2003) Pancreatic
polypeptide reduces appetite and food intake in humans. J Clin
Endocrinol Metab 88:3989–3992
1988 World J Surg (2009) 33:1983–1988
123

ORIGINAL STUDY
Remission of Type 2 Diabetes After Gastric Bypass and BandingMechanisms and 2 Year Outcomes
Dimitrios J. Pournaras, MRCS∗†, Alan Osborne, MRCS∗, Simon C. Hawkins, MRCS∗, Royce P. Vincent, MSc†,David Mahon, MD, FRCS∗, Paul Ewings, PhD∗, Mohammad A. Ghatei, PhD†, Stephen R. Bloom, FRCP, DSc†,
Richard Welbourn, MD, FRCS∗, and Carel W. le Roux, MRCP, PhD†
Objective: To investigate the rate of type 2 diabetes remission after gastricbypass and banding and establish the mechanism leading to remission of type2 diabetes after bariatric surgery.Summary Background Data: Glycemic control in type 2 diabetic patients isimproved after bariatric surgery.Methods: In study 1, 34 obese type 2 diabetic patients undergoing eithergastric bypass or gastric banding were followed up for 36 months. Remissionof diabetes was defined as patients not requiring hypoglycemic medication,fasting glucose below 7 mmol/L, 2 hour glucose after oral glucose tolerancetest below 11.1 mmol/L, and glycated haemoglobin (HbA1c) <6%. In study2, 41 obese type 2 diabetic patients undergoing either bypass, banding, or verylow calorie diet were followed up for 42 days. Insulin resistance (HOMA-IR),insulin production, and glucagon-like peptide 1 (GLP-1) responses after astandard meal were measured.Results: In study 1, HbA1c as a marker of glycemic control improved by2.9% after gastric bypass and 1.9% after gastric banding at latest follow-up(P < 0.001 for both groups). Despite similar weight loss, 72% (16/22) ofbypass and 17% (2/12) of banding patients (P = 0.001) fulfilled the definitionof remission at latest follow-up. In study 2, within days, only bypass patientshad improved insulin resistance, insulin production, and GLP-1 responses (allP < 0.05).Conclusions: With gastric bypass, type 2 diabetes can be improved and evenrapidly put into a state of remission irrespective of weight loss. Improvedinsulin resistance within the first week after surgery remains unexplained, butincreased insulin production in the first week after surgery may be explainedby the enhanced postprandial GLP-1 responses.
(Ann Surg 2010;252:966–971)
T ype 2 diabetes mellitus is exponentially increasing because of thecurrent epidemic of obesity. Both these lethal conditions threaten
to overwhelm healthcare resources.1 The most effective treatment forboth type 2 diabetes and obesity is metabolic surgery.2,3 The 2 mostcommonly performed metabolic surgery operations are the Roux-en-Y gastric bypass described in 1967 and laparoscopic gastric band-ing described in 1993.4 The vast improvement in glycemic control andthe concept of remission of type 2 diabetes after metabolic surgery hasbeen established, but the underlying mechanism remains unclear.3,5
From the ∗Department of Bariatric Surgery, Musgrove Park Hospital, Taunton,Somerset, United Kingdom; and †Department of Investigative Medicine, Im-perial Weight Centre, Imperial College London, United Kingdom.
Authors D.J.P. and A.O. contributed equally to this article.Supported by a Royal College of Surgeons Research Fellowship (to D.J.P.), Depart-
ment of Health Clinician Scientist Award (to C.l.R.), programme grants fromthe MRC (G7811974), Wellcome Trust (072643/Z/03/Z), an EU FP6 IntegratedProject Grant LSHM-CT-2003–503041, and the NIHR Biomedical ResearchCentre funding scheme.
Reprints: Richard Welbourn, MD, FRCS, Department of Bariatric Surgery, Mus-grove Park Hospital, Taunton, Somerset, TA1 5DA United Kingdom. E-mail:[email protected].
Copyright C© 2010 by Lippincott Williams & WilkinsISSN: 0003-4932/10/25206-0966DOI: 10.1097/SLA.0b013e3181efc49a
A meta-analysis reported improved glycemic control and re-mission of type 2 diabetes in 83.8% of patients following gastricbypass and 47.8% following gastric banding.3,6,7 However, data com-paring the 2 operations in the same center are limited, and definitionsof remission are inconsistent between studies. The likely reasons forthis include strong surgeon, patient or cultural preference for oneprocedure over another. This may explain the lack of published ran-domized controlled studies comparing different types of operations.
The improved glycemic control after gastric banding dependson weight loss, but after gastric bypass surgery this improvementoccurs before weight loss. Two mechanisms have been proposed toexplain this rapid normalization of glucose control after gastric by-pass. The first suggests that exclusion of the duodenum and proximaljejunum may reduce insulin resistance.8,9 The second involves ex-aggerated responses from the distal small bowel to nutrients. In thelatter hypothesis, gut hormones produced in the distal small bowelsuch as glucagon-like peptide 1 (GLP-1) may act as incretins stim-ulating the beta cells in the pancreas to restore normal first phaseinsulin responses.10
We aimed to investigate the improved glycemic control and rateof remission of type 2 diabetes after gastric bypass and gastric bandingin a homogeneous population, using the same method for assessmentafter each operation. Moreover, to explore potential mechanisms, wemeasured changes in insulin resistance and insulin production in thefirst week after surgery to test the hypothesis that GLP-1 contributesto the improved glycemic control.
METHODSAll human studies were performed according to the principles
of the Declaration of Helsinki. The Somerset Research and Ethicscommittee approved the study (LREC Protocol Number: 05/Q2202/96). Exclusion criteria included pregnancy, substance abuse, morethan 2 alcoholic drinks per day. Written informed consent was ob-tained from all participants.
Study 1: Glycemic Control After GastricSurgery Study
Selection criteria for study 1 included patients with type 2diabetes who chose to have either gastric bypass or gastric bandingoperations. This was not a randomized study, but data were collectedprospectively on 34 consecutive patients with type 2 diabetes whohad surgery by the same surgeon in 1 center over a 3-year period.All patients were given unbiased information about both proceduresduring the initial assessment by the surgeon. This was accompaniedby a patient information leaflet highlighting the advantages and dis-advantages of banding and bypass. Also, patients were encouragedto attend patient support groups and to review available informationon the internet with the objective of ensuring adequate informationabout diabetes remission, complications, and long-term postoperativediet. Patients’ own preferences, based on their under-under-standingof what life would be like after the surgery, determined their opera-tion. Fasting glucose, HbA1c, and dosage of antidiabetic medication
Copyright © 2010 Lippincott Williams & Wilkins. Unauthorized reproduction of this article is prohibited.
966 | www.annalsofsurgery.com Annals of Surgery � Volume 252, Number 6, December 2010

Annals of Surgery � Volume 252, Number 6, December 2010 Diabetes Remission After Gastric Bypass
were recorded preoperatively and during follow-up at 3, 6, 12, 18, 24,and 36 months. In our study, we defined remission of type 2 diabeteswhen all the following criteria were met:
1. Fasting plasma glucose below 7 mmol/L in the absence of medicaltreatment for at least 3 days.
2. A 2-hour plasma glucose below 11.1 mmol/L following an oralglucose tolerance test (OGTT) as specified by the World HealthOrganisation.11
3. Glycated haemoglobin (HbA1c) below 6% after 3 months of lasthypoglycemic agent usage. This measurement was added as it isoften used in the surgical literature.3,6,7
All operations were performed laparoscopically by 1 surgeon(R.W.) between January 2004 and January 2007. At submission, thedata from the latest follow-up which ranged from 24 to 36 monthswere obtained. For the gastric bypass (n = 22), an isolated lessercurve-based, 15 to 20 mL gastric pouch was created, and a retrocolicantegastric Roux limb was made 100-cm long for patients with a bodymass index (BMI) equal to or less than 50 kg/m2 and 150-cm longfor patients with BMI of more than 50 kg/m2.12 The biliopancreaticlimb was 25 cm for all patients.12 For gastric banding (n = 12), theSwedish Adjustable Gastric band (Ethicon Endo-Surgery) and theLAP-BAND (Allergan) bands were used, and the pars flaccida dis-section technique with gastro-gastric tunnelating sutures was used.6
No differences in outcomes such as weight loss, hospital stay, orcomplications were observed between the 2 band types in our overallseries of 107 patients or in this series of 12 patients reported here.Using an enhanced recovery protocol, postoperatively, patients wereallowed free fluids on return to the ward, and diet was recommencedwhen tolerated for both operations. The recommended postoperativediet for the first week was the same for the patients with bandingand bypass. These diets recommend approximately 700 to 1000 kcalper day. Following gastric banding, patients were seen monthly andadjustments were performed until optimal reduction in hunger or re-striction was obtained. Patients were seen at least 6 times in the firstyear and then yearly thereafter.
Study 2: Mechanism of Glycemic Control StudyThe selection criteria for these study groups included patients
with (a) type 2 diabetes and obesity undergoing gastric bypass (n =17), (b) type 2 diabetes and obesity undergoing gastric banding (n =9), (c) type 2 diabetes and obesity undergoing very low calorie dietfor 1 week (n = 15), and (d) obesity without insulin resistance under-going gastric bypass (n = 5). A 2-week preoperative diet of 1000 kcalwas used in all patients before surgery. For the patients with type 2diabetes, the glycemic control was optimized with pharmacotherapyand lifestyle changes for 6 months before surgery. None of the pa-tients was on insulin during the study, and there was no difference inthe usage of hypoglycemic agents between the groups with diabetes.Patients were studied immediately preoperatively and at 2, 4, 7, and42 days after surgery, with the exception of the very low calorie dietgroup. These patients were studied at day 0, 2, 4, and 7. Following a12-hour fast, a venous catheter was placed and blood was obtained.In patients who had bypass surgery, further collections of blood intubes containing Ethylenediaminetetraacetic acid (EDTA) and apro-tinin were then taken at 15, 30, 60, 90, 120, 150, and 180 minutes aftera 400 kcal standard meal. Samples were immediately centrifuged andstored in a −80◦C freezer until analyzed with an established GLP-1assay,13 automated glucose analyzer (Abbott laboratories, Chicago,IL), and an automated insulin assay (Abbott laboratories, Chicago,IL). Delta insulin was defined as the difference between a 0 minuteand 15 minute insulin measurement.14
Results were analyzed using SPSS statistical software (SPSSInc, Chicago, IL). Data are either expressed as mean (standard devi-
ation) or median (range). Fisher exact test was used for categoricaldata. Time taken to diabetes remission was compared between opera-tive groups by log-rank test. ANOVA with post hoc Dunnett test wasused for HOMA-IR, delta insulin, and GLP-1 responses. The Mann-Whitney U test was used for nonparametric demographic data. Theunpaired t test was used for parametric demographic data. Resultswere considered significant if P < 0.05.
RESULTS
Study 1: Glycemic Control After Gastric SurgeryAt Musgrove Park Hospital, similar numbers of diabetic and
nondiabetic patients had gastric bypass (n = 109) and gastric banding(n = 107) between January 2004 and January 2007, supporting thepremise that the surgeon did not have a preference. A total of 34consecutive patients with type 2 diabetes requiring hypoglycemicmedication were identified preoperatively (16%). Of the 34 pa-tients, 22 patients underwent gastric bypass and 12 underwent gastricbanding.
Surgery was performed between January 2004 and January2007 and at submission, minimum follow-up was 24 months (range,24–36 months), and no patient was lost to follow-up. There wereno significant differences in the demographic characteristics, dura-tion of diabetes, or pre- and postoperative BMI between the groups(Table 1). Patients remained obese postoperatively with BMIs of 33(5.2) kg/m2 for gastric bypass and 32.6 (5.1) kg/m2 for gastric band-ing patients. There were no significant differences in weight at anytime point during the 3-year period (Fig. 1). Twelve of the 22 gastricbypass patients (54%) and 4 of the 12 gastric banding patients (33%)required insulin therapy preoperatively (P = 0.04). There was oneearly complication in a gastric bypass patient who recovered afterrequiring a reoperation on postoperative day 1 for a small bowel en-terotomy. The patient was discharged fully recovered after 114 daysand the case was described elsewhere.15 Diabetic gastric bypass andgastric banding patients achieved less weight loss compared with thenondiabetic patients in our overall series (data not shown). Therewas no difference in median length of stay for gastric bypass be-tween patients with diabetes (n = 22, 4 days range, 1–114) or withoutdiabetes (n = 87, 3 days range, 1–44) (P = 0.47). The nondiabetic pa-tient that required hospital admission for 44 days was also described
TABLE 1. Study 1: Patient Characteristics Presented asMean (Standard Deviation) Except Where the Median(Range) is Indicated
Bypass Banding P ∗
Age (yr) 46.0 (9.6) 47.4 (10.9) 0.71
Preoperative weight (kg) 137.4 (22.9) 137.7 (31.8) 0.97
Preoperative BMI 47.4 (7.2) 47.1 (7.1) 0.90
Preoperative HbA1c 9.1 (1.9) 8.4 (1.7) 0.29
Duration of diabetes (yr) 7.0 (1−18) 5.5 (1−14) 0.61
Proportion on insulin 12/22 (54%) 4/12 (33%) 0.04preoperatively (%)
Follow-up (mo) 29.5 (8.0) 33.0 (7.5) 0.21
% Total weight loss 29.5 (8.4) 28.5 (10.0) 0.76
% Excess BMI loss 63.3 (30.8−103.2) 62.3 (45.1−105.9) 0.92
BMI at follow-up 33.0 (5.2) 32.6 (5.1) 0.80
HbA1c at follow-up 6.2 (1.2) 6.5 (1.2) 0.59
Fisher exact test was used for categorical data.∗ P < 0.05 by t test; or Mann - Whitney where median is erported.BMI indicates body mass index. HbAlc indicates glycated haemoglobin.
Copyright © 2010 Lippincott Williams & Wilkins. Unauthorized reproduction of this article is prohibited.
C© 2010 Lippincott Williams & Wilkins www.annalsofsurgery.com | 967
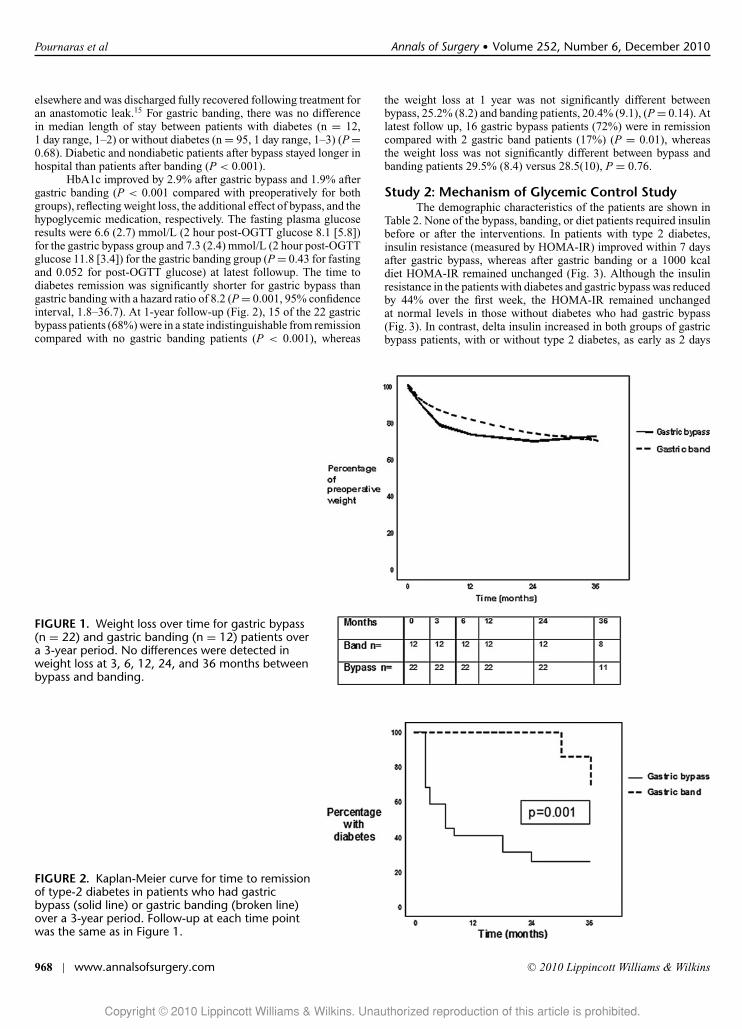
Pournaras et al Annals of Surgery � Volume 252, Number 6, December 2010
elsewhere and was discharged fully recovered following treatment foran anastomotic leak.15 For gastric banding, there was no differencein median length of stay between patients with diabetes (n = 12,1 day range, 1–2) or without diabetes (n = 95, 1 day range, 1–3) (P =0.68). Diabetic and nondiabetic patients after bypass stayed longer inhospital than patients after banding (P < 0.001).
HbA1c improved by 2.9% after gastric bypass and 1.9% aftergastric banding (P < 0.001 compared with preoperatively for bothgroups), reflecting weight loss, the additional effect of bypass, and thehypoglycemic medication, respectively. The fasting plasma glucoseresults were 6.6 (2.7) mmol/L (2 hour post-OGTT glucose 8.1 [5.8])for the gastric bypass group and 7.3 (2.4) mmol/L (2 hour post-OGTTglucose 11.8 [3.4]) for the gastric banding group (P = 0.43 for fastingand 0.052 for post-OGTT glucose) at latest followup. The time todiabetes remission was significantly shorter for gastric bypass thangastric banding with a hazard ratio of 8.2 (P = 0.001, 95% confidenceinterval, 1.8–36.7). At 1-year follow-up (Fig. 2), 15 of the 22 gastricbypass patients (68%) were in a state indistinguishable from remissioncompared with no gastric banding patients (P < 0.001), whereas
FIGURE 1. Weight loss over time for gastric bypass(n = 22) and gastric banding (n = 12) patients overa 3-year period. No differences were detected inweight loss at 3, 6, 12, 24, and 36 months betweenbypass and banding.
FIGURE 2. Kaplan-Meier curve for time to remissionof type-2 diabetes in patients who had gastricbypass (solid line) or gastric banding (broken line)over a 3-year period. Follow-up at each time pointwas the same as in Figure 1.
the weight loss at 1 year was not significantly different betweenbypass, 25.2% (8.2) and banding patients, 20.4% (9.1), (P = 0.14). Atlatest follow up, 16 gastric bypass patients (72%) were in remissioncompared with 2 gastric band patients (17%) (P = 0.01), whereasthe weight loss was not significantly different between bypass andbanding patients 29.5% (8.4) versus 28.5(10), P = 0.76.
Study 2: Mechanism of Glycemic Control StudyThe demographic characteristics of the patients are shown in
Table 2. None of the bypass, banding, or diet patients required insulinbefore or after the interventions. In patients with type 2 diabetes,insulin resistance (measured by HOMA-IR) improved within 7 daysafter gastric bypass, whereas after gastric banding or a 1000 kcaldiet HOMA-IR remained unchanged (Fig. 3). Although the insulinresistance in the patients with diabetes and gastric bypass was reducedby 44% over the first week, the HOMA-IR remained unchangedat normal levels in those without diabetes who had gastric bypass(Fig. 3). In contrast, delta insulin increased in both groups of gastricbypass patients, with or without type 2 diabetes, as early as 2 days
Copyright © 2010 Lippincott Williams & Wilkins. Unauthorized reproduction of this article is prohibited.
968 | www.annalsofsurgery.com C© 2010 Lippincott Williams & Wilkins

Annals of Surgery � Volume 252, Number 6, December 2010 Diabetes Remission After Gastric Bypass
TABLE 2. Study 2: Demographics of Patients Undergoing Standard Meal TestsPreoperatively and at Day 2, 4, 7, and 42
Diet + DM Band + DM Bypass + DM Bypass Non DM P
Number 15 9 17 5Age (yr) 43.7 (10) 48.1 (8.7) 48.3 (8.6) 42.4 (6.9) NSPreoperative weight (kg) 139.0 (37.5) 129.5 (28.2) 138.9 (35.5) 143.8 (21.6) NSPreoperative BMI 46.9 (8.1) 43.5 (11.7) 48.0 (5.7) 52.2 (3.3) NSPreoperative glucose 5.9 (1.1) 6.1 (1.2) 7.1 (2) 5.9 (1.1) NSPreoperative HOMA-IR 7.1 (3) 8.8 (9.6) 9.2 (7.8) 2.1 (0.4) <0.05
Comparisons are made between patients with diabetes (DM) who had very low calorie diet, gastric banding, gastricbypass or patients who did not have diabetes but underwent gastric bypass.
BMI indicates body mass index. NS indicates non-significant. HOMA-IR indicates homeostatic model assessment insulinresistance.
FIGURE 3. Progression of insulin resistance in patients withtype 2 diabetes following a 1000 kcal diet with no surgeryover 7 days (n = 15) and gastric band (n = 9), gastric bypass(n = 17) and nondiabetic patients following gastric bypass(n = 5) over a period of 42 days. The solid line indicates thelevel at which HOMA-IR is considered to indicate insulinresistance. ∗P < 0.05 compared with preoperative state. #P <0.05 compared with gastric banding at same time point. †P <0.05 compared with very low calorie diet at same time point.
after surgery (Fig. 4). This increase is mirrored for GLP-1 in bothbypass groups (Fig. 5). Fasting levels of GLP-1 in the group withtype 2 diabetes who had gastric bypass did not change over the first42 days (data not shown, P = 0.44).
DISCUSSIONThis study is a direct comparison of the improved glycemic
control and “remission” rate for type 2 diabetes in the 2 commonestmetabolic operations performed in a single center serving a homo-geneous population. In study 1, the bypass and banding groups hadsimilar age, sex, and BMIs pre- and postoperatively. The strikingfinding was that at latest follow-up, the HbA1c improved by 1.9%or more in both groups, whereas the proportion achieving fastingplasma glucose concentrations below 7 mmol/L (off all hypoglyce-mic medication) was much higher for gastric bypass (72%) than forgastric banding (17%). In addition, the rate of “remission” over timewas markedly quicker for the gastric bypass. The latter 2 findings
FIGURE 4. Changes in delta insulin are shown after gastricbypass in patients with type 2 diabetes (n = 17) and withouttype 2 diabetes (n = 5), defined as the difference betweenfasting and 15 minutes postprandial insulin. ∗P < 0.05compared with preoperative state for both groups.
strongly suggest that the rapidly improved glycemic control cannotbe attributed to weight loss alone.
In addition to these findings, in study 2 we found an unexpectedimprovement in insulin resistance of 44% within 7 days after gastricbypass. Insulin resistance after laparoscopic gastric banding or thevery low calorie diet did not change within 7 days. Furthermore,patients without diabetes undergoing gastric bypass did not have anychange in their insulin resistance.
Insulin production as measured by delta insulin between 0and 15 minutes also increased after gastric bypass in all patientsirrespective of whether they had type 2 diabetes. Both responsesof GLP-1 and delta insulin reached significance within 2 days aftersurgery. Thus, it is possible that the changes in insulin productionare associated with the enhanced GLP-1 responses. However, fastingGLP-1 levels remain unchanged within the first 42 days.
The patients participating in study 2, the mechanism ofglycemic control study, did not require insulin therapy before surgery.The patients also had good glycemic control following a 6 month med-ical optimization program before the study and were thus less likelyto be glucotoxic. This may explain why changes in diet and calorieconsumption alone in the banding and very low calorie diet groupsdid not change HOMA-IR.
Copyright © 2010 Lippincott Williams & Wilkins. Unauthorized reproduction of this article is prohibited.
C© 2010 Lippincott Williams & Wilkins www.annalsofsurgery.com | 969

Pournaras et al Annals of Surgery � Volume 252, Number 6, December 2010
FIGURE 5. Area under the curve over a 3-hour period GLP-1after gastric bypass in patients with type 2 diabetes (n = 17)and without type 2 diabetes (n = 5) after a 400 kcal meal.∗P < 0.05 compared with preoperative state for both groups.
Other direct comparisons of glycemic control between earlychanges after gastric bypass and gastric banding also favored gas-tric bypass, suggesting that there may be a different mechanism,independent of weight loss, which explains diabetes remission afterbypass.16,17 Although in study 1, the glycemic control study, the remis-sion rate for the gastric bypass group is comparable with other studies,the remission rate for the gastric banding group was lower.4–7,16–20 Thedifferences in our results could be attributed to the way we defined re-mission of type 2 diabetes as fasting plasma glucose below 7 mmol/Land 2 hour post oral glucose tolerance test plasma glucose below11.1 mmol/L with a HbA1c below 6% off all hypoglycemic agents,which is more stringent than previous studies.5,14,17–20 Moreover, study1, the glycemic control study, only included patients with type 2 di-abetes requiring medication of which a substantial portion requiredinsulin. In addition, the duration of diabetes before surgery rangedup to 18 years with a median of 7 years in the bypass group and5.5 years in the banding group. Prolonged duration of disease hasbeen associated with poorer remission rates of diabetes after bariatricsurgery.7 Also, the smaller proportion of gastric banding patients re-quiring insulin in our study might be expected to favor the bandinggroup.
Schauer et al reported inferior weight loss after gastric bypassin patients with diabetes compared with the overall cohort, for rea-sons that are not known.3,7 This observation could explain the similarweight loss between our gastric bypass and banding groups. Further-more, intensive follow-up with regular band adjustments has beenshown to improve weight loss outcomes.21 This is a possible explana-tion for the lack of difference in the weight loss between the 2 groups.Kim et al also reported no difference in weight loss between bandingand bypass in nondiabetic obese subjects.18
Insulin resistance would usually be expected to increase aftermajor abdominal operations where bowel manipulation and durationare similar to gastric bypass.22 Previous reports suggested that theeffect of gastric bypass on glucose metabolism may be partly becauseof endocrine mechanisms.8,23 A recent study showed a reduction ininsulin resistance following both band and diet in addition to bypass.24
However, the earliest time point patients were studied was 4 weeks
postintervention, and therefore the insulin resistance changes wereattributed to weight loss.24
Data published from our unit has shown that delta insulin wasunchanged after 19 months following gastric banding.14 Changes inresponses of the incretin, GLP-1, are associated with the enhanceddelta insulin.25 However, the rapid improvement in insulin resistanceafter gastric bypass surgery is observed even if patients are kept nilby mouth9 and thus is unlikely related to GLP-1, as fasting levels ofGLP-1 did not change in our study.
A limitation of the glycemic control after gastric surgery study(study 1) is the fact that it was not randomized. Another limitationwas the relatively small groups which may explain the nonsignificantdifference in 2 hour post-OGTT glucose results between the patientswith bands and bypasses. However, the groups were well-matchedand patients selected their own operation without any bias from thesurgeon. For the mechanisms of glycemic control study (study 2),HOMA-IR was preferred over more invasive techniques, as it hasbeen used to track changes in insulin resistance over time.26,27 Thus,our results can now be used to power new randomized controlled trialsusing more invasive measurements of insulin resistance. Anotherlimitation is the number of calories consumed by the bypass andbanding group in the first week postoperatively. These were in thesame order as that of the very low calorie diet group, although it wasnot practical to achieve an identical match.
In conclusion, gastric bypass and gastric banding lead to vastlyimproved glycemic control, whereas type 2 diabetes is more likely togo into a state indistinguishable from remission after gastric bypassthan gastric banding, irrespective of weight loss. Increased insulinproduction in the first week after gastric bypass may be explainedby the enhanced postprandial GLP-1 responses. However, the mech-anism of the rapidly improved insulin resistance after gastric bypassremains unclear. Even despite our imperfect understanding, the datasuggest that sustained improvements in glycemic control and evenremission of type 2 diabetes can now be considered a realistic optionfollowing metabolic surgery.
REFERENCES1. King H, Aubert RE, Herman WH. Global burden of diabetes, 1995–2025: preva-
lence, numerical estimates, and projections. Diabetes Care. 1998;21:1414–1431.
2. Sjostrom L, Narbro K, Sjostrom CD, et al. Effects of bariatric surgery onmortality in Swedish obese subjects.N Engl J Med. 2007;357:741–752.
3. Buchwald H, Avidor Y, Braunwald E, et al. Bariatric surgery: a systematicreview and meta-analysis. JAMA. 2004;292:1724–1737.
4. Buchwald H, Williams SE. Bariatric surgery worldwide 2003. Obes Surg.2004;14:1157–1164.
5. Levy P, Fried M, Santini F. The comparative effects of bariatric surgery onweight and type 2 diabetes. Obes Surg. 2007;17:1248–1256.
6. O’Brien PE, Dixon JB, Laurie C, et al. A prospective randomized trial ofplacement of the laparoscopic adjustable gastric band: comparison of theperigastric and pars flaccida pathways. Obes Surg. 2005;15:820–826.
7. Schauer PR, Burguera B, Ikramuddin S, et al. Effect of laparoscopic Roux-enY gastric bypass on type 2 diabetes mellitus. Ann Surg. 2003;238:467–484.
8. Rubino F, Forgione A, Cummings DE, et al. The mechanism of diabetes controlafter gastrointestinal bypass surgery reveals a role of the proximal small intes-tine in the pathophysiology of type 2 diabetes. Ann Surg. 2006; 244:741–749.
9. Wickremesekera K, Miller G, Naotunne TD, et al. Loss of insulin resistanceafter Roux-en-Y gastric bypass surgery: a time course study. Obes Surg.2005;15:474–481.
10. Polyzogopoulou EV, Kalfarentzos F, Vagenakis AG, et al. Restorationof euglycemia and normal acute insulin response to glucose in obesesubjects with type 2 diabetes following bariatric surgery. Diabetes.2003;52:1098–1103.
11. World Health Organization. Definition, diagnosis and classification of diabetesmellitus and its complications. Part 1: diagnosis and classification of diabetesmellitus. Report of a WHO Consultation. Geneva, Switzerland: World HealthOrganization, Department of Noncommunicable Disease Surveillance; 1999.
Copyright © 2010 Lippincott Williams & Wilkins. Unauthorized reproduction of this article is prohibited.
970 | www.annalsofsurgery.com C© 2010 Lippincott Williams & Wilkins

Annals of Surgery � Volume 252, Number 6, December 2010 Diabetes Remission After Gastric Bypass
12. Higa KD, Boone KB, Ho T, et al. Laparoscopic Roux-en-Y gastric bypass formorbid obesity: technique and preliminary results of our first 400 patients.Arch Surg. 2000;135:1029–1033; discussion 1033–1034.
13. Kreymann B, Williams G, Ghatei MA, et al. Glucagon-like peptide-1 7–36: aphysiological incretin in man. Lancet. 1987;2:1300 –1304.
14. le Roux CW, Welbourn R, Werling M, et al. Gut hormones as mediators ofappetite and weight loss after Roux-en-Y gastric bypass. Ann Surg. 2007;246:780–785.
15. Pournaras DJ, Jafferbhoy S, Titcomb D, et al. Three hundred laparoscopicRoux-en-Y gastric bypasses: managing the learning curve in higher risk pa-tients. Obes Surg. 2010;20:290–294.
16. Bowne WB, Julliard K, Castro AE, et al. Laparoscopic gastric bypass is superiorto adjustable gastric band in super morbidly obese patients: a prospective,comparative analysis. Arch Surg. 2006;141:683–689.
17. Parikh M, Ayoung-Chee P, Romanos E, et al. Comparison of rates of resolutionof diabetes mellitus after gastric banding, gastric bypass, and biliopancreaticdiversion. J Am Coll Surg. 2007;205:631–635.
18. Kim J, Daud A, Ude AO, et al. Early U.S. outcomes of laparoscopic gastricbypass versus laparoscopic adjustable silicone gastric banding for morbidobesity. Surg Endosc. 2006;20:202–209.
19. Weber M, Muller MK, Bucher T, et al. Laparoscopic gastric bypass is superiorto laparoscopic gastric banding for treatment of morbid obesity. Ann Surg.2004;240:975–982; discussion 982–983.
20. Dixon JB, O’Brien PE. Health outcomes of severely obese type 2 diabeticsubjects 1 year after laparoscopic adjustable gastric banding. Diabetes Care.2002;25:358–363.
21. Shen R, Dugay G, Rajaram K, et al. Impact of patient follow-up on weight lossafter bariatric surgery. Obes Surg. 2004;14:514 –519.
22. Robertson MD, Bickerton AS, Dennis AL, et al. Enhanced metabolic cycling insubjects after colonic resection for ulcerative colitis. J Clin Endocrinol Metab.2005;90:2747–2754.
23. Rubino F, Gagner M, Gentileschi P, et al. The early effect of the Roux-en-Ygastric bypass on hormones involved in body weight regulation and glucosemetabolism. Ann Surg. 2004;240:236–242.
24. Lee WJ, Lee YC, Ser KH, et al. Improvement of insulin resistance after obesitysurgery: a comparison of gastric banding and bypass procedures. Obes Surg.2008;18:1119–1125.
25. Laferrere B, Teixeira J, McGinty J, et al. Effect of weight loss by gas-tric bypass surgery versus hypocaloric diet on glucose and incretin lev-els in patients with type 2 diabetes. Clin Endocrinol Metab. 2008;93:2479–2485.
26. Wallace TM, Levy JC, Matthews DR. Use and abuse of HOMA modeling.Diabetes Care. 2004;27:1487–1495.
27. U.K. Prospective Diabetes Study Group. U.K. prospective diabetes study 16.Overview of 6 years’ therapy of type II diabetes: a progressive disease. Dia-betes. 1995;44:1249–1258.
Copyright © 2010 Lippincott Williams & Wilkins. Unauthorized reproduction of this article is prohibited.
C© 2010 Lippincott Williams & Wilkins www.annalsofsurgery.com | 971
CLINICAL RESEARCH
The Gut Hormone Response Following Roux-en-Y GastricBypass: Cross-sectional and Prospective Study
Dimitrios J. Pournaras & Alan Osborne & Simon C. Hawkins & David Mahon &
Mohammad A. Ghatei & Steve R. Bloom & Richard Welbourn & Carel W. le Roux
Received: 5 June 2009 /Accepted: 22 September 2009# Springer Science + Business Media, LLC 2009
AbstractBackground Bariatric surgery is the most effective treat-ment option for obesity, and gut hormones are implicated inthe reduction of appetite and weight after Roux-en-Ygastric bypass. Although there is increasing interest in thegut hormone changes after gastric bypass, the long-termchanges have not been fully elucidated.Methods Thirty-four participants were studied cross-sectionally at four different time points, pre-operatively(n=17) and 12 (n=6), 18 (n=5) and 24 months (n=6) afterlaparoscopic Roux-en-Y gastric bypass. Another group ofpatients (n=6) were studied prospectively (18–24 months).All participants were given a standard 400 kcal meal after a12-h fast, and plasma levels of peptide YY (PYY) andglucagon-like peptide-1 (GLP-1) were correlated withchanges in appetite over 3 h using visual analogue scores.Results The post-operative groups at 12, 18 and 24 monthshad a higher post-prandial PYY response compared to pre-operative (p<0.05). This finding was confirmed in theprospective study at 18 and 24 months. There was a trendfor increasing GLP-1 response at 18 and 24 months, butthis did not reach statistical significance (p=0.189) in theprospective study. Satiety was significantly reduced in thepost-operative groups at 12, 18 and 24 months compared topre-operative levels (p<0.05).
Conclusions Roux-en-Y gastric bypass causes an enhancedgut hormone response and increased satiety following ameal. This response is sustained over a 24-month periodand may partly explain why weight loss is maintained.
Keywords Roux-en-Y gastric bypass . RYGB . Guthormones . Peptide YY. Glucagon-like peptide-1 . GLP-1
Introduction
Surgical procedures are currently the only effective therapyfor long-term weight loss [1]. There are also profoundeffects on obesity-related comorbidities, such as type 2diabetes, hypertension and sleep apnoea, following bariatricsurgery [2].
Gut hormones cause hunger and satiety effects and thushave an integral role in appetite regulation. The discoveryof these appetite-signalling peptides, the gut hormones, hasled to the establishment of the concept of the gut–brainaxis. They have been implicated to play an important rolein both weight loss and diabetes improvement after gastricbypass surgery [3].
Roux-en-Y gastric bypass (RYGB) was designed topromote weight loss due to a combination of reduced stomachvolume and malabsorption of nutrients. It is now known thatcalorie malabsorption does not explain the weight loss;however the effects of RYGB are not entirely due to thereduced stomach volume. A number of studies have shownthat changes in gut hormone concentrations may partlyexplain the weight loss following gastric bypass surgery.
We have recently demonstrated a causative link betweenthe exaggerated peptide YY (PYY) and glucagon-likepeptide-1 (GLP-1) response and the enhanced satiety afterRYGB [4]. In that study increased post-prandial PYY and
D. J. Pournaras :A. Osborne : S. C. Hawkins :D. Mahon :R. Welbourn (*)Department of Bariatric Surgery,Musgrove Park Hospital,Taunton, Somerset TA1 5DA, UKe-mail: [email protected]
D. J. Pournaras :M. A. Ghatei : S. R. Bloom :C. W. le RouxDepartment of Metabolic Medicine, Imperial College London,London W12 0NN, UK
OBES SURGDOI 10.1007/s11695-009-9989-1

GLP-1 responses were seen within days after RYGB, priorto any significant weight loss. Furthermore in a comparisonof good versus poor responders to RYGB in terms ofweight loss, suboptimal PYY and GLP-1 post-prandialresponses were associated with the poor responders.Finally, in a randomised double-blind saline controlledstudy of patients after RYGB and laparoscopic adjustablegastric banding (LAGB), inhibition of the gut hormoneresponse with octeotride (a somatostatin analogue) in-creased food intake in the RYGB group, but not in theLAGB group, suggesting that gut hormones might play arole in the reduced food intake after RYGB [4].
Although there is increasing interest in the gut hormonechanges after gastric bypass, the long-term changes havenot been fully elucidated. The primary aim of this studywas to evaluate the changes in the PYY and GLP-1response in the first 24 months after gastric bypass.
Materials and Methods
All human studies were performed according to theprinciples of the Declaration of Helsinki. The SomersetResearch and Ethics committee approved the study(LREC Protocol Number: 05/Q2202/96). Exclusioncriteria included pregnancy, substance abuse, more thantwo alcoholic drinks per day and aerobic exercise formore than 30 min three times per week. Writteninformed consent was obtained from all participants.
Thirty-four participants were studied cross-sectionally atfour different time points, pre-operatively (n=17) and 12(n=6), 18 (n=5) and 24 months (n=6) after RYGB. Anothergroup of patients (n=6) were studied prospectively. Follow-ing a 12-h fast, a venous catheter was placed and blood wasobtained. Further collections of blood in tubes containingEDTA and aprotinin were then taken at 15, 30, 60, 90, 120,150 and 180 min after a 400 kcal standard meal. The 400-kcal meal macromutrient content was 48.8% carbohydrate,10.2% protein and 41% fat. Samples were immediatelycentrifuged and stored in a −80°C freezer until analysis.Plasma levels of the gut hormones PYY and GLP-1 werecompared at each time point. Visual analogue scales (VAS)were used to measure hunger and satiety immediately beforeconsumption of the meal and at 60, 120 and 180 min later.
Surgical Technique
Laparoscopic Roux-en-Y gastric bypass was performed,creating an isolated, lesser curve based, 15–20-mL gastricpouch excluding the fundus [5]. A retrocolic antegastricRoux limb was made 100 cm long for patients with a bodymass index (BMI) equal to or less than 50 kg/m2 and150 cm long for patients with BMI of more than 50 kg/m2
[5]. The bilio-pancreatic limb was 25 cm for all patients.The subjects included in the study had similar outcomes interms of excess weight loss compared with the rest of thesurgical cohort as a whole (data not shown).
Hormone Assays
All samples were assayed in duplicate. PYY-likeimmunoreactivity was measured with a specific andsensitive radioimmunoassay, which measures both thefull length (PYY1–36) and the fragment (PYY3–36) [6,7]. Plasma GLP-1 was measured in duplicate by estab-lished in-house radioimmunoassay [8, 9].
Statistical Analysis
Patient demographics, BMI and hormone levels areexpressed as means ± standard error of the mean. Values
Group Number (n) Age Sex (no. of women)
Pre-operative 17 47.8±2.0 11
12 months post-operative 6 45.2±4.0 5
18 months post-operative 5 49.6±3.3 3
24 months post-operative 6 43.3±4.1 6
Prospective study 6 47.8±2.0 5
Table 1 Demographic charac-teristics of patients in cross-sectional study and prospectivestudy
Fig. 1 BMI before and 12, 18 and 24 months after gastric bypass
OBES SURG

for the area under the curve were calculated with the use ofthe trapezoidal rule. End points were compared with the useof two-tailed, paired Student t tests or analysis of variance.Results were analysed using SPSS statistical software(SPSS Inc., Chicago, IL, USA).
Results
Cross-sectional Study
The characteristics of the four groups can be seen inTable 1. The BMI in the post-operative groups issignificantly lower than the pre-operative group as expected(Fig. 1). However there was no significant differencebetween the three post-operative groups. The PYY post-
prandial response, measured as area under the curve, wassignificantly enhanced in all the post-operative groupscompared to the pre-operative group (Fig. 2). There was atrend for increased GLP-1 response in the post-operativegroups, but this did not reach statistical significance(Fig. 3). Satiety as measured with the VAS was significant-ly increased in all post-operative groups (Fig. 4).
Prospective Study
The characteristics of the patients participating in theprospective study can be seen in Table 1. The PYYresponse was enhanced post-operatively in this groupconfirming the findings of the cross-sectional study(Fig. 1). However the GLP-1 response was not increasedsignificantly post-operatively (p=0.189).
Fig. 2 The PYY response in thecross-sectional (12, 18 and24 months) and prospectivestudies (18–24 months combined)
Fig. 3 The GLP-1 response inthe cross-sectional (12, 18 and24 months) and prospectivestudies (18–24 monthscombined)
OBES SURG

Discussion
This study confirms that the enhanced PYY post-prandialresponse and the associated enhanced satiety followinggastric bypass surgery are sustained for at least 24 monthspost-operatively. The findings of the cross-sectional studyare further supported by the findings of the prospectivestudy. The fact that the above cannot be confirmed for theGLP-1 response may be due to the small number of patientsincluded in the prospective study.
This study is one of the very few studies investigatingthe PYY post-prandial response for longer than 6 months.Limitations include the low number of patients and thecross-sectional design. However the impact of the latter wasminimised with the prospective study. The majority ofparticipants were female, reflecting the higher number offemales undergoing bariatric surgery.
Korner et al. showed an exaggerated post-prandialPYY response after RYGB in a study of 12 patients post-RYGB with a mean post-operative period was 35 months[10]. Chan et al. also showed an enhanced response inanother cross-sectional study of six patients 18 monthsfollowing RYGB [11]. Furthermore a recent study on eightpatients 9–48 months following RYGB confirmed theabove findings [12]. Two prospective studies showed anincrease in the basal (starving) PYY levels followingRYGB [13, 14].
Prospective studies measuring the post-prandial PYYresponse in the long term are limited. Borg et al. showed anincreased post-prandial response in a prospective study with6-month follow-up [15]. The same study suggested that gutadaptation might play a role in long-term changes in the guthormone response. Three studies with 12-month follow-upshowed similar results [16–18]. Our results are in accor-dance with the aforementioned studies with a minimumfollow-up of 6 months extending up to a year. These resultsallow us to hypothesise that the enhanced PYY response is
sustained for at least 24 months and could explain the well-described long-term weight loss after gastric bypasssurgery.
Similar studies investigated the changes in the GLP-1response. Cross-sectional studies have indicated an en-hanced post-prandial response following RYGB [10, 12,19], while prospective studies with a follow-up extendingto 12 months confirmed this [15, 20–22]. Our findingsshowed a trend for an enhanced GLP-1 response post-operatively, but this did not reach significance.
In conclusion, RYGB leads to an enhanced PYY post-prandial response and increased satiety. These changes aresustained over a 24-month period. These findings suggest arole for gut hormones in the maintenance of weight loss inthe long term.
References
1. Sjöström L, Narbro K, Sjöström CD, et al. Effects of bariatricsurgery on mortality in Swedish obese subjects. N Engl J Med.2007;357:741–52.
2. Buchwald H, Avidor Y, Braunwald E, et al. Bariatric surgery: asystematic review and meta-analysis. JAMA. 2004;292:1724–37.
3. Vincent RP, le Roux CW. Changes in gut hormones after bariatricsurgery. Clin Endocrinol (Oxf). 2008;69:173–9.
4. le Roux CW, Welbourn R, Werling M, et al. Gut hormones asmediators of appetite and weight loss after Roux-en-Y gastricbypass. Ann Surg. 2007;246:780–5.
5. Higa KD, Ho T, Boone KB. Laparoscopic Roux-en-Y gastricbypass: technique and 3-year follow-up. J Laparoendosc AdvSurg Tech A. 2001;11:377–82.
6. Batterham RL, Cohen MA, Ellis SM, et al. Inhibition of foodintake in obese subjects by peptide YY3–36. N Engl J Med.2003;349:941–8.
7. Savage AP, Adrian TE, Carolan G, et al. Effects of peptide YY(PYY) on mouth to caecum intestinal transit time and on the rateof gastric emptying in healthy volunteers. Gut. 1987;28:166–70.
8. Kreymann B, Williams G, Ghatei MA, et al. Glucagon-likepeptide-1 7–36: a physiological incretin in man. Lancet.1987;2:1300–4.
9. Adrian TE, Bloom SR, Bryant MG, et al. Distribution and releaseof human pancreatic polypeptide. Gut. 1976;17:940–44.
10. Korner J, Bessler M, Cirilo LJ, et al. Effects of Roux-en-Y gastricbypass surgery on fasting and postprandial concentrations ofplasma ghrelin, peptide YY, and insulin. J Clin Endocrinol Metab.2005;90:359–65.
11. Chan JL, Mun EC, Stoyneva V, et al. Peptide YY levels areelevated after gastric bypass surgery. Obesity (Silver Spring).2006;14:194–8.
12. Rodieux F, Giusti V, D’Alessio DA, et al. Effects of gastric bypassand gastric banding on glucose kinetics and gut hormone release.Obesity (Silver Spring). 2008;16:298–305.
13. Reinehr T, Roth CL, Schernthaner GH, et al. Peptide YY andglucagon-like peptide-1 in morbidly obese patients before andafter surgically induced weight loss. Obes Surg. 2007;17:1571–7.
14. Garcia-Fuentes E, Garrido-Sanchez L, Garcia-Almeida JM, et al.Different effect of laparoscopic Roux-en-Y gastric bypass andopen biliopancreatic diversion of Scopinaro on serum PYY andghrelin levels. Obes Surg. 2008;18:1424–9.
Fig. 4 The satiety measured with the VAS in all postoperative groupscombined
OBES SURG

15. Borg CM, le Roux CW, Ghatei MA, et al. Progressive rise in guthormone levels after Roux-en-Y gastric bypass suggests gutadaptation and explains altered satiety. Br J Surg. 2006;93:210–5.
16. Stratis C, Alexandrides T, Vagenas K, et al. Ghrelin and peptideYY levels after a variant of biliopancreatic diversion with Roux-en-Y gastric bypass versus after colectomy: a prospectivecomparative study. Obes Surg. 2006;16:752–8.
17. Karamanakos SN, Vagenas K, Kalfarentzos F, et al. Weight loss,appetite suppression, and changes in fasting and postprandialghrelin and peptide-YY levels after Roux-en-Y gastric bypass andsleeve gastrectomy: a prospective, double blind study. Ann Surg.2008;247:401–7.
18. Morínigo R, Vidal J, Lacy AM, et al. Circulating peptide YY,weight loss, and glucose homeostasis after gastric bypass surgeryin morbidly obese subjects. Ann Surg. 2008;247:270–5.
19. Vidal J, Nicolau J, Romero F, et al. Long-term effects of Roux-en-Y gastric bypass surgery on plasma glp-1 and islet function inmorbidly obese subjects. J Clin Endocrinol Metab. 2009;94:884–91.
20. Laferrere B, Teixeira J, McGinty J, et al. Effect of weight loss bygastric bypass surgery versus hypocaloric diet on glucose andincretin levels in patients with type 2 diabetes. J Clin EndocrinolMetab. 2008;93:2479–85.
21. de Carvalho CP, Marin DM, de Souza AL, et al. GLP-1 andadiponectin: effect of weight loss after dietary restriction and gastricbypass in morbidly obese patients with normal and abnormal glucosemetabolism. Obes Surg. 2009;19(3):313–20.
22. Morínigo R, Lacy AM, Casamitjana R, et al. GLP-1 and changesin glucose tolerance following gastric bypass surgery in morbidlyobese subjects. Obes Surg. 2006;16(12):1594–601.
OBES SURG

Original article
Effect of the definition of type II diabetes remission in theevaluation of bariatric surgery for metabolic disorders
D. J. Pournaras1,2, E. T. Aasheim1,3, T. T. Søvik3, R. Andrews2, D. Mahon2, R. Welbourn2,T. Olbers1 and C. W. le Roux1
1Imperial Weight Centre, Imperial College London, Charing Cross Hospital, London, and 2Department of Bariatric Surgery, Musgrove Park Hospital,Taunton, UK, and 3Department of Gastrointestinal Surgery, Oslo University Hospital, Aker, and Faculty of Medicine, University of Oslo, Oslo, NorwayCorrespondence to: Dr C. W. le Roux, Imperial Weight Centre, Imperial College, London W6 8RF, UK (e-mail: [email protected])
Background: The American Diabetes Association recently defined remission of type II diabetes as areturn to normal measures of glucose metabolism (haemoglobin (Hb) A1c below 6 per cent, fastingglucose less than 5·6 mmol/l) at least 1 year after bariatric surgery without hypoglycaemic medication. Apreviously used common definition was: being off diabetes medication with normal fasting blood glucoselevel or HbA1c below 6 per cent. This study evaluated the proportion of patients achieving completeremission of type II diabetes following bariatric surgery according to these definitions.Methods: This was a retrospective review of data collected prospectively in three bariatric centres onpatients undergoing gastric bypass, sleeve gastrectomy and gastric banding.Results: Some 1006 patients underwent surgery, of whom 209 had type II diabetes. Median follow-up was23 (range 12–75) months. HbA1c was reduced after operation in all three surgical groups (P < 0·001).A total of 72 (34·4 per cent) of 209 patients had complete remission of diabetes, according to the newdefinition; the remission rates were 40·6 per cent (65 of 160) after gastric bypass, 26 per cent (5 of 19)after sleeve gastrectomy and 7 per cent (2 of 30) after gastric banding (P < 0·001 between groups). Theremission rate for gastric bypass was significantly lower with the new definition than with the previouslyused definition (40·6 versus 57·5 per cent; P = 0·003).Conclusion: Expectations of patients and clinicians may have to be adjusted as regards remission of typeII diabetes after bariatric surgery. Focusing on improved glycaemic control rather than remission maybetter reflect the benefit of this type of surgery and facilitate improved glycaemic control after surgery.
Presented to the Second Annual Scientific Meeting of the British Obesity and Metabolic Surgery Society, Wakefield,UK, January 2011, and published in abstract form as Surg Obes Relat Dis 2011; 7: 247–248.
Paper accepted 4 August 2011Published online 21 October 2011 in Wiley Online Library (www.bjs.co.uk). DOI: 10.1002/bjs.7704
Introduction
Although the concept of remission of type II diabetesfollowing gastric bypass and gastric banding surgery hasgained acceptance, the definitions of remission and cure ofdiabetes have been controversial1. Recently a consensusgroup comprising experts in endocrinology, diabeteseducation, transplantation, metabolism, metabolic surgeryand haematology–oncology proposed new definitions ofpartial and complete remission of type II diabetes1. Thereare two important changes. First, a standard metric isnow proposed for reporting rates of diabetes remission,which may facilitate comparison of future reports. Second,
the new definitions rely on more stringent criteria forglycaemic control than previous criteria, so rates of diabetesremission are likely to be lower2,3. This has implications fortreatment as it suggests that more patients are presumedto benefit from hypoglycaemic treatment after bariatricsurgery. This study evaluated diabetes remission ratesafter gastric bypass, gastric banding and sleeve gastrectomyaccording to the 2009 consensus definitions.
Methods
Data were collected prospectively in three bariatric surgerycentres, two in the UK and one in Norway4. For the UK
2011 British Journal of Surgery Society Ltd British Journal of Surgery 2012; 99: 100–103Published by John Wiley & Sons Ltd

Remission of type II diabetes after bariatric surgery 101
centres, data were also collected from the National BariatricSurgery Registry, the result of a collaboration between theAssociation of Laparoscopic Surgeons of Great Britain andIreland, Association of Upper Gastrointestinal Surgeryand British Obesity and Metabolic Surgery Society. Theanalysis was retrospective. Permission was obtained fromthe Imperial College Healthcare NHS Trust ClinicalGovernance and Patient Safety Committee, and from theNorwegian Data Protection Agency. The study includedpatients with a preoperative diagnosis of type II diabeteswho underwent laparoscopic bariatric surgery betweenAugust 2004 and July 2009. Patients were seen at 6 weeks,6 months and 12 months after surgery.
Remission of type II diabetes was previously definedas being off diabetes medication with normal fastingblood glucose (5·6 mmol/l) or a HbA1c level of less than6 per cent2,3. This definition was used in recent meta-analyses of the effect of bariatric surgery on type IIdiabetes2,3. In the 2009 consensus document, partial remis-sion of diabetes was defined as hyperglycaemia (HbA1c lessthan 6·5 per cent and fasting glucose 5·6–6·9 mmol/l) atleast 1 year after surgery in the absence of active hypogly-caemic pharmacological therapy or ongoing procedures1.Complete remission was defined as a return to normal mea-sures of glucose metabolism (HbA1c less than 6 per cent,fasting glucose below 5·6 mmol/l) at least 1 year aftersurgery without hypoglycaemic pharmacological therapyor ongoing procedures1. Prolonged remission was definedas complete remission of at least 5 years’ duration and wasoutside the remit of the study.
Statistical analysis
Continuous data, expressed as mean(s.d.), were comparedusing one-way ANOVA. Fisher’s exact test and theFreeman–Halton extension of Fisher’s exact test were usedfor analysis of categorical data. P ≤ 0·050 was consideredstatistically significant. Data were analysed using SPSS
version 14 (SPSS, Chicago, Illinois, USA).
Results
A total of 1006 patients underwent bariatric surgery inthe three centres between August 2004 and July 2009.The prevalence of type II diabetes before surgery was26·5 per cent (36 of 136 patients) at Oslo UniversityHospital, Aker, 16·9 per cent (93 of 551) at MusgrovePark Hospital and 25·1 per cent (80 of 319) at ImperialCollege Hospitals. The 209 patients with type II diabetesbefore surgery were included in this study. Their meanage was 48(10) years and two-thirds were women. Thepreoperative body mass index (BMI) was 48(7) kg/m2 andpatients remained obese after surgery, with a postoperativeBMI of 35(7) kg/m2. Table 1 shows patient characteristicsand preoperative insulin use in relation to type of bariatricprocedure. Two patients in the bypass group, and one ineach of the sleeve gastrectomy and gastric banding groupswere taking glucagon-like peptide receptor agonists.
Median follow-up after surgery was 23 (range 12–75)months. Based on the 2009 consensus criteria, the rate ofcomplete remission of type II diabetes after all bariatricsurgery procedures was significantly lower than when theprevious definition was used: 34·4 per cent (72 of 209
Table 1 Patient characteristics and rates of remission of type II diabetes after bariatric surgery
All patients(n = 209)
Gastric bypass(n = 160)
Sleeve gastrectomy(n = 19)
Gastric banding(n = 30) P†
Age (years)* 48(10) 47(9) 53(14) 46(10) 0·041‡Sex ratio (M : F) 137 (65·6) 105 (65·6) 11 (58) 21 (70) 0·695Insulin use before surgery 63 (30·1) 51 (31·9) 6 (32) 6 (19) 0·457BMI (kg/m2)*
Before surgery 48(7) 48(7) 50(8) 47(9) 0·390‡After surgery 35(7) 34(6) 42(6) 36(8) 0·002‡
Fasting glucose (mmol/l)*Before surgery 9·6(3·6) 9·8(3·6) 8·9(4·2) 7·4(0·7) 0·144‡After surgery 6·3(2·6) 6·0(2·1) 8·0(5·3) 6·5(2·1) 0·004‡
HbA1c (%)*Before surgery 8·0(1·9) 8·1(1·9) 7·5(1·5) 7·7(1·5) 0·388‡After surgery 6·2(1·2) 6·2(1·2) 6·8(1·7) 6·3(0·7) 0·081‡
Complete remission based on 2009 criteria1 72 (34·4) 65 (40·6) 5 (26) 2 (7) < 0·001Partial remission based on 2009 criteria1 28 (13·4) 25 (15·6) 1 (5) 2 (7) 0·301Remission based on previous definition2,3 103 (49·3) 92 (57·5) 6 (32) 5 (17) < 0·001
Values in parentheses are percentages unless indicated otherwise; *values are mean(s.d.). Rates of remission of type II diabetes were determined a medianof 23 (range 12–75) months after bariatric surgery. BMI, body mass index; Hb, haemoglobin. †One-way ANOVA, ‡except Fisher’s exact test.
2011 British Journal of Surgery Society Ltd www.bjs.co.uk British Journal of Surgery 2012; 99: 100–103Published by John Wiley & Sons Ltd

102 D. J. Pournaras, E. T. Aasheim, T. T. Søvik, R. Andrews, D. Mahon, R. Welbourn et al.
80
New definition
60
40
20
0Gastric bypass Sleeve gastrectomy Gastric banding
Rem
issi
on o
f dia
bete
s (%
) Previous definition
Fig. 1 Remission of diabetes after gastric bypass, sleevegastrectomy and gastric banding based on the new (2009consensus statement)1 and the previous2,3 definitions. P < 0·001between groups. *P = 0·003 versus previous definition (one-wayANOVA)
patients) versus 49·3 per cent (103 of 209) (P = 0·003)(Table 1). Analysis by procedure showed no significantdifference between remission rates based on new andprevious definitions for either sleeve gastrectomy or gastricbanding. However, for gastric bypass, the remission ratewas significantly lower when the 2009 consensus criteriawere used (P = 0·003) (Fig. 1, Table 1). The remission rateas defined with the new criteria was 43·9 per cent (61 of139 patients) at 12 months and 40·6 per cent (65 of 160)at latest follow-up (median 23 months) after gastric bypasssurgery.
Oral hypoglycaemic medication was used by 47(29·4 per cent) of 160 patients after gastric bypass, 12(63 per cent) of 19 after sleeve gastrectomy, and 25(83 per cent) of 30 after gastric banding (P < 0·001).HbA1c was reduced after operation in all three surgicalgroups (P < 0·001). Mean HbA1c levels after surgerywere 6·2(1·2), 6·8(1·7) and 6·3(0·7) per cent respectively(P = 0·081 between groups).
Preoperative insulin use was associated with a signifi-cantly lower remission rate following gastric bypass. Of 51patients in the gastric bypass group who were taking insulinbefore operation, only eight achieved remission, comparedwith 57 of 109 on oral hypoglycaemic agents (P < 0·001).
Discussion
This study evaluated the effect of the proposed 2009 criteriaon diabetes remission rates after bariatric surgery. At amedian follow-up of 23 months after surgery, rates ofcomplete remission of type II diabetes were 40·6 per cent
after gastric bypass, 26 per cent after sleeve gastrectomyand 7 per cent after gastric banding. These rates aresubstantially lower than previously reported remissionrates of approximately 83 per cent for gastric bypass,81 per cent for sleeve gastrectomy and 44 per cent forgastric banding2–8. Markers of glycaemic control suchas HbA1c were no different between the groups, but therewas a difference in additional hypoglycaemic agents used.
Although the antidiabetic effects of bariatric surgeryare increasingly being recognized, there is scepticismregarding the role of surgical intervention in the treatmentalgorithm of type II diabetes9,10. Establishing realisticexpectations among patients, clinicians and policy-makersmay lead to a more rationalized and equitable use ofbariatric surgery for the management of type II diabetes.Strategies to achieve this include standardizing definitionsof the effect of surgery and avoiding the terms ‘cure’and ‘remission’ unless they are defined carefully. Thus,the new criteria may emphasize bariatric surgery as thesuperior tool for achieving glycaemic control rather thanas a tool for achieving remission from type II diabetes.The principal benefit of surgery, however, would not beto improve glycaemic control per se but rather to reducemicrovascular and macrovascular complications associatedwith diabetes11,12. The findings of this study emphasizethe need for intensive follow-up of patients with type IIdiabetes following bariatric surgery, in order to reviewpharmacological treatment, monitor for complications ofdiabetes and ensure that adequate glycaemic control isachieved.
Limitations of the study include the relatively smallnumbers of patients with type II diabetes in the gastricbanding and sleeve gastrectomy groups. Another limitationis the lack of data on duration of diabetes, which was notpart of the routine data collection in all of the centres.However, the 20·8 per cent prevalence of diabetes is similarto that in previously published series2,3. In addition, theproportion of patients on insulin therapy was similar tofindings in the UK and Ireland National Bariatric SurgeryRegistry13. Both of these observations suggest that theresults of this study could be applicable to other populationsundergoing bariatric surgery.
Significant differences in age between the study groupsmay have contributed to differences in diabetes remissionrates. Whether the results obtained after 23 monthswill remain similar 5 years after surgery remains to bedetermined. The remission rates in the present study usingboth the old and new definitions were lower than thosein previous series2,3. The authors speculate that this couldreflect a longer duration or an increased severity of typeII diabetes among the participants in the present study.
2011 British Journal of Surgery Society Ltd www.bjs.co.uk British Journal of Surgery 2012; 99: 100–103Published by John Wiley & Sons Ltd

Remission of type II diabetes after bariatric surgery 103
Measurement of β-cell function was not routine in thispopulation. Assessment of pancreatic function with c-peptide may give additional insight into the effects ofbariatric surgical procedures on type II diabetes14,15.
Further studies with longer follow-up are needed todetermine the optimal management of patients with typeII diabetes following bariatric surgery. In addition, futurecomparative studies of bariatric surgery for metabolicdisorders and particularly type II diabetes should includehard endpoints such as changes in microvascular andmacrovascular complication rates.
The 2009 consensus criteria are associated with lowertype II diabetes remission rates after bariatric surgerythan previous definitions, but the reported glycaemiccontrol remains impressive. Using an agreed definitionof diabetes and focusing on complications of diabetes asendpoints may remove some of the barriers to makingsurgery a more widely accepted treatment option for typeII diabetes.
Acknowledgements
C.W.R. was funded by a National Institute of HealthResearch Clinician Scientist award, and the study alsoreceived financial support from the National Institutefor Health Research Biomedical Research Centre fundingscheme to Imperial College London. The authors declareno conflict of interest.
References
1 Buse JB, Caprio S, Cefalu WT, Ceriello A, Del Prato S,Inzucchi SE et al. How do we define cure of diabetes?Diabetes Care 2009; 32: 2133–2135.
2 Buchwald H, Estok R, Fahrbach K, Banel D, Jensen MD,Pories WJ et al. Weight and type 2 diabetes after bariatricsurgery: systematic review and meta-analysis. Am J Med2009; 122: 248–256.
3 Buchwald H, Avidor Y, Braunwald E, Jensen MD, Pories W,Fahrbach K et al. Bariatric surgery: a systematic review andmeta-analysis. JAMA 2004; 292: 1724–1737.
4 Søvik TT, Irandoust B, Birkeland KI, Aasheim ET,Schou CF, Kristinsson J et al. [Type 2 diabetes and metabolic
syndrome before and after gastric bypass.] Tidsskr NorLaegeforen 2010; 130: 1347–1350.
5 Schauer PR, Burguera B, Ikramuddin S, Cottam D,Gourash W, Hamad G et al. Effect of laparoscopic Roux-enY gastric bypass on type 2 diabetes mellitus. Ann Surg 2003;238: 467–484.
6 Pournaras DJ, Osborne A, Hawkins SC, Vincent RP,Mahon D, Ewings P et al. Remission of type 2 diabetes aftergastric bypass and banding: mechanisms and 2 yearoutcomes. Ann Surg 2010; 252: 966–971.
7 Abbatini F, Rizzello M, Casella G, Alessandri G, Capoccia D,Leonetti F et al. Long-term effects of laparoscopic sleevegastrectomy, gastric bypass, and adjustable gastric banding ontype 2 diabetes. Surg Endosc 2010; 24: 1005–1010.
8 Dixon JB, O’Brien PE, Playfair J, Chapman L,Schachter LM, Skinner S et al. Adjustable gastric bandingand conventional therapy for type 2 diabetes: a randomizedcontrolled trial. JAMA 2008; 299: 316–323.
9 Rubino F, Kaplan LM, Schauer PR, Cummings DE;Diabetes Surgery Summit Delegates. The Diabetes SurgerySummit consensus conference: recommendations for theevaluation and use of gastrointestinal surgery to treat type 2diabetes mellitus. Ann Surg 2010; 251: 399–405.
10 Greve JW, Rubino F. Bariatric surgery for metabolicdisorders. Br J Surg 2008; 95: 1313–1314.
11 Intensive blood-glucose control with sulphonylureas orinsulin compared with conventional treatment and risk ofcomplications in patients with type 2 diabetes (UKPDS 33).UK Prospective Diabetes Study (UKPDS) Group. Lancet1998; 352: 837–853.
12 Ray KK, Seshasai SR, Wijesuriya S, Sivakumaran R,Nethercott S, Preiss D et al. Effect of intensive control ofglucose on cardiovascular outcomes and death in patientswith diabetes mellitus: a meta-analysis of randomisedcontrolled trials. Lancet 2009; 373: 1765–1772.
13 Welbourn R, Fiennes A, Kinsman R, Walton P. The NationalBariatric Surgery Registry: First Registry Report to March 2010.Dendrite Clinical Systems: Henley-on-Thames, 2011.
14 Vague P, Nguyen L. Rationale and methods for theestimation of insulin secretion in a given patient: fromresearch to clinical practice. Diabetes 2002; 51(Suppl 1):S240–S244.
15 Sacks DB, Arnold M, Bakris GL, Bruns DE, Horvath AR,Kirkman MS et al. Guidelines and recommendations forlaboratory analysis in the diagnosis and management ofdiabetes mellitus. Diabetes Care 2011; 34: e61–e99.
2011 British Journal of Surgery Society Ltd www.bjs.co.uk British Journal of Surgery 2012; 99: 100–103Published by John Wiley & Sons Ltd

Original article
Effect of bypassing the proximal gut on gut hormones involved withglycemic control and weight loss
Dimitri J. Pournaras, M.R.C.S.a,b, Erlend T. Aasheim, M.D., Ph.D.a, Marco Bueter, M.D.a,Ahmed R. Ahmed, F.R.C.S.a, Richard Welbourn, M.D., F.R.C.S.b,
Torsten Olbers, M.D., Ph.D.a, Carel W. le Roux, M.R.C.P., Ph.D.a,*aImperial Weight Centre, Imperial College London, Charing Cross Hospital, London, United Kingdom
bDepartment of Bariatric Surgery, Musgrove Park Hospital, Taunton, United Kingdom
Received May 23, 2011; accepted January 22, 2012
Abstract Background: The reported remission of type 2 diabetes in patients undergoing Roux-en-Y gastricbypass has brought the role of the gut in glucose metabolism into focus. Our objective was toexplore the differential effects on glucose homeostasis after oral versus gastrostomy glucose loadingin patients with Roux-en-Y gastric bypass at an academic health science center.Methods: A comparative controlled investigation of oral versus gastrostomy glucose loading in 5patients who had previously undergone gastric bypass and had a gastrostomy tube placed in thegastric remnant for feeding. A standard glucose load was administered either orally (day 1) or by thegastrostomy tube (day 2). The plasma levels of glucose, insulin, glucagon-like peptide 1 and peptideYY were measured before and after glucose loading.Results: Exclusion of the proximal small bowel from glucose passage induced greater plasmainsulin, glucagon-like peptide 1, and peptide YY responses compared with glucose loading by wayof the gastrostomy tube (P �.05).Conclusions: Exclusion of glucose passage through the proximal small bowel results in enhancedinsulin and gut hormone responses in patients after gastric bypass. The gut plays a central role inglucose metabolism and represents a target for future antidiabetes therapies. (Surg Obes Relat Dis2012;8:371–374.) © 2012 American Society for Metabolic and Bariatric Surgery. All rightsreserved.
Keywords: Gastric bypass; Bariatric surgery; Metabolic surgery; Diabetes remission; Gut hormones; Incretins; Glucagon-
Surgery for Obesity and Related Diseases 8 (2012) 371–374
like peptide 1; GLP-1
Roux-en-Y gastric bypass improves glycemic controlwithin days [1,2]. The initial increased insulin secretion andreduced insulin resistance appears to be independent of weightloss [3]. Increased glucagon-like peptide 1 (GLP-1) levels after
This study received support from the National Institutes of HealthResearch Clinician Scientist Award (to C. le Roux) and the NationalInstitute for Health Research Biomedical Research Centre funding schemeto Imperial College, London. There was no involvement in the design orconduct of the study; collection, management, analysis, or interpretation ofthe data; or preparation, review, or approval of the manuscript.
*Correspondence: Carel W. le Roux, M.R.C.P., Imperial Weight Cen-tre, Imperial College London W6 8RF United Kingdom.
E-mail: [email protected]
1550-7289/12/$ – see front matter © 2012 American Society for Metabolic anddoi:10.1016/j.soard.2012.01.021
gastric bypass are associated with increased insulin secretionbut not reduced insulin resistance [1]. These findings, togetherwith experiments on animal models, have brought the gut’srole in glucose homeostasis into focus and novel endoluminaldevices have been introduced in an attempt to mimic themetabolic effects of gastric bypass [4–6]. A remaining conun-drum is the rapid weight loss and weight loss maintenance aftergastric bypass, making it challenging to confirm the hypothesisthat the effects on glycemic control are indeed weight lossindependent. The aim of the present study was to investigatethe effect of glucose loading into different gut segments inweight stable patients who have had their type 2 diabetes
placed into remission after gastric bypass.Bariatric Surgery. All rights reserved.

ors
ccbpfptw
nsedtowglvr1w(p[u
liman
sCpg2anBtw
R
Ggs(
Gqllte
sdas
372 D. J. Pournaras et al. / Surgery for Obesity and Related Diseases 8 (2012) 371–374
Methods
The study was approved by the Clinical Governance andPatient Safety Committee of Imperial College HealthcareNational Health Service Trust (reference number 10/807)and was performed according to the Declaration of Helsinki.The 5 patients who had undergone gastric bypass providedinformed consent. Surgery was performed as previouslydescribed [7]. All participants had had type 2 diabetes pre-peratively and had had achieved normoglycemia withoutequiring any hypoglycemic medication by the time of thetudy. The mean body weight loss was 29.9% � 4.6%
resulting in a body mass index reduction from 43.2 � 1.9 to29.9 � 2.4 kg/m2 (P � .001). Because of surgical compli-ations, the patients had been unable to maintain adequatealorie intake. To allow for enteral feeding, all patients hadeen provided with a functioning gastrostomy tube. Theatients were treated conservatively or surgically and hadully recovered so that at the time of testing (14 � 4 monthsostoperatively, range 9–24), all patients had normal nutri-ion status, tolerated oral liquids, and had a stable bodyeight.All examinations were performed at 8 AM after an over-
ight fast on 2 different days 3–6 days apart. A 410-mLolution containing 75 g glucose, 287 kcal (Lucozade En-rgy Original, GlaxoSmithKline, Middlesex, United King-om) was given orally on day 1 (to verify the patients couldolerate the volume orally) and by gastrostomy on the sec-nd occasion. The duration of the solution administrationas 10 minutes on both days. A schematic illustration of theastrointestinal glucose route after oral and gastrostomyoading is given in Figure 1. Blood was obtained by aenous catheter using tubes containing ethylenediaminetet-aacetic acid and aprotinin before and 15, 30, 60, 90, 120,50, and 180 minutes after glucose loading. The samplesere stored and peptide YY (PYY)-like immunoreactivity
full length, PYY1–36, and fragment, PYY3–36) andlasma total GLP-1 were measured, as previously described8–10]. Gastric inhibitory polypeptide (GIP) was measuredsing enzyme-linked immunosorbent assay (Millipore, Bil-
Fig. 1. Schematic illustration of gastrointestinal glucose route after oral
(black arrows) and after gastrostomy load (empty arrows).erica, MA). Glucagon was measured by an in-house radio-mmunoassay [11]. Glucose was measured with an auto-ated glucose analyzer (Abbott Laboratories, Chicago, IL),
nd insulin was measured with an automated chemilumi-escent immunoassay (Abbott Laboratories, Chicago, IL).
The results were analyzed using GraphPad Prism, ver-ion 5.00, for Windows (GraphPad Software, San Diego,A). The data are presented as the mean � SEM. Thelasma levels of insulin, GLP-1, PYY, GIP, glucagon andlucose after the 2 glucose loadings were analyzed with a-way group (between subjects) � time (within subjects)nalysis of variance, presented with the F test, and theumbers in parentheses are the degrees of freedom. Post hoconferroni tests for each concentration were applied when
here was a significant group � time interaction. P �.05as considered significant.
esults
Figure 2 shows the plasma levels of glucose, insulin,LP-1, PYY, GIP, and glucagon after oral and gastrostomylucose loading. Two-way analysis of variance revealed aignificant difference in plasma insulin, GLP-1, and PYYall P �.01) levels between the oral and gastrostomy glu-
cose loading. There was also a significant main effect oftime and a significant group � time interaction for insulin,
LP-1, and PYY (all P �.001). The patients returned moreuickly to the baseline glucose levels after oral glucoseoading compared to patients who had received the glucoseoad by gastrostomy (P �.001), with a significant group �ime interaction (P �.001) but no significant main groupffect for glucose levels (P � .84).
No difference was found in the GIP postprandial re-ponse between the 2 routes used. The glucagon postpran-ial response was greater with the oral route (2-waynalysis of variance, P �.01); however, there was noignificant effect of time and group � time interaction.
The values of the 2-way analysis of variance for glucose,insulin, GLP-1, PYY, GIP, and glucagon are summarizedin Table 1.
Discussion
The present study has demonstrated that an altered de-livery of nutrients to the intestine, which excludes the prox-imal gut, results in improved postprandial glucose handling.In particular, excluding the distal stomach, duodenum, andproximal jejunum from nutrient transit reduces the durationof hyperglycemia and leads to enhanced insulin, incretin,and satiety gut hormone responses after glucose loading. Incontrast, in weight stable patients, the restoration of theduodenal passage after gastric bypass by gastrostomyincreases the duration of hyperglycemia and attenuatesthe incretin and insulin responses to glucose. Our obser-
vations support the hypothesis that endocrine changes
t P �.00
TTt
373Proximal Small Bowel and Glycemic Control / Surgery for Obesity and Related Diseases 8 (2012) 371–374
play an important role in the improvement of diabetesafter gastrointestinal bypass surgery [3,4,12–18]. How-ever, differentiating between the relative contribution ofproximal versus distal small gut signals to glycemic con-trol was outside the purpose of the present study.
0 30 60 90 120 150 1800
5
10
15 *
Time [min]
Glu
cose
mm
ol/L
0 30 60 90 120 150 180 210
200
400
600
800
******
GLP
-1 p
mol
/L
0 50 100 150
200
400
600
GIP
pgr
/mL
A
C
E
Fig. 2. Plasma levels of (A) glucose, (B) insulin, (C) GLP-1, and (D) PYY,glucose load. Data presented as mean values � SEM. When 2-way analysiest was used for point to point analysis between 2 groups (*P �.05, ***
able 1wo-way analysis of variance values (F test, numbers in parentheses are
ube glucose load as a function of group and time
Variable Time
Glucose F(7,57) � 5.81; P �.001Insulin F(7,57) � 7.64; P �.001GLP-1 F(7,58) � 10.51; P �.001PYY F(7,58) � 8.79; P �.001GIP F(6,43) � 3.98; P � .003Glucagon F(4,30) � 1.98; P � .12
GLP-1 � glucagon-like peptide 1; PYY � peptide YY; GIP � gastric inhibit
Exclusion of the duodenum and jejunum in Goto-Kak-izaki, spontaneously nonobese type 2 diabetic rats, can havea weight loss-independent effect on type 2 diabetes, sug-gesting that the proximal gut might be implicated in thepathogenesis of the disease [4,19]. Glucose tolerance was
0 30 60 90 120 150 1800
50
100
150
200
******
Time [min]
Insu
lin m
U/m
L0 30 60 90 120 150 180
0
20
40
60
80
***
******
* *
Time [min]
PYY
pmol
/L
0 20 40 60 80 1000
2
4
6
8
10
Glu
cago
n pm
ol/L
, and (F) glucagon after oral (black circles) and gastrostomy (open circles)iance revealed a significant group � time interaction, post hoc Bonferroni1).
of freedom) for comparison of gut hormones after oral and gastrostomy
roup Time � group
1,57) � 0.04; P � .84 F(7;57) � 4.26; P �.0011,57) � 8.88; P � .004 F(7,57) � 5.87; P �.0011,58) � 32.08; P �.001 F(7,58) � 9.10; P �.0011,58) � 96.77; P �.001 F(7,58) � 7.61; P �.0011,43) � 0.59; P � .45 F(6,43) � 0.52; P � .791,30) � 7.88; P � .0087 F(4,30) � 1.12; P � .36
0
0
B
D
F
(E) GIPs of var
degrees
G
F(F(F(F(F(F(
ory polypeptide.

[
[
[
[
[
[
[
[
[
[
374 D. J. Pournaras et al. / Surgery for Obesity and Related Diseases 8 (2012) 371–374
markedly improved postoperatively. Furthermore, in an an-other study of the same type of rats, duodenojejunal bypassled to the improvement of oral glucose tolerance in contrastto gastrojejunostomy, which had no effect [4]. Exclusion ofthe duodenum by reoperation of the rats with gastrojejunos-tomy improved glucose tolerance, and restoration of theduodenal passage in rats that had undergone duodenojejunalbypass caused the recurrence of impaired glucose tolerance[4]. The available human data supporting the weight loss-independent effect of Roux-en-Y gastric bypass on glucosehomeostasis and the “foregut hypothesis” are limited.
GIP responses after gastric bypass remain controversial,with most investigators showing a decrease [16], but othersshowing an increase [15]. We did not find a significantdifference in our study, but our experiment was not poweredto detect a difference in GIP.
A single case has been reported in which nutrient stim-ulation by oral feeding was compared with gastric tubefeeding in a patient after gastric bypass [20]. However, byrepeating the experiments in a series of weight stable pa-tients in whom diabetes had gone into remission, we haveshown a consistent threefold elevation of insulin, GLP-1,and PYY after oral glucose loading. Dirksen et al. [20] havealso demonstrated no overall difference in GIP or glucagon,consistent with the result of our study.
One limitation of our study was the nonrandom alloca-tion of oral and gastrostomy days; however, we had toensure that the patients could tolerate the volume orally,before administering it through the gastrostomy tube. More-over, each patient served as their own control, and all testswere performed within a 3–6-day period.
Conclusions
Exclusion of the proximal small gut by gastric bypasssurgery resulted in weight-independent modifications of guthormones and glucose homeostasis. Understanding themechanisms by which gastric bypass alters the metabolismmight lead to novel devices or therapeutic approaches forthe treatment of type 2 diabetes.
Acknowledgments
We thank Dr Francesco Rubino, Weill Cornell MedicalCollege–New York Presbyterian Hospital, New York, forhis scientific input to our report. We also thank Kelly Whit-worth, medical photographer, for designing the illustration.
Disclosures
The authors have no commercial associations that might
be a conflict of interest in relation to this article.References
[1] Buse JB, Caprio S, Cefalu WT, et al. How do we define cure ofdiabetes? Diabetes Care 2009;32:2133–5.
[2] Rubino F, Kaplan LM, Schauer PR, Cummings DE; Diabetes SurgerySummit Delegates. The Diabetes Surgery Summit Consensus Con-ference: recommendations for the evaluation and use of gastrointes-tinal surgery to treat type 2 diabetes mellitus. Ann Surg 2010;251:399–405.
[3] Pournaras DJ, Osborne A, Hawkins SC, et al. Remission of type 2diabetes after gastric bypass and banding: mechanisms and 2 yearoutcomes. Ann Surg 2010;252:966–71.
[4] Rubino F, Forgione A, Cummings DE, et al. The mechanism ofdiabetes control after gastrointestinal bypass surgery reveals a role ofthe proximal small intestine in the pathophysiology of type 2 diabetes.Ann Surg 2006;244:741–9.
[5] Tarnoff M, Rodriguez L, Escalona A, et al. Open label, prospective,randomized controlled trial of an endoscopic duodenal-jejunal bypasssleeve versus low calorie diet for pre-operative weight loss in bari-atric surgery. Surg Endosc 2009;23:650–6.
[6] Schouten R, Rijs CS, Bouvy ND, et al. A multicenter, randomizedefficacy study of the endobarrier gastrointestinal liner for presurgicalweight loss prior to bariatric surgery. Ann Surg 2010;251:236–43.
[7] Wyles SM, Ahmed AR. Tips and tricks in bariatric surgical proce-dures: a review article. Minerva Chir 2009;64:253–64.
[8] Batterham RL, Cohen MA, Ellis SM, et al. Inhibition of food intakein obese subjects by peptide YY3-36. N Engl J Med 2003;349:941–8.
[9] Savage AP, Adrian TE, Carolan G, Chatterjee VK, Bloom SR. Effectsof peptide YY (PYY) on mouth to caecum intestinal transit time andon the rate of gastric emptying in healthy volunteers. Gut 1987;28:166–70.
10] Kreymann B, Williams G, Ghatei MA, Bloom SR. Glucagon-likepeptide-1 7–36: a physiological incretin in man. Lancet 1987;2:1300–4.
11] Bloom SR, Long RG. Radioimmunoassay of gut regulatory peptides.London: WB Saunders; 1982.
12] Cummings DE. Endocrine mechanisms mediating remission of dia-betes after gastric bypass surgery. Int J Obes (Lond) 2009;33(Suppl1):S33–40.
13] Pournaras DJ, le Roux CW. Obesity, gut hormones, and bariatricsurgery. World J Surg 2009;33:1983–8.
14] Korner J, Inabnet W, Febres G, et al. Prospective study of guthormone and metabolic changes after adjustable gastric banding andRoux-en-Y gastric bypass. Int J Obes (Lond) 2009;33:786–95.
[15] Laferrère B, Heshka S, Wang K, et al. Incretin levels and effect aremarkedly enhanced 1 month after Roux-en-Y gastric bypass surgery inobese patients with type 2 diabetes. Diabetes Care 2007;30:1709–16.
16] Korner J, Bessler M, Inabnet W, Taveras C, Holst JJ. Exaggeratedglucagon-like peptide-1 and blunted glucose-dependent insulino-tropic peptide secretion are associated with Roux-en-Y gastric bypassbut not adjustable gastric banding. Surg Obes Relat Dis 2007;3:597–601.
17] le Roux CW, Welbourn R, Werling M, et al. Gut hormones asmediators of appetite and weight loss after Roux-en-Y gastric bypass.Ann Surg 2007;246:780–5.
18] Pournaras DJ, Osborne A, Hawkins SC, et al. The gut hormoneresponse following Roux-en-Y gastric bypass: cross-sectional andprospective study. Obes Surg 2010;20:56–60.
19] Rubino F, Marescaux J. Effect of duodenal-jejunal exclusion in anon-obese animal model of type 2 diabetes: a new perspective for anold disease. Ann Surg 2004;239:1–11.
20] Dirksen C, Hansen DL, Madsbad S, et al. Postprandial diabeticglucose tolerance is normalized by gastric bypass feeding as opposedto gastric feeding and is associated with exaggerated GLP-1 secre-
tion: a case report. Diabetes Care 2010;33:375–7.
The Role of Bile After Roux-en-Y Gastric Bypass inPromoting Weight Loss and Improving GlycaemicControl
Dimitri J. Pournaras, Clare Glicksman, Royce P. Vincent, Shophia Kuganolipava,Jamie Alaghband-Zadeh, David Mahon, Jan H.R. Bekker, Mohammad A. Ghatei,Stephen R. Bloom, Julian R.F. Walters, Richard Welbourn, and Carel W. le Roux
Department of Investigative Medicine (D.J.P., R.P.V., M.A.G., S.R.B., C.W.l.R.), Imperial Weight Centre,Imperial College London, London W6 8RF, United Kingdom; Department of Bariatric Surgery (D.J.P.,D.M., R.W.), Musgrove Park Hospital, Taunton TA1 5DA, United Kingdom; Department of ClinicalBiochemistry (C.G., R.P.V., J.A.-Z.), King’s College Hospital, London SE5 9RS, United Kingdom;Department of Gastroenterology (S.K., J.R.F.W.), Imperial College London, London HA7 4FG, UnitedKingdom; Department of Surgery (J.H.R.B.), University of Pretoria, Pretoria 5100, South Africa; andExperimental Pathology (C.W.l.R.), Conway Institute, School of Medicine and Medical Sciences,University College Dublin, Dublin 4, Ireland
Gastric bypass leads to the remission of type 2 diabetes independently of weight loss. Our hypoth-esis is that changes in bile flow due to the altered anatomy may partly explain the metabolicoutcomes of the operation. We prospectively studied 12 patients undergoing gastric bypass andsix patients undergoing gastric banding over a 6-wk period. Plasma fibroblast growth factor(FGF)19, stimulated by bile acid absorption in the terminal ileum, and plasma bile acids weremeasured. In canine and rodent models, we investigated changes in the gut hormone responseafter altered bile flow. FGF19 and total plasma bile acids levels increased after gastric bypasscompared with no change after gastric banding. In the canine model, both food and bile, on theirown, stimulated satiety gut hormone responses. However, when combined, the response wasdoubled. In rats, drainage of endogenous bile into the terminal ileum was associated with anenhanced satiety gut hormone response, reduced food intake, and lower body weight. In conclu-sion, after gastric bypass, bile flow is altered, leading to increased plasma bile acids, FGF19, incretin.and satiety gut hormone concentrations. Elucidating the mechanism of action of gastric bypasssurgery may lead to novel treatments for type 2 diabetes. (Endocrinology 153: 0000–0000, 2012)
A link between bile acids and glycemic control has beensuggested by studies showing improved blood glu-
cose in patients with type 2 diabetes when receiving thebile acid sequestrants cholestyramine and colesevelam (1–5). Several possible mechanisms have been proposed, in-cluding the disruption of enterohepatic circulation of bileacids and a number of different effects through the farne-soid X receptor (FXR) pathway, which is the intracellularsignaling pathway for bile acids (4, 6). Bile acids also ac-tivate the cell-membrane G protein-coupled receptor,TGR5, which has been shown to stimulate the incretin,
glucagon-like peptide-1 (GLP-1) in vitro in an FXR-inde-pendent manner (7). GLP-1 in turn stimulates �-cells in thepancreas to release insulin (8).
Gastric bypass surgery is being used as a treatment fortype 2 diabetes, although the mechanism of action remainslargely unclear (9–11). The improved glycemic control inthe immediate postoperative period is weight loss inde-pendent, because simultaneous improved insulin secretionand reduced insulin resistance have been observed be-tween d 2 and 7 after gastric bypass (9). The early increasein insulin secretion was associated with an enhanced
ISSN Print 0013-7227 ISSN Online 1945-7170Printed in U.S.A.Copyright © 2012 by The Endocrine Societydoi: 10.1210/en.2011-2145 Received December 18, 2011. Accepted May 14, 2012.
Abbreviations: AUC, Area under the curve; CRP, C-reactive protein; FGF, fibroblast growthfactor; FXR, farnesoid X receptor; GLP-1, glucagon-like peptide-1; PYY, peptide YY.
D I A B E T E S - I N S U L I N - G L U C A G O N - G A S T R O I N T E S T I N A L
Endocrinology, August 2012, 153(8):0000–0000 endo.endojournals.org 1
Endocrinology. First published ahead of print June 6, 2012 as doi:10.1210/en.2011-2145
Copyright (C) 2012 by The Endocrine Society

GLP-1 response (9), which may partly be explained byL-cell stimulation from bile acids (12–14). Moreover, thedecrease in insulin resistance may also be the result ofincreased fasting plasma bile acid levels after gastric by-pass surgery (15, 16), because firstly, bile acids inhibitgluconeogenesis in an FXR dependent and independentmanner (17–20) and bind to TGR5, leading to cAMP gen-eration and activation of the intracellular type 2 thyroidhormone deiodinase (21). Secondly, bile acids also act viathe phosphatidylinositol 3 kinase/serine-threonine kinasepathway directly promoting insulin signaling and glyco-gen synthase activation, thus aiding insulin-dependentcontrol of glucose metabolism in the liver (22). Thirdly,possible effects of bile acids on fibroblast growth factor(FGF)19 could lead to enhanced mitochondrial activity,which improves insulin resistance (23). Recently FGF19has been shown to regulate glycogen metabolism in aninsulin-independent manner (24). Furthermore, FGF19has been shown to correlate with nutritional status (25).Finally, tauroursodeoxycholic acid has also been shown toprotect against the onset of insulin resistance in obese anddiabetic mice by alleviating stress in the endoplasmic re-ticulum (26).
The prolonged improvements in glycemic control aftergastric bypass are further aided by the substantial andmaintained weight loss. The attenuated appetite may bepartly explained by enhanced satiety gut hormones fromthe endocrine L cell, such as peptide YY (PYY), GLP-1,and oxyntomodulin (27, 28). Bile acids are also implicatedin the release of these L-cell hormones.
We hypothesized that the altered anatomy after gastricbypass affects bile delivery to the terminal ileum and leadto elevated plasma bile acids. We postulated that changesin bile flow result in increased satiety gut hormone re-sponses, reduced food intake, and weight loss. Our aimwas to test this hypothesis in humans after gastric bypasssurgery and to explore further the potential mechanismsinvolved in two animal models of altered bile flow.
Materials and Methods
The human studies were performed according to the principles ofthe Declaration of Helsinki. The Somerset Research and Ethicscommittee approved the study (LREC protocol no. 05/Q2202/96). The canine studies were approved by the ethics committeeof Onderstepoort Vetinary School (University of Pretoria). Therat studies were approved by the Home Office United Kingdom(PL 70-6669).
Human studiesWritten informed consent was obtained from all participants.
Exclusion criteria included pregnancy, substance abuse, and
more than two alcoholic drinks per day. Twelve gastric bypasspatients (seven females and five males) with mean age of 45.2 �2.7 yr and body mass index 49.8 � 1.5 as well as six gastricbanding patients (four females and two males), with mean age45.4 � 2.6 yr and body mass index 44 � 2.0 kg/m2 were re-cruited. All patients were prescribed a 2-wk preoperative diet of1000 kcal before surgery. Operations were performed laparo-scopically by one surgeon. The technique for the gastric bypasshas been described previously (29). For gastric banding, theSwedish Adjustable Gastric band (Ethicon Endo-Surgery, Lon-don, UK) and the LAP-BAND (Allergan, Marlow, UK) bandswere used with the pars flaccida dissection technique and gastro-gastric tunnelating sutures (30).Usinganenhanced recoverypro-tocol postoperatively, all patients were allowed free fluids onreturn to the ward, and diet was recommenced when tolerated.The recommended postoperative diet for the first week was thesame for the patients with banding and bypass. After a 12-h fast,blood was obtained in tubes containing EDTA and aprotinin.Samples were immediately centrifuged and stored in a �80 Cfreezer until analysis.
Canine studiesFour male and four female Beagles were fasted overnight and
then given a standard 400 g of test meal of dog chow (Husky,Purina, South Africa). The composition was 7.5% protein, 2%fat, 1% fiber, 7.5% crude ash, and 82% moisture. Five millilitersof blood were collected (in tubes containing EDTA and apro-tinin) every 30 min from 30 min before the meal up to 150 minpostprandially.
The next day, the dogs were prepared for theater by placingan overnight fentanyl patch and withholding food overnight.The common bile duct was transected. An 8 French Foley cath-eter was placed into the gall bladder. An 8 French feeding tubewas advanced through the pylorus to the duodenum with the mostdistal point being 5–8 cm distal to the pylorus, close to the level ofthe ampulla of Vater (Fig. 1A). For the first 12 h after the surgery,the dogs were given ad libitum access to water but no food.
Only one dog was terminated after showing signs of jaundiceand infection. The dogs received a standard meal of 400 g ofnormal chow at the start of the light phase. At this time, as muchbile as possible was aspirated from the Foley catheter and in-jected through the gastrostomy tube, followed by a 5-ml flush ofsaline. This prevented the dogs from becoming jaundiced andallowed normal digestion.
On d 4–6, the dogs were randomized to a 180-min crossoverdesigned protocol of venous blood collection every 30 min after1) a standard meal of 400 g of dog food only without bile; 2) bileonly, without food; or 3) 400 g of dog food and bile incombination.
Rodent studiesSixteen male Wistar obese rats were randomized to a sham
operation, which maintained the normal bile delivery to the du-odenum or to an operation that would deliver bile to the ileum.The bile-in-duodenum group underwent transections 1 cm prox-imal and distal to the drainage point of the common bile duct andreanastomosis to maintain the normal anatomy but allow for asimilar surgical insult. The bile-in-ileum group had the sametransection of the duodenum, but the proximal and distal ends ofthe transected duodenum were anastomosed end to end and con-
2 Pournaras et al. Bile Acids After Gastric Bypass Endocrinology, August 2012, 153(8):0000–0000

tinuity restored (Fig. 1B). The segment of the duodenum con-taining the common bile duct was anastomosed side to side to thedistal jejunum, 10 cm proximally to the terminal ileum. Thisallowed bile and pancreatic juices to bypass the duodenum andmost of the jejunum.
Body weight and food consumption was measured daily at thebeginning of the light phase for 28 d. Feces were collected overa 24-h period on d 25. The rats were then fasted for 12 h beforethey were terminated, and blood samples were collected.
FGF19 assayPlasma FGF19 concentration was measured using a quanti-
tative sandwich ELISA technique (FGF19 Quantikine ELISA kit,catalog no. DF1900; R&D Systems, Minneapolis, MN).
Bile acids assayThe measurement of fractionated
plasma bile acids was performed with liq-uid chromatography tandem mass spec-trometry (31). The method allowed 12different bile acids [cholic acid (CA), che-nodeoxycholic acid (CDC), deoxycholicacid (DC), glycocholic acid (GCA), gly-codeoxycholic acid (GCD), glycocheno-deoxycholic acid (GCDC), glycolitho-cholic acid (GLC), glycoursodeoxycholicacid (GUDC), lithocholic acid (LC), tau-rocholic acid (TCA), taurochenodeoxy-cholic acid (TCDC), and taurodeoxy-cholic acid (TDC)] to be measured withinthe range of 0.1–10 �M.
GLP-1 and PYY assayAll samples were assayed in duplicate.
Analysis was performed with an estab-lished GLP-1 RIA (7). PYY-like immu-noreactivity was measured with a specificand sensitive RIA, which measures boththe full length (PYY1-36) and the frag-ment (PYY3-36) (32).
Bomb calorimetryTo evaluate nutrient absorption, feces
were collectedover24honpostoperatived25 fromall rats. Feceswere dried in an oven and weighed; calorie content was measuredusing an established ballistic bomb calorimeter technique (33).
Rodent C-reactive protein (CRP) assayTo assess inflammation serum CRP levels were measured (Rat
Serum CRP ELISA kit catalog no. 1010; Alpha Diagnostics In-ternational, San Antonio, TX).
Statistical analysisResults were analyzed using GraphPad Prism version 5.00 for
Windows (GraphPad Software, San Diego, CA). Data are ex-pressed as means � SEM when the data follow a Gaussian dis-tribution. When the data did not follow a Gaussian distribution,the median (range) is used. Values for the area under the curve(AUC) were calculated with the use of the trapezoidal rule. Endpoints were compared with the use of two-tailed, paired Stu-dent’s t tests for parametric data and Mann-Whitney U test fornonparametric data. Results were considered significant if P �0.05.
Results
Human study FGF19Preoperative fasted plasma FGF19 levels did not differ
between gastric banding and gastric bypass patients [me-dian 140 ng/liter range (26–466) vs. 123 (41–406), re-spectively; P � 0.37]. However, these values were lowerthan those found in nonobese controls (34). In the gastric
FIG. 1. A, Schematic illustration of the anatomy and canulation of the canine model. Agastrostomy tube was placed into the duodenum close to the ampulla of Vater. The commonbile duct was ligated and the gallbladder canulated to allow drainage of bile. B, Schematicillustration of the functional anatomy of the bile in ileum group. Transections 1 cm proximal anddistal to the drainage point of the common bile duct were performed. The proximal and distalends of the transected duodenum were anastomosed end to end and continuity restored. Thesegment of the duodenum containing the common bile duct was anastomosed side to side tothe distal jejunum, 10 cm proximally to the terminal ileum.
FIG. 2. Fasting plasma FGF19 concentrations (median andinterquartile ranges) at d 0, 4, and 42 in six gastric banding patients(white bars) and 12 gastric bypass patients (black bars). *, P � 0.05Mann-Whitney U test. Preop, Preoperatively.
Endocrinology, August 2012, 153(8):0000–0000 endo.endojournals.org 3

banding group, there was no significant change from pre-operative values for fasting FGF19 at d 4 or 42 after sur-gery. In the gastric bypass group, fasting levels of plasmaFGF19 were significantly increased as early as 4 d aftergastric bypass compared with preoperative values (P �0.01) (Fig. 2). The enhanced FGF19 level were sustainedat 42 d postoperatively (P � 0.05).
Human study plasma bile acidsFasting concentrations of total plasma bile acids mea-
sured in banding and bypass patients preoperatively werenot different (Fig. 3). On d 4, fasting bile acids were in-creased after gastric bypass, and there was a significantdifference compared with the banding group. By d 42 aftergastric bypass fasting, total bile acid concentrations werehigher compared with preoperative levels. There was nodifference in the banding group.
A similar pattern of results (increase in the gastric by-pass group but not in the banding group) was previouslyshown for GLP-1 and PYY in these same patients (9).
Canine studiesThe responses of GLP-1 and PYY were studied in this
model after stimulation with food or bile alone or a com-bination of both. Unfortunately, at the time of these ex-periments, there was no available assay for canine FGF19.Baseline GLP-1 and PYY levels were the same before andafter the operation (6936 vs. 7290 for GLP-1 and 6386 vs.5856 for PYY). Figure 4 shows the AUC and the timecourse over 150 min for the postprandial GLP-1 and PYYresponse after the standard meal of 400 g of dog food. Inthe operated dogs, both food alone and bile alone lead toa significant GLP-1 and PYY response from baseline, al-though the responses were attenuated. The response tobile and or food alone was inferior to the combination offood and bile either pre- or postoperatively.
Rodent studiesIn this model, rats had bile draining into their ileum or
duodenum. Both the fasting plasma GLP-1 levels (Fig. 5A)and the plasma PYY levels (Fig. 5B) were higher in the bile-in-ileum group than in the bile-in-duodenum group (P � 0.05).
Figure 6A demonstrates that both the bile-in-ileum andbile-in-duodenum groups lost a similar initial amount ofweightduringthefirst4dwhilerecoveringfromsurgery.Thebile-in-duodenum group, however, reached their preopera-tive weight within 8 d. The bile-in-ileum group weighed sig-nificantly less than the bile-in-duodenum group on d 6 (P �0.05) and continued to have a lower bodyweight for the du-ration of the study (P � 0.05). Figure 6B shows that the ratsin the bile-in-ileum group ate significantly less than the bile-in-duodenum group (P � 0.05).
Fecal parameters at 25 d after the operation did notreveal differences between the bile-in-ileum and the bile-
in-duodenumgroupsat the endof theexperiment in dry weight (4.12 �0.20 vs. 4.28 � 0.18 g, P � 0.55) orin calorific content (3.58 � 0.4 vs.3.58 � 0.4 fecal kcal/24 h, P � 0.91).There was no evidence of increasedinflammation in the bile-in-ileumcompared with the bile-in-duode-num group either by white cell count(11.5 � 0.32 � 1000/�l vs. 11.64 �0.42 � 1000/�l, P � 0.79) or CRP(370.88 � 26.03 vs. 378.5 � 21.71�g, P � 0.83).
Discussion
We showed in obese patients thatFGF19 and plasma total bile acids
FIG. 3. Fasting total plasma bile acid concentrations at d 0, 4, and 42in six gastric banding patients (white bars) and 12 gastric bypasspatients (black bars). *, P � 0.05 Mann-Whitney U test. Preop,Preoperatively.
FIG. 4. A, AUC for the postprandial GLP-1. B, AUC for postprandial PYY response after 400 g offood in dogs pre- or postoperatively either receiving food alone without bile (food), bile alonewithout food (bile), or food and bile in combination (food � bile).*, P � 0.05. The time courseof the postprandial response for GLP-1 (C) and PYY (D).
4 Pournaras et al. Bile Acids After Gastric Bypass Endocrinology, August 2012, 153(8):0000–0000

were increased after gastric bypass but not after gastricbanding. We have shown previously that GLP-1 and PYYare affected in the same way as FGF19 in these patients (9).How could the alterations in gastro-intestinal physiologyproduce these changes?
Both food and bile on their own can release GLP-1 andPYY as shown in the canine model, but the combinationof food and bile (before surgery or after surgery) resultedin greater PYY responses compared with food alone,whereas GLP-1 also showed a trend to be higher after thecombination of food and bile. Endogenous bile acids andpancreatic juices delivered in the rat model 10 cm proxi-mally to the terminal ileum were also associated with el-evated plasma GLP-1 and PYY, reduced food intake, andlower body weight. Taken together, these data suggestthat one of the mechanisms by which a gastric bypass leadsto beneficial elevations of GLP-1 and PYY may be throughthe undiluted flow of bile through the biliopancreatriclimb and the altered delivery of bile to the terminal ileum.
Well-matched patients undergoing gastric bandingwere used as a control group, because they have a similarlaparoscopic surgical insult and identical preoperative andimmediate postoperative diets compared with bypass, butin the gastric banding operation, there is no change in the
anatomy of the gut that would affectbile flow. Exogenous bile salts havebeen shown to be the most potentstimulus of gut hormones from theendocrine L cells, such as PYY in rab-bit colon explants (12), in vivo inconscious dogs (13), and in humans(14). GLP-1, PYY, and bile are re-leased postprandially and in propor-tion to the amount of calories con-sumed. Although early arrival ofnutrients at the terminal ileum stillremains a possibility, the reduced gutmotility and early peak GLP-1 andPYY responses postprandially sug-
gest other mechanisms, which may involve bile in the re-lease of L-cell hormones.
The gallbladder is not usually removed during Roux-en-Y gastric bypass, and there is no indication that gall-bladder contraction is adversely affected after gastricbypass. Previous studies suggested an increase in chole-cystokinin after jejunoileal bypass, which may result inenhanced bile flow from the gallbladder or liver (34). Aftergastric bypass, the length of small bowel from the ampullaof Vater to the terminal ileum is reduced by 100–150 cm,and bile may thus reach the terminal ileum before the in-gested food, which triggers the release of bile. We postu-late that due to the anatomical changes after gastric by-pass, bile progresses down the biliopancreatic limb to thedistal L cells in an undiluted state. This could lead to in-creased availability of bile acids in the distal intestine withthe potential to engage TGR5 on L cells. Bile acid activa-tion ofTGR5hasbeen found tostimulateGLP-1productionin vitro and may explain the early and exaggerated release ofincretin gut hormones, such as GLP-1 and subsequently in-sulin (8). Bile acids would normally be more bound up inmicelles due to the presence of nutrients and therefore lesslikely to stimulate L cells for peptide secretion.
Although the canine studiesshould be interpreted with caution,especially because the anatomicalchanges are dissimilar to gastric by-pass, we would suggest that both bileand food contribute to the postpran-dial gut hormone response. The roleof bile can be attributed to the factthat bile conjugated with food facil-itates better digestion of complex in-gested fats by intestinal lipases intosmaller lipid subunits, therefore lead-ing to a more effective stimulation ofL cells (35). Inhibition of intestinal
FIG. 5. Plasma GLP-1 (A) and PYY (B) levels in rats that had bile draining into their duodenum orbile draining into their ileum.
FIG. 6. A, Weight of rats in bile-in-duodenum (solid line) and bile-in-ileum (broken line) groupsbefore and up to 28 d after surgery. B, Food intake of bile-in-duodenum (solid line) and bile-in-ileum (broken line) rats before and up to 28 d after surgery. *, P � 0.05.
Endocrinology, August 2012, 153(8):0000–0000 endo.endojournals.org 5

lipases leads to attenuated postprandial GLP-1 and PYYassociated with increased appetite (35). However, the re-sults of the rodent studies do not support this hypothesis,because the distal intestinal delivery of bile should inter-fere with the intestinal digestion of fats and hence lead toreduced L-cell responses. As the opposite was demon-strated, the effect of bile on digestion of ingested fats can-not explain the enhanced gut hormone response, suggest-ing that bile acids may play a role as signaling molecules.
Bile acids may also influence glucose metabolism byaltering body weight. Weight loss may result from en-hanced satiety, which may be facilitated via L cell-derivedgut hormones (9, 25). In addition, bile acids increase en-ergy expenditure in brown adipose tissue, thus preventingobesity and insulin resistance via induction of the cAMP-dependent thyroid hormone-activating enzyme type 2 io-dothyronine deiodinase (21). This is achieved via theTGR5 and is consistent with recent findings that in ratmodels, gastric bypass prevented the decrease in energyexpenditure after weight loss (36, 37).
Activation of the FXR� may also mediate the effects ofbile acids on energy homeostasis via FGF19 released fromileal enterocytes, leading to improved metabolic rate and de-creased adiposity (38, 39). FGF19 has recently been shownto inhibit hepatic gluconeogenesis (40). FGF19 was only as-sayed in humans, because unfortunately there are no reliableassays foruse indogsorrats.FGF19andtheFGF15orthologin rodents are thought to provide feedback inhibition of bileacid synthesis in the liver. Why the increased levels of FGF19after gastric bypass are associated with an increase in totalbile acids is not immediately apparent, unless the changes inileal bile acid absorption and FXR-mediated FGF19 produc-tion are much greater than the effects on the liver.
Some of the beneficial metabolic effect of Roux-en-Ygastric bypass on glycemic control may be attributed tochanges in bile acids (15). Our prospective study confirmsthe previous cross sectional observation that total plasmabile acids are elevated after gastric bypass. We went on toshow that this happens as early as 42 d after surgery. Wepropose an additional mechanism for the observed im-provements in glycemic control involving altered bile flowafter gastric bypass. The changes facilitated by bile mayincrease satiety and improved glycemic control via guthormones as well as a direct effect on insulin resistance.Therefore, bile may be one of the key products of theproximal gut, which transfers a message to the distal gutand to other metabolically active tissues.
Limitations of our study include the lack of random-ization in the human studies. However, the groups werewell matched for preoperative patient characteristics. Por-tal vein levels of FGF19 and bile acids were not measured,and the relationship between portal veins and systemic levels
after gastric bypass is not currently known. Furthermoreonly fasting levels of FGF19 and bile acids were measured.Postprandial changes may also occur and are the subject offuture studies. In the canine experiment, a dislodgement ofeither the feeding tube or the Foley catheter could have leadto chemical peritonitis affecting the results. However, thepostmortem examination confirming the position of thetubes makes this unlikely. In the rat experiment, the differ-ence in the severity of the operative procedures may havecaused different inflammatory response, but the lack of dif-ference in the biochemical and histological markers of in-flammation mitigates against this.
In conclusion, Roux-en-Y gastric bypass causeschanges in bile flow resulting in increased total plasma bileacids concentrations, FGF19, GLP-1, and PYY. Alteringthe flow of endogenous bile leads to an increase in guthormone responses, which can be further enhanced by thesynergistic delivery of food. Bile may partly explain thepleotrophic metabolic effects seen after gastric bypass sur-gery and could be a therapeutic target for novel surgicaldevices or pharmaceuticals.
Acknowledgments
Address all correspondence and requests for reprints to: RichardWelbourn, Department of Bariatric Surgery, Musgrove ParkHospital, Taunton TA1 5DA, United Kingdom. E-mail:[email protected].
This work was supported by a National Institute of Health Re-search Clinician scientist award (C.W.l.R.) and by NIHR Biomed-ical Research Centre funding scheme to Imperial College London.
Disclosure Summary: The authors have nothing to disclose.
References
1. Claudel T, Staels B, Kuipers F 2005 The farnesoid X receptor: amolecular link between bile acid and lipid and glucose metabolism.Arterioscler Thromb Vasc Biol 25:2020–2030
2. Garg A, Grundy SM 1994 Cholestyramine therapy for dyslipidemiain non-insulin-dependent diabetes mellitus. A short-term, double-blind, crossover trial. Ann Intern Med 121:416–422
3. Fonseca VA, Rosenstock J, Wang AC, Truitt KE, Jones MR 2008Colesevelam HCl improves glycemic control and reduces LDL cho-lesterol in patients with inadequately controlled type 2 diabetes onsulfonylurea-based therapy. Diabetes Care 31:1479–1484
4. Goldberg RB, Fonseca VA, Truitt KE, Jones MR 2008 Efficacy andsafety of colesevelam in patients with type 2 diabetes mellitus andinadequate glycemic control receiving insulin-based therapy. ArchIntern Med 168:1531–1540
5. Bays HE, Goldberg RB, Truitt KE, Jones MR 2008 Colesevelamhydrochloride therapy in patients with type 2 diabetes mellitustreated with metformin: glucose and lipid effects. Arch Intern Med168:1975–1983
6. Guzelian P, Boyer JL 1974 Glucose reabsorption from bile: evidencefor a biliohepatic circulation. J Clin Invest 53:526–535
6 Pournaras et al. Bile Acids After Gastric Bypass Endocrinology, August 2012, 153(8):0000–0000
7. Kreymann B, Williams G, Ghatei MA, Bloom SR 1987 Glucagon-like peptide-1 7-36: a physiological incretin in man. Lancet 2:1300–1304
8. Katsuma S, Hirasawa A, Tsujimoto G 2005 Bile acids promote gluca-gon-like peptide-1 secretion through TGR5 in a murine enteroendo-crine cell line STC-1. Biochem Biophys Res Commun 329:386–390
9. Pournaras DJ, Osborne A, Hawkins SC, Vincent RP, Mahon D,Ewings P, Ghatei MA, Bloom SR, Welbourn R, le Roux CW 2010Remission of type 2 diabetes after gastric bypass and banding: mech-anisms and two year outcomes. Ann Surg 252:966–971
10. Polyzogopoulou EV, Kalfarentzos F, Vagenakis AG, AlexandridesTK 2003 Restoration of euglycemia and normal acute insulin re-sponse to glucose in obese subjects with type 2 diabetes followingbariatric surgery. Diabetes 52:1098–1103
11. Pournaras DJ, le Roux CW 2009 Obesity, gut hormones, and bari-atric surgery. World J Surg 33:1983–1988
12. Ballantyne GH, Longo WE, Savoca PE, Adrian TE, Vukasin AP,Bilchik AJ, Sussman J, Modlin IM 1989 Deoxycholate-stimulatedrelease of peptide YY from the isolated perfused rabbit left colon.Am J Physiol 257:G715–G724
13. Izukura M, Hashimoto T, Gomez G, Uchida T, Greeley Jr GH,Thompson JC 1991 Intracolonic infusion of bile salt stimulates re-lease of peptide YY and inhibits cholecystokinin-stimulated pancre-atic exocrine secretion in conscious dogs. Pancreas 6:427–432
14. Adrian TE, Ballantyne GH, Longo WE, Bilchik AJ, Graham S, Bas-son MD, Tierney RP, Modlin IM 1993 Deoxycholate is an impor-tant releaser of peptide YY and enteroglucagon from the humancolon. Gut 34:1219–1224
15. Patti ME, Houten SM, Bianco AC, Bernier R, Larsen PR, Holst JJ,Badman MK, Maratos-Flier E, Mun EC, Pihlajamaki J, Auwerx J,Goldfine AB 2009 Serum bile acids are higher in humans with priorgastric bypass: potential contribution to improved glucose and lipidmetabolism. Obesity 17:1671–1677
16. Jansen PL, van Werven J, Aarts E, Berends F, Janssen I, Stoker J,Schaap FG 2011 Alterations of hormonally active fibroblast growthfactors after Roux-en-Y gastric bypass surgery. Dig Dis 29:48–51
17. Thomas C, Pellicciari R, Pruzanski M, Auwerx J, Schoonjans K2008 Targeting bile-acid signalling for metabolic diseases. Nat RevDrug Discov 7:678–693
18. De Fabiani E, Mitro N, Gilardi F, Caruso D, Galli G, Crestani M2003 Coordinated control of cholesterol catabolism to bile acids andof gluconeogenesis via a novel mechanism of transcription regula-tion linked to the fasted-to-fed cycle. J Biol Chem 278:39124–39132
19. Yamagata K, Daitoku H, Shimamoto Y, Matsuzaki H, Hirota K,Ishida J, Fukamizu A 2004 Bile acids regulate gluconeogenic geneexpression via small heterodimer partner-mediated repression ofhepatocyte nuclear factor 4 and Foxo1. J Biol Chem 279:23158–23165
20. Ma K, Saha PK, Chan L, Moore DD 2006 Farnesoid X receptor isessential for normal glucose homeostasis. J Clin Invest 116:1102–1109
21. Watanabe M, Houten SM, Mataki C, Christoffolete MA, Kim BW,Sato H, Messaddeq N, Harney JW, Ezaki O, Kodama T, SchoonjansK, Bianco AC, Auwerx J 2006 Bile acids induce energy expenditureby promoting intracellular thyroid hormone activation. Nature 439:484–489
22. Han SI, Studer E, Gupta S, Fang Y, Qiao L, Li W, Grant S, HylemonPB, Dent P 2004 Bile acids enhance the activity of the insulin re-ceptor and glycogen synthase in primary rodent hepatocytes. Hepa-tology 39:456–463
23. Tomlinson E, Fu L, John L, Hultgren B, Huang X, Renz M, StephanJP, Tsai SP, Powell-Braxton L, French D, Stewart TA 2002 Trans-genic mice expressing human fibroblast growth factor-19 displayincreased metabolic rate and decreased adiposity. Endocrinology143:1741–1747
24. Kir S, Beddow SA, Samuel VT, Miller P, Previs SF, Suino-Powell K,Xu HE, Shulman GI, Kliewer SA, Mangelsdorf DJ 2011 FGF19 as
a postprandial, insulin-independent activator of hepatic protein andglycogen synthesis. Science 331:1621–1624
25. Mráz M, Lacinová Z, Kaválková P, Haluzíková D, Trachta P, Drá-palová J, Hanušová V, Haluzík M 2011 Serum concentrations offibroblast growth factor 19 in patients with obesity and type 2 di-abetes mellitus: the influence of acute hyperinsulinemia, very-lowcalorie diet and PPAR-� agonist treatment. Physiol Res 60:627–636
26. Ozcan U, Yilmaz E, Ozcan L, Furuhashi M, Vaillancourt E, SmithRO, Görgün CZ, Hotamisligil GS 2006 Chemical chaperones re-duce ER stress and restore glucose homeostasis in a mouse model oftype 2 diabetes. Science 313:1137–1140
27. le Roux CW, Welbourn R, Werling M, Osborne A, Kokkinos A,Laurenius A, Lönroth H, Fändriks L, Ghatei MA, Bloom SR, OlbersT 2007 Gut hormones as mediators of appetite and weight loss afterRoux-en-Y gastric bypass. Ann Surg 246:780–785
28. Laferrère B, Swerdlow N, Bawa B, Arias S, Bose M, Oliván B,Teixeira J, McGinty J, Rother KI 2010 Rise of oxyntomodulin inresponse to oral glucose after gastric bypass surgery in patients withtype 2 diabetes. J Clin Endocrinol Metab 95:4072–4076
29. Pournaras DJ, Jafferbhoy S, Titcomb DR, Humadi S, Edmond JR,Mahon D, Welbourn R 2010 Three hundred laparoscopic Roux-en-Y gastric bypasses: managing the learning curve in higher riskpatients. Obes Surg 20:290–294
30. O’Brien PE, Dixon JB, Laurie C, Anderson M 2005 A prospectiverandomized trial of placement of the laparoscopic adjustable gastricband: comparison of the perigastric and pars flaccida pathways.Obes Surg 15:820–826
31. Tagliacozzi D, Mozzi AF, Casetta B, Bertucci P, Bernardini S, Di IlioC, Urbani A, Federici G 2003 Quantitative analysis of bile acids inhuman plasma by liquid chromatography-electrospray tandemmass spectrometry: a simple and rapid one-step method. Clin ChemLab Med 41:1633–1641
32. Batterham RL, Cohen MA, Ellis SM, Le Roux CW, Withers DJ,Frost GS, Ghatei MA, Bloom SR 2003 Inhibition of food intake inobese subjects by peptide YY3-36. N Engl J Med 349:941–948
33. Jackson RJ, Davis WB, Macdonald I 1977 The energy values ofcarbohydrates: should bomb calorimeter data be modified? ProcNutr Soc 36:90A
34. Näslund E, Grybäck P, Hellström PM, Jacobsson H, Holst JJ, The-odorsson E, Backman L 1997 Gastrointestinal hormones and gastricemptying 20 years after jejunoileal bypass for massive obesity. Int JObes Relat Metab Disord 21:387–392
35. Ellrichmann M, Kapelle M, Ritter PR, Holst JJ, Herzig KH, SchmidtWE, Schmitz F, Meier JJ 2008 Orlistat inhibition of intestinal lipaseacutely increases appetite and attenuates postprandial glucagon-likepeptide-1-(7-36)-amide-1, cholecystokinin, and peptide YY concen-trations. J Clin Endocrinol Metab 93:3995–3998
36. Bueter M, Löwenstein C, Olbers T, Wang M, Cluny NL, Bloom SR,Sharkey KA, Lutz TA, le Roux CW 2010 Gastric bypass increasesenergy expenditure in rats. Gastroenterology 138:1845–1853
37. Stylopoulos N, Hoppin AG, Kaplan LM 2009 Roux-en-Y gastricbypass enhances energy expenditure and extends lifespan in diet-induced obese rats. Obesity 17:1839–1847
38. Inagaki T, Choi M, Moschetta A, Peng L, Cummins CL, McDonaldJG, Luo G, Jones SA, Goodwin B, Richardson JA, Gerard RD, RepaJJ, Mangelsdorf DJ, Kliewer SA 2005 Fibroblast growth factor 15functions as an enterohepatic signal to regulate bile acid homeosta-sis. Cell Metab 2:217–225
39. Holt JA, Luo G, Billin AN, Bisi J, McNeill YY, Kozarsky KF, DonaheeM, Wang DY, Mansfield TA, Kliewer SA, Goodwin B, Jones SA 2003Definition of a novel growth factor-dependent signal cascade for thesuppression of bile acid biosynthesis. Genes Dev 17:1581–1591
40. Potthoff MJ, Boney-Montoya J, Choi M, He T, Sunny NE, SatapatiS, Suino-Powell K, Xu HE, Gerard RD, Finck BN, Burgess SC,Mangelsdorf DJ, Kliewer SA 2011 FGF15/19 regulates hepatic glu-cose metabolism by inhibiting the CREB-PGC-1� pathway. CellMetab 13:729–738
Endocrinology, August 2012, 153(8):0000–0000 endo.endojournals.org 7