mechanisms intheautogenousmillandtheir … intheautogenousmillandtheir mathematical representation...
TRANSCRIPT

Mechanisms in the autogenous mill and theirmathematical representation
by G. G. STANLEY*, B.Sc. (Eng.) (Wits.), M.E. (Queensland), Ph.D., (Fellow)
SYNOPSIS
The special characteristics of the autogenous mill are stated, and a suitable type of model for the mill is presented.Details of the test plant and experimental techniques for obtaining the data for model development are next given.followed by a discussion of the methods developed for the computation of the model parameters, namely the appear-ance matrix, the abrasion and crushing breakage-rate functions, and the discharge-rate function. Examples of resultsobtained with the model are given, and finally there is a brief account of confirmatory work on a full-scale autogeneous mill.
SAMEVATTING
Die spesiale eienskappe van die outogene meul word genaam en 'n geskikte tipe model vir die meul word voor-geste!. Vervolgens word besonderhede verstrek van die toetsaanleg en eksperimentele tegnieke om data vir dieontwikkeling van die model te bekom en dit word gevolg deur 'n bespreking van die metodes wat ontwikkel isvir die berekening van die model parameters, naamlik die voorkomsmatriks, die funksies vir die skuur- en ver-gruisingsbreektempo en die ontlandingstempofunksie. Daar word voorbeelde gegee van die resultate wat met diemodel verkry is en ten slotte is daar 'n kort verslag oor bevestigende werk by 'n volskaalse outogene meul.
INTRODUCTION
Over the past twenty or thirtyyears, mathematical modelling ofball and rod mills has been widelyinvestigated, and reasonably satis-factory models are now available.The autogenous mill has, however,received very little attention in thisrespect, and in view of the increasingimportance of this type of mill, theJulius Kruttschnitt Mineral Re-search Centre in the Department ofMining and Metallurgical Engineer-ing, University of Queensland, in1970 commenced a programme ofresearch into mathematical model-ling of the autogenous mill. Thispaper reports the work of the authoron this programme from its inceptionuntil the end of 1973.
THE AUTOGENOUS MILLFROM THE MA THEMA TICAL
MODELLING VIEWPOINT
A utogenous Milling DefinedAs used in this study, the term
autogenous milling means a processin which the size of the constituentpieces of a supply of rock is reduced ina tumbling mill purely by the inter-action of the pieces, or by the inter-action of the pieces with the millshell, no other grinding mediumbeing employed. The definition thuscovers both 'run-of-mine' and 'pebble'milling, the only difference from themathematical modelling viewpointbeing that the feed to the first has
*National InstituteJohannesburg.
for Metallurgy',
a continuous, and the second anon-continuous, size distribution.
Special Characteristics of theA utogenous Mill
Autogenous milling differs funda-mentally from non-autogenous mill.ing in two respects.
(1) Size reduction occurs by twomain modes, namely the detachmentof material from the surface of largerparticles (referred to as 'abrasion') onthe one hand, and disintegration ofsmaller particles due to the propaga-tion of crack networks throughthem (called 'crushing') on the other.Abrasion and crushing breakageoverlap on the size scale. Thiscontrasts with non. autogenous mill-ing, in which only crushing breakage,however caused, is regarded assignificant.
(2) The grinding parameters of theautogenous mill load are not inde-pendent of the mill feed; the load iscontinually generated from the feed,and its parameters therefore dependdirectly on those of the feed.
These two charactersistics mustbe specifically included in the modelof the autogenous mill.
THE PERFECT MIXINGMODEL
Because of the importance of theload in autogenous milling, the typeof model adopted is basically thediscretized mass balance of the sizefractions in the load, and is knownas the 'perfect mixing model' be-cause of its assumption of thiscondition within the segment con.
tlOURNAj.. OF THE SOUTH AFRICAN INSTITUTe O.F MJNINe? A",,[) METALI,I,JRGY
sidered. Its theorydeveloped by Whiten!.
In matrix notation,mixing model is written
ds--== (AR - R)s+ f - p,dt - - -
has been
the perfect
. . . .(1)
where s is a vector of the mass
contents of the segment in successivesize fractions,
Lis a vector of the mass flowrates
of the successive fractions of feed tothe segment,
p is a vector of the mass flowrates
of the successive fractions of thedischarge from the segment,
R is a diagonal matrix giving thebreakage rate of each componentof s, and
A is a lower triangular matrix (theappearance matrix) containing ineach column the breakage functionfor the corresponding size fraction.If the breakage functions areidentical, A becomes a step matrix.
The relationship between contentsand product is
l!=D.~,
where D (the discharge matrix) is adiagonal matrix giving the dischargerates of each component of ~
Thus,
ds--=-=(AR-R-D) ~+fdt -
and, for the steady-state condition,
(AR-R-D).~+I=O. . . . . (3)
(2)
If A is known or assumed, and
NOVEMBER 1974 77
j~s-'-.and JLare known, both Rand D
can be computed. If s, the mill
contents, IS not known, then RandD cannot be separated; however,a combined parameter, such asDR-l, can be calculated if f and p
are known.Lees2 has shown that even a large
'square mill' (3,2m in diameter by3,06m) can be adequately repre-sented by a single perfectly-mixedsegment and, because of this andthe high ratio of diameter to lengthin the author's experimental mill,the same simplification was adoptedin the work reported here.
EXPERIMENTAL DETAILS
The experimental work on whichthe model of the autogenous millwas based was aimed essentially atdetermining the relationships be-tween feed size, rate, and densityon the one hand and parametersA, R, and D of the perfect-mixingmodel on the other. The test pro-gramme therefore comprised a seriesof tests in which the feed charact-eristics mentioned were system-atically varied and the effects onA, R, and D determined.Special Feeding Technique for Con-stant Size Distribution
The problem of feeding the millconsistently, both with respect to rateand size distribution, was solved bysegregation of the test ore parcelinto eight size fractions and feeding
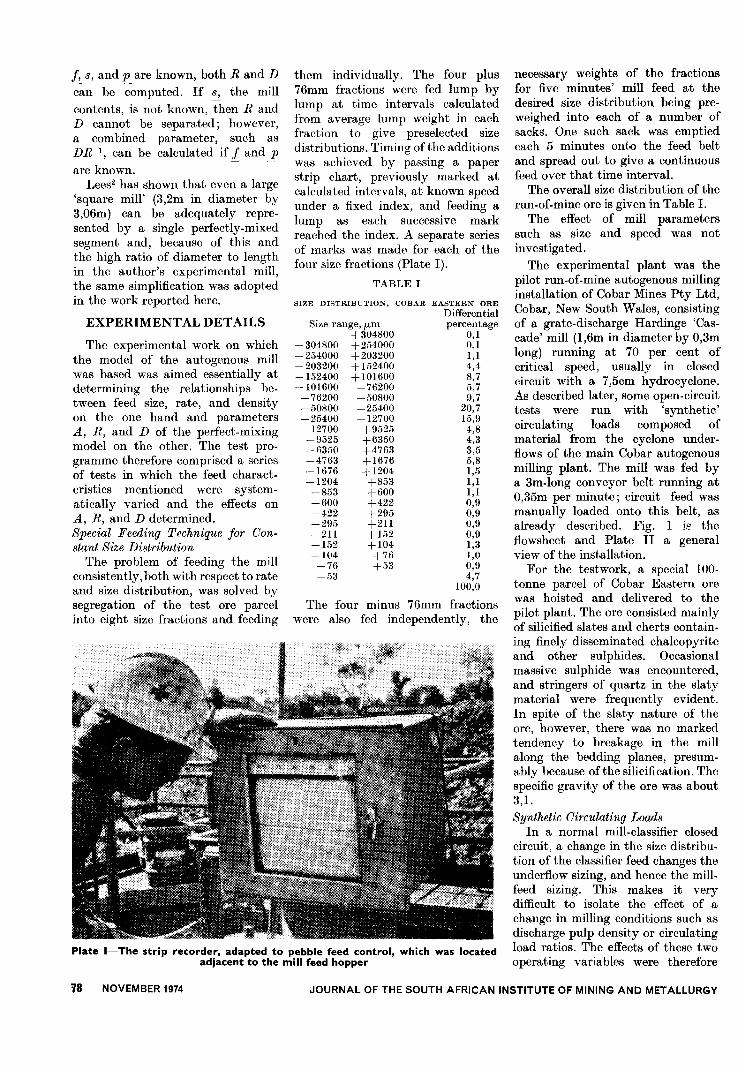
them individually. The four plus76mm fractions were fed lump bylump at time intervals calculatedfrom average lump weight in eachfraction to give preselected SIzedistributions. Timing of the additionswas achieved by passing a paperstrip chart, previously marked atcalculated intervals, at known speedunder a fixed index, and feeding alump as each successive markreached the index. A separate seriesof marks was made for each of thefour size fractions (Plate I).
TABLE I
SIZE DISTRIBUTION,COBAR EASTERN OREDifferentialpercentage
0,10,11,14,48,75,79,7
20,715,9
4,84,33,55,81,51,11,10,90,90,90,91,31,00,94,7
100,0
The four minus 76mm fractionswere also fed independently, the
Size range, /LID+304800+ 254000+203200+ 152400+ 101600
+76200+50800+25400+12700
+9525+6350+4763+1676+1204
+853+600+422+295+211+152+104
+76+53
- 304800-254000-203200-152400-101600
-76200
- 50800
- 25400
- 12700-9525-6350-4763-1676-1204
-853-600-422-295-211-152-104
-76-53
Plate I-The strip recorder. adapted to p.ebble feed control. which was locatedadjacent to the mill feed hopper
'18 NOVEMBER 1974
necessary weights of the fractionsfor five minutes' mill feed at thedesired size distribution being pre-weighed into each of a number ofsacks. One such sack was emptiedeach 5 minutes onto the feed beltand spread out to give a continuousfeed over that time interval.
The overall size distribution of therun-of-mine ore is given in Table I.
The effect of mill parameterssuch as size and speed was notinvestigated.
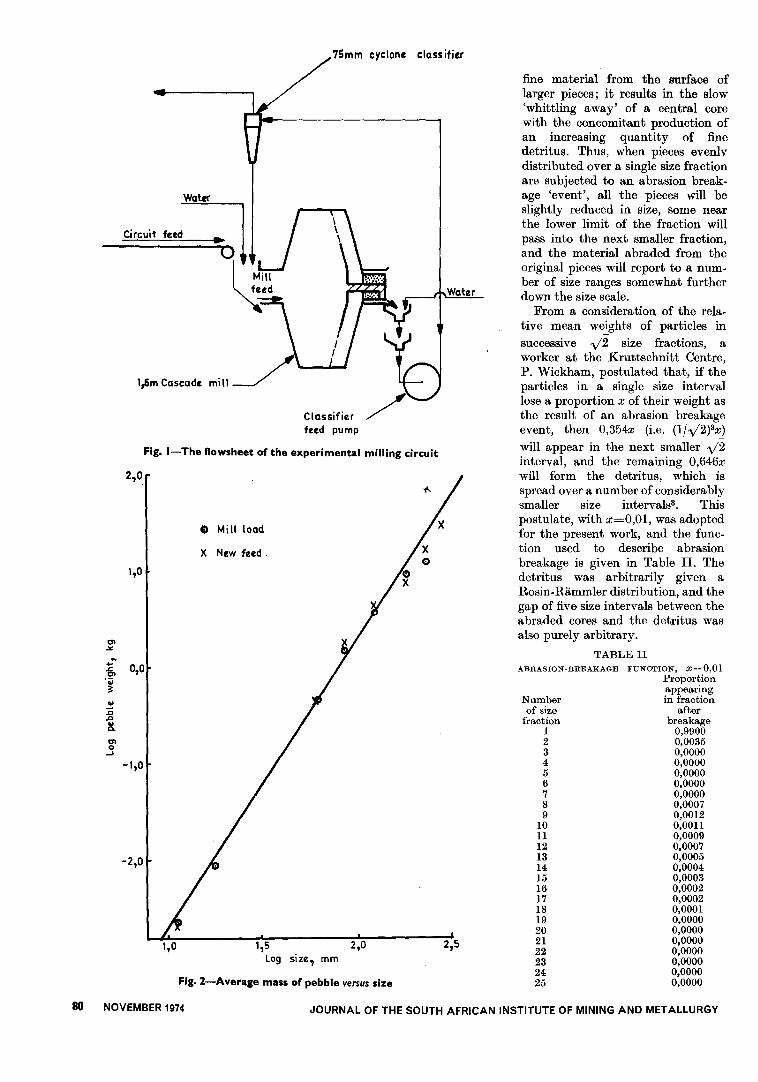
The experimental plant was thepilot run-of-mine autogenous millinginstallation of Cobar Mines pty Ltd,Cobar, New South Wales, consistingof a grate-discharge Hardinge 'Cas-cade' mill (1,6m in diameter by 0,3mlong) running at 70 per cent ofcritical speed, usually in closedcircuit with a 7,5cm hydrocyclone.As described later, some open-circuittests were run with 'synthetic'circulating loads composed ofmaterial from the cyclone under-flows of the main Cobar autogenousmilling plant. The mill was fed bya 3m-long conveyor belt running at0,35m per minute; circuit feed wasmanually loaded onto this belt, asalready described. Fig. 1 if' theflowsheet and Plate II a generalview of the installation.
For the testwork, a special 100-tonne parcel of Cobar Eastern orewas hoisted and delivered to thepilot plant. The ore consisted mainlyof silicified slates and cherts contain-ing finely disseminated chalcopyriteand other sulphides. Occasionalmassive sulphide was encountered,and stringers of quartz in the slatymaterial were frequently evident.In spite of the slaty nature of theore, however, there was no markedtendency to breakage in the millalong the bedding planes, presum-ably because ofthe silicification. Thespecific gravity of the ore was about3,1.
Synthetic Circulating LoadsIn a normal mill-classifier closed
circuit, a change in the size distribu-tion of the classifier feed changes theunderflow sizing, and hence the mill-feed sizing. This makes it verydifficult to isolate the effect of achange in milling conditions such asdischarge pulp density or circulatingload ratios. The effects of these twooperating variables were therefore
JOURNAL OF THE SOUTH AFRICAN INSTITUTE OF MINING AND METALLURGY
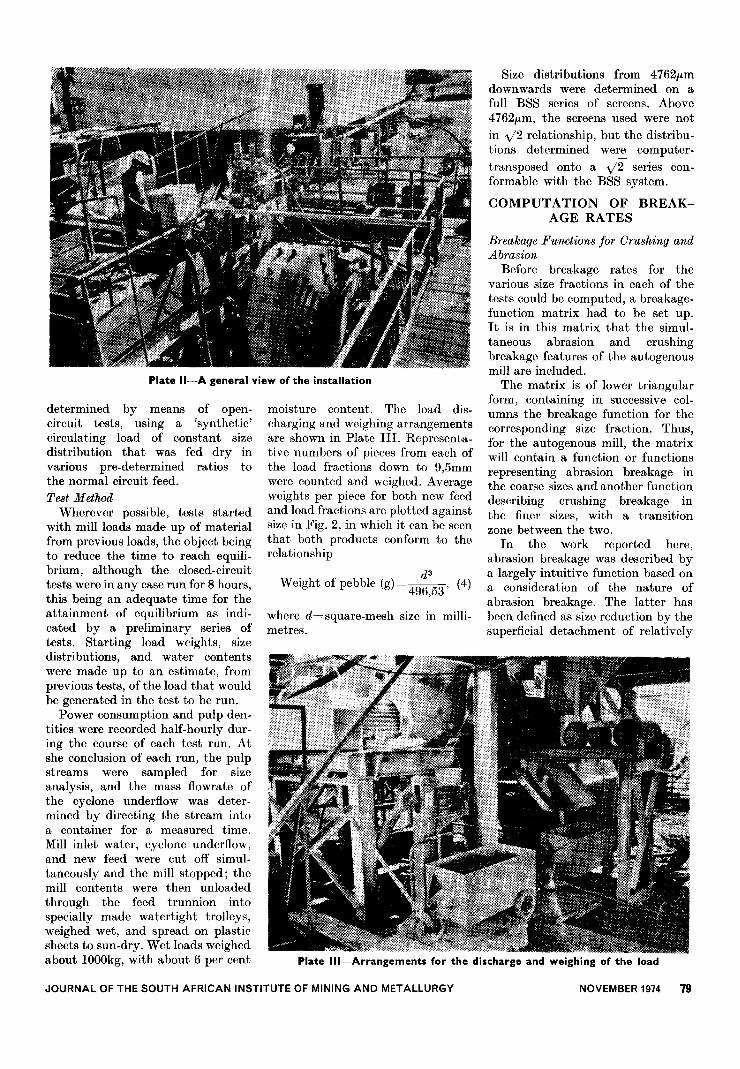
Plate II-A general view of the installation
determined by means of open.circuit tests, using a 'synthetic'circulating load of constant sizedistribution that was fed dry invarious pre-determined ratios tothe normal circuit feed.
Test MethodWherever possible, tests started
with mill loads made up of materialfrom previous loads, the object beingto reduce the time to reach equili-brium, although the closed-circuittests were in any case run for 8 hours,this being an adequate time for theattainment of equilibrium as indi-cated by a preliminary series oftests. Starting load weights, sizedistributions, and water contentswere made up to an estimate, fromprevious tests, of the load that wouldbe generated in the test to be run.
Power consumption and pulp den.tities were recorded half-hourly dur-ing the course of each test run. Atshe conclusion of each run, the pulpstreams were sampled for sizeanalysis, and the mass flowrate ofthe cyclone underflow was deter-mined by directing the stream intoa container for a measured time.Mill inlet water, cyclone underflow,and new feed were cut off simul.taneously and the mill stopped; themill contents were then unloadedthrough the feed trunnion intospecially made watertight trolleys,weighed wet, and spread on plasticsheets to sun.dry. Wet loads weighedabout lOOOkg, with about 6 per cent
moisture content. The load dis-charging and weighing arrangementsare shown in Plate Ill. Representa-tive numbers of pieces from each ofthe load fractions down to 9,5mmwere counted and weighed. Averageweights per piece for both new feedand load fractions are plotted againstsize in Fig. 2, in which it can be seenthat both products conform to therelationship
. d3WeIght of pebble (g)=496,53' (4)
where d=square-mesh size in milli.metres.
Size distributions from 4762ILmdownwards were determined on afull BSS series of screens. Above47621Lm, the screens used were not
in \12 relationship, but the distribu-tions determined were computer-
transposed onto a \12 series con-formable with the BSS system.
COMPUTATION OF BREAK-AGE RATES
Breakage Functions for Crushing andAbrasion
Before breakage rates for thevarious size fractions in each of thetests could be computed, a breakage-function matrix had to be set up.It is in this matrix that the simul-taneous abrasion and crushingbreakage features of the autogenousmill are included.
The matrix is of lower triangularform, containing in successive col-umns the breakage function for thecorresponding size fraction. Thus,for the autogenous mill, the matrixwill contain a function or functionsrepresenting abrasion breakage inthe coarse sizes and another functiondescribing crushing breakage inthe finer sizes, with a transitionzone between the two.
In the work reported here,abrasion breakage was described bya largely intuitive function based ona consideration of the nature ofabrasion breakage. The latter hasbeen defined as size reduction by thesuperficial detachment of relatively
JOURNAL OF THE SOUTH AFRICAN INSTITUTE OF MINING AND METALLURGY
Plate Ill-Arrangements for the discharge and weighing of the load
NOVEMBER 1974 79
en
~~....
0,0.cen
'0;
~~.J:J.D
~en0
.....
-1,0
Circuit
l,6m Cascade mi II
Classifierfeed pump
75mm cyclone classifier
Water
Fig. I-The flowsheet of the experimental milling circuit
-2,0
80 NOVEMBER 1974
2,°,
to Mill load
X New feed,
1,0
-+-.
2,5I,S 2,0Log size, mm
Fig. 2-Average mass of pebble versus size
fine material from the surface oflarger pieces; it results in the slow'whittling away' of a central corewith the concomitant production ofan increasing quantity of finedetritus. Thus, when pieces evenlvdistributed over a single size fractionare subjected to an abrasion break-age 'event', all the pieces will beslightly reduced in size, some nearthe lower limit of the fraction willpass into the next smaller fraction,and the material abraded from theoriginal pieces will report to a num-ber of size ranges somewhat furtherdown the size scale.
From a consideration of the rela-tive mean weights of particles in
successive y2 size fractions, aworker at the Kruttschnitt Centre,P. Wickham, postulated that, if theparticles in a single size intervallose a proportion x of their weight ast.he result of an abrasion breakageevent, then O,354x (i.e. (1/y2)3x)
will appear in the next smaller y2interval, and the remaining O,646xwill form the detritus, which isspread over a number of considerablysmaller size intervals3. Thispostulate, with x=O,Ol, was adoptedfor the present work, and the func-tion used to describe abrasionbreakage is given in Table H. Thedetritus was arbitrarily given aRosin-Rammler distribution, and thegap of five size intervals between theabraded cores and the detritus wasalso purely arbitrary.
TABLE IIABRASION. BREAKAGE FUNCTION, :1:=0,01
Proportionappearingin fraction
afterbreakage
0,99000,00350,00000,00000,00000,00000,00000,00070,00120,001l0,00090,00070,00050,00040,00030,00020,00020,00010,00000,00000,00000,00000,00000,00000,0000
Numberof size
fraction123456789
10II1213141516171819202122232425
JOURNAL OF THE SOUTH AFRICAN INSTITUTE OF MINING AND METALLURGY

Q;>r
~~Iooooooooooooooo~~~0,," ce
~~ Joooooooooooooo~~~OO
00 ce
e ~1
. . . . . 0 . . . . . . 0 0
o~ ... 0 . . 0 . . 0 . . . .
L
Q;>
~0N~0:;:°fjj
~ce~E-i
r ~~~OO~~
I~~~~~~tj tj tj
"tj tj
I
I I I I I I
100000000000~~~~~~
I tit{t~I
J'J'tjtjtjtj
I
I
I
I
I
I
I
I
I
I
I
I
I
I
J
I
I
I
I
I
I
I
I
I
I
I
I
I
I
I
I
I
I
I
I
I
I
I
~~~00~::s
??????I I I I I
I
0000000000....................................
++++++~~"' ~ "0",
Q;>",
""""'tj tj tj tj tj tj
.2:<ZJ:l~~~d' tj-:'d'
tjJ' J'
I I I I II
000000000....................................
++++++ce~ 0"0 Q;>",,"tj-:'tj-:'J' J' tj-:'J'
~~~OO~~~~~~~~tj tj tj tj tj tj
I I I I I I
00000000....................................
++++++1, ~ 0,:, "0,:,
Q;>,:,
""",:,tj tj tj tj tj tj
~~~OO~~
""""""""""'~"""""""tj tj tj"
tj tj
I I I I I I
0000000"""""""""""""""""" ++++++~.c:;. ~ "0., Q;>.,
""".,tj tj tj tj tj t:!
~~~OO~~-;::'-;::'-;::',,?<-;::'-;::.tj tj tj
"tj tj
I I I I I I
000000....................................
++++++ce~ 0"0 Q;>",,"t tj"" tj"" tj"" t t
r
~ Q;> I0 . . . . . 0 . 0 0 0 0
oQ:t J
0 . 0 0 0 0 0 . 0 0 0 . . 0 .
oo~"'\~celooce~o"OQ;>",,"~~
0 0 0 0 0
~]l
oce~o"OQ;>",,"~~oo'oO"""ce~O"OQ;>",,"~~OOOO'OOO""
JOURNAL OF THE SOUTH AFRICAN INSTITUTE OF MINING AND METALLURGY
>C
"i:
~E....
~
"~tL
GI~.c....
GI.c....
...
0GIEGI.cuIII
fGICGIDOGI.c
!DO
it
NOVEMBER 1974 81

0,5
4
0,3
I L.OJ::....
e.. 20E..~" 0J::.u 53III
is':
To describe crushing breakage, Itmodification of the Rosin-Rammlerdistribution proposed by Broadbentand Callcott4 and further modifiedby Whiten was used in the work onthe autogenous mill:
l-e-(x/y)P
B(x,y)-l-e-l '
where B(x,y) is the proportion ofparticles originally of size y that aresmaller than size x after breakage.The addition of the index p isWhiten's modification and, where pis greater than 1, the effect is toconcentrate the products of breakagenearer the parent size than when pis equal to 1. In the present work,the best value of p was found to be2, and the resulting breakage func-tion is given in Table Ill.
'TABLE IV
-EQUATIONSFOR ABRASIONLIMIT
Calculation size (first y2 size Equation for abrasion limit, /Lmretaining at least 2 % of mill (x = percentage of mill feed retained on
feed), /Lm calculation size)
151712 log,o abrasion limit = (2,45 + 0,32x). X',3 + x
107296 log,o abrasion limit = (2,45 + 0,12x). X',3 + x
75856 log,o abrasion limit = (2,45 + 0,09x), X',3 + X
53648 log,o abrasion limit = (2,45 + 0,06x). X',3 + x
TABLE III
CRUSHING-BREAKAGE FUNCTIONProportionappearingin fraction
afterbreakage
0,19790,33100,21470,12260,06540,03380,01720,00870,00430,00220,001l0,00050,00030,00010,00010,00000,00000,00000,00000,00000,00000,00000,00000,00000,0000
Numberof size
fraction123456789
10II1213141516171819202122232425
The same modified Rosin-Ramm-
ler crushing breakage function was
assumed to hold regardless of the
initial particle size, so that the
crushing breakage portion of the
breakage matrix became a 'step'
matrix. Several workers have pointed
out that this assumption is not
strictly true5 6, but it is sufficiently
accurate for the present purpose, as
is the very arbitrary abrasion break-
82 NOVEMBER 1974
~ r~5-
..Cl",
-'""....is
Cl 1,00..J
2,3
Cl::
co
....] 'E.
-.
2,0
\Slope= -1,0 ~
\\\\
'"'0... I/
I~ Slope=+1 0
Cl't:~'Ill';;1,u'I -]AbraslonI,
'"II
...Crushing
c:.~III
.~«
II14I1,I
13412 53648 21/.592211 853 3353Size,/JITI
Fig. 4-- Typical breakage-rate and discharge-rate functions
JOURNAL OF THE SOUTH AFRICAN INSTITUTE OF MINING AND METALLURGY

age function adopted. As Lynch andMoore7 have stated, the generalform of thc predicted size distribu-tion for the mill discharge is moreimportant than its precise details.
The Abra.sion-to-Cru.shing Tran.sition
Two final parameters need to beknown before the complete breakage-function matrix can be set up;namely, the upper and lower limitsof the transition zone betweenabrasion and crushing breakage. Theupper limit, i.e. the size above whichno crushing breakage occurs, hasbeen named the crushing limit;similarly, the lower limit, the sizebelow which no abrasion breakageoccurs, has been designated theabrasion limit.
The crushing and abrasion limitsin each of the test runs were deter-mined by visual examination of thesize fractions in the load. By suchexamination, it was possible to fixthe size interval in which the sharpedges and conchoidal faces character-istic of crushing breakage firstappeared to any significant extentamong the smooth fragments gener-ated by abrasion. The upper sizeof this interval was taken to be thecrushing limit. Through successivelyfiner fractions, it was noted thatthe proportion of fragments resultingfrom crushing steadily increasedat the expense of those resultingfrom abrasion, until the latter dis-appeared completely. The uppersize of the first interval to containno abraded fragments was taken asthe abrasion limit. Generally, thetransition from all-abrasion to all-
crushing occupied six y'2 size inter-vals.
It was found that the crushinglimit could be related to theconcentrations of any of the four
coarsest y2 size fractions in themill feed (i.e. new feed plus classifierunderflow), provided that such afraction constituted at least 2 percent by weight of the mill feed. Therelationships obtained are given inTable IV. It was found, however,that they became unreliable atrelatively high concentrations of therespective size fractions, and there-fore an upper limit of 26824",m wasset on computed crushing limits. The
abrasion limit was taken as being
five y2 size intervals smaller thanthe crushing limit (i.e. it wasone-eighth of the crushing limit)with a maximum value of 3353",m.
Within the abrasion-to-crushingtransition zone, a simple lineartransition of the type
B=a Bl+(1-a)B2was used,where Bl is the abrasion breakage
function,B2 is the crushing breakage
function, anda is the proportion of the
distance (in size-intervalterms) across the transitionzone.
The Breakage Function Matrix
The abrasion, crushing, and transi-tion breakage matrices were finallycombined into a single three-partmatrix, the general scheme of whichis shown in Fig. 3. Computation ofthe breakage-rate functions anddischarge-rate functions could thenbe carried out.
Characteri.stic.s of the ExperimentalBreakage-rate Function.s
Fig. 4 shows typical breakage-rate(R) and discharge-rate (D) functionscomputed from the test results.Starting from medium values in thecoarsest sizes, the breakage-ratefunction rises rapidly to a peak atthe crushing limit; as crushingbreakage begins to appear, thebreakage rate plunges to very lowvalues for several size intervals (theseare the 'critical sizes' in the auto-genous mill) but commences to risetowards another peak as theabrasion-to-crushing zone is tra-versed. This second peak is usuallythe first of several pseudo-peaksoccurring at the crest of the maincrushing breakage-rate peak. Afterthe last of these pseudo-peaks hasbeen passed, the breakage ratedeclines rapidly as the finest sizesare approached, although it usually
~--- --
shows a final upward kick in thefinest interval defined, namely theminus 76 plus 53",m fraction (themodel assumes that no breakageoccurs in the minus 53",m fraction).
The infinitely large breakage ratefor the largest size in the examplegiven is typical, and is due to theabsence of material of that size inthe load at the end of the test, inspite of the fact that it formed partof the feed. The rate of feeding ofthis coarsest material was, however,so low (about one piece in threehours) that none was present in theload at the conclusion of the test.
The discharge rates, D, are bydefinition zero for all sizes fromthe coarsest down to the milldischarge-grate size (4760",m). Thetest values then rise relativelysteeply over several size intervals,after which they tend towards aconstant plateau value. The dis-charge rate of the mill water ap-proximates also to this plateauvalue.
The E.s.sential Problem.s of A utogenou.sMill Modelling
The basic perfect-mixing modelshows that if A, R, S, and the millfeed are given, the mill contents andproduct can be calculated. Modellingof the autogenous mill is thereforeessentially the modelling of the threeparameters.
The basis of the A matrices usedin this work has already been given;this leaves the modelling of thebreakage and discharge functionstill to be described.
MODELLING OF BREAKAGE-RATE FUNCTIONS
Rate.s of Pebble Wear
The approach to modelling ofbreakage rates in the abrasion-breakage zone was through a studyof pebble-wear rates or weight lossrates, as defined by
Wear rate (weight/time)
(average weight of pebble entering size interval-average weight of pebble leaving size interval)
Average re.si~e~c~ t~m~ i.n ~iz.e ~nt.er:a~ (5)
JOURNAL OF THE SOUTH AFRICAN INSTITUTE OF MINING AND METALLURGY NOVEMBER 1974 83

Wear rates were then converted tobreakage rates R for use in themodel.
The general formula for residencetime is
R.d t
.-
Quantity containedeSI ence Ime-
E t tnryrae
The 'quantity contained' was the
weight in each yl2 size interval ofthe mill load.
The 'entry rate' to any sizeinterval has two components: thenew feed to that interval, and thematerial entering the interval fromcoarser sizes within the mill. Thefact that the new feed has a distribu-tion across the size interval, andthat its residence time in the intervalis therefore distributed, was account-ed for by the usual method ofassuming that all the feed had themaximum size of the interval butthat its rate was only half the actualfeed rate to the interval.
To arrive at the entry rate to asize interval of material from coarserintervals, use was made of a 'con-servation of numbers' hypothesisbased on the nature of abrasionbreakage, Le. size reduction by thedetachment of fine material fromthe surface of a central 'core'. Insteady-state abrasion, therefore, thenumber of cores per unit timeentering a size interval from coarserintervals is simply the sum of thenumbers of pieces fed per unit timeto all those coarser intervals. Theweight 1Iowrate into the receivinginterval is the number of piecesentering per unit time multipliedby the average weight per piece atthe top size of the interval.
Thus the residence time in a size.nterval is obtained fromI
Residence time innth interval
The average weight per piece in aninterval, Wm, was defined by
wm=k(dm)3, (9)where dm is the geometric meanbetween top and bottom sizes(dt and dt! yl2) of the interval, andk is a constant including density andshape factor.
Equations (6) and (7), however,give the average residence time, notof the cores alone, but of the coresplus the material abraded from them.The residence time of the coresalone is given by
fitted by two straight lines of slope3 and 2 respectively, intersecting at53648J.A-m. The slope of 3 impliespebble wear proportional to thecube of pebble size (i.e. proportionalto pebble weight), while a slope of 2implies wear proportional to pebblesurface area.
Similar results were obtained inall Cobar tests, so that it can besaid that, under the conditions ob-taining in these tests, Davis-typewears occurs in pebbles down to
Weight in intervalResidence time of cores-M.
h 11 f h h' Iean WeIg t ~~at.e ~ ?o~es.t .ro.u~ ~n~er~(lO)
M . h fl f -Effective number of pieces entering per unit
ean WeIg t owrate 0 cores- . . h /. .. IN tIme X mean WeIg t pIece m mterva .
ow,Mean weight/piece in interval= ..
"W.
ht/.
t t f . te IMean weIght/pIece m IntervaleIg pIece a op 0 m rva X .
h /. f
. .WeIg t pIece at top 0 Interval
Therefore, from equation (9),
Mean weight/piece in interval=k(dt(dtlyl2»)3/2
Weight/piece at top of interval Xk(dt)3
= Weight/piece at top of fraction X 2-i
1= Weight/piece at top of fraction X
1 706.,
Therefore, equation (7) is modified to
Pebble residence time in nth interval=Weight in nth interval X 1,706
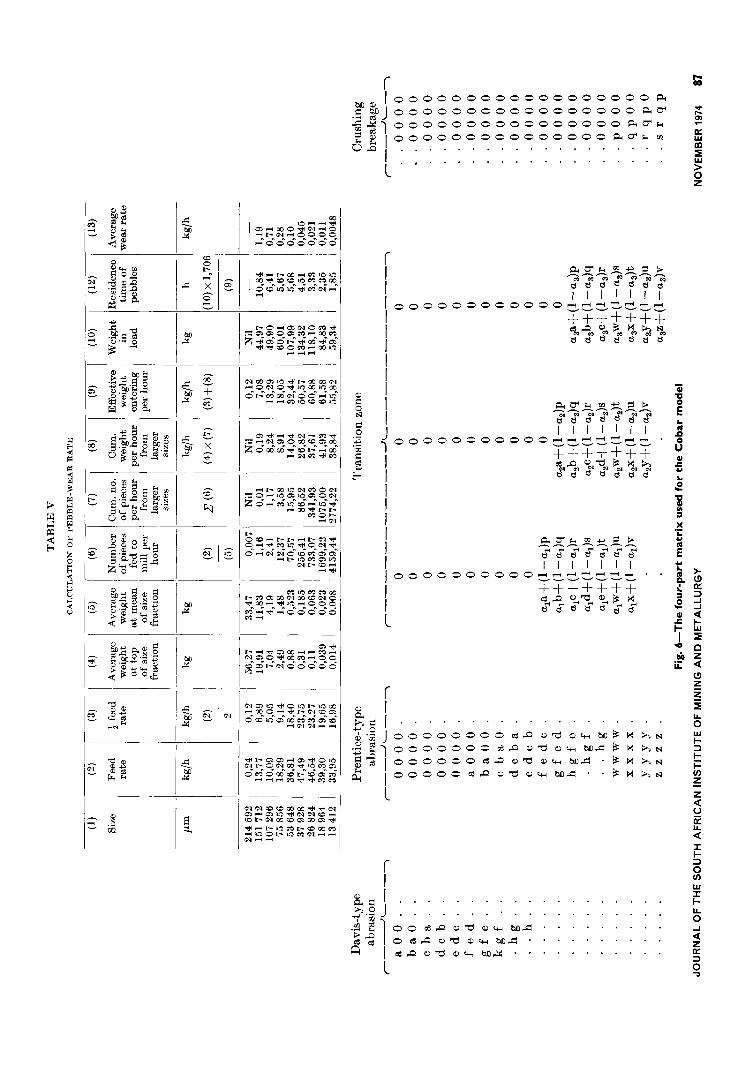
(t weight/time added to nth interval) + E.
Pebble wear rate is then given byequation (5).
Table V shows the method for thecalculation of wear rate and theresults for a typical Cobar test, while,in Fig. 5, log pebble-wear rate isplotted against log pebble size forthree of the tests. The plotted pointscan in each case be reasonably well
Weight in nth interval(t weight/unit time fed to nth interval) + E '
where E=weight 1Iowrate from all coarser intervals.
E= ( 'Ill! Weight/time added to interval )1 Average weight/piece in interval X
84 NOVEMBER 1974
Weight/piece entering
. . :nt~ ~n~er~a~.. (8)
. . . . . . . . (11)
(7)
53648J.A-m in size and Prentice- typewear9 from that size down to thecrushing limit.
Factors Controlling Pebble-wear Rates
If the wear rate at the changeoversize from weight-dependent to sur-face-dependent wear can bepredicted, the wear rates at all othersizes down to the abrasion limitfollow very simply, since, for weight-dependent wear, Jog wear rates for
the successive yl2 size intervals forman arithmetic progression withcommon difference 0,4512
(Le. 3 Xlog yl2), while for surface-dependent wear the progression isalso arithmetic with common differ-
ence 0,3008 (i.e. 2 Xlog yl2).Regression analysis of the factorsthat might control the wear rate atthe changeover size yielded thefollowing relationship
JOURNAL OF THE SOUTH AFRICAN INSTITUTE OF MINING AND METALLURGY

1,0
0,0
:!";Cl.>:
.;"§
a; -1,0Cl0I
-2,0
Circuit feed 0,Ul.t'h,18,2",.+536I.SJ.Lm
Load weight O,S34 t
-3,0131.12 26821. 5361.S
Size"""
107296
1,0
0,0
Cl0I
-3,0131.12
1,0
0,0
l:0.
"".;~ -1,0i'"0....
Circuit feed 0,511 ilh 23,31.", +536'S~m
Load weight 0,911.t
211.5U-3,0
131.12 26821.
Circuit hed O,I.I.I.t/h 32,3S",+536'S/Lm
Load weight 0,516 t
2682'
Fig. S-Rate of pebble wear versus pebble size
5361.SSize, JJ1"
107296
JOURNAL OF THE SOUTH AFRICAN INSTITUTE OF MINING AND METALLURGY
:!";
~.:'ti: -1,0"..~
5361.8Size, iLm
211.592
107296 211.592
NOVEMBER 1974 85
Wear rate at 53648p.m (kg/h)=0,0071 X (circuit feed cumulative % + 53648p.m)
( 500 ) 0,71X
Weight of dry load (kg).
The quantity 500 is simply a stand-ard dry load weight to which thewear rates are corrected. Mill dis-charge density was insignificant inthe range 60 to 80 per cent.
Equation (12) provides a signifi-cant insight into the functioning ofthe grinding media in the autogenousmill (and indeed in all tumblingmills) because it shows. not only thatthe wear rate is dependent on thesizing of the media, but that it isalso inversely related to the quantityof the mill load (i.e., as the weightof the load decreases, the wear rateof the grinding media increases). Thisis a phenomenon well known topebble-mill operators, and can beexplained as follows. The mill loadis imagined to be an epicyclic gearrunning on the inner surface of themill; the smaller the mill load, thefaster it will rotate and the higherwill be the rate of pebble wear.
Because pebble-wear rates arepartly dependent on total weight ofmill load, the pebble portion of theload cannot be predicted alone.Furthermore, since weight of loadis in turn dependent on pebble-wearrates, an iterative method of com-putation of the entire mill load hasto be adopted in which convergenceis obtained between a functionrelating pebble wear direct to loadweight and the mill model, thelatter being in fact a second, in-direct relationship between pebble-wear rates and load weights.The Conversion of Wear Rates toBreakage Rates
Since the mill model adopted wasof the matrix type, it was necessaryto convert the wear-rate model tomatrix form, and the connectionbetween the two types of model wasarrived at by the following reason-ing:
For equilibrium,Weight/time enteringinterval = Weight/timeinterval.
If there is no discharge of the sizefraction from the segment,
Weight/time entering=Number ofpieces in interval xq, . . . . (13)
where q=the total loss in weight
sizeleaving
86 NOVEMBER 1974
. . . . . . . (12)
from the interval per pieceper unit time
=the rate at which materialis abraded from the pieceplus the rate at whichthe piece removes weightfrom the interval bypassing into the nextlower interval.
In the matrix model, the loss inweight per unit time from aninterval is given byWeight/time leaving=(I-al) X
breakage rate(R) X weightin interval,
. . . . (14)where al =the first element in the
breakage function applic-able to the size intervalconcerned, i.e. the pro-portion that remains inthe parent size intervalafter breakage.from equations (13) andTherefore,
(14),Number of pieces in interval xq=(1- al) xR x weight in interval.
. . . . . . . . .(15)Since each entering piece disappearsfrom the interval at the end of itsresidence time, the factor q inequation (13) is simply
Equation (16) relates the residencetime, the essential parameter ofthe wear-rate model, and a and R,the parameters of the matrix model(D being zero in the pebble sizes).
Prediction of Abrasion Breakage Rates
It can be shown that, for Davis-type (i.e. weight-dependent) pebblewear, the residence times insuccessive size intervals in constantratio to each other are equal. ForPrentice-type (i.e. surface-depend-ent) wear, the residence times insuccessively increasing size intervalsin constant ratio to each other arein the same ratio as the intervals.
Therefore, from equation (16), itfollows that the breakage-rate func-tion will be constant for those sizeintervals in which Davis-type wearoccurs, and will then increase ex-ponentially with decreasing size inthe Prentice wear zone until thecrushing limit is reached. Thus, ifthe pebble-wear rate in anyonesize interval can be predicted andthe changeover point between thetwo types of wear is known, thebreakage rates for all sizes above thecrushing limit follow automatically.
Equations (4), (5), (12), and (16)can be combined to give the break-age rate for the Cobar tests in the53468p.m size interval, the change-over size from Davis- to Prentice-type wear-see equation (17).
Weight of pebble at top size of interval.Residence time
Therefore, from equation (15),
N~ of pieces in interval x pebble weight at topResidence time
i.e.,
(I-al) xRxweight ininterval,
Weight in interval x pebble weight at topAverage weight/piece in interval x residence time
Le.,
(I-al) xR x weight ininterval,
Pebble weight at topAverage weight/piece Xresidence tim e
i.e., for a vi2 size series,
(I-al) XR,
1,706- (I ) R (16)
Residence time - al X . . . . .
0,0213 X (circuit feed % + 53648 m) X ( 500. ) 0,71 . (17)p.
Load weIghtR(53648)= (I-al)
JOURNAL OF THE SOUTH AFRICAN INSTITUTE OF MINING AND METALLURGY
po
~<~<H
~2M t:t:
"",~ ;.cC
<~
..<::
---~.!4
I
00'
100 000~O:;:::~"""""""""'°000""""0000"000
iN......
"" '"
.: 0
'"
"
......~",.Q,~ 8,.Q~,~
"~...~
~" ~0" ,~.: cC::-
~,~
..s
�~... ~~,~~.§ 0",~ "'..<::
~~......
~ $&
01Eo<-<I~~-<I01~r,\
~~~01P,
..0
~0~-<I~Pu~-<Iu
...
8~.68[j~§: 3
.~..<::0 ~'"0
~[j~,.$'(iJ
~
!::.
'",...
0", .,
~ as0 8
[j~
8.~..<:: 0 ~.~
~ cC
'".,
'"
......
oo~
...
'"
...
"'"0
'"~,.Q
as..- ~~:£. 8.~
~;::::0., ~",.~..<::
Z'o""8-----
§: ~~ ~ .~'B
~'" 8': ~<~~o~
~~..-
~"'.:cC~o.~.8[j.~...
'"~
~~~'o~
-"g
'"~ ~~~"
...
� ~'""'..-'"
cC[;1;,...
'"'"
~U3
..<::
~.!4
..<::§:
]5 +§:
..<:: E]5 x~
~.!4
fff
I
~I
il�
§:
~
�I§:
""""""oo MICIC16~~~~:~~
......
,.. 0 0><>-1 OM""~O>O>OO>M"""ooM
Z",,"o.;'O"':';OO';o.;'""""'OM"""oolC..................
<>-I00 0> IC"""00
00"""""0""0"'1C001C00O"'""'OO",,"OO"';~MIC
"""IC
0> ", ","" M'"~ ",,0>000"'0>00
Z 000 00","
",",.."...;
00""M'" M
"""",oolC""MO""~O"""ICO>ICO>O""ZO"';"'~~"';IC"'"
"""00"""""MO,..""
,..
O"""""""'""""""""0""" '"
MIC'" O"" '"0 ...;
""
",,"0'"
.., 0.;'0.;',.. >0 M 0> IC
"",..",......
",
MICMMoo,-Mo>oo"" 00""'"
o",,00""""'1C"""000""";';"';00000M......
0>'", "'0>oo""""""M......""o>O",ooM"""OO
~0.;"":",,00000IC"""
"~-"'n_-
j �[<>-I
..<::
~.!4
8:1.
<>-Io>lC"'O>O"'lCoo"""00°""""""""""0>0
"'"IC"0.;'
00""""
0.;' ~""""............
"""'O>O>"""O>"'OIC"",..O""oo""ICMO>0"'000",""':~0.;'..,
"""""""""M"""'MM
"""""""0000"""""O>"""O>IC"" """""'......IC""'"
00
'"
0> 000>'"""""""ICM,..",ooM
ICO"'ICM""""""""""............
r
~ QJ I.::~ J'
.e~~"'\00 .e I::s QJ
I
......
0,.0,
l'
QJ.::0N
.::0
:.;::
'fiJ.::
~Eo-;
rQJ
I
~.:: I-+'> 0d, 'fiJJ0 .e
...,
1:J..o,
QJ'"
~ Il
r
I
~.::I
t',8 J, 00"100 .e
'...
>,.0,
.e .e
AI
l
....
=oooooooooooooooooo~ooooooooooooooooo~~oooooooooooooooo~~...ooooooooooooooo~~...oo
r
I
I
10000000000
,
I
I
I
1
I
I
I
J
,
I
I
I
I
I
1
I
,
100000000
I
I
l
~~",~""::S>-c;; -c;; -c;; ~., -c;; -c;; -c;;~ ~ ~ ~ ~ ~ ~
I I II I I I
00 """"":::,-""'"""",,+++t+++et,.o., 0.,
"'.,~., ~ ~
~ ~ ~ ~ ~ ~ ~
~~...oo~::s>~~~~.J'~~~ ~ ~ ~ ~ ~ ~I I I I
II I
00000000000 :::.-..........
+++++++~,.o.. 0.. "0.. ~.. ~.. ~~ ~ ~ ~ ~ ~ ~
~~...oo""::s>-;::;-;::;-;::;-;::;-;::;-;::;-;::;~ ~ ~ ~ ~ ~ ~I I I I I I I
00...................................
+++++++~,.o... 0... "0... QJ...
~... ~...
~ ~ ~ ~ ~ ~ ~
oooooooo.e,.o 0"0 (j),+-<~~
0 0 0 0 0 0 0 .e,.o 0 "0 QJ'+-<
~~ ~000000 .e,.o 0"0 QJ
'+-<~~
'~
00000 .e,.o 0"0 QJ'+-<~~ ~
00 ce,.o 0"0 QJ'+-<
~~
0 .e,.o 0"0 QJ'+-<~~
.e,.o 0 "0 (j)'+-<~~
~:>'N
~:>'N
~:>'N
~:>'N
..,.
....0>~
It:wIn:1!w>0z
"ii
"Cl
0
E..
10~0UGI.c....
..
.2
"ClGI..::I
>C
';:....10
E....
..
>-i (!),It:..:J::I...J
.2 ...J
GI c(.c I-I- w..!.
:1!
C00 Zii: c(
(!)
ZZ:1!u.0wI-:J
I-
i=(f)
Z
Zc(0it:u.c(
J:I-:J0(f)
wJ:I-u.0...Jc(ZIt::J0,
The R factors for all sizes coarserthan 53648p.m are then the sameas that at 53648p.m, while, forsmaller sizes down to the crushinglimit, the factors are calculated
from the relationship Rn= y2.Rn-1(n = number of size interval, in-creasing with decreasing size).
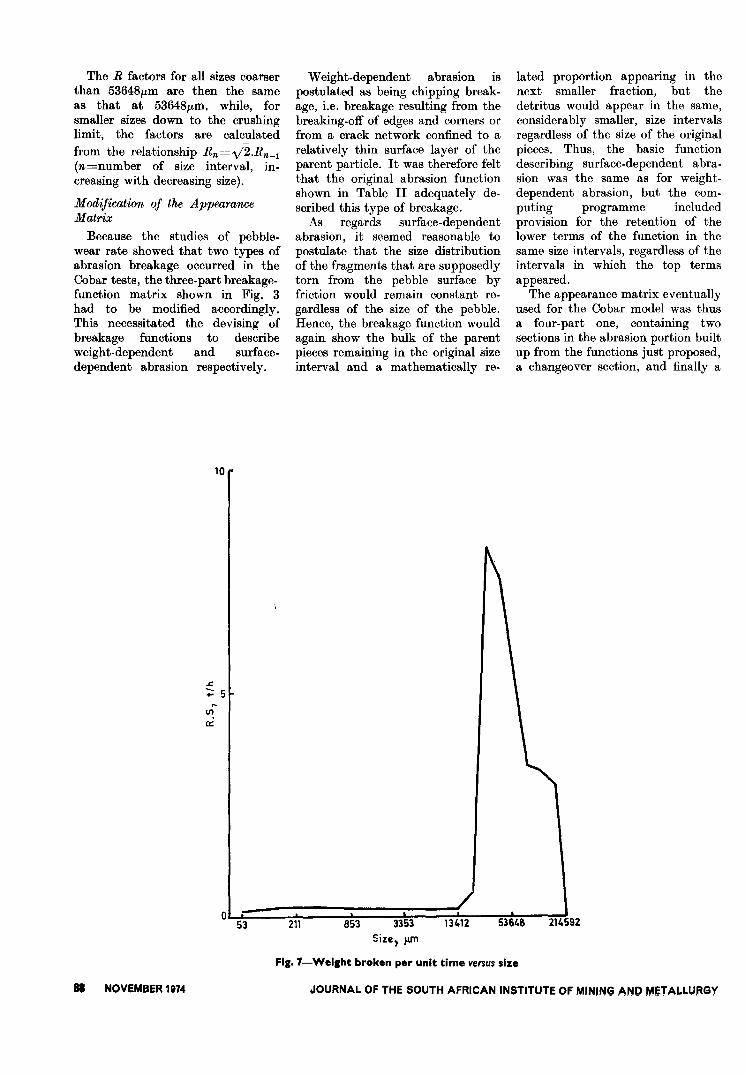
Modification of the AppearanceMatrix
Because the studies of pebble-wear rate showed that two types ofabrasion breakage occurred in theCobar tests, the three-part breakage-function matrix shown in Fig. 3had to be modified accordingly.This necessitated the devising ofbreakage functions to describeweight-dependent and surface-dependent abrasion respectively.
10
.£::;: 5
~
tnCl::
053
88 NOVEMBER 1974
Weight-dependent abrasion ispostulated as being chipping break-age, Le. breakage resulting from thebreaking-off of edges and corners orfrom a crack network confined to arelatively thin surface layer of theparent particle. It was therefore feltthat the original abrasion functionshown in Table II adequately de-scribed this type of breakage.
As regards surface-dependentabrasion, it seemed reasonable topostulate that the size distributionof the fragments that are supposedlytorn from the pebble surface byfriction would remain constant re-gardless of the size of the pebble.Hence, the breakage function wouldagain show the bulk of the parentpieces remaining in the original sizeinterval and a mathematically re-
211 13'-12853 3353
Size, J.LIT1
Fig. 7-Welght broken per unit time versus size
lated proportion appearing in thenext smaller fraction, but thedetritus would appear in the same,considerably smaller, size intervalsregardless of the size of the originalpieces. Thus, the basic functiondescribing surface-dependent abra-sion was the same as for weight-dependent abrasion, but the com-puting programme includedprovision for the retention of thelower terms of the function in thesame size intervals, regardless of theintervals in which the top termsappeared.
The appearance matrix eventuallyused for the Cobar model was thusa four-part one, containing twosections in the abrasion portion builtup from the functions just proposed,a changeover section, and finally a
5361,& 211,592
JOURNAL OF THE SOUTH AFRICAN INSTITUTE OF MINING AND M~TALLURGY

pure crushing section. This is indi-cated in Fig. 6.Crushing Breakage Rates and theirPrediction
As indicated by the dotted linesin Fig. 4, the crushing breakageportion of the rate curve can bereasonably closely simulated by twointersecting straight lines of slope+1,0 ani -1,0 respectively. Thiswas true for all the Cobar tests, and,since breakage rates are also meas-ures of the probability of breakage,the implication is that the prob-ability of crushing breakage increasesinversely with decreasing size to amaximum and thereafter decreasesdirectly with decreasing size. Thisimplication seemed of considerablesignificance, and confirmation wassought in the literature.
Unfortunately, no information onthe breakage rate for autogenousmills could be found, although anumber of authors have publishedsuch data for ball mills2.6.10, andLees2 has computed breakage ratesfrom rod-mill data published byMyers and Lewisll. These data, as isto be expected in correctly operatednon-autogenous mills, show only thepositive slope of the crushing-breakage peak. The slope is usuallyabout 1,4, i.e. somewhat steeper thanin the Cobar mill. The only otherbreakage-rate data for an autogenousmill known to the author are thoseobtained in a test conducted by himon a 5,lm diameter by 5,2m longmill grinding a quartz-magnetitecopper ore in the Warrego concentra-tor, Northern Territory, Australia.The slopes in that case were +1,38and -1,38 (Fig. 18).
The Relationship between CrushingBreakage Rate and Load SizeDistribution
The breakage rate, R, is thequotient of the weight broken perunit time in a size interval by theweight of the load in that interval:
R=R.s.s
Therefore, the more nearly constantis the weight broken per unit time(R.s) over a range of size intervals,the more nearly will the size distribu-tion of the load over the same sizerange approximate the reciprocalof the breakage-rate function. Inthe Cobar tests, the R.s values had
Cic..~-6 0,1
10,0
'1:1..c
'0
~.. 1,0ClEc..uWQ.
,\~.._Slope- -1,0
0,01~~~~~~~8~~~-~-o N~~~~~~NN--NN~W~~W~~~~~~~~~~~m_m
~- N~-.t<D C71~g;~ ~~~!::~-_N~~ oLl'l---("Size, fLm
Fig. 8--Size distribution of the load, Cobar pilot mill
a noticeable tendency to constancyover the size range covered by thecrushing breakage peak (Fig. 7),and the load size distributions there-fore all showed a valley with sideslopes of + I and - I correspondingto the breakage rate peak (Fig. 8).
The size distribution of the loadin the Warrego mill test also showeda +1 and -I valley (Fig. 9),although the breakage-rate peak hadside slopes of + 1,38 and -1,38. Thisis due to the marked curvature inthe graph of R.s versus size com-puted for this test, which may havebeen the result of inaccuracy in thefeed sizing since the feed size distri-bution was known with much lessaccuracy than in the Cobar tests.
To obtain some further confirma-tion of the general form of thecrushing breakage-rate peak, theonly other known autogenous andsemi-autogenous load size distribu-
tions were also transposed onto -yl2size intervals and plotted on log-logaxes. These load sizings were pub-lished by Jackson12 and are for
JOURNAL OF THE SOUTH AFRICAN INSTITUTE OF MINING AND METALLURGY
4,2m diameter by 4,9m long millsgrinding Witwatersrand gold orefully autogenously and semi-autogenously respectively. Again,the fully autogenous mill shows a
+ I and -I valley in its load sizedistribution (Fig. 10), while thesemi-autogenous mill has slopes of+1,4 and -1,4 (Fig. ll).
From these observations, the fol-lowing conclusions were drawn.(I) A valley of side slopes +1 and
- I in the crushing breakage zoneis characteristic of the log-log differ-ential load size distribution in anautogenous mill. For ferrous-mediummills, only the negative slope isnormally evident, and its value isusually about -1,4.(2) In autogenous mills, the log-logcrushing breakage-rate function ischaracteristically a symmetricalstraight-sided peak, the slopes ofwhich differ among mills. The factorscontrolling the slopes are as yetunknown. For ferrous-medium mills,only the positive slope is normallyevident, and its value is usually
NOVEMBER 1974 89

90 NOVEMBER 1974
"tn"....c...u~...a.
10,0
"0
".~1,0~
~S{ope =+ 1,0
:g~:.;0,1~c
0,01M~~N~~~g~~~=M_~~N~~~~~~NN~~~~NN~~~N~~~~~ ~~~~~~~~~
--NM~~"'Md)~"MLl>,,_~__NMLl>"8!!:!r:i
Size,J.lm
Fig. 9-Size distribution of the load, Warrego.
10,0
""0...c
~1,0
...Cl
"....c...uWa. Slope= -1,0 SIope=-t 1,0
c"E~0,1:::c
0,01 . . . . . . . . .. .......... . - ~ N
'"~.
.
. ~ co d)'"
~ NM~~N-Ll>Ng~~~~~~ad) NN~Ll>~~mLl>"~~N~~~~ ~~M"""'~~ d)"'~OON"Ll>
~_N"""""""'~~~M~~!2~~
Size, Ilm
Fig. IO-Size distribution of the load, Leslie
JOURNAL OF THE SOUTH AFRICAN INSTITUTE OF MINING AND METALLURGY
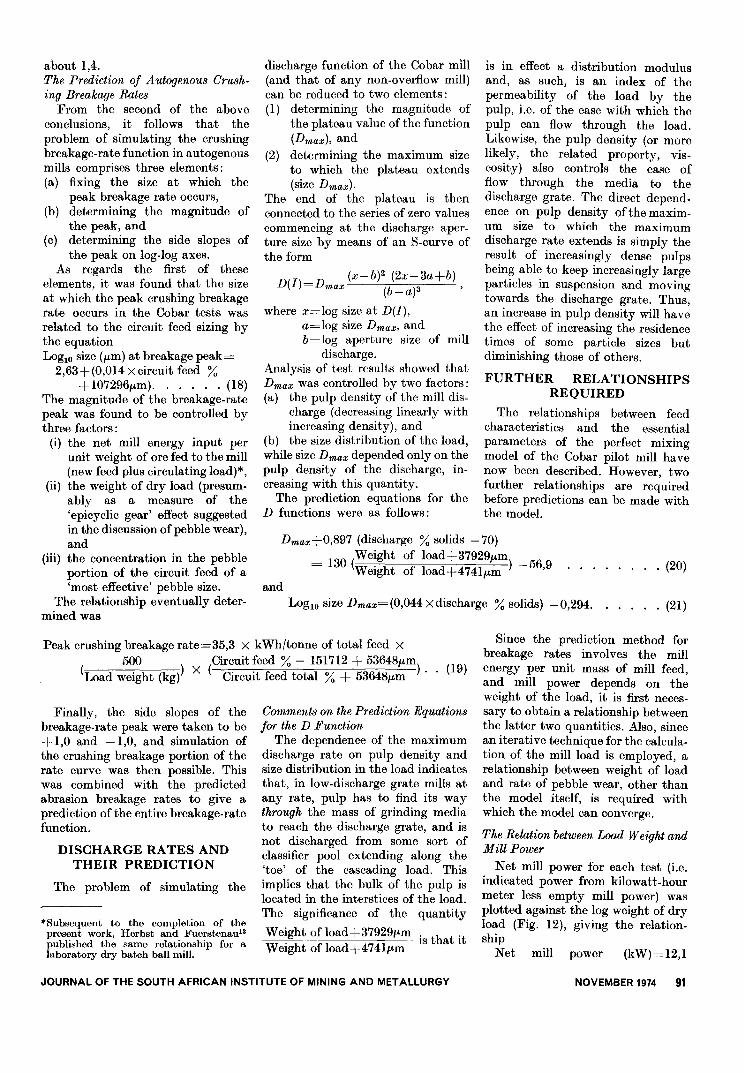
about i,4.The Prediction of Autogenous Crush-ing Breakage Rates
From the second of the aboveconclusions, it follows that theproblem of simulating the crushingbreakage-rate function in autogenousmills comprises three elements:(a) fixing the size at which the
peak breakage rate occurs,(b) determining the magnitude of
the peak, and(c) determining the side slopes of
the peak on log-log axes.As regards the first of these
elements, it was found that the sizeat which the peak crushing breakagerate occurs in the Cobar tests wasrelated to the circuit feed sizing bythe equationLog1O size (fLm) at breakage peak=
2,63+(0,014 X circuit feed %+1O7296fLm). . . . . . (18)
The magnitude of the breakage-ratepeak was found to be controlled bythree factors:
(i) the net mill energy input perunit weight of ore fed to the mill(new feed plus circulating load)*,
(ii) the weight of dry load (presum-ably as a measure of the'epicyclic gear' effect suggestedin the discussion of pebble wear),and
(iii) the concentration in the pebbleportion of the circuit feed of a'most effective' pebble size.
The relationship eventually deter-mined was
discharge function of the Cobal' mill(and that of any non-overflow mill)can be reduced to two elements:(1) determining the magnitude of
the plateau value of the function(Dmax), and
(2) determining the maximum sizeto which the plateau extends(size Dmax).
The end of the plateau is thenconnected to the series of zero valuescommencing at the discharge aper-ture size by means of an S-curve ofthe form
D(I)=D(x-b)2 (2x-3a+b)
max (b-a)3 'where x=log size at D(I),
a=log size Dmax, andb=log aperture size of mill
discharge.Analysis of test results showed thatDmax was controlled by two factors:(a) the pulp density of the mill dis-
charge (decreasing linearly withincreasing density), and
(b) the size distribution of the load,while size Dmax depended only on thepulp density of the discharge, in-creasing with this quantity.
The prediction equations for theD functions were as follows:
is in effect a distribution modulusand, as such, is an index of thepermeability of the load by thepulp, i.e. of the ease with which thepulp can flow through the load.Likewise, the pulp density (or morelikely, the related property, vis-cosity) also controls the ease offlow through the media to thedischarge grate. The direct depend-ence on pulp density ofthe maxim-um size to which the maximumdischarge rate extends is simply theresult of increasingly dense pulpsbeing able to keep increasingly largeparticles in suspension and movingtowards the discharge grate. Thus,an increase in pulp density will havethe effect of increasing the residencetimes of some particle sizes butdiminishing those of others.
FURTHER RELATIONSHIPSREQUIRED
The relationships between feedcharacteristics and the essentialparameters of the perfect mixingmodel of the Cobar pilot mill havenow been described. However twofurther relationships are re~uiredbefore predictions can be made withthe model.
Dmax+0,897 (discharge % solids -70)
- 130 (Weight of load+37929fLm- )-M9Weight of load+4741fLm '
. . . . . . . . (20)
andLog1O size Dmax=(0,044 X discharge % solids) -0,294. . . . . . (21)
Peak crushing breakage rate = 35,3 X kWhjtonne of total feed X500 Circuit feed % - 151712+ 53648fLm
(Load weight (kg)) X ( Circuit feed total % + 53648fLm). . (19)
Finally, the side slopes of thebreakage-rate peak were taken to be+1,0 and -1,0, and simulation ofthe crushing breakage portion of therate curve was then possible. Thiswas combined with the predictedabrasion breakage rates to give aprediction of the entire breakage-ratefunction.
DISCHARGE RATES ANDTHEIR PREDICTION
The problem of simulating the
*Subsequent to the completion of thepresent work, Herbst and Fuerstenau13published the same relationship for alaboratory dry batch ball mill.
Comments on the Prediction Equationsfor the D Function
The dependence of the maximumdischarge rate on pulp density andsize distribution in the load indicatesthat, in low-discharge grate mills atany rate, pulp has to find its waythrough the mass of grinding mediato reach the discharge grate, and isnot discharged from some sort ofclassifier pool extending along the'toe' of the cascading load. Thisimplies that the bulk of the pulp islocated in the interstices of the load.The significance of the quantity
Weight of load+37929fLmis that it
Weight of load+4741fLm
JOURNAL OF THE SOUTH AFRICAN INSTITUTE OF MINING AND METALLURGY
Since the prediction method forbreakage rates involves the millenergy per unit mass of mill feed,and mill power depends on theweight of the load, it is first neces-sary to obtain a relationship betweenthe latter two quantities. Also, sincean iterative technique for the calcula-tion of the mill load is employed, arelationship between weight of loadand rate of pebble wear, other thanthe model itself, is required withwhich the model can converge.
The Relation between Load Weight andMill Power
Net mill power for each test (i.e.indicated power from kilowatt-hourmeter less empty mill power) wasplotted against the log weight of dryload (Fig. 12), giving the relation-ship
Net mill power (kW)=12,1
NOVEMBER 1974 91
,"~
\0,0
"..c'0~ 1,0
..Cl£c..u:;;Co
\
SIOpe-1,1./0
.....c..L.
~ 0,10
Slope+1,1.
0,01~ID~N~ NO~~ID-M-ID~ ~~~m.~.~ N~~O~~~NO~O~_~~O~NIDNN~~-Nm
-~NN~lDm~~~~~~m~~~~~m~~~~-N~~""§~;:::;
Fig. I I-Size distribution of the load in the semi-autogenous Bracken mill
SiZE, )lm
(loglo weight of dry load(kg))-26,4. (22)
This relationship obviously cannotbe extrapolated much beyond thetest conditions, since it implies bothzero net power with an appreciablemill load (152kg) and also indefiniteincrease of power with load. Never-theless, it was incorporated in themill model with a 1O00kg limit oncomputed weight of load.
The Relation between Pebble-wear Rateand Load Weight
To obtain an independent relation-ship between pebble-wear rate, feedsizing, and load weight with whichthe model could converge, it waspostulated that the pebble-wear ratein the minus 75856p.m plus 53648p.mfraction was related to load weightby an equation of the form
and to determine the constant C forvarious arbitrary values of x, finallyselecting the values of C and x thatgave the best fit to the experimentaldata. The resulting equation was
For the 53648p.m size interval ofthe Cobar Eastern ore, and withal=0,99, equation (16) converts to
R=300xwear rate, . . . . (24)where wear rate is in kg/h.
To correct the prediction in-accuracies mentioned, it was neces-sary to add a correction to equation(24), which then became
R=(300 Xwear rate)+120 (weal'rate-0,082). (25)
By use of equation (25), reasonablyaccurate predictions of load weightwere obtained, as shown in Fig. 13.An example of predicted, as com-pared with actual, breakage-rateand discharge-rate functions is givenin Fig. 14, and the predicted andactual size distributions of mill loadand product are given for the sametest in Fig. 15. Generally goodagreement between predicted andactual size distribution is evident,in spite of obvious discrepanciesin the breakage and discharge rates.In particular, the approximation ofthe multiple crushing peaks by asingle peak does not appear toaffect the predictions of size distribu-tion significantly, and neither doesthe generally inaccurate predictionof Dmax. On the other hand, thevital importance of accuracy in theprediction of abrasion breakage rateshas been evident in all results, for,where the discrepancies in thisparameter are greatest, the lowestoverall accuracy of prediction isobtained. The model is far moresensitive to the abrasion than to thecrushing breakage rates. It is unfor-
P bbl - t (k jh) t 53648_0,14 (circuit feed % + 53648p.m)
e e wear ra e g a p.m(Load weight (kg))O,S
.. . . . . . . . . . . . . (23)
RESULTS OBTAINED USINGTHE MODEL
The original model gave predict-ions of load weight that were toohigh at low pebble-wear rates andvice versa. Since the predicted wearrates themselves agreed closely withthose in the analysis of pebble-wearrate already described, it was ap-parent that the fault lay in equation(16), the conversion from residencetime to abrasion breakage rate.
P bbl t _C. (circuit feed % + 536i8p.m)e e-wear ra e
(L d. h )oa WeIg t x
92 NOVEMBER 1974
tunate that, because of the smallnumbers of pebbles in the circuitfeed and the resulting small num-bers in the mill loads, it is also in thelargest sizes that the experimentaldata are least accurate. Clearly,autogenous milling tests aimed atmodel building should be done onthe largest possible scale.
MODELLING OF ANINDUSTRIAL-SCALEAUTOGENOUS MILL
Almost coincident with thecompletion of the steady-state modelof the Cobar pilot mill, an oppor-
JOURNAL OF THE SOUTH AFRICAN INSTITUTE OF MINING AND METALLURGY

10
3:-"
(;)
9
E)
~...~[8
(;)
'E
"tiz
7
6(;)
-0,2 -0,1Log wtight of dry load ,1
10
0,0
Fig. 12-Net mill power versus log weight of dry load
1000E)
o::n.::t.
~
"Cl0
E)
(;SOD
....
.s::o::n...~
"...,-g
"...a':
500Actual weight ot load? kg
Fig. IJ-Accuracy of predictions of load weight
1000
JOURNAL OF THE SOUTH AFRICAN INSTITUTE OF MINING AND METALLURGY
tunity arose to confirm its generalform on an industrial scale in theWarrego concentrator of Peko-Wallsend Ltd, approximately 60kmwest of Tennant Creek, NorthernTerritory, Australia.
The primary grinding circuit atWarrego comprises a single 5,lmdiameter by 5,2m grate-dischargerun-of-mine autogenous mill inclosed circuit with a nest of fiveKrebs D15B 38cm cyclones. Themill is driven by a 1700kW motorat 13,9 rev/m in (72,8 per cent Ne).Empty running power is 65kW. Theore is a quartz-magnetite carryingchalcopyrite, bismuthinite, andpyrite, with a specific gravity ofabout 4; its top size is controlledby a jaw crusher.
A series of tests was carried outin which the feed rate and thedensity of the cyclone overflow weresystematically varied at one jaw-crusher setting (14,lcm). At eachfeed rate and cyclone-overflow den-sity, the mill was allowed to reachequilibrium as indicated byconstant power draft, and the circuitwas then sampled for size analysis.The feed sample for each testconsisted of a cut approximately6m long and weighing about 0,5ttaken from the feed belt after allother sampling in the test had beencompleted.
On completion of the first series oftests, the jaw-crusher setting wasreduced from 14,lcm to 1l,lcm andthe series repeated.
At the conclusion of one of thetests in the first series, the load wasdumped from the mill and sized. Itweighed approximately 70t dry, i.e.less than half a 50-per-cent mill load.Its log-log differential size distribu-tion is given in Fig. 9, and thecumulative distribution in Fig. 16.
The Empirical ModelFrom the test results, a simple
empirical model relating crushersetting, feed rate, and cyclone-overflow density to the percentageof minus 200 mesh material in thecyclone overflow was derived. Thismodel has been described in anotherpaper14, from which Fig. 17 isreproduced.
Fig. 17 shows the relation betweenfeed rate and mill power for theWarrego mill at two crusher settings.As predicted by the Cobar model,
NOVEMBER 1974 93

20
........~.....c:u
~::
0
10
94 NOVEMBER 1974
I-'=.:..:-a::
150PredictedActual
ua
100co
8."..."um 50
0I-'=~ 1.0
0uc;... 20uCli;
-'=u.~ 00
-- - , ......"-......
""M~~N=~~O~~~=~~~~~~~~~~~N~~~~~NN~~~N~~~~~~~~~~~~~~~
--NM~~cnMCI)~~~~t""--__NML/"I~~~N
Size, J.!m
Fig. I4-Predicted and actual breakage-rate and discharge-rate functions
"r --- Predicted- Actual
discharge
0!"2~~ _ ~ N
~~N
~g~~~= ~~:g~!::!;;!;~~CI)~~N:;::u..- ~ ~~CI)Nw~M~~~~cn~cn~CI)N~~__N ~~wcn~~~~~t!!bUi::! __NSize, p.m
Fig. IS-Predicted and actual size distributions of mill load and product
JOURNAL OF THE SOUTH AFRICAN INSTITUTE OF MINING AND METALLURGY
0
10
20
~ 30c:
'0....~... /,0DI0c:...<.I
~ SO
...,~....0:; 60E:>
u
70
80
\)0
~N~~~O~~~-~~~NN~~~~~~NN~~NN~~~N~~~~~5~m~~~~N~~
~~N~~<D"'::!~~:;;~r--:;S;~~ ~ N
Size, }lm
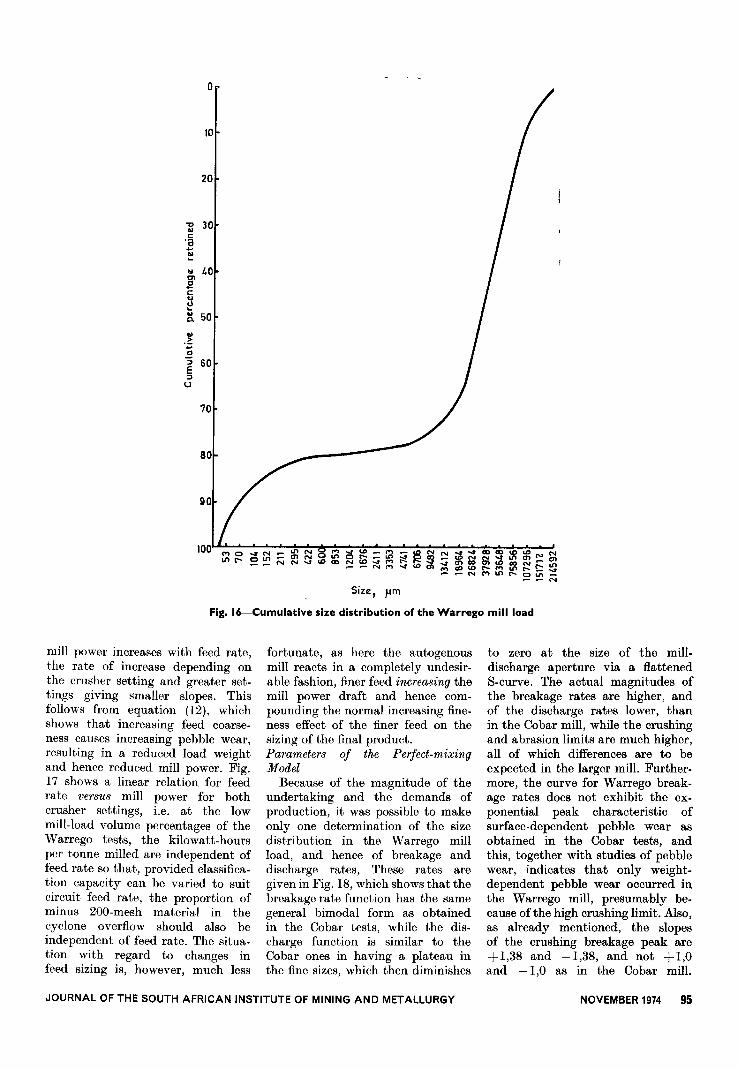
Fig. I6-Cumulative size distribution of the Warrego mill load
mill power increases with feed rate,the rate of increase depending onthe crusher setting and greater set-tings giving smaller slopes. Thisfollows from equation (12), whichshows that increasing feed coarse-ness causes increasing pebble wear,resulting in a reduced load weightand hence reduced mill power. Fig.17 shows a linear relation for feedrate versus mill power for bothcrusher settings, i.e. at the lowmill-load volume percentages of theWarrego tests, the kilowatt.hoursper tonne milled are independent offeed rate so that, provided classifica-tion capacity can be varied to suitcircuit feed rate, the proportion ofminus 200-mesh material in thecyclone overflow should also beindependent of feed rate. The situa-tion with regard to changes infeed sizing is, however, much less
fortunate, as here the autogenousmill reacts in a completely undesir-able fashion, finer feed increasing themill power draft and hence com-pounding the normal increasing fine-ness effect of the finer feed on thesizing of the final product.Parameters of the Perfect-mixingJJ1odel
Because of the magnitude of theundertaking and the demands ofproduction, it was possible to makeonly one determination of the sizedistribution in the Warrego millload, and hence of breakage anddischarge rates, These rates aregiven in Fig. 18, which shows that thebreakage rate function has the samegeneral bimodal form as obtainedin the Cobar tests, while the dis-charge function is similar to theCobar ones in having a plateau inthe fine sizes, which then diminishes
JOURNAL OF THE SOUTH AFRICAN INSTITUTE OF MINING AND METALLURGY
to zero at the size of the mill-discharge aperture via a flattenedS-curve. The actual magnitudes ofthe breakage rates are higher, andof the discharge rates lower, thanin the Cobar mill, while the crushingand abrasion limits are much higher,all of which differences are to beexpected in the larger mill. Further-more, the curve for Warrego break-age rates does not exhibit the ex-ponential peak characteristic ofsurface-dependent pebble wear asobtained in the Cobar tests, andthis, together with studies of pebblewear, indicates that only weight-dependent pebble wear occurred inthe Warrego mill, presumably be-cause of the high crushing limit. Also,as already mentioned, the slopesof the crushing breakage peak are+1,38 and -1,38, and not +1,0and -1,0 as in the Cobar mill.
NOVEMBER 1974 95

500 Crusher setting,cm
11,1 1t.,1
{
1,35 0Nominal density of 1, 1,5 . 0classifier overflow
1,60 . 6
2000
1500
~..x
~~1O00~0a.
~
----
65
00 so
Circuit feed rate, t Ih100 150
Fig. 17-Feed rate versus mill power, Warrego mill
Nevertheless, the general similarityof the breakage and discharge func-tions for the two mills indicates thatthe mechanisms are fundamentallythe same, and that the form of themodelling equations obtained forthe Cobar mill would therefore applyto the Warrego mill, only the con-stants being different.The DR-l Parameter
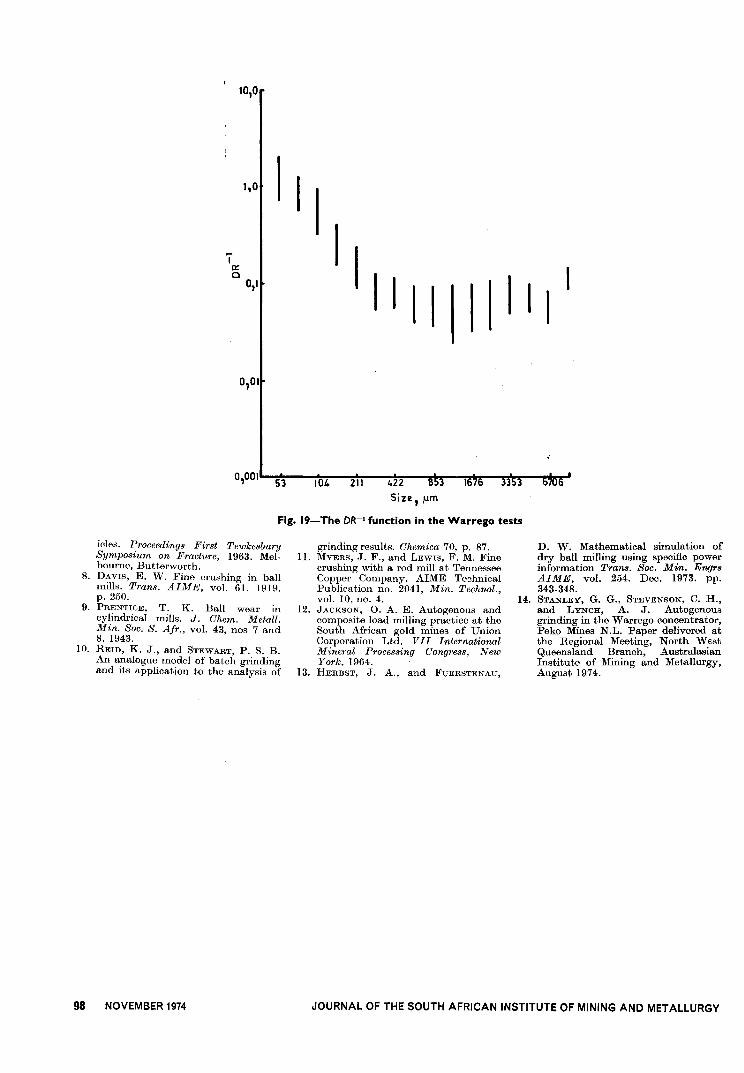
In the discussion of the theory ofthe perfect-mixing model, it waspointed out that, if the load sizedistribution 8 was not known, the
parameters D and R could not beseparated but could be obtainedonly as a combined parameter suchas DR-l. Accordingly the DR-lfunction was computed for each ofthe Warrego tests, the general formof the results being as shown inFig. 19. If DR-l can be related tooperating conditions, it can be usedin the prediction of mill productfrom mill feed, although no informa-
96 NOVEMBER 1974
tion about the mill load can beobtained. Work on this possibilityis proceeding.
CONCLUSION
It has been shown that, by inclu-sion of the special characteristics ofthe autogenous mill (in particular,the simultaneous occurrence of abra-sion and crushing breakage), it ispossible to develop a satisfactorysteady-state model of that type ofmill on the hypothesis of perfectmixing. Analysis of the factors thatcontrol the model parameters hasthrown new light on the mechanismof the autogenous mill, and indeedof all types of tumbling mill.Specifically:(1) there is a transition zone betweenabrasion and crushing breakage, thelimits of this zone depending onfeed sizing;(2) two kinds of pebble abrasion canoccur, namely weight dependent and
surface dependent, and these corres-pond to Davis-type and Prentice-type grinding-ball wear respectively;(3) there is an 'epicyclic gear' typeof effect in the mill load thatincreases breakage rates as the loadsize decreases, presumably owing toan increase in the frequency withwhich particles are subjected tobreakage events;(4) crushing breakage rates arecontrolled by the energy input perunit mass of mill feed;(5) crushing breakage rates are alsocontrolled by the concentration ofthe optimum-sized grinding mediain the feed, and the effectiveness ofthese optimum media is reducedby the presence of excessively largemedia; and(6) discharge rates in non-overflowmills are controlled by the sizedistribution of the mill load and bythe pulp density of the milldischarge.
However, the present work hasnot examined all the factors thatmight affect the model parameters;in particular, more research needsto be done into the effects of millsize and speed, and of ore character-istics, on pebble-wear rates. Theeffect of mill length:diameter ratioalso awaits elucidation, and, ofcourse, ways of overcoming theadverse reaction of the autogenousmill to increasing feed coarseness,namely that it then draws less, andnot more, power, should be investi-gated.
Since the breakage-rate anddischarge-rate functions are theessential parameters (together withthe breakage function, which ispresumably ore-dependent) that de-termine the size distribution of anymill product, knowledge of howthey are controlled would offer amore rational basis for mill designthan the purely empirical one nowemployed, and would seem to holdout the possibility of 'tailoring' pulpsize distributions closer to the opti-mum for subsequent recovery pro-cesses than is now possible. The useofthe model for mill design optimiza-tion is, however, only one of itsmany possible applications, and itis hoped that, now that a satisfactorymodel of the autogenous mill hasbeen demonstrated, it will findwidespread use in plant design and
JOURNAL OF THE SOUTH AFRICAN INSTITUTE OF MINING AND METALLURGY

2,0
i'..r=
..n:u....
~u
g'1,5.><Cl..
~Cl0
-'
2,5
])0
I
I
II
....'f
I 0,5c:
~- 0
i~~b,~,.~ ...\D~ ~ = :£ ~ g [ri ~ ~ = [ri ::; ~ ~ ~a ~~~~NN~\D~~~~~~~~~
.~E
Clc:
',CUI::J...uIII
.:,.:,~.;..;.~.:.~:§:~I1J~~~~~",,\D~...LI'I~~~-N"'~~oLl'l-
- ~ NSize, ILm
Fig. IS-Breakage- and discharge-rate functions for the Warrego mill
optimization and also in automaticcontrol studies.
ACKNOWLEDGEMENTS
The author wishes to thank themanagements of Cobar Mines ptyLtd and of Peko Mines N.L. for thegenerous provision of research facili-ties on their properties and forpermission to publish the results. Healso gratefully acknowledges theaward of a Research Scholarshipby the University of Queenslandfrom funds provided by Mount IsaMines, Ltd, and of financial supportand encouragement from Union
Corporation Limited. Dr A. J.Lynch, Director of the Julius Krutt-schnitt Mineral Research Centre, DrW. J. Whiten, Research Officer, andmany others at the Centre providedinvaluable assistance that is mostgratefully acknowledged. The per-mission of the Director General,National Institute for Mlhllurgy,Johannesburg, to publish this paperis also gratefully acknowledged.
REFERENCES
1. WHITEN, W. J. A matrix theory ofcomminution machines. Chem. EngngSci., vo!. 29. 1974. pp. 589-599.
JOURNAL OF THE SOUTH AFRICAN INSTITUTE OF MINING AND METALLURGY
2. LEES, M. J. Experimental and com-puter studies of the dynamic behaviourof an industrial grinding circuit. Ph.D.Thesis, University of Queensland,1973.
3. WICKHAM, P. Comminution of pebblesand fine ores. M.Eng.Sci. Thesis,University of Queensland, 1972.
4. BROADBENT, S. R., and CALLCOTT,T. G. Coal breakage processes. J. Inst.Fuel, vo!. 29. 1956.
5. BUSH, P. D. The breakage of mineralparticles in ball mills. Ph.D. Thesi3,University of Queensland, 1970.
6. TAUTE, W. J., MEYER, P. H., andAUSTEN, L. G. Comparison of break-age parameters in .two tumblingmills of different diameter. IFACSymposium on Automatic Control inMining, Mineral and Metal Process-ing, Sydney, 1973.
7. LYNCH, A. J., and MOORE, D. E. Themechanical breakage of mineral part-
NOVEMBER 1974 97
1O,0
1,0
("Q::a
O,1
0,°1
0,001
icles. Proceedings First TewkesburySymposium on Fracture, 1963. Mel-bourne, Butterworth.
8. DAVIS, E. W. Fine crushing in ballmills. Trans. AIME, vo!. 61. 1919.p.250.
9. PRENTICE, T. K. Ball wear incylindrical mills. J. Chem. Metall.Min. Soc. S. Afr., vo!. 43, nos 7 and8. 1943.
10. REm, K. J., and STEWART, P. S. B.An analogue model of batch grindingand its application to the analysis of
98 NOVEMBER 1974
11
11I1 11
I
53 101. 211 422 3Size, ,urn
Fig. 19- The DR-l function in the Warrego tests
grinding results. Chemica 70, p. 87.11. MYERs, J. F., and LEWIS, F. M. Fine
crushing with a rod mill at TennesseeCopper Company. AIME TechnicalPublication no. 2041, Min. Technol.,vo!. 10, no. 4.
12. JACKSON, O. A. E. Autogenous andcomposite load milling practice at theSouth African gold mines of UnionCorporation Ltd. VII InternationalMineral Processing Congress, NewYork, 1964. .
13. HEI\EST, J. A., and FuEI\sTENAU,
D. W. Mathematical simulation ofdry ball milling using specific powerinformation Trans. Soc. Min. EngrsAIME, vo!. 254. Dec. 1973. pp.343-348.
14. STANLEY, G. G., STEVENSON, C. H.,and LYNCH, A. J. Autogenousgrinding in the Warrego concentrator,Peko Mines N.L. Paper delivered atthe Regional Meeting, North WestQueensland Branch, AustralasianInstitute of Mining and Metallurgy,August 1974.
JOURNAL OF THE SOUTH AFRICAN INSTITUTE OF MINING AND METALLURGY

NIM reportsThe following reports are available
free of charge from the NationalInstitute for Metallurgy, PrivateBag 7, Auckland Park 2006.Report No. 1613
Deactivation of copper-activatedsphalerite with cyanide.
The rate of deactivation of copper-activated sphalerite with cyanide hasbeen shown to depend on the concen-tration of free cyanide and on theamount of Zn(OH)2 precipitatepresent. At concentrations of freecyanide above about 1O-4M in thepresence of Zn2+, the deactivationis inhibited to a small extent.
The presence of S2-, S032-, orCa2+ has no effect on the rate ofdeactivation, although it is decreasedby the addition of Fe2+ and Fe3+(in the form of the respectivecyanide).
The results obtained indicate thatcopper-activated sphalerite, in itsreactions with cyanide, does notresemble any of the simple coppersulphides.
Report No. 1639The determination, by 14 MeV
neutron-actl:vation analysis, of smallamounts of oxygen and silicon indiamond.
Techniques for the measurementof low levels of oxygen and siliconby fast-neutron-activation analysis
Papers of interestThe following papers may be of
interest to members.Surge propagation and reflection
on a 400 kV transmission line,by F. G. Heymann
A digital accelerator for torque
have been developed and applied tohigh-quality diamonds. For oxygen,limits of detection of approximately5 fLg have been established. Sourcesof error have been studied andeliminated, the ubiquitous occur-rence of oxygen being the majorproblem. Within the accuracy ofthis work, the results obtained showno significant differences between theoxygen contents of diamonds ofdifferent types, or of diamonds fromdifferent sources. An oxygen contentof 35:t 4 p.p.m. has been establishedfor high-quality, colourless dia-monds. For silicon, a limit ofdetection of 25 fLg was established,and the average silicon content ofhigh-purity diamonds was found tobe less than 3 p.p.m. It is concludedthat the oxygen in high-puritydiamonds is present as CO2 orH2O and not in silicate inclusions.Report No. 1649
The establishment of preferred valuesfor a series of fluorspar samples.
This report correlates the analyticaldata supplied by fifteen differentlaboratories for five samples offluorspar. The results, their statisticaltreatment, and brief descriptions ofthe analytical methods used aregiven. Recommended mean valuesare assigned to the five samples.Useful results for the minor andtrace elements are also included.
speed studies, by C. G. Yameyand P. B. RobinsonTrans. S. Afr. Inst. Elec. Engrs,September 1974.
The John Orr Memorial Lecture:
JOURNAL OF THE SOUTH AFRICAN INSTITUTE OF MINING AND METALLURGY
Report No. 1668
An updated summary of the world'sfluorspar industry.
The world's consumption of fluor-spar is expected to increase from4,7 million tonnes in 1972 to ap-proximately 6,0 million tonnes in1975, and to 7,3 million tonnes in1980. Steelmaking accounts for 56per cent, the balance being consumedin order of importance, by thefollowing industries: aluminium,fluorocarbon, uranium enrichment,stainless-steel pickling, and petrol-eum alkylation.
South Africa has the largestproven ore reserves (U8 milliontonnes containing approximately 30million tonnes of OaF 2) but at presentproduces only 210 324 tonnes of allgrades. However, local producershave realized the future importanc3of fluorspar and are aware of theindication that South Africa maybecome the main supplier to thewestern world from the middle ofthe next decade.
New plants and extensions toexisting plants will probably increasethe present capacity from 175000tonnes to 410 000 tonnes by 1976.Of this production, 25 per cent maybe further processed to agglomeratesto be exported as a substitute formetallurgical-grade fluorspar.
Mechanics, pure and simple(applied and elaborated indesign), by K. H. Hunt.S. Afr. Mech. Engr, September1974.
NOVEMBER 1974 99