mechanics of origin of flow liquefaction instability …...insight into the mechanics of origin of...
TRANSCRIPT

RESEARCH PAPER
Mechanics of origin of flow liquefaction instabilityunder proportional strain triaxial compression
Utkarsh Mital1 • Jose E. Andrade1
Received: 18 May 2015 / Accepted: 14 December 2015
� Springer-Verlag Berlin Heidelberg 2016
Abstract We define a flow liquefaction potential for
determining flow liquefaction susceptibility during pro-
portional strain triaxial compression. The flow liquefaction
potential is a function of inconsistency between the natural
dilative tendency of the soil and the imposed dilatancy
during proportional strain triaxial compression. It helps us
analyze why given the right conditions, a loose soil that
contracts during drained triaxial compression and liquefies
under undrained triaxial compression may be stable under
proportional strain triaxial compression. Conversely, we
also use the flow liquefaction potential to analyze why a
dense soil that dilates during drained triaxial compression
and is stable under undrained triaxial compression may
liquefy under proportional strain triaxial compression. The
undrained loose case is a special case of proportional strain
triaxial compression under which a soil can liquefy. The
central objective of this paper was to investigate the origins
of flow liquefaction instability. Hence, we also analyze
stress evolution during proportional strain triaxial com-
pression and discuss the mechanics of the test leading up to
flow liquefaction instability. We arrive at a necessary
precursor for instability, which can serve as a warning sign
for flow liquefaction instability, while the soil is still stable.
The precursor is not a condition of sufficiency and should
also not be confused with the onset of instability itself. The
same loading must be applied continuously to induce flow
liquefaction instability. The current progress is encourag-
ing and facilitates a deeper understanding of origin of flow
liquefaction instabilities.
Keywords Flow liquefaction potential � Mechanics �Necessary precursor � Proportional strain triaxial
compression
1 Introduction
Liquefaction is a field-scale phenomenon, typically asso-
ciated with earthquake-induced shaking that causes a loss
of strength of saturated cohesionless granular media. It can
lead to catastrophes such as landslides, tilting and settle-
ment of buildings and failure of dams, bridges and
retaining walls [15]. Typically, liquefaction can be divided
into flow liquefaction and cyclic mobility [12, 15]. The US
National Academy of Science’s National Research Council
[15] defined flow liquefaction as, ’the condition where a
soil mass can deform continuously under a shear stress less
than or equal to the static shear stress applied to it.’ Flow
liquefaction is the more devastating manifestation of liq-
uefaction that can lead to field-scale catastrophes. Cyclic
mobility, on the other hand, is a more benign form of
liquefaction which does not lead to loss of stability.
Although primarily associated with earthquakes, flow
liquefaction has been shown to occur under both static and
dynamic loading [10, 12, 13, 18]. It occurs when the shear
stress required for static equilibrium of a soil mass is
greater than the shear strength of the soil in its liquefied
state [12]. Given its consequences, it is important to not
only understand this phenomenon, but also what causes it
in the first place. Although progress has been made in
& Jose E. Andrade
Utkarsh Mital
1 Division of Engineering and Applied Science, California
Institute of Technology, Pasadena, CA 91125, USA
123
Acta Geotechnica
DOI 10.1007/s11440-015-0430-8
understanding the macro- and micro-mechanics at the onset
of flow liquefaction instability [1, 5, 6, 8, 11, 16], our
understanding of the origin of this phenomenon is still
incomplete. For instance, Why are loose sands susceptible
to flow liquefaction under undrained conditions [12]? How
much increase in pore pressure is sufficient to induce liq-
uefaction? and Why does the amount vary under different
initial conditions [12]? In addition, it is usual to assume
that flow liquefaction instability occurs under completely
undrained or constant volume conditions. However, there is
evidence [14, 15, 17, 20] to suggest that soil may undergo
volume changes during earthquake shaking. Under static
loading, a soil may be experiencing volume changes due to
unequal pore pressure generation in adjacent soil layers of
different densities [19, 20]. Flow liquefaction under such
conditions cannot be attributed to constant volume defor-
mations. Our central objective is to address the afore-
mentioned issues by investigating the origins of flow
liquefaction instability under proportional strain triaxial
compression conditions.
We start by defining a flow liquefaction potential for
determining flow liquefaction susceptibility during pro-
portional strain triaxial compression. A proportional strain
triaxial test is one in which the imposed volume change (or
the imposed dilatancy) is proportional to the axial strain on
the soil specimen. If the volume is imposed to be constant
(isochoric strain compression), then the test becomes an
undrained triaxial test [7]. The flow liquefaction potential
is a function of inconsistency between the natural dilative
tendency of the soil and the imposed dilatancy during
proportional strain triaxial compression. Such a potential
has been used previously [7]. Previous works also imply
[5–8, 11] that given the right conditions, a loose soil that
contracts during drained triaxial compression and liquefies
under undrained triaxial compression may be stable under
proportional strain triaxial compression. Conversely, a
dense soil that dilates during drained triaxial compression
and is stable under undrained triaxial compression may
liquefy under proportional strain triaxial compression. The
undrained loose case is a special case of proportional strain
triaxial compression under which a soil can liquefy. By
analyzing the defined flow liquefaction potential, we pro-
vide an interpretation about the micro-mechanics at play
which make a soil susceptible to flow liquefaction. Fur-
thermore, we also analyze stress evolution during propor-
tional strain triaxial compression and discuss the
mechanics of the test leading up to flow liquefaction
instability. We arrive at a necessary precursor for insta-
bility, which can serve as a warning sign for flow lique-
faction instability under proportional strain triaxial
compression, while the soil is still stable. It is important to
note that the precursor is not a condition of sufficiency and
should also not be confused with the onset of instability
itself. The same loading must be applied continuously to
induce flow liquefaction instability. This provides further
insight into the mechanics of origin of flow liquefaction
instability under proportional strain triaxial compression.
2 Soil response under proportional strain triaxialcompression
In a proportional strain triaxial compression test, the vol-
umetric strain increment is proportional to the axial strain
increment. The undrained triaxial compression test is a
special case where the proportion is equal to zero, resulting
in a constant volume test. The behavior of soil under
proportional strain triaxial compression can be either
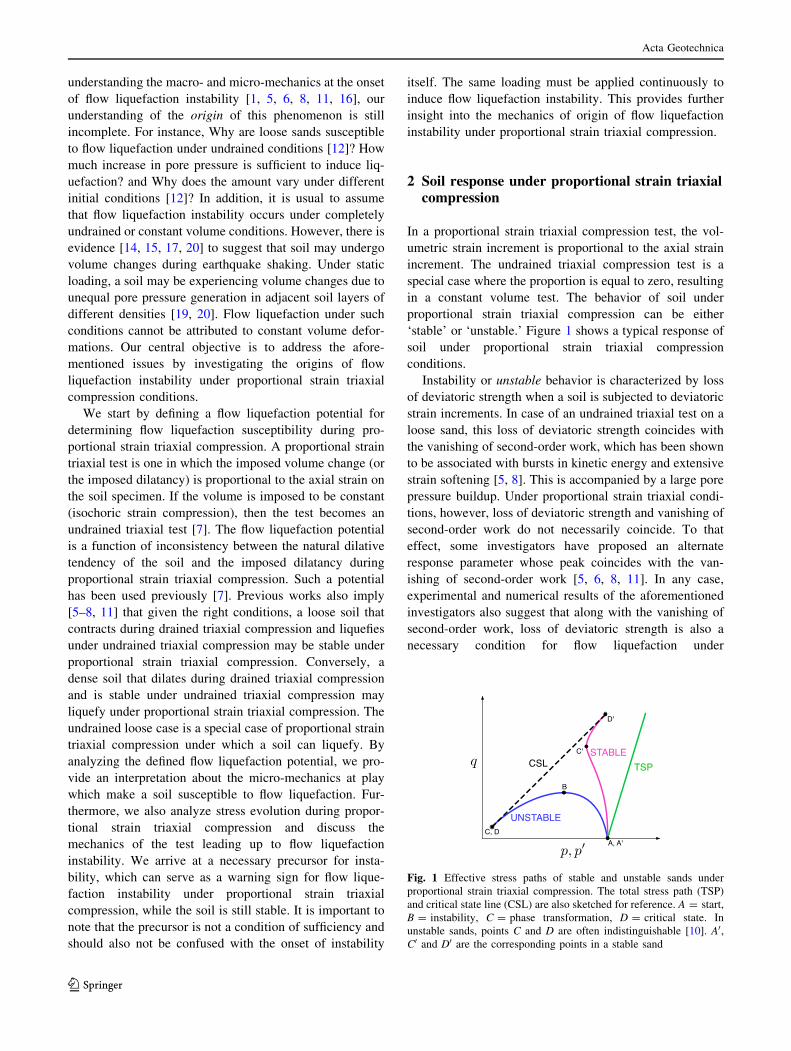
‘stable’ or ‘unstable.’ Figure 1 shows a typical response of
soil under proportional strain triaxial compression
conditions.
Instability or unstable behavior is characterized by loss
of deviatoric strength when a soil is subjected to deviatoric
strain increments. In case of an undrained triaxial test on a
loose sand, this loss of deviatoric strength coincides with
the vanishing of second-order work, which has been shown
to be associated with bursts in kinetic energy and extensive
strain softening [5, 8]. This is accompanied by a large pore
pressure buildup. Under proportional strain triaxial condi-
tions, however, loss of deviatoric strength and vanishing of
second-order work do not necessarily coincide. To that
effect, some investigators have proposed an alternate
response parameter whose peak coincides with the van-
ishing of second-order work [5, 6, 8, 11]. In any case,
experimental and numerical results of the aforementioned
investigators also suggest that along with the vanishing of
second-order work, loss of deviatoric strength is also a
necessary condition for flow liquefaction under
Fig. 1 Effective stress paths of stable and unstable sands under
proportional strain triaxial compression. The total stress path (TSP)
and critical state line (CSL) are also sketched for reference. A = start,
B = instability, C = phase transformation, D = critical state. In
unstable sands, points C and D are often indistinguishable [10]. A0,C0 and D0 are the corresponding points in a stable sand
Acta Geotechnica
123

proportional strain conditions in a triaxial test. We will
briefly discuss the alternate response parameter in
Sect. 4.2. Presently, for the sake of simplicity, we consider
the deviatoric stress as a response parameter in our work.
Once the soil specimen reaches the peak in effective stress
space (characterized by peaking of deviatoric stress), it
advances to flow liquefaction failure, assuming that the
same loading path is applied continuously. Hence, a nec-
essary condition for unstable flow liquefaction behavior
can be expressed as:
_q\0 ð1Þ
where _q is the deviatoric invariant of the stress rate tensor.
In case of stable behavior, the soil specimen may ini-
tially exhibit behavior reminiscent of a loose sand under
undrained triaxial compression. However, before the soil
specimen reaches the peak in effective stress space, it
undergoes a phenomenon called ‘phase transformation’
[10], whereby it starts exhibiting behavior reminiscent of a
dilative sand under undrained triaxial compression. This
phenomenon ostensibly provides stability, whereby the
pore water pressure buildup and strain softening are kept in
check.
In what follows, _r is the stress increment tensor and _� isthe strain increment tensor. We use subscripts a and r to
denote the axial and radial components, respectively. _p ¼ð _ra þ 2 _rrÞ=3 and _q ¼ ð _ra � _rrÞ are the volumetric and
deviatoric invariants of stress increment ( _r), respectively._�v ¼ ð _�a þ 2 _�rÞ, and _�s ¼ 2ð _�a � _�rÞ=3 are the volumetric
and deviatoric invariants of strain increment ( _�),respectively.
3 Flow liquefaction potential
In order to determine whether the behavior of a soil
specimen under proportional strain triaxial compression
will be stable or unstable, we define a flow liquefaction
potential L. For a soil to be susceptible to unstable flow
liquefaction behavior, we postulate that:
L[ 0 ð2Þ
Conversely, for stable soil behavior, we postulate that
L\0. The condition when L ¼ 0 will be discussed later.
We define the functional form of L as:
L ¼ b� bp ð3Þ
where b is the natural dilative tendency of the soil speci-
men and bp is the imposed dilatancy on the specimen
during proportional strain triaxial compression. Natural
dilative tendency may be defined as the volume change that
a soil specimen must undergo such that pore pressure does
not evolve. The natural dilative tendency of a soil specimen
can be determined from its behavior under fully drained
conditions. A soil that contracts during drained triaxial
compression has b[ 0, while a soil that dilates during
drained triaxial compression has b\0. On the other hand,
imposed dilatancy is the volume change imposed on a soil
specimen during a proportional strain triaxial test, which is
normally different from the natural dilative tendency and
leads to an evolution in pore pressure. Equation 3 may be
considered to be an alternate mathematical form of a liq-
uefaction potential defined in the past [7].
Mathematically, natural dilative tendency b can be
defined as [21]:
b ¼ _�v_�s
ð4Þ
where we have assumed elastic strain increments to be
negligible. We define imposed dilatancy bp as:
bp ¼_�pv_�ps
ð5Þ
where the superscript p denotes imposed proportional strain
triaxial compression. Note that for imposed dilatancy, we
are concerned with total strain increments.
We now take a closer look at drained and proportional
strain triaxial compression in order to understand why
L[ 0 makes a soil susceptible to flow liquefaction
instability.
3.1 Drained triaxial compression
Drainage of pore water ensures that pore pressures do not
evolve. It also implies that the granular assembly under-
goes changes in volume. Using the definition of b, volu-metric strain increment _�v can be expressed as a function of
shear strain increment _�s:
_�v ¼ b _�s ð6Þ
Using the definitions of _�v and _�s from Sect. 2, we can
obtain the radial strain increment _�r consistent with the
natural dilative tendency of the assembly, given an applied
axial strain increment _�a:
_�r ¼ a _�a ¼: _�dr ð7Þ
where a is function of natural dilative tendency b:
a ¼ 2b� 3
2bþ 6ð8Þ
Note that a\0. This is because soil has a positive Pois-
son’s ratio, implying that compressing the granular
assembly in the axial direction will make it expand or
stretch out in the radial direction. We have assumed the
Acta Geotechnica
123

usual geomechanics convention of compression being
positive.
3.2 Proportional strain triaxial compression
However, in a proportional strain triaxial compression test,
the volumetric strain increment _�v is constrained to be
proportional to the axial strain increment _�a. Equivalently,
we may say that given an applied axial strain increment _�a,the radial strain increment _�r is:
_�r ¼ ap _�a ¼: _�pr ð9Þ
where ap may or may not be constant. For simplicity, it is
often imposed as a constant. It may be noted that ap is
similar to R defined in the literature [5–8, 11]. Several
investigators have devised experimental programs whereby
for axisymmetric conditions prevalent in a triaxial test,
such strain paths can be imposed [3, 5, 19]. For a saturated
sample, volume changes imposed during such strain paths
can be associated with injection or extraction of water in
the soil sample [6], such that the drainage is incompatible
with that during a drained test, leading to pore pressure
variation. Such a test has also been referred to as a partially
drained test in the past [19].
In any case, the relation between ap and bp is same as the
relation between a and b (Eq. 8). Hence, by inverting Eq. 8,
the imposed dilatancy bp can be obtained as a function of ap:
bp ¼3ð1þ 2apÞ2ð1� apÞ
ð10Þ
The undrained test is a special case where ap ¼ �1=2,
yielding bp ¼ 0.
We are now in a position to understand how the flow
liquefaction potential L can help in evaluating flow liq-
uefaction susceptibility of a soil subjected to proportional
strain triaxial compression. Using Eq. 10, L can be
expressed as a function of a and ap:
L ¼ 9ða� apÞ2ð1� aÞð1� apÞ
ð11Þ
Note that a positive Poisson’s ratio implies a\0. In
addition, proportional strain triaxial compression tests are
conducted such that ap\0. Hence, the denominator in
Eq. 11 above is a positive quantity. This means that:
signðLÞ ¼ signða� apÞ ð12Þ
Equivalently, since both a and ap are negative,
signðLÞ ¼ signðjapj � jajÞ ð13Þ
For a soil to be susceptible to flow liquefaction during
proportional strain triaxial compression, we postulated that
L[ 0. This implies that given an axial strain increment _�a,
the radial strain increments for proportional _�pr and drained
_�dr triaxial compression are related as:
j _�pr j[ j _�dr j ð14Þ
where we have used Eqs. 7 and 9. Equation 14 implies that
the imposed proportional radial strain increment is more
expansive than the drained radial strain increment. Micro-
mechanically, this may be interpreted as soil grains pushing
outwards and spreading more intensely than the natural
dilative tendency. This increases the load on pore water,
causing pore water pressure to rise during proportional
strain triaxial compression, making the assembly suscep-
tible to flow liquefaction.
Conversely, for a soil to exhibit stable behavior during
proportional strain triaxial compression, we postulated that
L\0. This implies that given an axial strain increment _�a,
the radial strain increments for proportional ( _�pr ) and
drained ( _�dr ) triaxial compression are related as:
j _�pr j\j _�dr j ð15Þ
Equation 15 implies that the imposed proportional radial
strain increment is less expansive than the drained radial
strain increment. Micro-mechanically, this may be inter-
preted as soil grains pushing outwards less intensely than
the natural dilative tendency. The grains tend to coalesce
together, creating a pulling or suction effect on the pore
water that causes pore water pressure to fall during pro-
portional strain triaxial compression, making the assembly
stable. See Fig. 2 for a cartoon of the discrepancy in radial
strain increments for both L[ 0 and L\0.
3.3 Undrained triaxial compression
As we mentioned earlier, undrained triaxial compression is
a special case of proportional strain triaxial compression
where bp ¼ 0, implying L ¼ b. Hence, a soil that contractsduring drained triaxial compression (b[ 0) is susceptible
to flow liquefaction under undrained triaxial compression,
whereas a soil that dilates during drained triaxial com-
pression (b\0) exhibits stable behavior under undrained
triaxial compression.
3.4 Discussion
It is important to note that given the right conditions, a
loose soil that contracts during drained triaxial compres-
sion and liquefies under undrained triaxial compression
may be stable under proportional strain triaxial compres-
sion. Conversely, a dense soil that dilates during drained
triaxial compression and is stable under undrained triaxial
compression may liquefy under proportional strain triaxial
Acta Geotechnica
123
compression. Such loading conditions can occur in the field
when there are soil layers of different densities adjacent to
each other. Susceptibility to flow liquefaction instability is
determined not by the sign of b, but by the sign of L.Depending on the imposed bp, the sign of L can change.
Figure 3 shows how negative (or expansive) values of bpincrease L, while positive (or contractive) values of bpreduce L. It just so happens that during undrained triaxial
compression, since bp ¼ 0, the sign of b determines the
sign of L. Stable response of loose sands and unstable re-
sponse of dense sands under proportional strain triaxial
compression have been observed in experimental and
numerical studies in the past [3, 5–8, 11, 19]. Note that
L[ 0 signifies a potential to liquefy. It does not suffi-
ciently imply occurrence of flow liquefaction. Sustained
loading with L[ 0 is necessary for the soil to encounter
flow liquefaction instability. Finally, note that L ¼ 0
implies that the imposed dilatancy bp on the soil specimen
is equal to the natural dilative tendency b of the assembly.
If such a situation arises, the specimen will behave as if
under drained triaxial compression, and pore pressure will
not change.
4 Necessary precursor for onset of flowliquefaction instability
As mentioned in the introduction, the central objective of
this paper is to investigate the origins of flow liquefaction
instability. We do so by analyzing the phenomenon under
proportional strain triaxial compression. We discussed that
if L[ 0, then the imposed radial strain increment is more
expansive than the drained radial strain increment, which
has the effect of increasing the pore pressure. However, it
is well known that rise in pore pressure is necessary but not
sufficient to cause flow liquefaction instability. For
instance, in the case of a dense sand subjected to undrained
triaxial compression, pore pressure initially rises, but fol-
lowing phase transformation, L\0 and pore pressure falls.
To address this issue, we now analyze the stress evolution
during proportional strain triaxial compression and arrive
at a necessary precursor for the origin of flow liquefaction
instability. This provides further insight into the mechanics
of origin of flow liquefaction instability under proportional
strain triaxial compression. We first consider the special
case of an undrained triaxial compression test, for which
the onset of flow liquefaction instability (Eq. 1) can be
expressed as a function of total axial ( _ra) and radial stress
( _rr) increments, as well as effective axial ( _r0a) and radial
stress ( _r0r) increments:
_q\0 ) _ra � _rr\0 ) _r0a � _r0r\0 ð16Þ
Boundary condition imposes constant total radial stresses
( _rr ¼ 0). This implies:
σr = σr − θ ⇒ σr = −θ ð17Þ
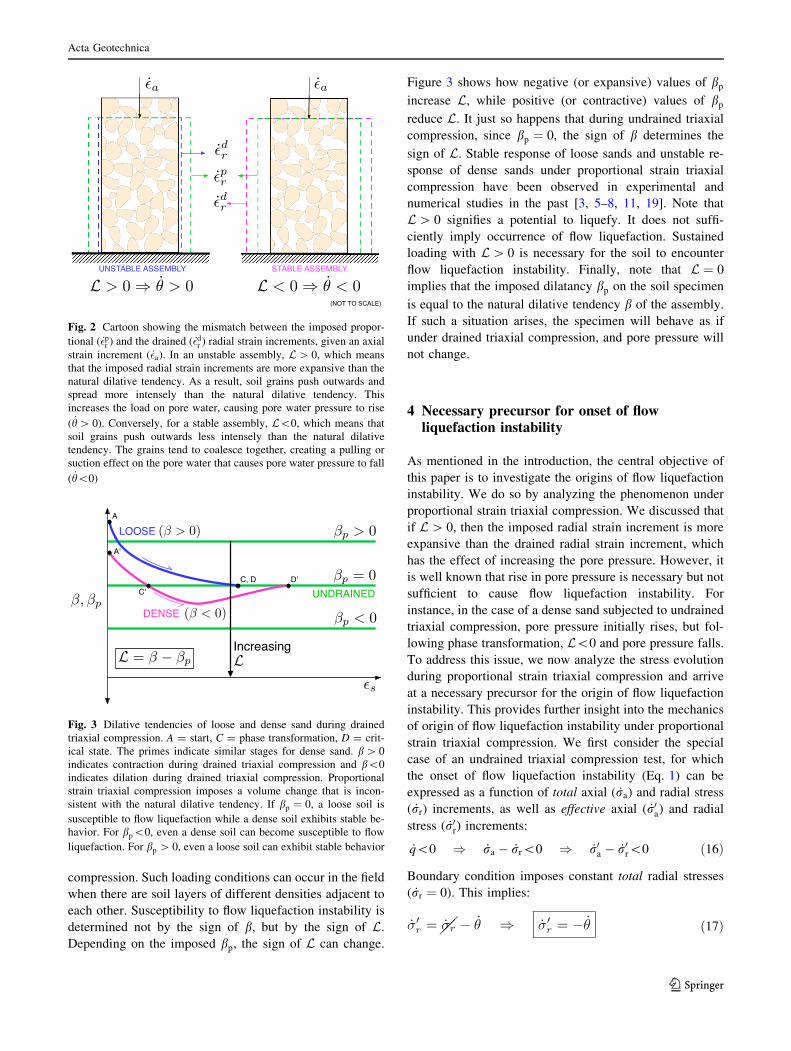
Fig. 2 Cartoon showing the mismatch between the imposed propor-
tional ( _�pr ) and the drained ( _�dr ) radial strain increments, given an axial
strain increment ( _�a). In an unstable assembly, L[ 0, which means
that the imposed radial strain increments are more expansive than the
natural dilative tendency. As a result, soil grains push outwards and
spread more intensely than the natural dilative tendency. This
increases the load on pore water, causing pore water pressure to rise
( _h[ 0). Conversely, for a stable assembly, L\0, which means that
soil grains push outwards less intensely than the natural dilative
tendency. The grains tend to coalesce together, creating a pulling or
suction effect on the pore water that causes pore water pressure to fall
( _h\0)
Fig. 3 Dilative tendencies of loose and dense sand during drained
triaxial compression. A = start, C = phase transformation, D = crit-
ical state. The primes indicate similar stages for dense sand. b[ 0
indicates contraction during drained triaxial compression and b\0
indicates dilation during drained triaxial compression. Proportional
strain triaxial compression imposes a volume change that is incon-
sistent with the natural dilative tendency. If bp ¼ 0, a loose soil is
susceptible to flow liquefaction while a dense soil exhibits stable be-
havior. For bp\0, even a dense soil can become susceptible to flow
liquefaction. For bp [ 0, even a loose soil can exhibit stable behavior
Acta Geotechnica
123
where _h is the pore pressure increment. The instability
criterion can now be expressed as:
_r0a þ _h\0 ð18Þ
Note that L[ 0 implies _h[ 0. Hence, we need _r0a\0 to
satisfy the above equation. We now arrive at a necessary
precursor for flow liquefaction instability during undrained
triaxial compression:
_r0a\0 ð19Þ
Equation 19 suggests that during an undrained triaxial
compression test, a soil specimen may encounter flow
liquefaction instability only if it is undergoing a reduction
in effective axial stress, hereby refereed to as axial soft-
ening. Prevalence of axial softening prior to onset of
instability has been documented in the past [7].
Remark 1 It must be noted that Eq. 19 by itself is nec-
essary but not a sufficient condition for flow liquefaction
instability under proportional strain triaxial compression. It
is possible for the assembly to be softening axially, yet still
be stable. As long as _q[ 0, an assembly will be
stable despite axial softening. Onset of axial softening can
be thought of as a warning sign. If the same loading is
applied continuously (sufficiency condition) despite axial
softening (necessity condition), then as long as L[ 0, pore
pressure will continue to rise and onset of instability is
inevitable. If loading conditions are changed such that
L\0, pore pressure will drop and the soil will exhibit
stable behavior. Also, note that in this context, axial soft-
ening should not be confused with the vanishing of hard-
ening modulus as in elasto-plasticity theory.
Remark 2 It must also be noted that not all soils are
capable of existing in liquefiable states. Clays, for instance,
are inherently non-liquefiable [12]. Axial softening in clays
should not be taken as a precursor to flow liquefaction
instability. Care must be taken to ensure that the soil in
question satisfies the compositional criteria [12] that make
it capable of existing in a liquefiable state.
4.1 Geometrical argument for necessity of _r0a\0
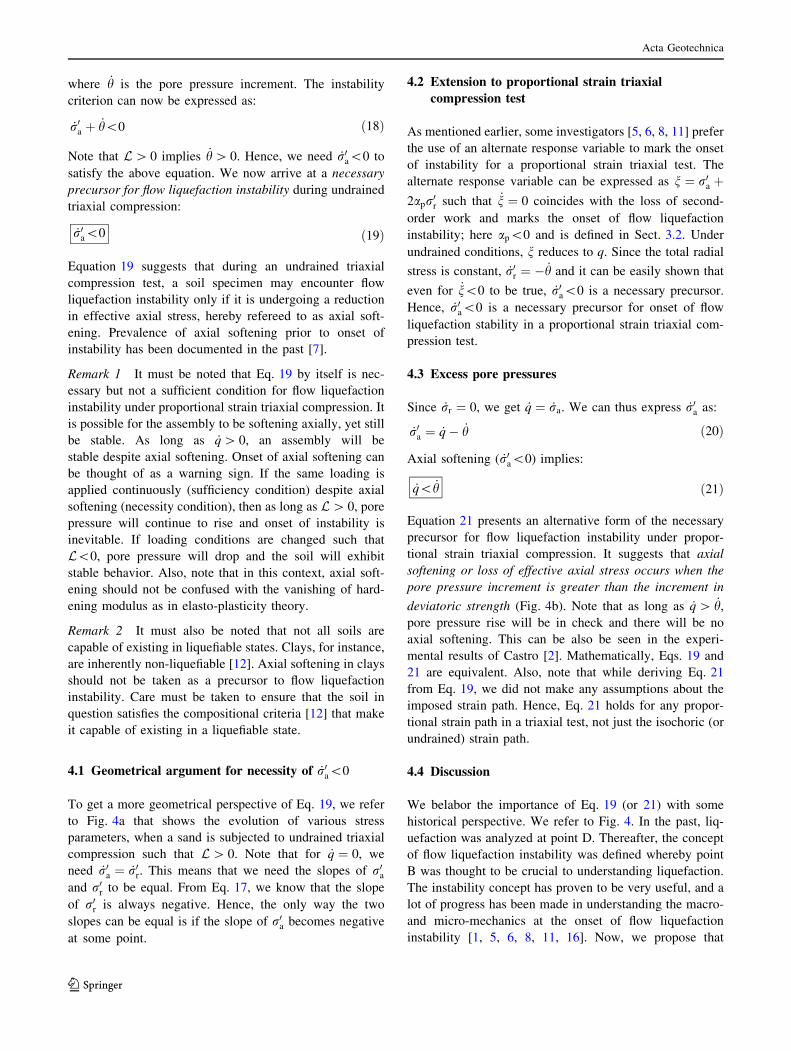
To get a more geometrical perspective of Eq. 19, we refer
to Fig. 4a that shows the evolution of various stress
parameters, when a sand is subjected to undrained triaxial
compression such that L[ 0. Note that for _q ¼ 0, we
need _r0a ¼ _r0r. This means that we need the slopes of r0aand r0r to be equal. From Eq. 17, we know that the slope
of r0r is always negative. Hence, the only way the two
slopes can be equal is if the slope of r0a becomes negative
at some point.
4.2 Extension to proportional strain triaxial
compression test
As mentioned earlier, some investigators [5, 6, 8, 11] prefer
the use of an alternate response variable to mark the onset
of instability for a proportional strain triaxial test. The
alternate response variable can be expressed as n ¼ r0a þ2apr0r such that _n ¼ 0 coincides with the loss of second-
order work and marks the onset of flow liquefaction
instability; here ap\0 and is defined in Sect. 3.2. Under
undrained conditions, n reduces to q. Since the total radial
stress is constant, _r0r ¼ � _h and it can be easily shown that
even for _n\0 to be true, _r0a\0 is a necessary precursor.
Hence, _r0a\0 is a necessary precursor for onset of flow
liquefaction stability in a proportional strain triaxial com-
pression test.
4.3 Excess pore pressures
Since _rr ¼ 0, we get _q ¼ _ra. We can thus express _r0a as:
_r0a ¼ _q� _h ð20Þ
Axial softening ( _r0a\0) implies:
_q\ _h ð21Þ
Equation 21 presents an alternative form of the necessary
precursor for flow liquefaction instability under propor-
tional strain triaxial compression. It suggests that axial
softening or loss of effective axial stress occurs when the
pore pressure increment is greater than the increment in
deviatoric strength (Fig. 4b). Note that as long as _q[ _h,pore pressure rise will be in check and there will be no
axial softening. This can be also be seen in the experi-
mental results of Castro [2]. Mathematically, Eqs. 19 and
21 are equivalent. Also, note that while deriving Eq. 21
from Eq. 19, we did not make any assumptions about the
imposed strain path. Hence, Eq. 21 holds for any propor-
tional strain path in a triaxial test, not just the isochoric (or
undrained) strain path.
4.4 Discussion
We belabor the importance of Eq. 19 (or 21) with some
historical perspective. We refer to Fig. 4. In the past, liq-
uefaction was analyzed at point D. Thereafter, the concept
of flow liquefaction instability was defined whereby point
B was thought to be crucial to understanding liquefaction.
The instability concept has proven to be very useful, and a
lot of progress has been made in understanding the macro-
and micro-mechanics at the onset of flow liquefaction
instability [1, 5, 6, 8, 11, 16]. Now, we propose that
Acta Geotechnica
123
significance should also be given to point P since attain-
ment of point P is a necessary precursor for getting to point
B, assuming that the same loading is applied continuously
(sufficiency condition). The concept of a precursor has
potential to further improve our understanding of origin of
flow liquefaction. For instance, Eq. 21 sheds some light on
the stable behavior of soil when L\0 (such as dilative
assemblies under undrained conditions). In such assem-
blies, pore pressures drop ( _h\0). Since the assembly
continues to strengthen, _q[ _h is always true and the nec-
essary precursor for onset of instability is not met.
Remark 3 Note that the proposed necessary precursor is
only applicable under idealized condition of proportional
strain triaxial compression. An understanding of the physics
underlying the origin of flow liquefaction instability under
idealized conditions provides us with motivation to look for
precursors to instability under different loading conditions,
such as soil subjected to constant deviator stress loading, or a
soil under more complex and general field conditions. Such a
concept could prove to be very useful whilemonitoring static
liquefaction in the field such as slope stability and landslides.
Remark 4 Although Fig. 4 assumes an isotropic initial
state of stress, the result should apply to anisotropic initial
state of stress as well, since no assumptions were made
about the initial stress state. However, in the case of an
anisotropic initial stress state, it is possible that the soil
may be susceptible to spontaneous liquefaction, whereby
there is a rapid drop in deviator stress at the onset of
undrained or proportional strain loading (e.g., [19]). In such
a case, it may not be possible to detect the aforementioned
precursors. Although Eqs. 19 and 21 will still be satisfied,
they may not be able to serve as precursors or warning
signs.
5 DEM simulations
The objective of this section is to present simulation results
to support our analysis. To that effect, we performed dis-
crete element method (DEM) simulations. DEM is a
numerical model that describes the mechanics of an
assembly of particles [4]. We will first briefly describe the
contact model and then describe our simulations.
5.1 Description of the contact model
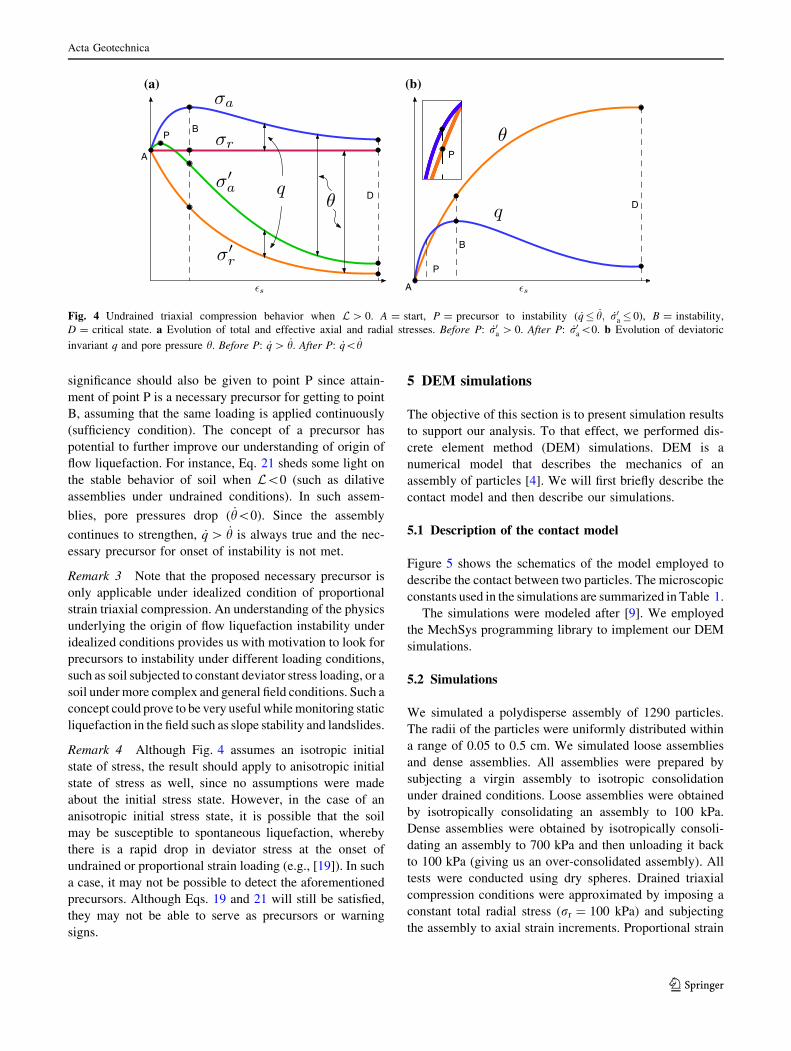
Figure 5 shows the schematics of the model employed to
describe the contact between two particles. The microscopic
constants used in the simulations are summarized in Table 1.
The simulations were modeled after [9]. We employed
the MechSys programming library to implement our DEM
simulations.
5.2 Simulations
We simulated a polydisperse assembly of 1290 particles.
The radii of the particles were uniformly distributed within
a range of 0.05 to 0.5 cm. We simulated loose assemblies
and dense assemblies. All assemblies were prepared by
subjecting a virgin assembly to isotropic consolidation
under drained conditions. Loose assemblies were obtained
by isotropically consolidating an assembly to 100 kPa.
Dense assemblies were obtained by isotropically consoli-
dating an assembly to 700 kPa and then unloading it back
to 100 kPa (giving us an over-consolidated assembly). All
tests were conducted using dry spheres. Drained triaxial
compression conditions were approximated by imposing a
constant total radial stress (rr ¼ 100 kPa) and subjecting
the assembly to axial strain increments. Proportional strain
εs
A
B
Dσ′a
σa
σr
σ′r
P
θq
εsA
B
Dq
θ
P
P
(a) (b)
Fig. 4 Undrained triaxial compression behavior when L[ 0. A = start, P = precursor to instability ( _q� _h; _r0a � 0), B = instability,
D = critical state. a Evolution of total and effective axial and radial stresses. Before P: _r0a [ 0. After P: _r0a\0. b Evolution of deviatoric
invariant q and pore pressure h. Before P: _q[ _h. After P: _q\ _h
Acta Geotechnica
123

triaxial compression conditions were simulated by sub-
jecting the assembly to an imposed dilatancy bp, whereinthe radial strain increment is proportional to the axial strain
increment. Equivalent pore pressures were inferred using
Eq. 17.
5.3 Results
Figure 6 shows the stress path of ‘loose’ and ‘dense’ soil
under drained and undrained triaxial compression condi-
tions. Undrained triaxial compression is a special case of
proportional strain triaxial compression where the imposed
dilatancy bp ¼ 0. As expected, under undrained triaxial
compression, loose sands exhibit unstable behavior,
whereas dense sands exhibit stable behavior.
In addition to undrained triaxial compression, we also
simulated proportional strain triaxial compression tests
with an imposed dilatancy of (1) bp ¼ 0:6 and (2)
bp ¼ �0:43. We verify that given the right conditions, a
loose soil that liquefies under undrained triaxial compres-
sion may be stable under proportional strain triaxial com-
pression. Conversely, a dense soil that is stable under
undrained triaxial compression may liquefy under propor-
tional strain triaxial compression. Figure 7 shows the vol-
ume change or natural dilative tendency b of the ‘loose’
and ‘dense’ assemblies under drained triaxial compression.
In addition, it also shows the imposed dilatancy bp during
proportional strain triaxial tests. Note that for bp ¼ 0:6, the
flow liquefaction potential L reduces for both loose and
dense assemblies. Conversely, for b ¼ �0:43, L increases
for both assemblies. The imposed dilatancy line forms a
datum from which one can determine L. If L[ 0, pore
pressures rise. If L\0, pore pressures drop. Figure 7 also
shows that the loose sample has a much higher suscepti-
bility for liquefaction, something well known from exper-
imental observations, but that can be clearly quantified by
Normal Spring Dashpot
No-tension Joint
Tangential Spring
Shear Slider
Rolling Spring
Rolling Slider
NORMAL CONTACT TANGENTIAL CONTACT ROLLING CONTACT
Fig. 5 DEM contact model
Table 1 Microscopic constants used in the simulations
Constant Description
Kn = 5000 kN/m Contact normal stiffness
Kt = 2500 kN/m Contact tangential stiffness
l = 0.3 Microscopic friction coefficient
Gn = 0.16 s-1 Normal viscous coefficient
Gt = 0.0 s-1 Tangential viscous coefficient
n = 0.12 Rolling resistance stiffness
g = 1.0 Plastic moment coefficient
Fig. 6 Evolution of stresses in the four sets of assemblies. UL
undrained loose, UD undrained dense. Note the occurrence of
instability and phase transformation in the UL and UD assemblies,
respectively
Acta Geotechnica
123
measuring the dilatancy inconsistency b� bp, which we
call the flow liquefaction potential L. L helps to visualize
how a dense sample can become susceptible to liquefaction
and how a loose sample can exhibit stable behavior.
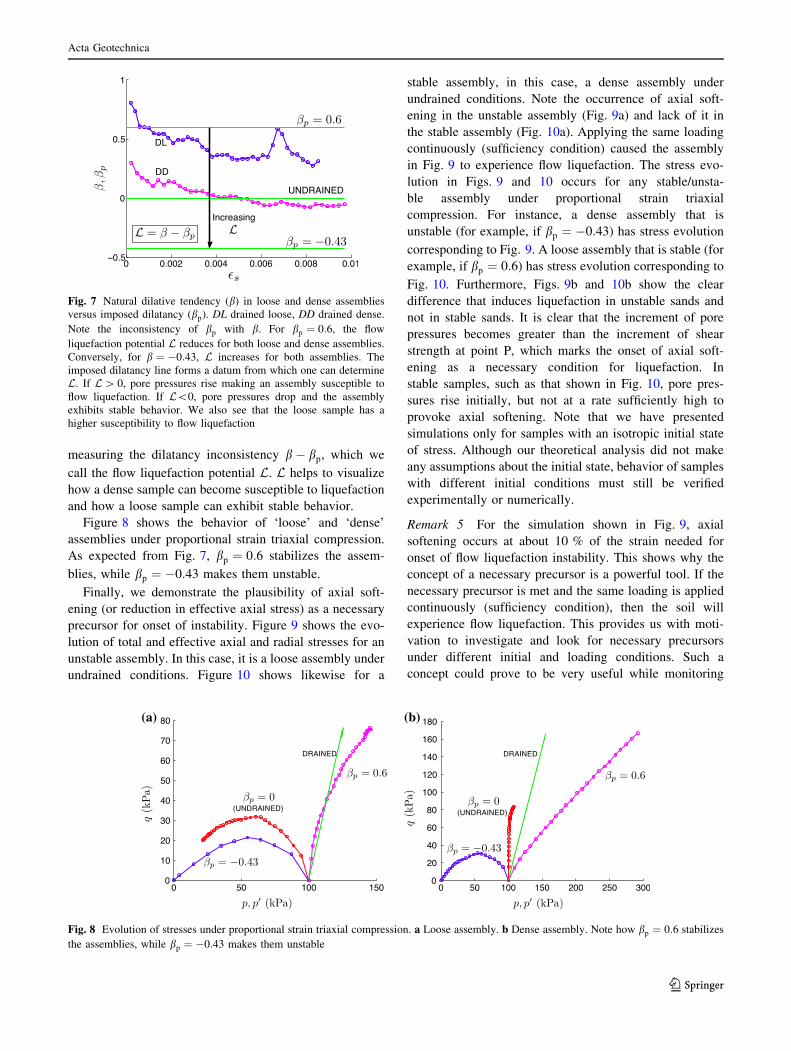
Figure 8 shows the behavior of ‘loose’ and ‘dense’
assemblies under proportional strain triaxial compression.
As expected from Fig. 7, bp ¼ 0:6 stabilizes the assem-
blies, while bp ¼ �0:43 makes them unstable.
Finally, we demonstrate the plausibility of axial soft-
ening (or reduction in effective axial stress) as a necessary
precursor for onset of instability. Figure 9 shows the evo-
lution of total and effective axial and radial stresses for an
unstable assembly. In this case, it is a loose assembly under
undrained conditions. Figure 10 shows likewise for a
stable assembly, in this case, a dense assembly under
undrained conditions. Note the occurrence of axial soft-
ening in the unstable assembly (Fig. 9a) and lack of it in
the stable assembly (Fig. 10a). Applying the same loading
continuously (sufficiency condition) caused the assembly
in Fig. 9 to experience flow liquefaction. The stress evo-
lution in Figs. 9 and 10 occurs for any stable/unsta-
ble assembly under proportional strain triaxial
compression. For instance, a dense assembly that is
unstable (for example, if bp ¼ �0:43) has stress evolution
corresponding to Fig. 9. A loose assembly that is stable (for
example, if bp ¼ 0:6) has stress evolution corresponding to
Fig. 10. Furthermore, Figs. 9b and 10b show the clear
difference that induces liquefaction in unstable sands and
not in stable sands. It is clear that the increment of pore
pressures becomes greater than the increment of shear
strength at point P, which marks the onset of axial soft-
ening as a necessary condition for liquefaction. In
stable samples, such as that shown in Fig. 10, pore pres-
sures rise initially, but not at a rate sufficiently high to
provoke axial softening. Note that we have presented
simulations only for samples with an isotropic initial state
of stress. Although our theoretical analysis did not make
any assumptions about the initial state, behavior of samples
with different initial conditions must still be verified
experimentally or numerically.
Remark 5 For the simulation shown in Fig. 9, axial
softening occurs at about 10 % of the strain needed for
onset of flow liquefaction instability. This shows why the
concept of a necessary precursor is a powerful tool. If the
necessary precursor is met and the same loading is applied
continuously (sufficiency condition), then the soil will
experience flow liquefaction. This provides us with moti-
vation to investigate and look for necessary precursors
under different initial and loading conditions. Such a
concept could prove to be very useful while monitoring
Fig. 7 Natural dilative tendency (b) in loose and dense assemblies
versus imposed dilatancy (bp). DL drained loose, DD drained dense.
Note the inconsistency of bp with b. For bp ¼ 0:6, the flow
liquefaction potential L reduces for both loose and dense assemblies.
Conversely, for b ¼ �0:43, L increases for both assemblies. The
imposed dilatancy line forms a datum from which one can determine
L. If L[ 0, pore pressures rise making an assembly susceptible to
flow liquefaction. If L\0, pore pressures drop and the assembly
exhibits stable behavior. We also see that the loose sample has a
higher susceptibility to flow liquefaction
(a) (b)
Fig. 8 Evolution of stresses under proportional strain triaxial compression. a Loose assembly. b Dense assembly. Note how bp ¼ 0:6 stabilizes
the assemblies, while bp ¼ �0:43 makes them unstable
Acta Geotechnica
123

static liquefaction in the field such as slope stability and
landslides. If a soil is deemed at risk (via some as yet
undetermined precursor for field conditions), it could be
monitored and steps be taken to mitigate the effects of the
instability.
6 Conclusions
We defined a new flow liquefaction potential L for deter-
mining flow liquefaction susceptibility during proportional
strain triaxial compression. The potential is a function of
inconsistency between the natural dilative tendency b and
the imposed dilatancy bp, i.e., L ¼ b� bp. If L[ 0, pore
pressures rise, whereas if L\0, pore pressures drop. An
analysis of L provided us with a micro-mechanical inter-
pretation of why given the right conditions, a loose soil that
contracts during drained triaxial compression and liquefies
under undrained triaxial compression may be stable under
proportional strain triaxial compression. Conversely, it also
provided us with an interpretation of why a dense soil that
dilates during drained triaxial compression and is
stable under undrained triaxial compression may liquefy
under proportional strain triaxial compression. The
undrained loose case is a special case of proportional strain
triaxial compression (where bp ¼ 0), under which a soil
can liquefy. Flow liquefaction criterion L provides an
elegant framework to visualize how a soil can liquefy
despite volume changes; this can happen during seismic
shaking in the field, or under static loading when there is
differential pore pressure generation between adjacent soil
layers with different densities. Unequal pore pressure
generation can lead to pore water being injected into cer-
tain layers and being extracted from other layers, causing
volume changes. Furthermore, since L[ 0 is necessary but
not sufficient to induce flow liquefaction instability, we
(a) (b)
Fig. 9 a Axial and radial effective and total stresses in an unstable assembly, in this case, loose assembly under undrained triaxial compression.
Note the occurrence of axial softening (see inset corresponding to point P) and subsequent instability (B). At instability, note that _r0a ¼ _r0r and
_ra ¼ _rr. b Evolution of deviatoric invariant q and pore pressure h. Before P: _q[ _h. After P: _q\ _h (see inset corresponding to point P)
(b)(a)
Fig. 10 a Axial and radial effective and total stresses in a stable assembly, in this case, dense assembly under undrained triaxial compression.
Note that there is no axial softening and the assembly continues to strengthen. b Evolution of deviatoric invariant q and pore pressure h. Note that_q[ _h at all times
Acta Geotechnica
123

analyzed the stress evolution of proportional strain triaxial
compression and investigated the mechanics of the test
leading up to flow liquefaction instability. We arrived at
reduction in effective axial stress (or axial softening) as a
necessary precursor for flow liquefaction instability. Axial
softening occurs when increment of pore pressure becomes
greater than the increment of shear strength. In fact, for the
simulation shown in Fig. 9, axial softening occurs at about
10 % of the strain needed for onset of flow liquefaction
instability. This shows why the concept of a necessary
precursor is a powerful tool. After attaining the precursor,
the same loading must be applied continuously (sufficiency
condition) for the soil to experience flow liquefaction. This
provides us with motivation to investigate and look for
necessary precursors under different initial and loading
conditions. Such a concept could prove to be very useful
while monitoring static liquefaction in the field such as
slope stability and landslides. However, if the initial stress
state of the soil is such that it is susceptible to spontaneous
liquefaction, then the concept of a necessary precursor has
limited applicability. Furthermore, care must be taken to
ensure that the soil in question satisfies the compositional
criteria needed to make it capable of existing in a liquefi-
able state. For instance, clays are inherently non-liquefiable
and will not exhibit liquefaction-like behavior even if they
satisfy the necessary precursors. Lastly, note that the term
‘softening’ in this context should not be confused with the
vanishing of hardening modulus as in elasto-plasticity
theory.
In sum, the current work has taken some important steps
toward understanding the mechanics of origin of flow liq-
uefaction instability under proportional strain triaxial
conditions. It complements the present understanding of
the macro- and micro-mechanics at the onset of flow liq-
uefaction instability and enables a deeper understanding of
the phenomenon.
Acknowledgments The authors would like to acknowledge the help
provided by S.A. Galindo-Torres in running the simulations.
References
1. Andrade JE (2009) A predictive framework for liquefaction
instability. Geotechnique 59(8):673–682
2. Castro G (1969) Liquefaction of sands, Harvard soil mechanics
series 81. Harvard University, Cambridge
3. Chu J, Lo SCR, Lee IK (1993) Instability of granular soils under
strain path testing. J Geotech Eng 119(5):874–892
4. Cundall PA, Strack ODL (1979) A discrete numerical model for
granular assemblies. Geotechnique 29(1):47–65
5. Daouadji A, Darve F, Al Gali H, Hicher PY, Laouafa F, Lignon
S, Nicot F, Nova R, Pinheiro M, Prunier F et al (2011) Diffuse
failure in geomaterials: experiments, theory and modelling. Int J
Numer Anal Methods Geomech 35(16):1731–1773
6. Daouadji A, Hicher PY, Jrad M, Sukumaran B, Belouettar S
(2013) Experimental and numerical investigation of diffuse
instability in granular materials using a microstructural model
under various loading paths. Geotechnique 63(5):368–381
7. Darve F, Pal O (1997) Liquefaction: a phenomenon specific to
granular media. In: Proceedings of the 3rd international confer-
ence on powders & grains, pp 69–73
8. Darve F, Servant G, Laouafa F, Khoa HDV (2004) Failure in
geomaterials: continuous and discrete analyses. Comput Methods
Appl Mech Eng 193(27):3057–3085
9. Galindo-Torres SA, Pedroso DM, Williams DJ, Muhlhaus HB
(2013) Strength of non-spherical particles with anisotropic
geometries under triaxial and shearing loading configurations.
Granul Matter 15(5):531–542
10. Ishihara K (1993) Liquefaction and flow failure during earth-
quakes. Geotechnique 43(3):351–451
11. Khoa HDV, Georgopoulos IO, Darve F, Laouafa F (2006) Dif-
fuse failure in geomaterials: experiments and modelling. Comput
Geotech 33(1):1–14
12. Kramer SL (1996) Geotechnical earthquake engineering. Prentice
Hall, Upper Saddle River
13. Lade PV (1992) Static instability and liquefaction of loose fine
sandy slopes. J Geotech Eng 118(1):51–71
14. Liu H, Qiao T (1984) Liquefaction potential of saturated sand
deposits underlying foundation of structure. In: Proceedings of
the 8th world conference on earthquake engineering, San Fran-
cisco, CA, pp 21–28
15. National Research Council (1985) Liquefaction of soils during
earthquakes. National Academy Press, Washington, DC
16. Ramos AM, Andrade JE, Lizcano A (2012) Modelling diffuse
instabilities in sands under drained conditions. Geotechnique
62(6):471–478
17. Seed HB (1987) Design problems in soil liquefaction. J Geotech
Eng 113(8):827–845
18. Vaid YP, Chern JC (1983) Effect of static shear on resistance to
liquefaction. Soils Found 23(1):47–60
19. Vaid YP, Eliadorani A (1998) Instability and liquefaction of
granular soils under undrained and partially drained states. Can
Geotech J 35(6):1053–1062
20. Whitman RV (1985) On liquefaction. In: Proceedings of the 11th
international conference on soil mechanics and foundation engi-
neering, San Francisco, CA, pp 12–16
21. Wood DM (1990) Soil behaviour and critical state soil mechan-
ics. Cambridge University Press, Cambridge
Acta Geotechnica
123