mechanical platelet activation potential in abdominal aortic aneurysms
TRANSCRIPT
Kirk B. HansenDepartment of Mechanical Engineering,
University of California,
5126 Etcheverry Hall,
Berkeley, CA 94720-1740
Amirhossein ArzaniDepartment of Mechanical Engineering,
University of California,
5126 Etcheverry Hall,
Berkeley, CA 94720-1740
Shawn C. Shadden1
Department of Mechanical Engineering,
University of California,
5126 Etcheverry Hall,
Berkeley, CA 94720-1740
e-mail: [email protected]
Mechanical PlateletActivation Potential inAbdominal Aortic AneurysmsIntraluminal thrombus (ILT) in abdominal aortic aneurysms (AAA) has potential implica-tions to aneurysm growth and rupture risk; yet, the mechanisms underlying its develop-ment remain poorly understood. Some researchers have proposed that ILT developmentmay be driven by biomechanical platelet activation within the AAA, followed by adhesionin regions of low wall shear stress. Studies have investigated wall shear stress levelswithin AAA, but platelet activation potential (AP) has not been quantified. In this study,patient-specific computational fluid dynamic (CFD) models were used to analyze stress-induced AP within AAA under rest and exercise flow conditions. The analysis was con-ducted using Lagrangian particle-based and Eulerian continuum-based approaches, andthe results were compared. Results indicated that biomechanical platelet activation isunlikely to play a significant role for the conditions considered. No consistent trend wasobserved in comparing rest and exercise conditions, but the functional dependence of APon stress magnitude and exposure time can have a large impact on absolute levels ofanticipated platelet AP. The Lagrangian method obtained higher peak AP values,although this difference was limited to a small percentage of particles that falls belowreported levels of physiologic background platelet activation. [DOI: 10.1115/1.4029580]
Keywords: abdominal aortic aneurysm, advection–diffusion-reaction, blood damage,computational fluid dynamics, Lagrangian particle tracking, platelet activation,thrombosis
1 Introduction
AAA disease is characterized by progressive, localized enlarge-ment of the abdominal aorta. It is often accompanied by thegrowth of ILT, and ILT formation has been linked to both the pro-gression [1] and risk of rupture [2] of AAA. The mechanisms ofILT formation, as well as the influence of ILT on AAA biome-chanics, however, are complex and poorly understood [3,4].
Experimental [5–9] and numerical [6,7,10–13] studies haveshown that AAA flow is often characterized by a core jet with asurrounding recirculation region. It has been hypothesized thatILT formation may be driven by stress-induced platelet activationand aggregation within the recirculation zone, followed by deposi-tion in regions of low wall shear stress [6,10,14]. While severalprevious studies have investigated AAA wall shear stress levels[10,11,14–16], platelet activation levels within patient-specificAAA have not been reported.
Experiments have shown that biomechanical platelet activationis a function of both the magnitude and duration of appliedstresses [17–19]. In a meta-analysis of previous experimentalstudies, Hellums et al. [20] plotted an activation locus that showeda power law relationship between threshold stress and exposuretime, and Giersiepen et al. [21] developed a model based on simi-lar results. These early experiments were conducted under con-stant shear conditions; application of the observed activationthresholds to more dynamic flow conditions experienced by plate-lets in vivo remains uncertain. Bluestein et al. [22] proposed thatplatelet activation level could be approximated by a linear stress-exposure time model. Later publications have used power lawmodels to better reflect the results of experimental studies
[23–26]. It has been shown that these models can give rise tomathematical and physical inconsistencies [27], although a morecomplex dose-based power law model has been developed toavoid these problems [28]. Recently, Soares et al. [29] and Sheriffet al. [30] have developed models that incorporate time history ofstress, current stress, and rate of change of stress, and fit the modelconstants to experimental data covering a range of shear stresswaveforms.
Previous studies of biomechanical platelet activation have typi-cally modeled platelets as either infinitesimal [22,23,25,31–33] orfinite-sized [26,34–38] particles. In either case, Lagrangian parti-cle tracking of the position and stress histories of individual plate-let surrogates in the flow is used. In the medium to large arteries,tens of millions to billions of platelets can pass through the arteryeach second [39], making direct tracking of physiological plateletcounts computationally infeasible in such domains. Instead, someresearchers have utilized an Eulerian framework, in which con-centrations of activated platelets are tracked as a continuum quan-tity [40–44]. To date, these Eulerian frameworks have beenapplied to the biochemical activation of platelets, and use of suchmethods to investigate biomechanical activation has been lessexplored.
This study seeks to better quantify the potential for biomechani-cal platelet activation in AAA under different physiologic states,as well as potential discrepancies between continuum and discreteparticle modeling of platelet transport. To this end, patient-specific CFD simulations were used to quantitatively investigatethe potential for biomechanical platelet activation in AAA. Plate-lets were modeled using both Lagrangian particle tracking andEulerian continuum approaches, and the results of these two meth-ods were compared. Since hemodynamic conditions in a patientcan vary considerably due to normal diurnal changes in physiol-ogy, and more specifically because lower-body exercise is a pro-posed therapy for patients suffering from AAA [45,46], both rest
1Corresponding author.Manuscript received July 31, 2014; final manuscript received January 8, 2015;
published online February 5, 2015. Assoc. Editor: Alison Marsden.
Journal of Biomechanical Engineering APRIL 2015, Vol. 137 / 041005-1Copyright VC 2015 by ASME
Downloaded From: http://biomechanical.asmedigitalcollection.asme.org/ on 02/05/2015 Terms of Use: http://asme.org/terms
and exercise hemodynamic conditions were considered. More-over, although exercise has been shown to reduce particle resi-dence time inside AAA [47], it also increases hemodynamic stresslevels [11]. Since platelet AP depends on both stress magnitudeand duration, and these two effects may counteract each other,numerical methods offer a powerful tool to investigate the neteffect of complex hemodynamics on AP.
2 Methods
This study considered five patients with small AAA(3 cm< dia< 5 cm). Image-based CFD methods were used toobtain velocity fields within the abdominal aorta under rest andexercise conditions. These data were then postprocessed usingLagrangian and Eulerian computational techniques to determineplatelet activation levels.
2.1 Image-Based CFD. The SIMVASCULAR software package1
was used to construct three-dimensional models of the abdominalaorta and surrounding arteries from magnetic resonance imaging(MRI) angiography (cf. Fig. 1). The resulting geometric modelswere used as computational domains for simulation of blood flowdynamics. Blood was modeled as an incompressible, Newtonianfluid ðq ¼ 1:06 gcm�3;l ¼ 0:04 PÞ by the Navier–Stokes equa-tions, which were solved using a stabilized finite element method[48,49].
The vessel wall was modeled as rigid with a no-slip boundarycondition. For rest, patient-specific inflow boundary conditionswere set by mapping two-dimensional phase-contrast (PC)-MRIdata to a Womersley profile at the supraceliac aorta. The inflowboundary condition, and corresponding PC-MRI measurement,was chosen well upstream of the aneurysm to ensure that flowfeatures developed in the aneurysm resulted from local vascularmorphology in order to mitigate errors resulting from specificationof the inflow profile. Three-element Windkessel models wereapplied at the outlets and tuned as described by Les et al. [11].Briefly, infrarenal PC-MRI data was used to tune resistances sothat physiological flow distribution between the aneurysm andsuprarenal arteries (celiac, superior mesenteric, and renal arteries)was achieved. Capacitances were tuned so that the pressure pulsein the model fit the measured brachial pressure pulse.
For the exercise condition, boundary conditions were modifiedas described by Les et al. [11]. Namely, the duration of diastolewas shortened to increase the heart rate by 50%, and outflow resis-tances were changed to impose a 444% increase in infrarenal flowand 21% decrease in upper body flow [50]. Capacitances for the
outflow boundary conditions were recalculated using the newwaveforms and physiological exercise blood pressures [51].
The models were meshed using linear tetrahedral elements witha maximum edge size of 500 lm according to the results of previ-ous mesh independence studies [11], resulting in final mesh sizesof Oð10MÞ elements. Simulations were run to convergence asdetermined by periodicity of the pressure waves. Only the fivecardiac cycles following convergence were retained for postpro-cessing. These five cycles were repeated periodically for the plate-let activation computations that spanned beyond five cycles.
2.2 Lagrangian Approach. The Lagrangian approach for themeasurement of platelet activation was based on the modeling ofindividual platelets as infinitesimal particles [52]. Particle trajec-tories were governed by
_xðtÞ ¼ uðx; tÞ (1)
where u was the fluid field velocity obtained from CFD.A domain of interest X was defined to encompass the entire
aneurysmal region (Fig. 1). Particles were released at the inletplane in a manner that ensured a uniform influx [53]. Namely, par-ticles were initially seeded uniformly across the inlet plane with200 lm spacing. Subsequently, the reseeding rate at each locationwas determined by the local flow rate in space and time as tomaintain a uniform influx concentration. In each case, several mil-lion particles were integrated resulting in particle concentrationsof approximately 150,000 per cm3 based on the results of a con-vergence study, which showed that 99.9th percentile AP levelschanged by less than 1% when particle concentration wasdoubled. To isolate the effect of platelet activation within theaneurysm, particles were tracked from their initial seeding loca-tions until they exited X.
The Lagrangian AP /L for each particle was based on a linearstress-exposure time model
/Lðx0; t0Þ ¼XN
i¼1
sðxðti; x0; t0Þ; tiÞDt (2)
where N is the total number of time steps the particle spends in X,Dt is the length of each time step used for integration of Eq. (1),and s is a scalar stress value defined below. Particles were contin-uously seeded and tracked until peak values of /L became peri-odic, at which point quantification of AP was performed asdescribed below.
Shadden and Hendababi [33] proposed a metric for platelet APbased on the Frobenius norm of the rate of deformation tensor
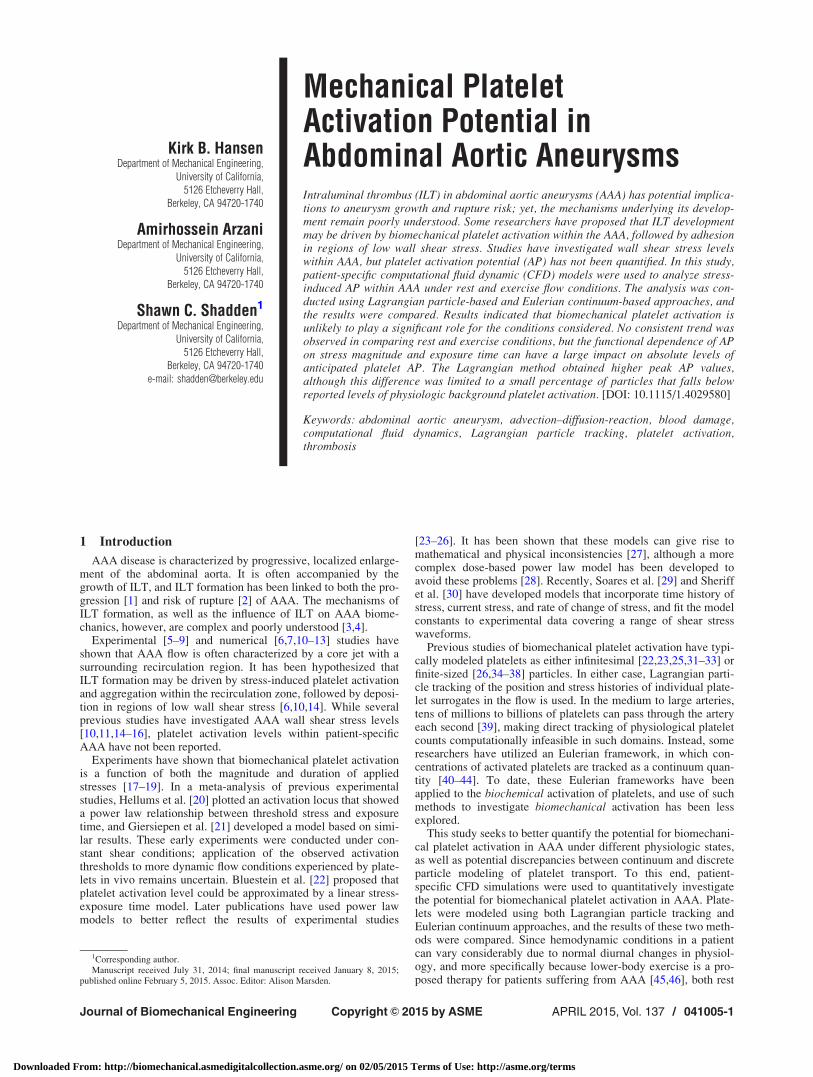
Fig. 1 Image-based computer models of the abdominal aorta and surrounding vasculature, with aneurysmal region ofinterest X highlighted in shade
1simtk.org/home/simvascular
041005-2 / Vol. 137, APRIL 2015 Transactions of the ASME
Downloaded From: http://biomechanical.asmedigitalcollection.asme.org/ on 02/05/2015 Terms of Use: http://asme.org/terms

kekF ¼ffiffiffiffiffiffiffiffiffiffiffiffiffiffitrðeTeÞ
p¼
ffiffiffiffiffiffiffiffiffiffiffiffiffiffiffiffiffiffiffiffiX3
i¼1
X3
j¼1
e2ij
vuut (3)
where e is the rate of deformation tensor, given by
eðx; tÞ ¼ 1
2ruðx; tÞ þ ruðx; tÞT� �
(4)
According to the Newtonian approximation, the deviatoric stresstensor in a fluid is given by s ¼ 2le, where l is the dynamic vis-cosity. Incorporating the Frobenius norm, and setting the value ofs in an arbitrary flow equal to the stress in simple shear, the scalarstress becomes
sðx; tÞ ¼ffiffiffi2p
lkeðx; tÞkF (5)
It can be shown that in an incompressible fluid this scalar stressvalue is equivalent to the von Mises stress-based metric used byother researchers in platelet AP studies [25,29,35,54].
Equation (2) does not provide a meaningful visualization of theresults, due to the dependence of / on initial location and time ofparticle release. It is desirable to have a measure of AP that candistinguish regions prone to higher levels of activation. To enablecalculation of such a measure within the Lagrangian framework,the aneurysmal domain X was divided into subdomains Xi corre-sponding to the cells used in the finite element analysis, such that
X ¼[NX
i¼1
Xi (6)
where NX is the total number of subdomains. Once convergenceof peak values was obtained, time-averaged AP was then calcu-lated over one cardiac cycle for each subdomain as an average ofthe contributions of all platelets visiting the subdomain
�/LðXiÞ ¼1
Nt
XNt
j¼1
Xk2S
1
jSj~/ tj; xk
0; tk0
� �(7)
where SðXi; tjÞ ¼ fkjxðtj; xk0; t
k0Þ 2 Xig is the set of particles in Xi
at time tj, |S| is the size of this set, Nt is the number of time stepsin the cycle, and ~/ðtj; xk
0; tk0Þ is the activation level for particle k
from time t0 until time tj.
2.3 Eulerian Approach. In the Eulerian approach, plateletactivation level /E was modeled as a continuum quantity using areaction–advection–diffusion equation
@/Eðx; tÞ@t
¼ �uðx; tÞ � r/Eðx; tÞ þ r � jr/Eðx; tÞ þ gðx; tÞ (8)
where j is platelet diffusivity and gðx; tÞ is the local plateletactivation rate. For the linear stress-exposure time model,gðx; tÞ ¼ sðx; tÞ. To isolate the effect of platelet activation withinthe aneurysm, the local activation rate was defined as
gðx; tÞ ¼ sðx; tÞ; x 2 X0; x 62 X
�(9)
The value of j for platelets depends not only on the Brownianmotion of the platelets, but also on the influence of shear rate andred blood cell interactions [40]. Even with upper-bounds estimatesfor j, the Peclet numbers in the regions of interest in this studywere on the order of 106–107, indicating diffusion has a negligiblerole. Indeed, preliminary studies confirmed that realistic levels forplatelet diffusion had no perceptible influence on results, so thevalue of j was set to zero for simplification.
Equation (8) was solved using a finite element method [55]over the same computational mesh as used for the CFD calcula-tions. A Dirichlet boundary condition of /E ¼ 0 was imposed atthe supraceliac aorta inlet. A Neumann zero flux boundary condi-tion was applied at all other surfaces. The homogenous Neumannboundary condition was also applied at the flow outlets, as it wasassumed that these boundaries were far enough away from theactivation region such that r/E was negligibly small. An initialcondition of /Eðx; 0Þ ¼ 0 was imposed throughout the domain.
To compare statistics between the Lagrangian and Eulerianmethods, nodal values from the Eulerian method were interpo-lated to cell centers, to provide cell-based field data
/EðXi; tÞ ¼ /Eðxci ; tÞ (10)
where xci is the center of subdomain Xi. Time-averaged AP was
then calculated over one cardiac cycle (once solution converged)as
�/EðXiÞ ¼1
Nt
XNt
j¼1
/EðXi; tjÞ (11)
so that both Eulerian (11) and Lagrangian (7) time-averaged APfields were defined at each finite element Xi.
2.4 Additional Models. A power law model for AP of theform
/pl ¼ðt
t0
sadn (12)
was applied to one patient to investigate dependence of the resultson the AP model. A value of a ¼ 2:28 (all units centimeter-gram-second (cgs)) was chosen to allow comparison to the Hellumslocus [20]. AP was computed in the Lagrangian method as
/pl;LðtÞ ¼XNt
i¼1
sðx; tiÞaDt (13)
in place of Eq. (2), and in the Eulerian method using
gpl;Eðx; tÞ ¼ sðx; tÞa (14)
in place of Eq. (9).Additionally, the Soares model [29] was implemented within
the Eulerian framework. The contribution of the stress rate termwas assumed to be negligibly small, so the reaction term for thismodel took the form
gS ¼ ð1� /sÞ Sr//s þ C1bb/
b�1b
s sab
� (15)
where gS represents the reaction term for /s, the fraction of acti-vated platelets, and / is the previously determined linear stress-exposure time AP. All other terms are constants, and wereassigned the values experimentally determined by Soares et al.[29] (all units cgs): Sr ¼ 1:5701� 10�7;C ¼ 1:4854� 10�7;a ¼ 1:4854, and b¼ 1.4401. This model requires an initial con-centration of activated platelets. The equilibrium backgroundlevel of activated platelets has been estimated at between 1% and20% [40]; a value of 5% was tested in this study. This value for/S was assigned as an initial condition throughout the computa-tional domain, as well as a Dirichlet boundary condition on thesupraceliac aorta inlet.
2.5 Statistical Methods. Volume-weighted probability densityand complementary cumulative distribution functions (CCDF) were
Journal of Biomechanical Engineering APRIL 2015, Vol. 137 / 041005-3
Downloaded From: http://biomechanical.asmedigitalcollection.asme.org/ on 02/05/2015 Terms of Use: http://asme.org/terms
calculated from the time-averaged AP results to facilitate a quanti-tative comparison between the Lagrangian and Eulerian methods.All reported p-values were obtained using two-sided pairedStudent’s t-tests.
3 Results
Table 1 lists the number of cardiac cycles to convergence ofpeak AP for each patient. In all cases, the Lagrangian methodtook more than 2.5�more cycles to converge than the Eulerian
method. The time to convergence for the rest condition was morethan twice as long as the exercise condition for all patients withthe exception of patient 1. Patient 5, rest condition, required morethan twice as long as any other case to reach convergence withboth the Lagrangian and Eulerian methods.
AP results using the linear stress-exposure time model are listedin Table 2. Peak values were 387% 6 43% (mean 6 SD) higherwhen using the Lagrangian method (p< 0.001), however themuch higher peak values in the Lagrangian method were limitedto relatively few platelets. For example, the 99th percentile valueswere only 25% 6 22% (p¼ 0.02) higher with the Lagrangianmethod. Moderate exercise caused a 3% 6 31% (p¼ 0.94)increase in peak AP based on the Lagrangian results, and a7% 6 27% (p¼ 0.76) increase based on the Eulerian results. Bothmethods obtained similar primary modes for all patients. Exclud-ing the results from patient 1, exercise condition, which had amode at zero, the Lagrangian method measured primary modes0% 6 6% (p¼ 0.92) higher than the Eulerian method.
The power law model was applied to patient 1 only. This modelshowed that exercise conditions increased peak AP from 540 to11998 using the Lagrangian method, and from 333 to 1103 usingthe Eulerian method (all units cgs). The 99th percentile Lagran-gian values were 111 and 1108 for rest and exercise, respectively.
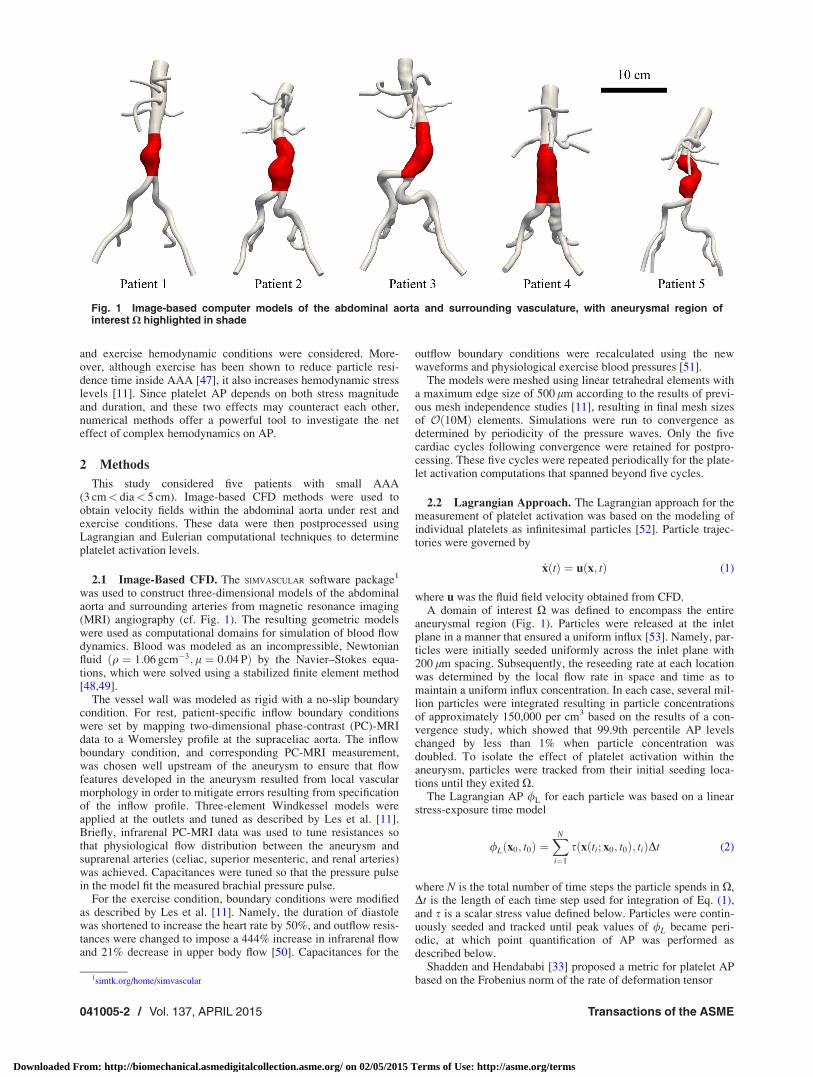
Examination of the PDF (Fig. 2) and CCDF (Fig. 3) for �/revealed relative agreement between the results of the two meth-ods with both the linear and power law models. Results were qual-itatively similar between rest and exercise conditions, except forpatient 1 who demonstrated a substantial increase in probability ofelevated AP levels during exercise versus rest, especially with thepower law model. It is also interesting to note that the PDF forpatient 5 was distinctly bimodal, perhaps corresponding to theapparent bilobed aneurysm.
Figures 4–9 show volume renderings of time-averaged APs.The two methods show similar topological features for allpatients, although peak values appear to be slightly higher with
Table 1 Number of cardiac cycles to convergence forLagrangian and Eulerian methods
Patient 1 2 3 4 5Condition R E R E R E R E R E
Cycles Lagrangian 16.3 13.2 22.0 9.1 20.2 10.1 50.4 15 21.1 8.8Eulerian 4.3 3.4 6.6 1.7 7.6 1.9 16.8 4.9 6.8 1.8
Table 2 Peak, 99th percentile, and time-averaged primarymode values for AP from linear stress-exposure time model,under rest (R) and exercise (E) conditions. All results are inunits of dyn s cm�2.
Patient 1 2 3 4 5Condition R E R E R E R E R E
Peak Lagrangian 34.8 52.2 35.8 38.9 34.7 35.5 50.0 33.8 48.4 41.2Eulerian 6.4 9.4 7.6 7.9 7.4 8.3 10.2 7.3 9.3 9.5
99% Lagrangian 8.5 13.3 9.6 10.5 8.8 8.8 7.6 8.6 14.5 13.1
Mode Lagrangian 2.0 0 2.9 3.6 1.9 2.0 1.6 1.6 5.1 4.7Eulerian 1.9 0 3.0 3.4 1.9 1.8 1.8 1.5 5.4 4.5
Fig. 2 PDF for time-averaged platelet AP. All results are based on linear stress-exposure time model except where noted, andin cgs units.
041005-4 / Vol. 137, APRIL 2015 Transactions of the ASME
Downloaded From: http://biomechanical.asmedigitalcollection.asme.org/ on 02/05/2015 Terms of Use: http://asme.org/terms

the Lagrangian method consistent with results in Table 2. Regionsof high AP seem to be quite coherent and localized in all patients.With the exception of patient 1, activation levels typicallyappeared higher on the distal half of the aneurysm.
4 Discussion
Herein we considered the stress-histories of particles passingthrough small to medium sized (3–5 cm dia.) AAA under bothsimulated rest and exercise flow conditions. These aneurysms
were mostly thrombus free, and were of a size where thrombusburden typically begins to develop [56]. The maximum value forplatelet AP in any patient, based on the linear stress-activationtime model, was 52 dyn s cm�2. While the Hellums et al. [20]locus does not show a linear relationship between threshold stressand exposure time, it can be used to establish a lower bound forAP threshold. At physiological levels of shear stress in aorticflows ð<100 dyn s cm�2Þ, the Hellums locus gives an AP thresh-old of at least 104 dyn s cm�2. This is orders of magnitude higher
Fig. 3 CCDF for time-averaged platelet AP. All results are based on linear stress-exposure time model except where noted,and in cgs units.
Fig. 5 Volume rendering of time-averaged AP ðdyn s cm�2Þ forpatient 2, based on linear stress-exposure time model
Fig. 4 Volume rendering of time-averaged AP ðdyn s cm�2Þ forpatient 1, based on linear stress-exposure time model
Journal of Biomechanical Engineering APRIL 2015, Vol. 137 / 041005-5
Downloaded From: http://biomechanical.asmedigitalcollection.asme.org/ on 02/05/2015 Terms of Use: http://asme.org/terms

than the values obtained in this study. Similar conclusions can bedrawn from the power law model. The peak value obtained usingthe power law model was 1.2� 105 (cgs units). This value can becompared to the Hellums locus, which gives a threshold of3� 106. Similarly, tests with the Soares model showed that levelsof newly activated platelets within the aneurysm were less than1% of background levels. These results indicate that—at least forthe specific AAA geometries and flow conditions considered inthis study—biomechanical platelet activation does not likely playa significant role in thrombus formation, and that other mecha-nisms such as biochemical activation should be considered.
Peak AP levels obtained using the Lagrangian method were sig-nificantly higher than their counterparts obtained using the Euler-ian method. However, less than 1% of particles were the cause ofthis specific discrepancy, and otherwise the two distributions ofactivation level were in good agreement. Convergence of AP val-ues was lower with the Lagrangian method, although this discrep-ancy was again limited to very few platelets, and the probabilitydistribution functions converged much more quickly.
Because of the complexity of the flow field in AAA, particletrajectories are chaotic in nature. It is expected that there may be asmall set of initial conditions whose trajectories have excessivelylong residence times, which is consistent with longer convergencetimes for the Lagrangian computations. Examples include thosewhose trajectory places them very close to the wall where velocityis near zero, or near invariant manifolds [57,58] that have accu-mulation points on the wall. Both cases are where deviatoric stresstends to be highest [33]. In theory, trajectories that have accumu-lation points on the wall can have infinite residence time, althoughthese sets are zero measure. However, trajectories initialized veryclose to such zero measure sets can have similar “singular” behav-ior. This is less pronounced in the Eulerian method because thecontinuum model inherently smooths subgrid scale behavior, aswell as adds numerical (and physical) diffusion. Likewise, thissmoothing effect in the Eulerian method provides a higher con-centration of platelets at the modal values; hence the concentra-tions at the modal values are consistently higher in the Eulerianmethod than Lagrangian method, as shown in Fig. 2.
Fig. 6 Volume rendering of time-averaged AP ðdyn s cm�2Þ forpatient 3, based on linear stress-exposure time model
Fig. 7 Volume rendering of time-averaged AP ðdyn s cm�2Þ forpatient 4, based on linear stress-exposure time model
Fig. 8 Volume rendering of time-averaged AP ðdyn s cm�2Þ forpatient 5, based on linear stress-exposure time model
Fig. 9 Volume rendering of time-averaged power law AP (cgsunits) for patient 1
041005-6 / Vol. 137, APRIL 2015 Transactions of the ASME
Downloaded From: http://biomechanical.asmedigitalcollection.asme.org/ on 02/05/2015 Terms of Use: http://asme.org/terms
While the Lagrangian method may better capture the accumu-lated stress histories of individual platelets, the validity of usingan Eulerian continuum method to analyze biomechanical plateletactivation depends on whether or not these extreme values areconsidered significant. Estimates from the literature for back-ground levels of platelet activation under normal conditions rangefrom 1% to 20% [40]. Since the main disparity between valuesobtained using the Lagrangian and Eulerian methods was limitedto approximately 1% of all platelets, and otherwise the two distri-butions of activation level were in good agreement, it can beargued that even if the Eulerian method underestimates the activa-tion level of a small number of platelets, this error is negligiblecompared to expected background levels of activated platelets.
Using the linear stress-exposure time model, peak activationlevels for exercise conditions were all within 50% of the valuesobtained under rest conditions. With the power law model, exer-cise levels were up to 20 times higher. This difference emphasizesthe dependance on model choice when stress duration and magni-tude are competing influences, as is typically the case in cardio-vascular flows. In nearly all regions of altered hemodynamicconditions, including aneurysms and stenoses, an increased flowrate will lead to higher shear stresses along with decreased resi-dence times. The effect of this competition between stress dura-tion and magnitude is complex and patient-specific, as indicatedby the lack of a consistent trend between the rest and exerciseresults with the linear model. The purpose of this study is not todetermine which AP model is “better,” but rather to determine ifeither model would predict mechanical activation in physiologi-cally realistic AAA flow conditions.
Analysis of AP in this work was limited to an isolated region ofinterest, i.e., the aneurysm. This may have led to an underestima-tion of actual integrated stress states on platelets inside the aneu-rysm, since platelets entering the aneurysm will have someprevious stress history. Nonetheless, the goal of this study was toinvestigate the potential role of biomechanical platelet activationwithin AAA. Therefore the exclusion of prior stress historyallowed for the isolation of these effects. Additionally, there isevidence that antithrombotic agents released from healthy endo-thelial tissue act to suppress platelet activation and adhesion out-side of the aneurysm [14,59].
Both the Lagrangian and Eulerian models in this study assumedthat blood was a continuum for purposes of deriving the velocityand rate of strain tensor fields. In reality, blood is a suspension ofapproximately 40% red blood cells. While the continuum approxi-mation may provide an adequate description of the blood flowdynamics at the macroscale, using this information to attempt toresolve the local stresses exerted on individual platelets may intro-duce some error to the model. At this scale, the stresses are likelyto include both viscous stresses from the plasma and local interac-tion forces with red blood cells. A continuum model is consistentwith most platelet activation experiments, which are typicallyconducted using platelet-rich plasma in the absence of red bloodcells. How these stresses correlate to those exerted on plateletsunder in vivo conditions in the presence of red blood cells is notwell understood.
Blood was approximated as a Newtonian fluid even thoughblood is known to have complex rheology. The differences andtradeoffs between using a Newtonian versus non-Newtonianmodel in large artery flow simulations have been considered inseveral prior studies, and reviewed in Ref. [60]. We have testednon-Newtonian models in prior AAA flow modeling studies andhave found that differences in the velocity field resulting fromcommonly employed rheological models are minor compared todifferences in the velocity field resulting from inter-patientvariation in aneurysm shape, volumetric flow, or heart rate. Thesedifferences have all been considered herein. Moreover, the resultsindicate that the accumulated stress histories were orders ofmagnitude lower than those generally expected to induce plateletactivation. This finding is unlikely to change due to physiologicvariations in rheology.
Particles were seeded uniformly across the inlet plane in theLagrangian method. There is evidence that platelets congregatetoward the walls of smaller blood vessels. In larger vessels, how-ever, these effects are expected to be minimal [61] because theflow is complex and highly three-dimensional. In any case, thelevels of AP in this study were orders of magnitude lower than theexpected thresholds, and it is unlikely that the seeding distributionwill affect this conclusion.
Acknowledgment
This work was supported by the NIH National Heart Lung andBlood Institute (Grant No. HL108272) and the National ScienceFoundation (Grant No. 1354541).
References[1] Wolf, Y. G., Thomas, W. S., Brennan, F. J., Goff, W. G., Sise, M. J., and
Bernstein, E. F., 1994, “Computed Tomography Scanning Findings AssociatedWith Rapid Expansion of Abdominal Aortic Aneurysms,” J. Vasc. Surg., 20(4),pp. 529–538.
[2] Stenbaek, J., Kalin, B., and Swedenborg, J., 2000, “Growth of Thrombus Maybe a Better Predictor of Rupture Than Diameter in Patients With AbdominalAortic Aneurysms,” Eur. J. Vasc. Endovasc. Surg., 20(5), pp. 466–469.
[3] Raut, S. S., Chandra, S., Shum, J., and Finol, E. A., 2013, “The Role of Geo-metric and Biomechanical Factors in Abdominal Aortic Aneurysm RuptureRisk Assessment,” Ann. Biomed. Eng., 41(7), pp. 1459–1477.
[4] Wilson, J. S., Virag, L., Di Achille, P., Karsaj, I., and Humphrey, J. D., 2013,“Biochemomechanics of Intraluminal Thrombus in Abdominal AorticAneurysms,” ASME J. Biomech. Eng., 135(2), p. 021011.
[5] Asbury, C. L., Ruberti, J. W., Bluth, E. I., and Peattie, R. A., 1995,“Experimental Investigation of Steady Flow in Rigid Models of AbdominalAortic Aneurysms,” Ann. Biomed. Eng., 23(1), pp. 29–39.
[6] Bluestein, D., Dewanjee, M. K., Niu, L., and Schoephoerster, R. T., 1996,“Steady Flow in an Aneurysm Model: Correlation Between Fluid Dynamicsand Blood Platelet Deposition,” ASME J. Biomech. Eng., 118(3), pp. 280–286.
[7] Egelhoff, C. J., Budwig, R. S., Elger, D. F., Khraishi, T. A., and Johansen,K. H., 1999, “Model Studies of the Flow in Abdominal Aortic Aneurysms Dur-ing Resting and Exercise Conditions,” J. Biomech., 32(12), pp. 1319–1329.
[8] Salsac, A. V., Sparks, S. R., and Lasheras, J. C., 2004, “HemodynamicChanges Occurring During the Progressive Enlargement of Abdominal AorticAneurysms,” Ann. Vasc. Surg., 18(1), pp. 14–21.
[9] Stamatopoulos, C., Mathioulakis, D. S., Papaharilaou, Y., and Katsamouris, A.,2011, “Experimental Unsteady Flow Study in a Patient-Specific AbdominalAortic Aneurysm Model,” Exp. Fluids, 50(6), pp. 1695–1709.
[10] Biasetti, J., Gasser, T. C., Auer, M., Hedin, U., and Labruto, F., 2009,“Hemodynamics of the Normal Aorta Compared to Fusiform and SaccularAbdominal Aortic Aneurysms With Emphasis on a Potential Thrombus Forma-tion Mechanism,” Ann. Biomed. Eng., 38(2), pp. 380–390.
[11] Les, A. S., Shadden, S. C., Figueroa, C. A., Park, J. M., Tedesco, M. M.,Herfkens, R. J., Dalman, R. L., and Taylor, C. A., 2010, “Quantification ofHemodynamics in Abdominal Aortic Aneurysms During Rest and ExerciseUsing Magnetic Resonance Imaging and Computational Fluid Dynamics,” Ann.Biomed. Eng., 38(4), pp. 1288–1313.
[12] Arzani, A., and Shadden, S. C., 2012, “Characterization of the Transport Topol-ogy in Patient-Specific Abdominal Aortic Aneurysm Models,” Phys. Fluids,24(8), p. 081901.
[13] Arzani, A., Les, A. S., Dalman, R. L., and Shadden, S. C., 2014, “Effect ofExercise on Patient Specific Abdominal Aortic Aneurysm Flow Topology andMixing,” Int. J. Numer. Methods Biomed. Eng., 30(2), pp. 280–295.
[14] Biasetti, J., Hussain, F., and Gasser, T. C., 2011, “Blood Flow and CoherentVortices in the Normal and Aneurysmatic Aortas: A Fluid Dynamical Approachto Intra-Luminal Thrombus Formation,” J. R. Soc. Interface, 8(63),pp. 1449–1461.
[15] Basciano, C., Kleinstreuer, C., Hyun, S., and Finol, E. A., 2011, “A RelationBetween Near-Wall Particle-Hemodynamics and Onset of Thrombus Formationin Abdominal Aortic Aneurysms,” Ann. Biomed. Eng., 39(7), pp. 2010–2026.
[16] Arzani, A., Suh, G., Dalman, R. L., and Shadden, S. C., 2014, “A LongitudinalComparison of Hemodynamics and Intraluminal Thrombus Deposition inAbdominal Aortic Aneurysms,” Am. J. Physiol., 307(12), pp. H1786–H1795.
[17] Brown, C. H., III, Lemuth, R. F., Hellums, J. D., Leverett, L. B., and Alfrey,C. P., 1975, “Response of Human Platelets to Shear Stress,” Trans. Am. Soc.Artif. Intern. Organs, 21(1), pp. 35–39.
[18] Ramstack, J. M., Zuckerman, L., and Mockros, L. F., 1979, “Shear-InducedActivation of Platelets,” J. Biomech., 12(2), pp. 113–125.
[19] Wurzinger, L. J., Opitz, R., Blasberg, P., and Schmid-Schonbein, H., 1985,“Platelet and Coagulation Parameters Following Millisecond Exposure toLaminar Shear Stress,” Thromb. Haemostasis, 54(2), pp. 381–386.
[20] Hellums, J. D., Peterson, D. M., Stathopoulos, N. A., Moake, J. L., and Giorgio,T. D., 1987, “Studies on the Mechanisms of Shear-Induced Platelet Activation,”Cerebral Ischemia and Hemorheology, Springer, Berlin, Heidelburg, Germany,pp. 80–89.
Journal of Biomechanical Engineering APRIL 2015, Vol. 137 / 041005-7
Downloaded From: http://biomechanical.asmedigitalcollection.asme.org/ on 02/05/2015 Terms of Use: http://asme.org/terms
[21] Giersiepen, M., Wurzinger, L. J., Opitz, R., and Reul, H., 1990, “Estimation ofShear Stress-Related Blood Damage in Heart Valve Prostheses—In VitroComparison of 25 Aortic Valves,” Int. J. Artif. Organs, 13(5), pp. 300–306.
[22] Bluestein, D., Niu, L., Schoephoerster, R. T., and Dewanjee, M. K., 1997,“Fluid Mechanics of Arterial Stenosis: Relationship to the Development ofMural Thrombus,” Ann. Biomed. Eng., 25(2), pp. 344–356.
[23] Einav, S., and Bluestein, D., 2004, “Dynamics of Blood Flow andPlatelet Transport in Pathological Vessels,” Ann. N. Y. Acad. Sci., 1015(1),pp. 351–366.
[24] Nobili, M., Sheriff, J., Morbiducci, U., Redaelli, A., and Bluestein, D.,2008, “Platelet Activation Due to Hemodynamic Shear Stresses: Damage Accu-mulation Model and Comparison to In Vitro Measurements,” ASAIO J., 54(1),pp. 64–72.
[25] Wu, J., Paden, B. E., Borovetz, H. S., and Antaki, J. F., 2009, “ComputationalFluid Dynamics Analysis of Blade Tip Clearances on Hemodynamic Perform-ance and Blood Damage in a Centrifugal Ventricular Assist Device,” Artif.Organs, 34(5), pp. 402–411.
[26] Wu, J., Yun, B. M., Fallon, A. M., Hanson, S. R., Aidun, C. K., andYoganathan, A. P., 2010, “Numerical Investigation of the Effects of ChannelGeometry on Platelet Activation and Blood Damage,” Ann. Biomed. Eng.,39(2), pp. 897–910.
[27] Grigioni, M., Daniele, C., Morbiducci, U., D’Avenio, G., Di Benedetto, G., andBarbaro, V., 2004, “The Power-Law Mathematical Model for Blood DamagePrediction: Analytical Developments and Physical Inconsistencies,” Artif.Organs, 28(5), pp. 467–475.
[28] Grigioni, M., Morbiducci, U., D’Avenio, G., Benedetto, G. D., and Gaudio,C. D., 2005, “A Novel Formulation for Blood Trauma Prediction by a ModifiedPower-Law Mathematical Model,” Biomech. Modell. Mechanobiol., 4(4), pp.249–260.
[29] Soares, J. S., Sheriff, J., and Bluestein, D., 2013, “A Novel Mathematical Modelof Activation and Sensitization of Platelets Subjected to Dynamic Stress Histor-ies,” Biomech. Modell. Mechanobiol., 12(6), pp. 1127–1141.
[30] Sheriff, J., Soares, J. S., Xenos, M., Jesty, J., and Bluestein, D., 2013,“Evaluation of Shear-Induced Platelet Activation Models Under Constant andDynamic Shear Stress Loading Conditions Relevant to Devices,” Ann. Biomed.Eng., 41(6), pp. 1279–1296.
[31] Song, X., Throckmorton, A. L., Wood, H. G., Antaki, J. F., and Olsen, D. B.,2003, “Computational Fluid Dynamics Prediction of Blood Damage in aCentrifugal Pump,” Artif. Organs, 27(10), pp. 938–941.
[32] Tambasco, M., and Steinman, D. A., 2003, “Path-Dependent Hemodynamicsof the Stenosed Carotid Bifurcation,” Ann. Biomed. Eng., 31(9), pp.1054–1065.
[33] Shadden, S. C., and Hendabadi, S., 2012, “Potential Fluid MechanicPathways of Platelet Activation,” Biomech. Modell. Mechanobiol., 12(3),pp. 467–474.
[34] Chan, W. K., Wong, Y. W., Ding, Y., Chua, L. P., and Yu, S. C. M., 2002,“Numerical Investigation of the Effect of Blade Geometry on Blood Trauma ina Centrifugal Blood Pump,” Artif. Organs, 26(9), pp. 785–793.
[35] Alemu, Y., and Bluestein, D., 2007, “Flow-Induced Platelet Activation andDamage Accumulation in a Mechanical Heart Valve: Numerical Studies,” Artif.Organs, 31(9), pp. 677–688.
[36] Dumont, K., Vierendeels, J., Kaminsky, R., van Nooten, G., Verdonck, P., andBluestein, D., 2007, “Comparison of the Hemodynamic and ThrombogenicPerformance of Two Bileaflet Mechanical Heart Valves Using a CFD/FSI Mod-el,” ASME J. Biomech. Eng., 129(4), pp. 558–565.
[37] Yun, B. M., Wu, J., Simon, H. A., Arjunon, S., Sotiropoulos, F., Aidun, C. K.,and Yoganathan, A. P., 2012, “A Numerical Investigation of Blood Damagein the Hinge Area of Aortic Bileaflet Mechanical Heart Valves During theLeakage Phase,” Ann. Biomed. Eng., 40(7), pp. 1468–1485.
[38] Soares, J. S., Gao, C., Alemu, Y., Slepian, M., and Bluestein, D., 2013,“Simulation of Platelets Suspension Flowing Through a Stenosis Model Usinga Dissipative Particle Dynamics Approach,” Ann. Biomed. Eng., 41(11),pp. 2318–2333.
[39] Born, G. V. R., and Cross, M. J., 1963, “The Aggregation of Blood Platelets,”J. Physiol., 168(1), pp. 178–195.
[40] Sorensen, E. N., Burgreen, G. W., Wagner, W. R., and Antaki, J. F., 1999,“Computational Simulation of Platelet Deposition and Activation: I. ModelDevelopment and Properties,” Ann. Biomed. Eng., 27(4), pp. 436–448.
[41] Sorensen, E. N., Burgreen, G. W., Wagner, W. R., and Antaki, J. F., 1999,“Computational Simulation of Platelet Deposition and Activation: II. Resultsfor Poiseuille Flow Over Collagen,” Ann. Biomed. Eng., 27(4), pp. 449–458.
[42] Anand, M., Rajagopal, K., and Rajagopal, K. R., 2003, “A Model IncorporatingSome of the Mechanical and Biochemical Factors Underlying Clot Formationand Dissolution in Flowing Blood,” J. Theor. Med., 5(3–4), pp. 183–218.
[43] Leiderman, K., and Fogelson, A. L., 2010, “Grow With the Flow: ASpatial–Temporal Model of Platelet Deposition and Blood Coagulation UnderFlow,” Math. Med. Biol., 28(1), pp. 47–84.
[44] Leiderman, K., and Fogelson, A. L., 2013, “The Influence of Hindered Trans-port on the Development of Platelet Thrombi Under Flow,” Bull. Math. Biol.,75(8), pp. 1255–1283.
[45] Dalman, R. L., Tedesco, M. M., Myers, J., and Taylor, C. A., 2006, “AAADisease: Mechanism, Stratification, and Treatment,” Ann. N. Y. Acad. Sci.,1085(1), pp. 92–109.
[46] Dua, M. M., and Dalman, R. L., 2010, “Hemodynamic Influences on Abdomi-nal Aortic Aneurysm Disease: Application of Biomechanics to Aneurysm Path-ophysiology,” Vasc. Pharmacol., 53(1–2), pp. 11–21.
[47] Suh, G., Les, A. S., Tenforde, A. S., Shadden, S. C., Spilker, R. L., Yeung, J. J.,Cheng, C. P., Herfkens, R. J., Dalman, R. L., and Taylor, C. A., 2011,“Hemodynamic Changes Quantified in Abdominal Aortic Aneurysms WithIncreasing Exercise Intensity Using MR Exercise Imaging and Image-BasedComputational Fluid Dynamics,” Ann. Biomed. Eng., 39(8), pp. 2186–2202.
[48] Taylor, C. A., Hughes, T. J., and Zarins, C. K., 1998, “Finite Element Modelingof Blood Flow in Arteries,” Comput. Methods Appl. Mech. Eng., 158(1–2),pp. 155–196.
[49] Jansen, K. E., Whiting, C. H., and Hulbert, G. M., 2000, “A Generalized-aMethod for Integrating the Filtered Navier–Stokes Equations With a StabilizedFinite Element Method,” Comput. Methods Appl. Mech. Eng., 190(3–4),pp. 305–319.
[50] Cheng, C. P., Herfkens, R. J., and Taylor, C. A., 2003, “Abdominal AorticHemodynamic Conditions in Healthy Subjects Aged 50–70 at Rest and DuringLower Limb Exercise: In Vivo Quantification Using MRI,” Atherosclerosis,168(1), pp. 323–331.
[51] Montain, S. J., Jilka, S. M., Ehsani, A. A., and Hagberg, J. M., 1988, “AlteredHemodynamics During Exercise in Older Essential Hypertensive Subjects,”Hypertension, 12(5), pp. 479–484.
[52] Shadden, S. C., and Arzani, A., 2015, “Lagrangian Postprocessing of Computa-tional Hemodynamics,” Ann. Biomed. Eng., 43(1), pp. 41–58.
[53] Lonyai, A., Dubin, A. M., Feinstein, J. A., Taylor, C. A., and Shadden, S. C.,2010, “New Insights Into Pacemaker Lead-Induced Venous Occlusion:Simulation-Based Investigation of Alterations in Venous Biomechanics,” Car-diovasc. Eng., 10(2), pp. 84–90.
[54] Apel, J., Paul, R., Klaus, S., Siess, T., and Reul, H., 2001, “Assessment ofHemolysis Related Quantities in a Microaxial Blood Pump by ComputationalFluid Dynamics,” Artif. Organs, 25(5), pp. 341–347.
[55] Esmaily-Moghadam, M., Hsia, T., and Marsden, A. L., 2013, “A Non-DiscreteMethod for Computation of Residence Time in Fluid Mechanics Simulations,”Phys. Fluids, 25(11), p. 110802.
[56] Behr-Rasmussen, C., Grondal, N., Bramsen, M., Thomsen, M., and Lindholt, J.,2014, “Mural Thrombus and the Progression of Abdominal Aortic Aneurysms:A Large Population-Based Prospective Cohort Study,” Eur. J. Vasc. Endovasc.Surg., 48(3), pp. 301–307.
[57] Shadden, S. C., and Taylor, C. A., 2008, “Characterization of Coherent Struc-tures in the Cardiovascular System,” Ann. Biomed. Eng., 36(7), pp. 1152–1162.
[58] Shadden, S. C., 2011, “Lagrangian Coherent Structures,” Transport and Mixingin Laminar Flows: From Microfluidics to Oceanic Currents, Wiley-VCH,Weinheim, Germany.
[59] Cohen, R. A., Shepherd, J. T., and Vanhoutte, P. M., 1983, “Inhibitory Role ofthe Endothelium to the Response of Isolated Coronary Arteries to Platelets,”Science, 221(4607), pp. 273–274.
[60] Steinman, D. A., 2012, “Assumptions in Modelling of Large ArteryHemodynamics,” Modeling of Physiological Flows, D. Ambrosi, A. Quarteroni,and G. Rozza, eds., Vol. 5, Springer, Milan, Italy, pp. 1–18.
[61] Biasetti, J., Spazzini, P. G., Hedin, U., and Gasser, T. C., 2014, “SynergyBetween Shear-Induced Migration and Secondary Flows on Red Blood CellsTransport in Arteries: Considerations on Oxygen Transport,” J. R. Soc. Inter-face, 12(104), p. 20140403.
041005-8 / Vol. 137, APRIL 2015 Transactions of the ASME
Downloaded From: http://biomechanical.asmedigitalcollection.asme.org/ on 02/05/2015 Terms of Use: http://asme.org/terms